# 7. Workspaces & Dashboards
## 🧭 Workspaces & Dashboards in OpenGate
In the previous steps, we’ve covered everything needed to collect data in OpenGate and make information from devices and assets available on the platform. We’ve provisioned entities, configured datastreams, and started receiving real-time data even adjusting the data using Connector Functions.
Now it’s time to shape that data so we can work with it effectively and build our IoT solution on top of OpenGate. To do this, we’ll use **Workspaces**, which allow you to visualize, organize and build your solution areas, and **Dashboards**, where you usually work to monitor, explore, and interact with entities data in real time.
- A **Workspace** is a container that organizes dashboards around a specific context — such as a location, a functionality, a project, or a team.
- A **Dashboard** is a visual canvas within a workspace, composed of customizable **Widgets** that display data from entities, datastreams, or assets and allows you to interact with your entities.
- **Widgets** are the building blocks of dashboards. OpenGate has a huge catalog that includes customizable tables, maps, charts, gauges, HMIs, and more — each designed to present data in a specific format.
> 📌 **Note**: Workspaces can be shared with other users in your organization. This allows administrators to create curated views and make them available to operators, analysts, or any users group.
---
## 🏗️ Creating a Workspace and Dashboard
Let's continue with our ongoing warehouse scenario. We’ve already provisioned sensors and collected data. Now, we’ll create a workspace and dashboard to visualize that information.
### 🗃️ Step 1: Create a Workspace
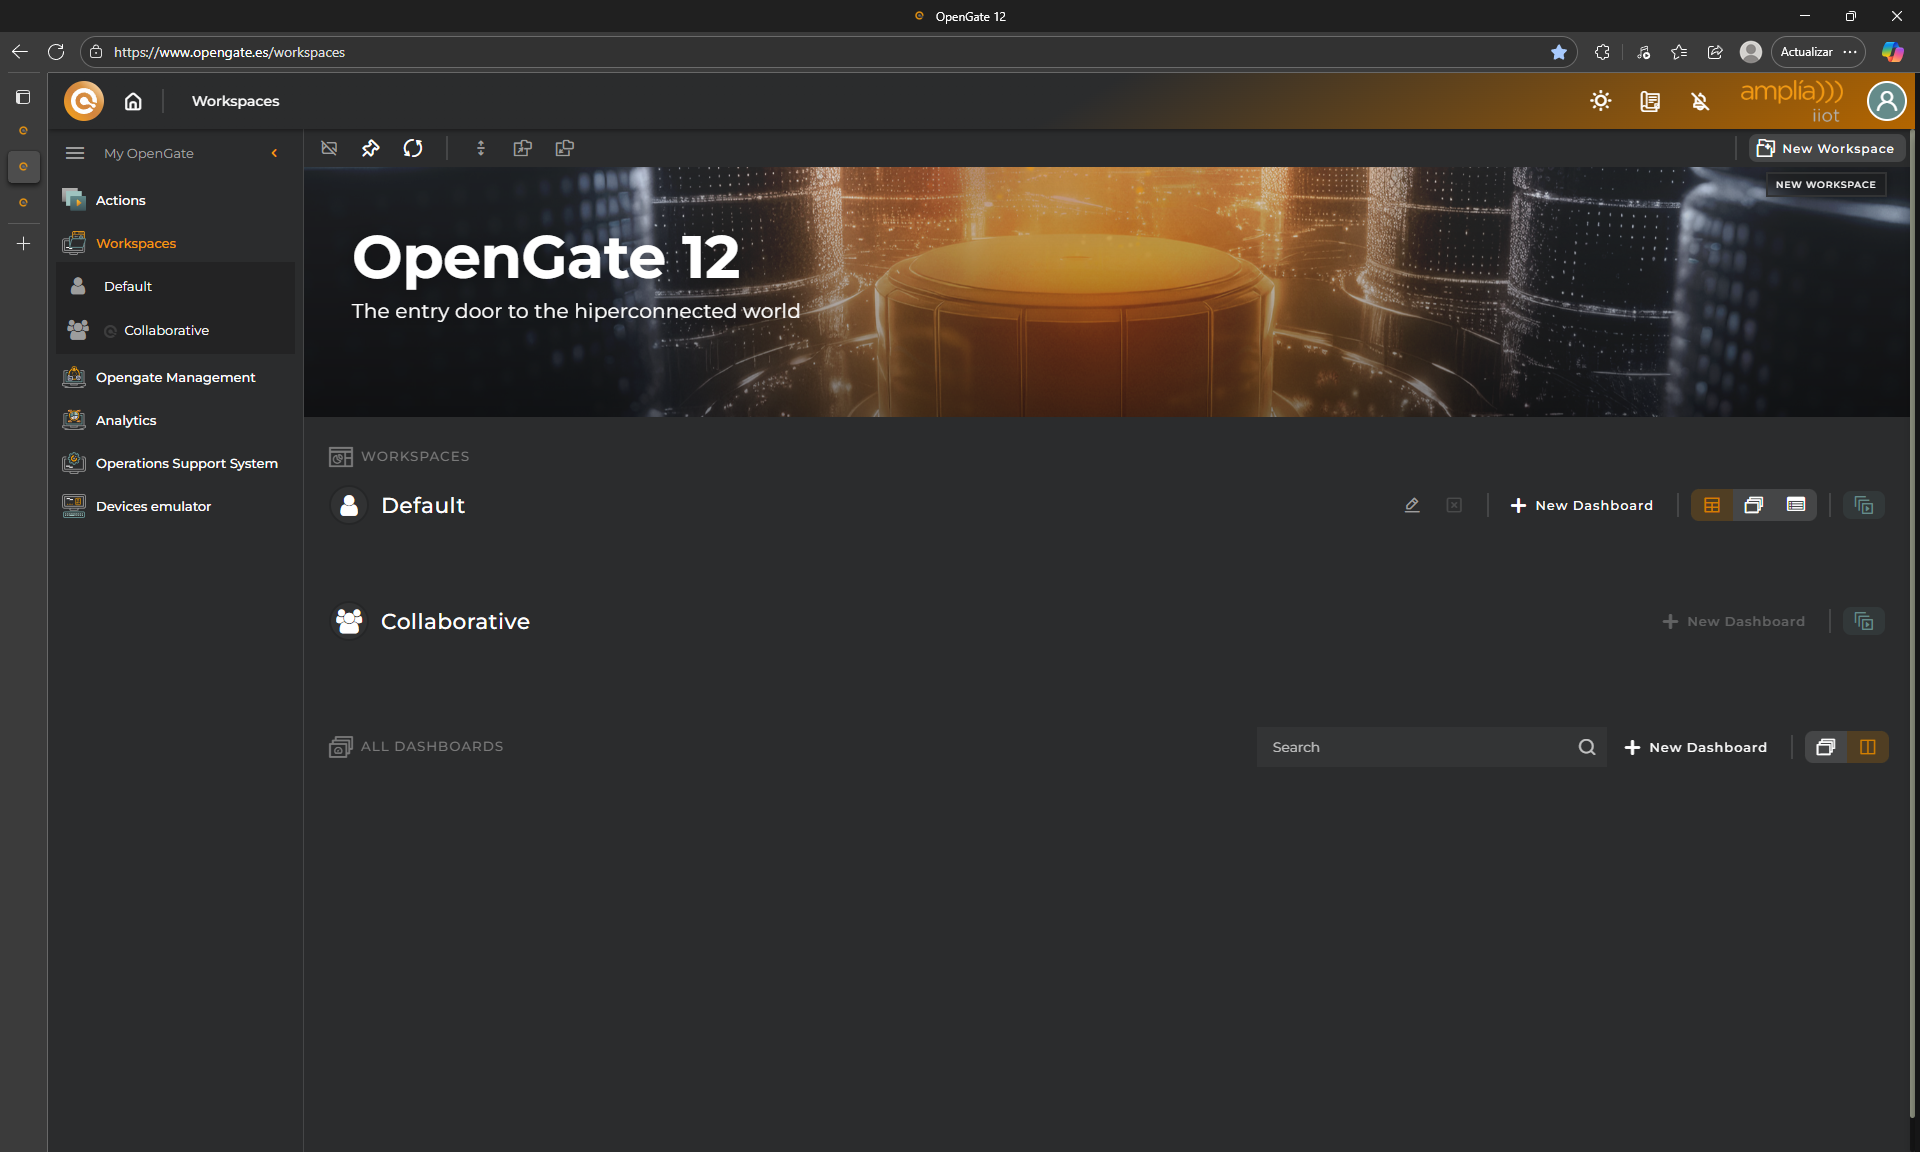
1. Go to **OpenGate Management > Workspaces**, you can open in new window
2. Click on **New Workspace**
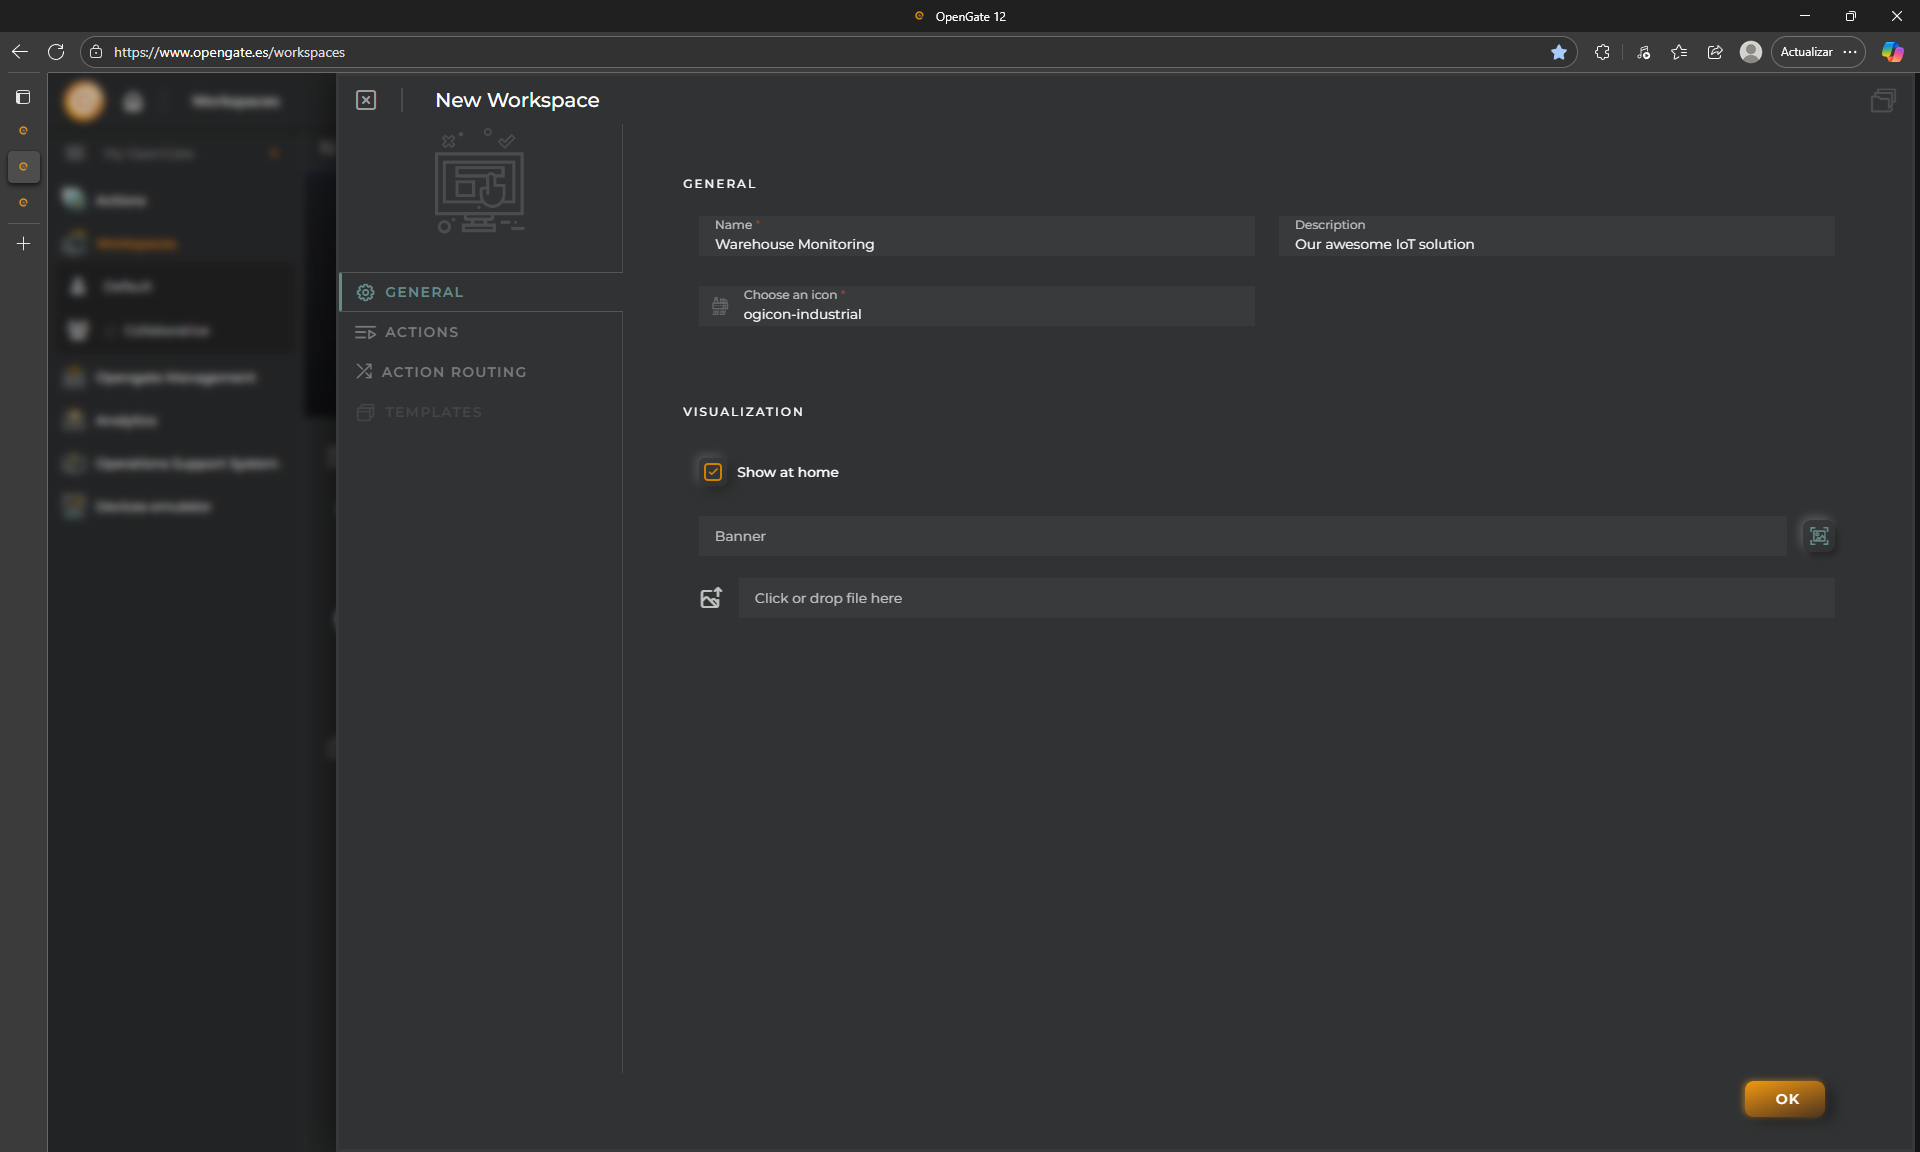
3. Now fill the information required and click on "**OK**":
- **Name**: Use `Warehouse Monitoring`
- **Description**: Enter something if you like, for example: `Our awesome IoT solution`
- **Choose an icon**: OpenGate has a huge predefined library, use `ogicon-industrial`
- **Visualization**: Check "Show at home" to be able to see this workspace on the home screen.
- **Banner**: It is possible to redefine the banner or background image, keep it blank for this tutorial
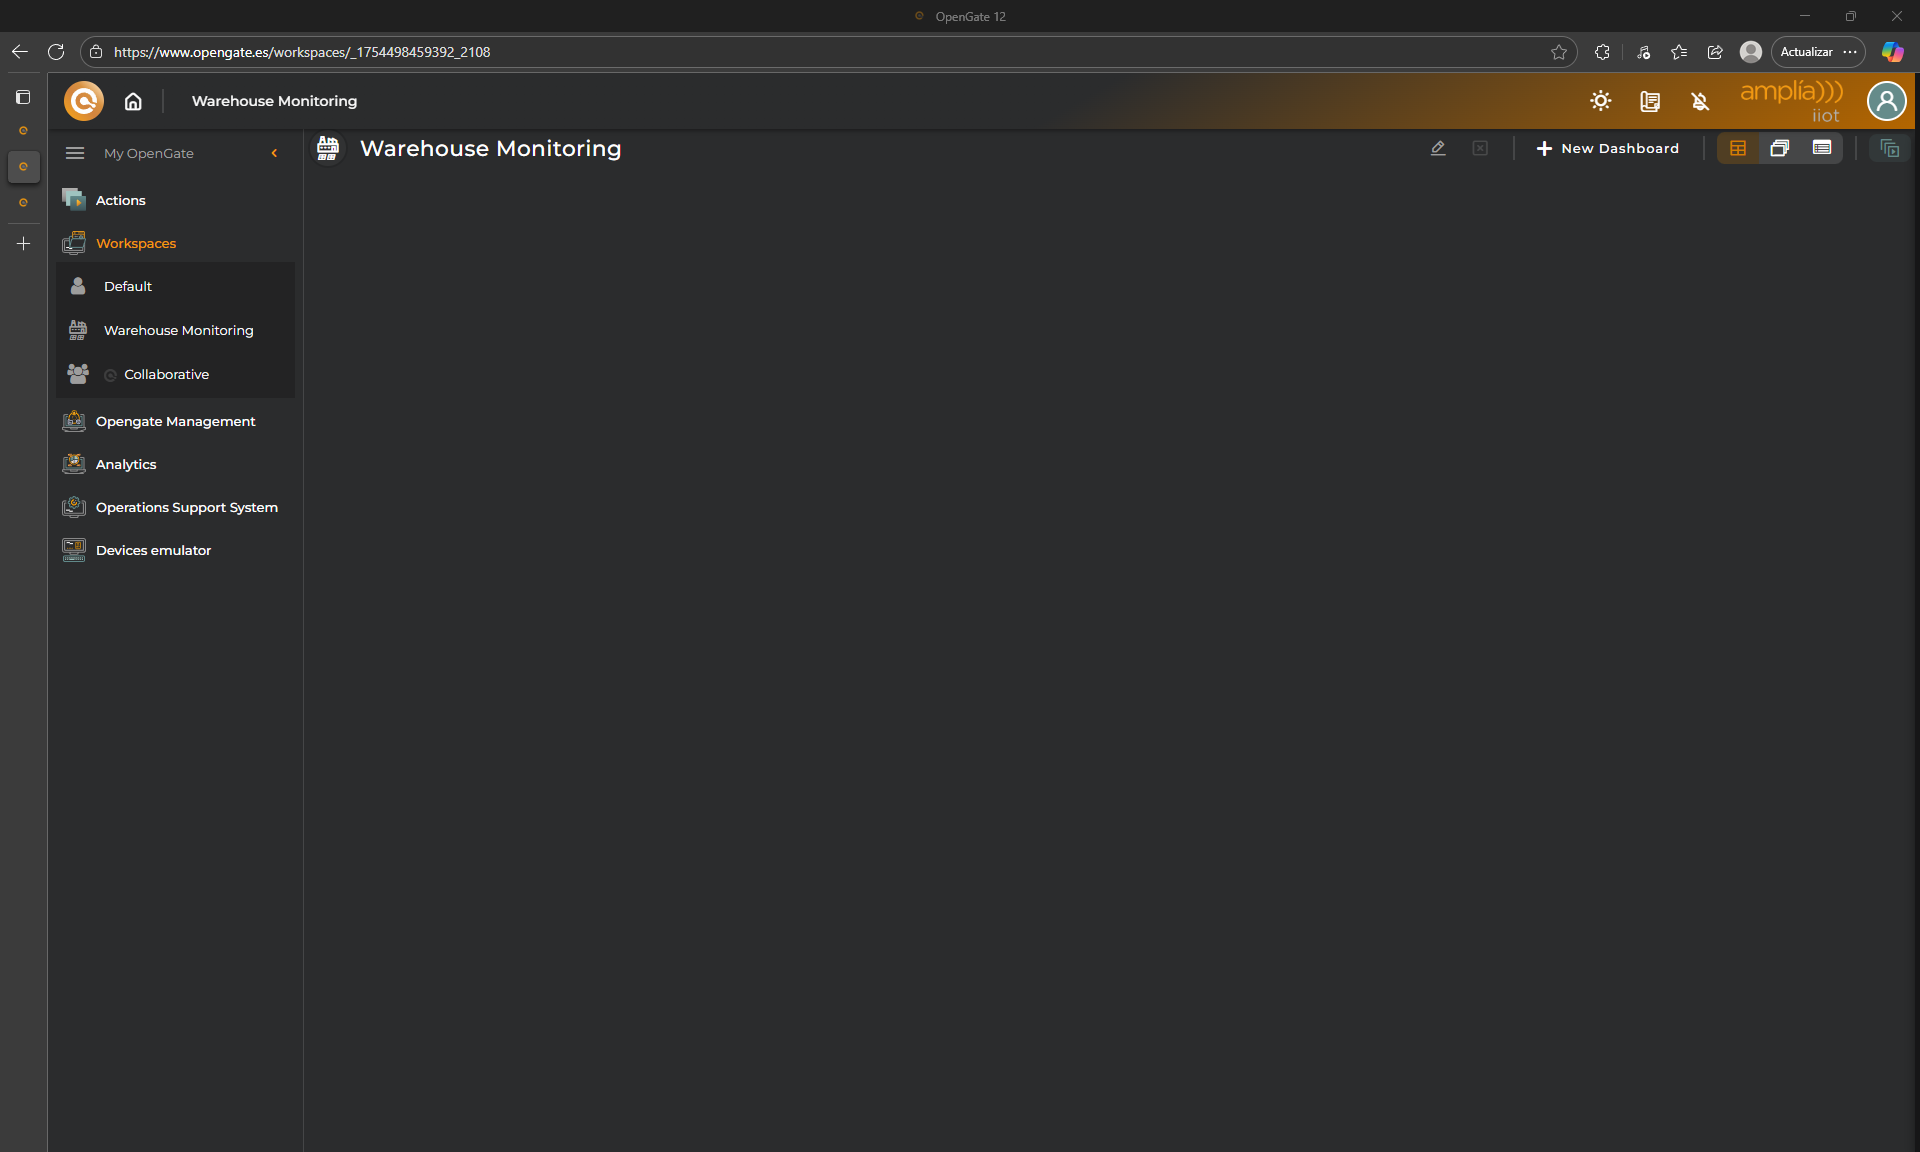
👏 **Done!** OpenGate redirects you directly to the new workspace view
---
### 📊 Step 2: Create a Dashboard
Let's continue. Inside the workspace, you just need to click on "**+ NEW DASHBOARD**"
Now, we need to configure our dashboard. For this tutorial we fill the following data.
- **Name**: use `Warehouse Overview`
- **Icon**: choose one, for example `ogicon-WD`
- **Image**: Use default or something like this: 🖼️[warehouse.jpg](./warehouse.jpg)
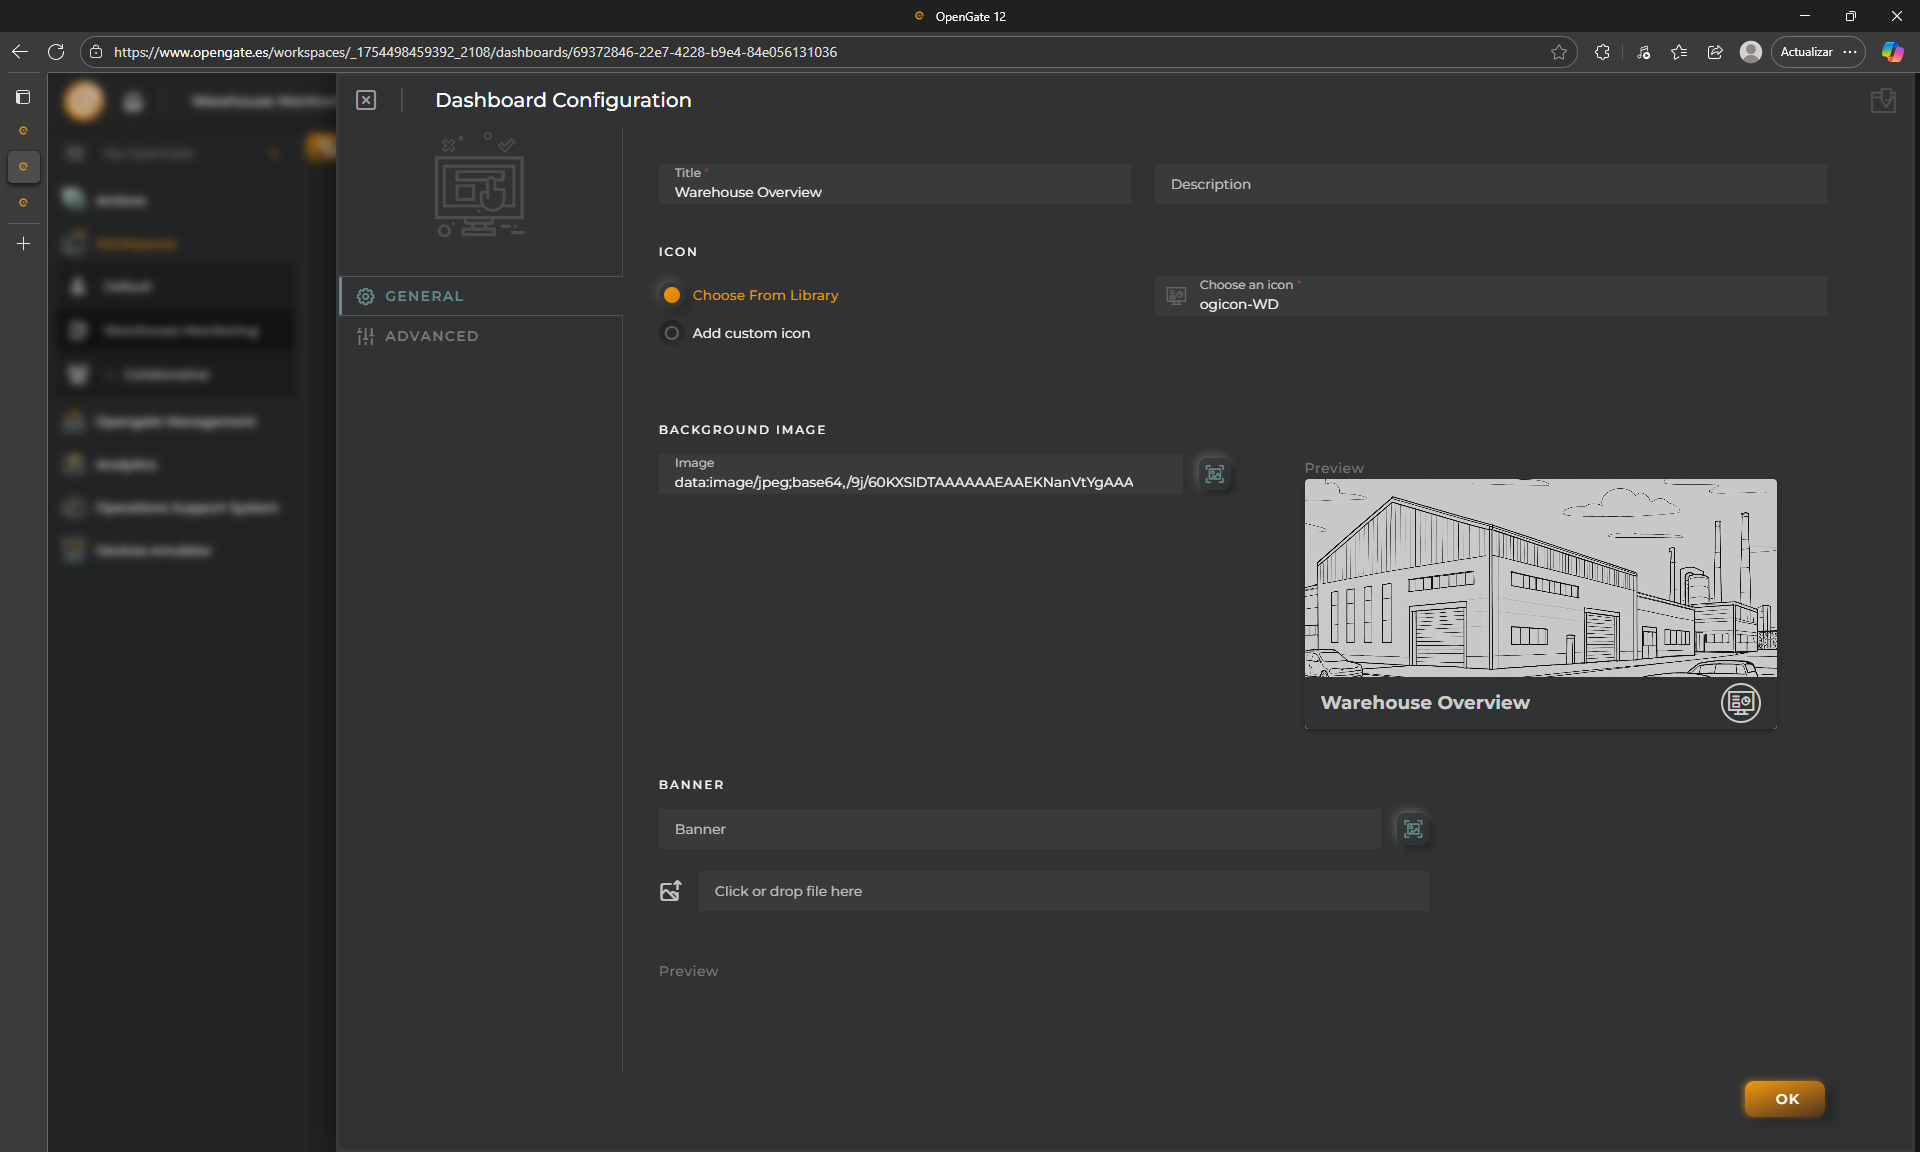
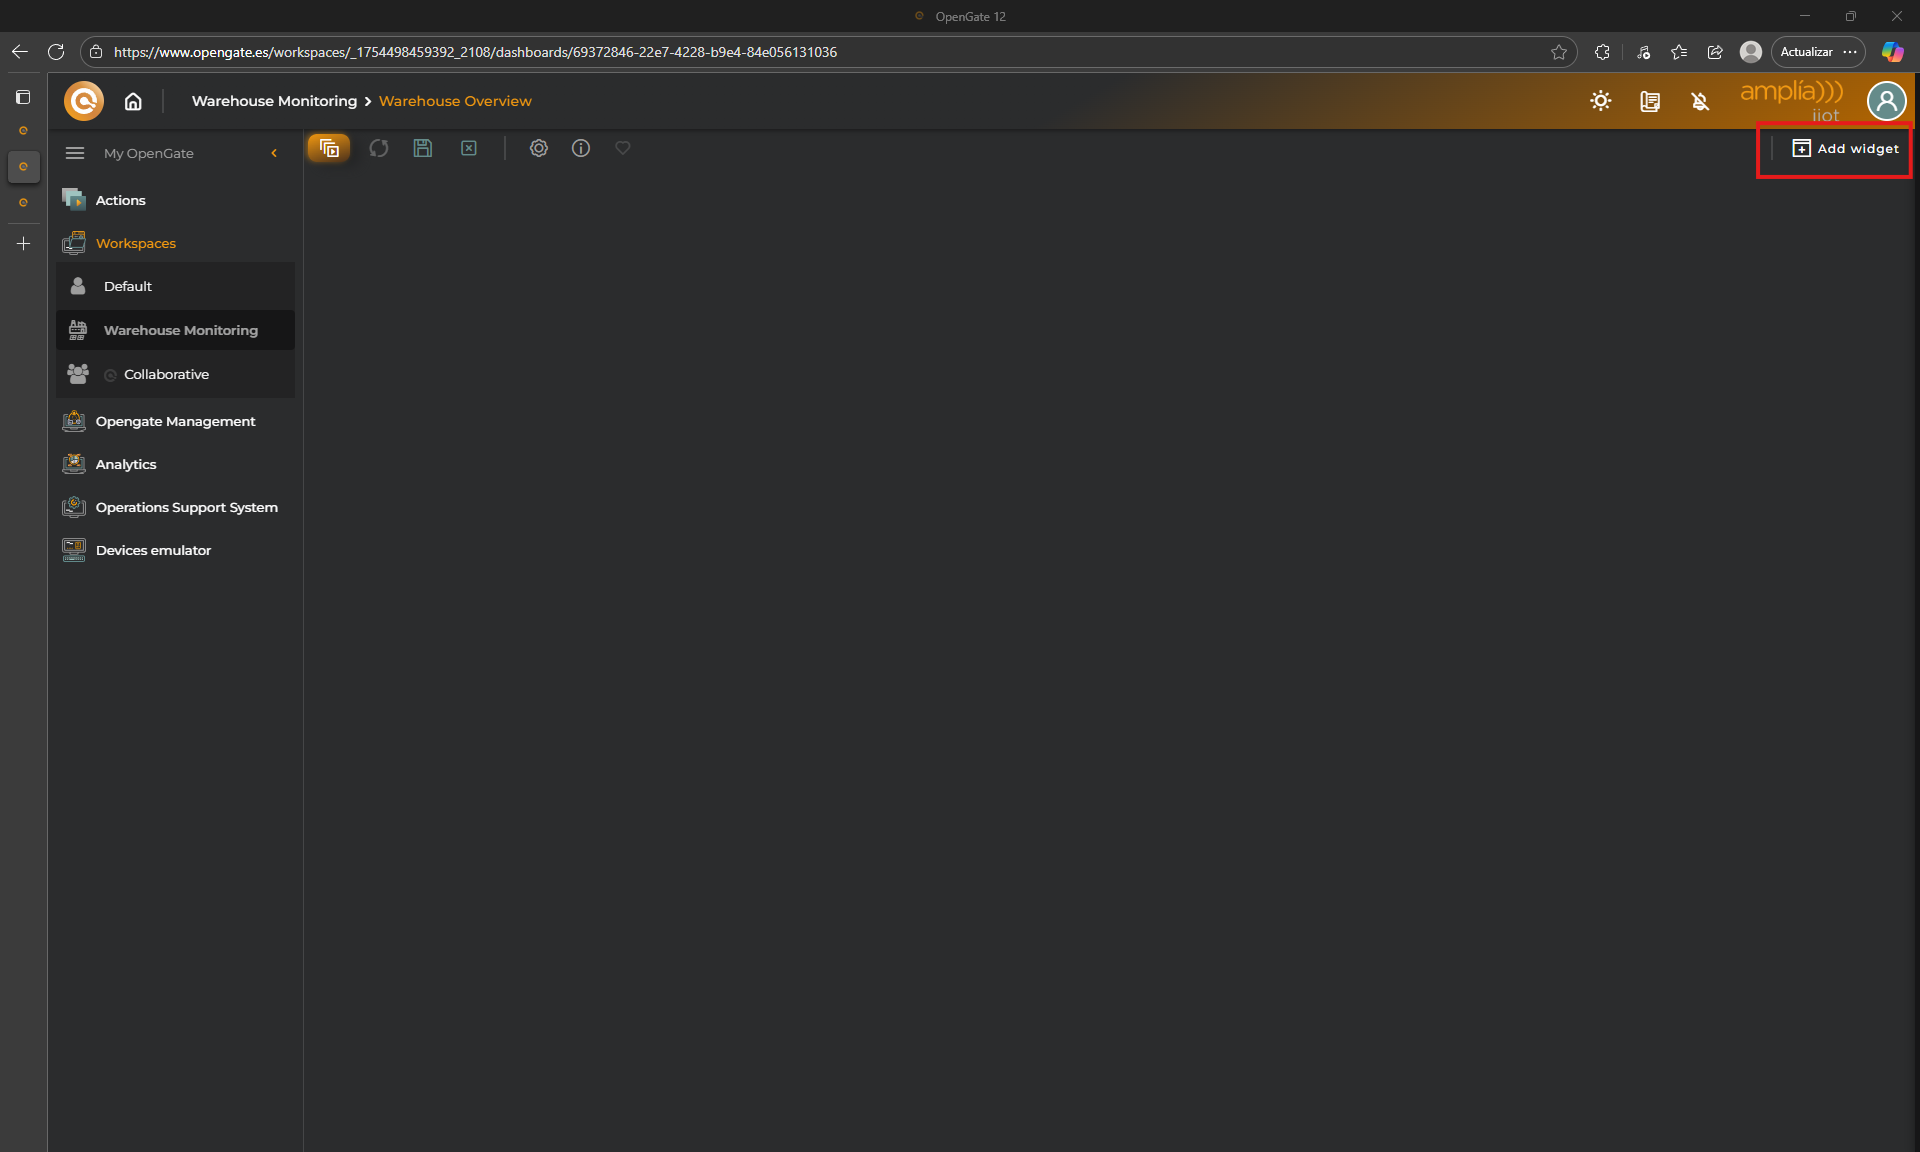
Click on "**OK**" and your new dashboard is created
---
## 🧩 Adding Widgets
Empty right? Let’s add two basic widgets to visualize our data. click on "**Add Widget**" and check the catalog
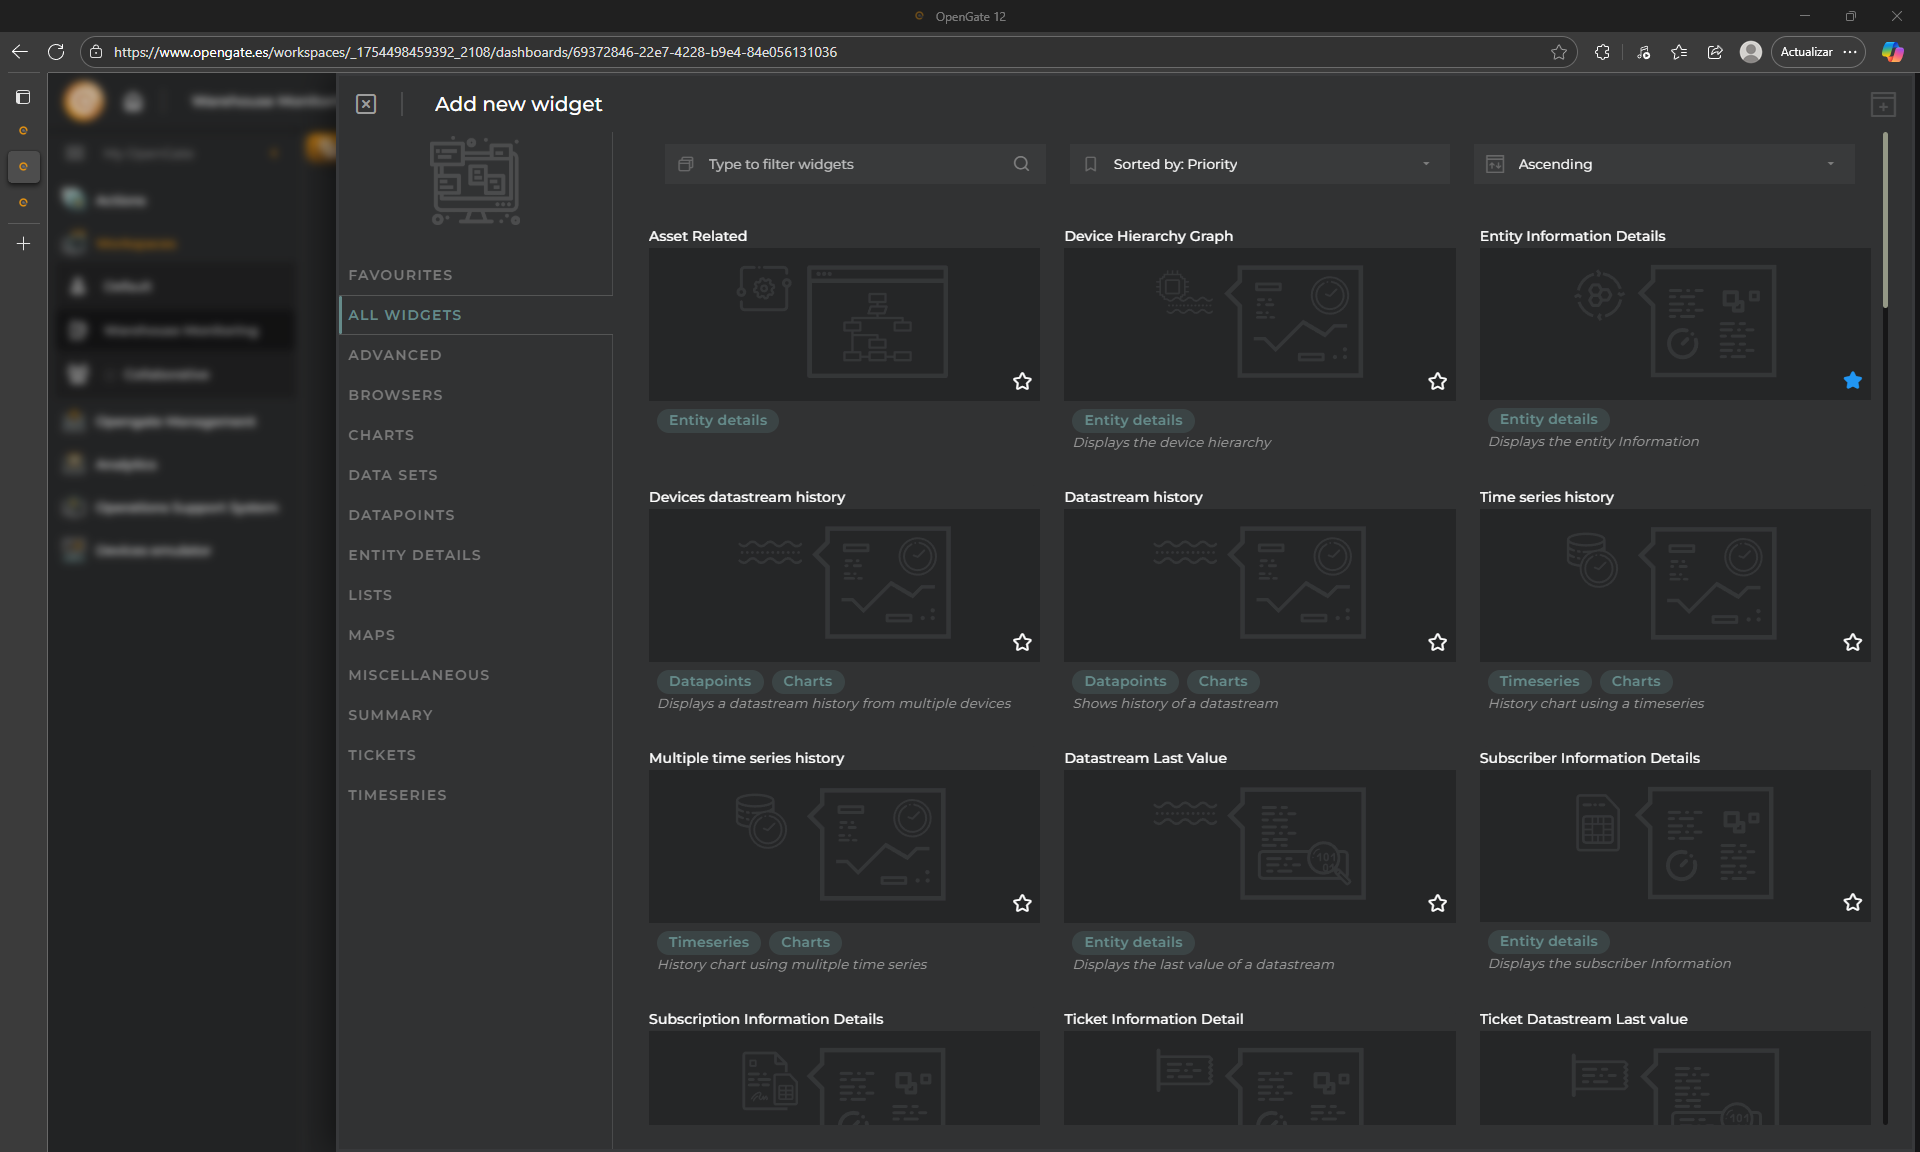
### 📋 Entities list widget
This widget is a table which shows entities in table format we will use this to show all our entities and its more relevant data.
1. Click **Add Widget** and look for **Entities List**
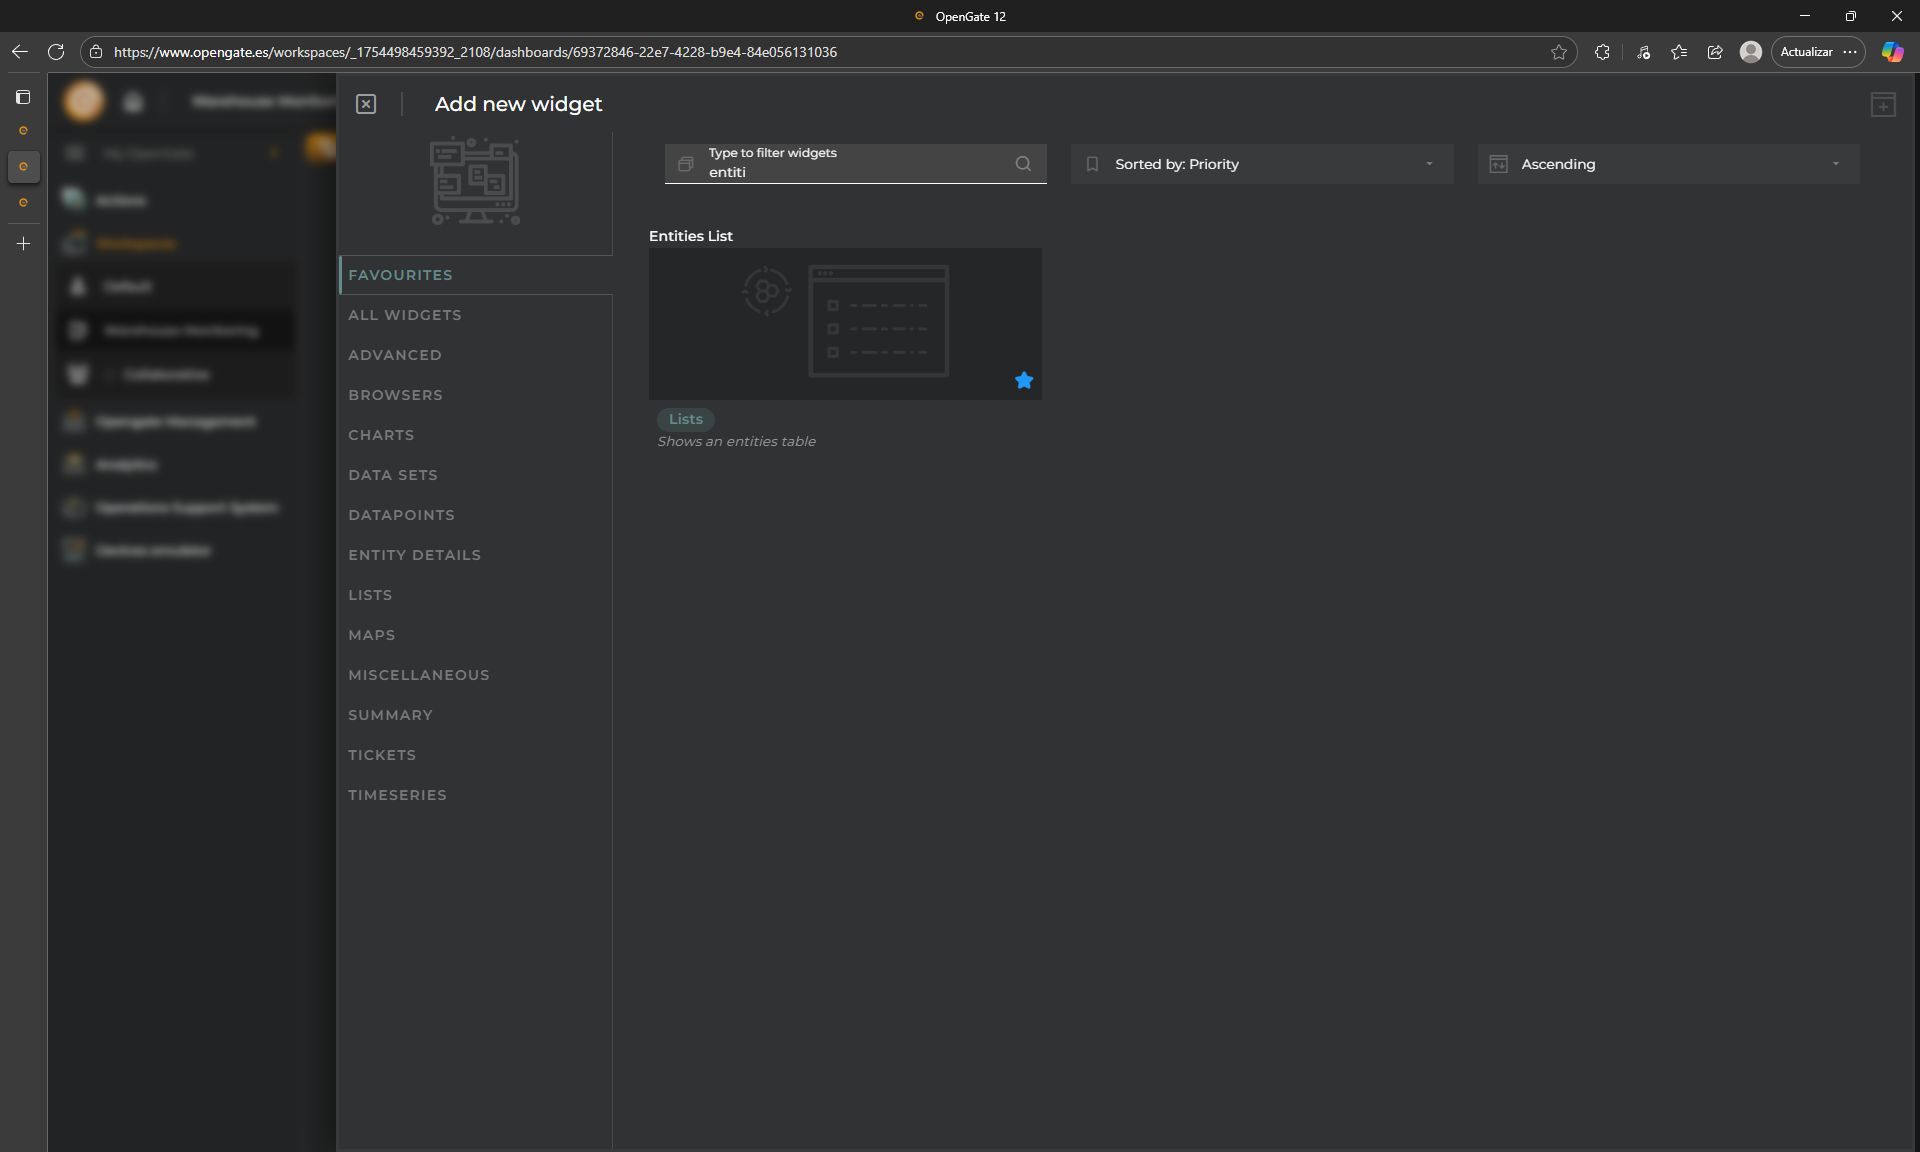
2. Click on "**Add**" and the *widget configuration* appears. Let's configure our new widget.
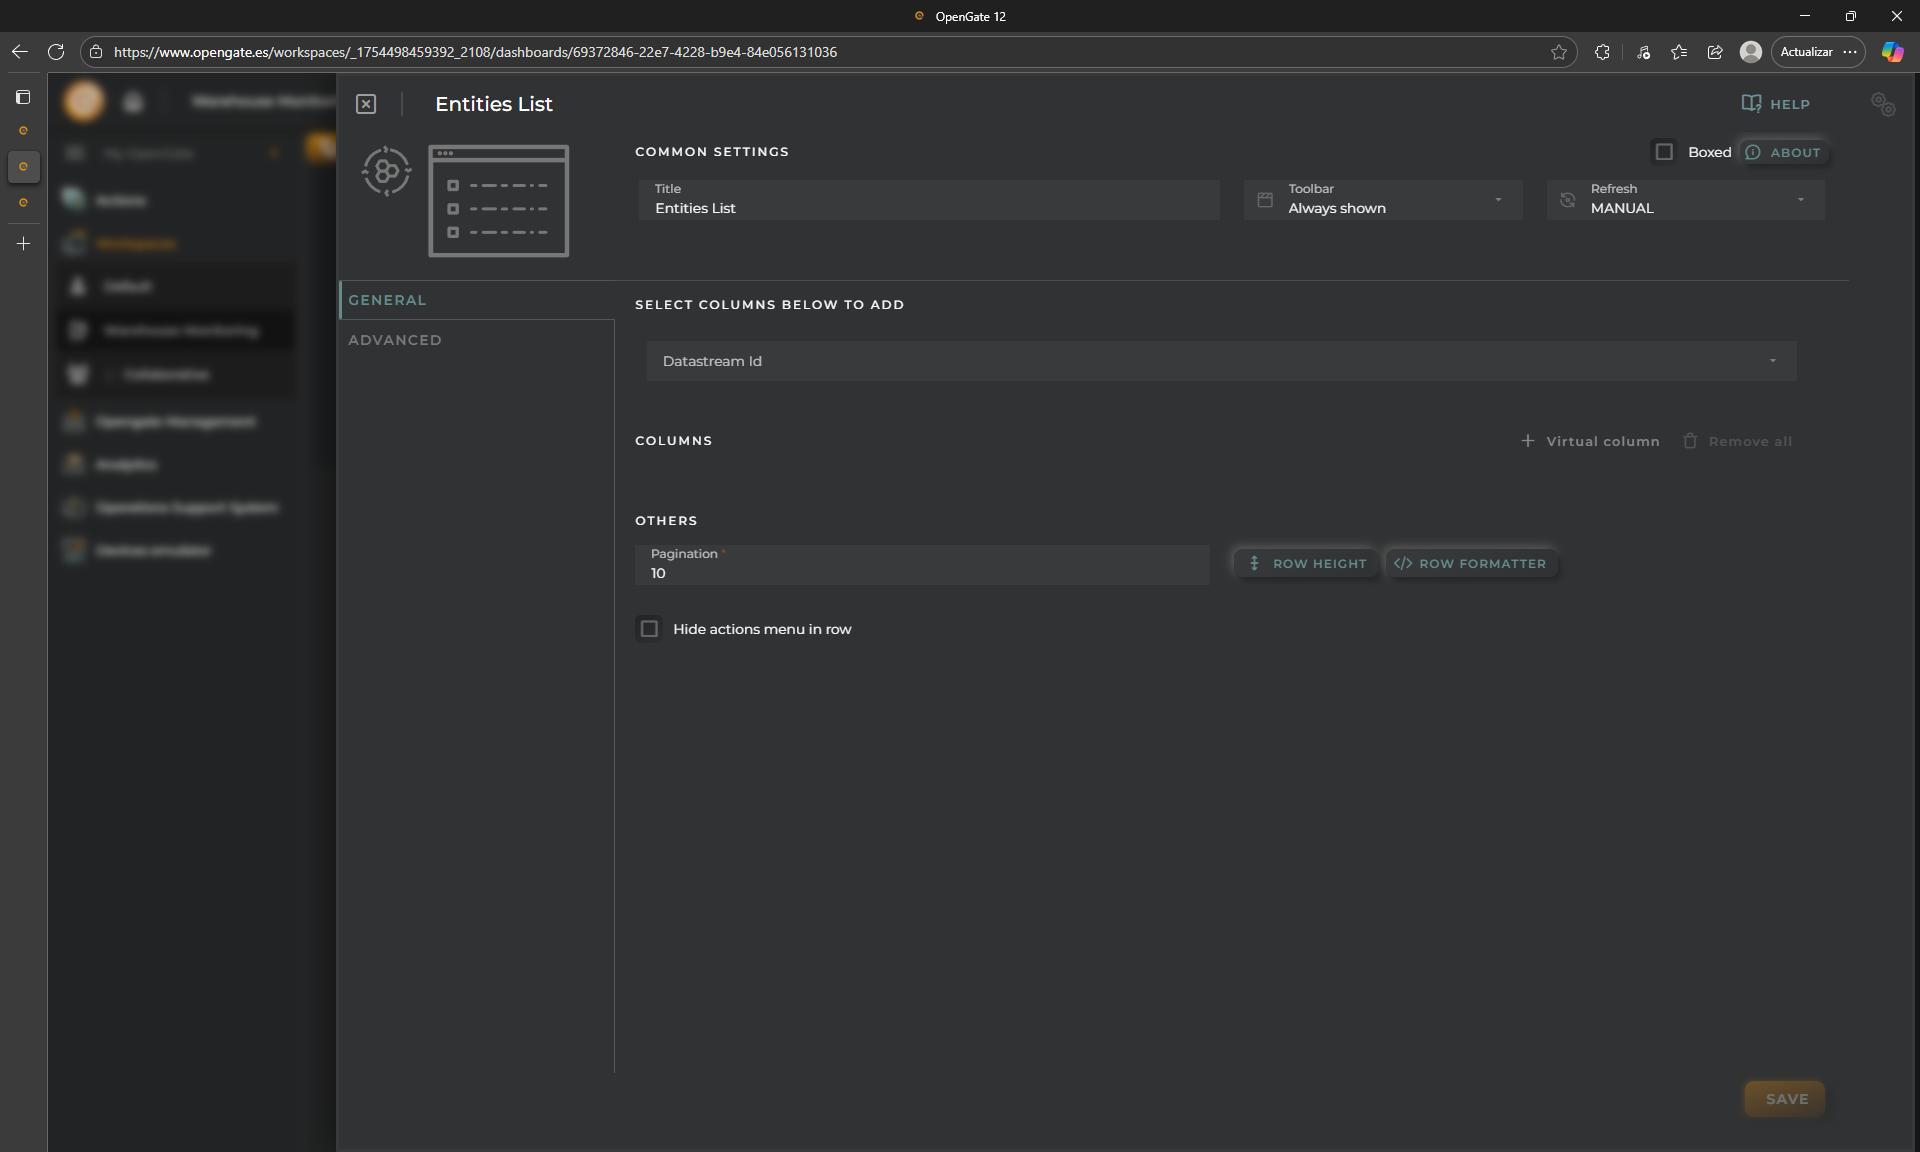
3. For this tutorial, we will focus in the warehouse rooms, so fill the following:
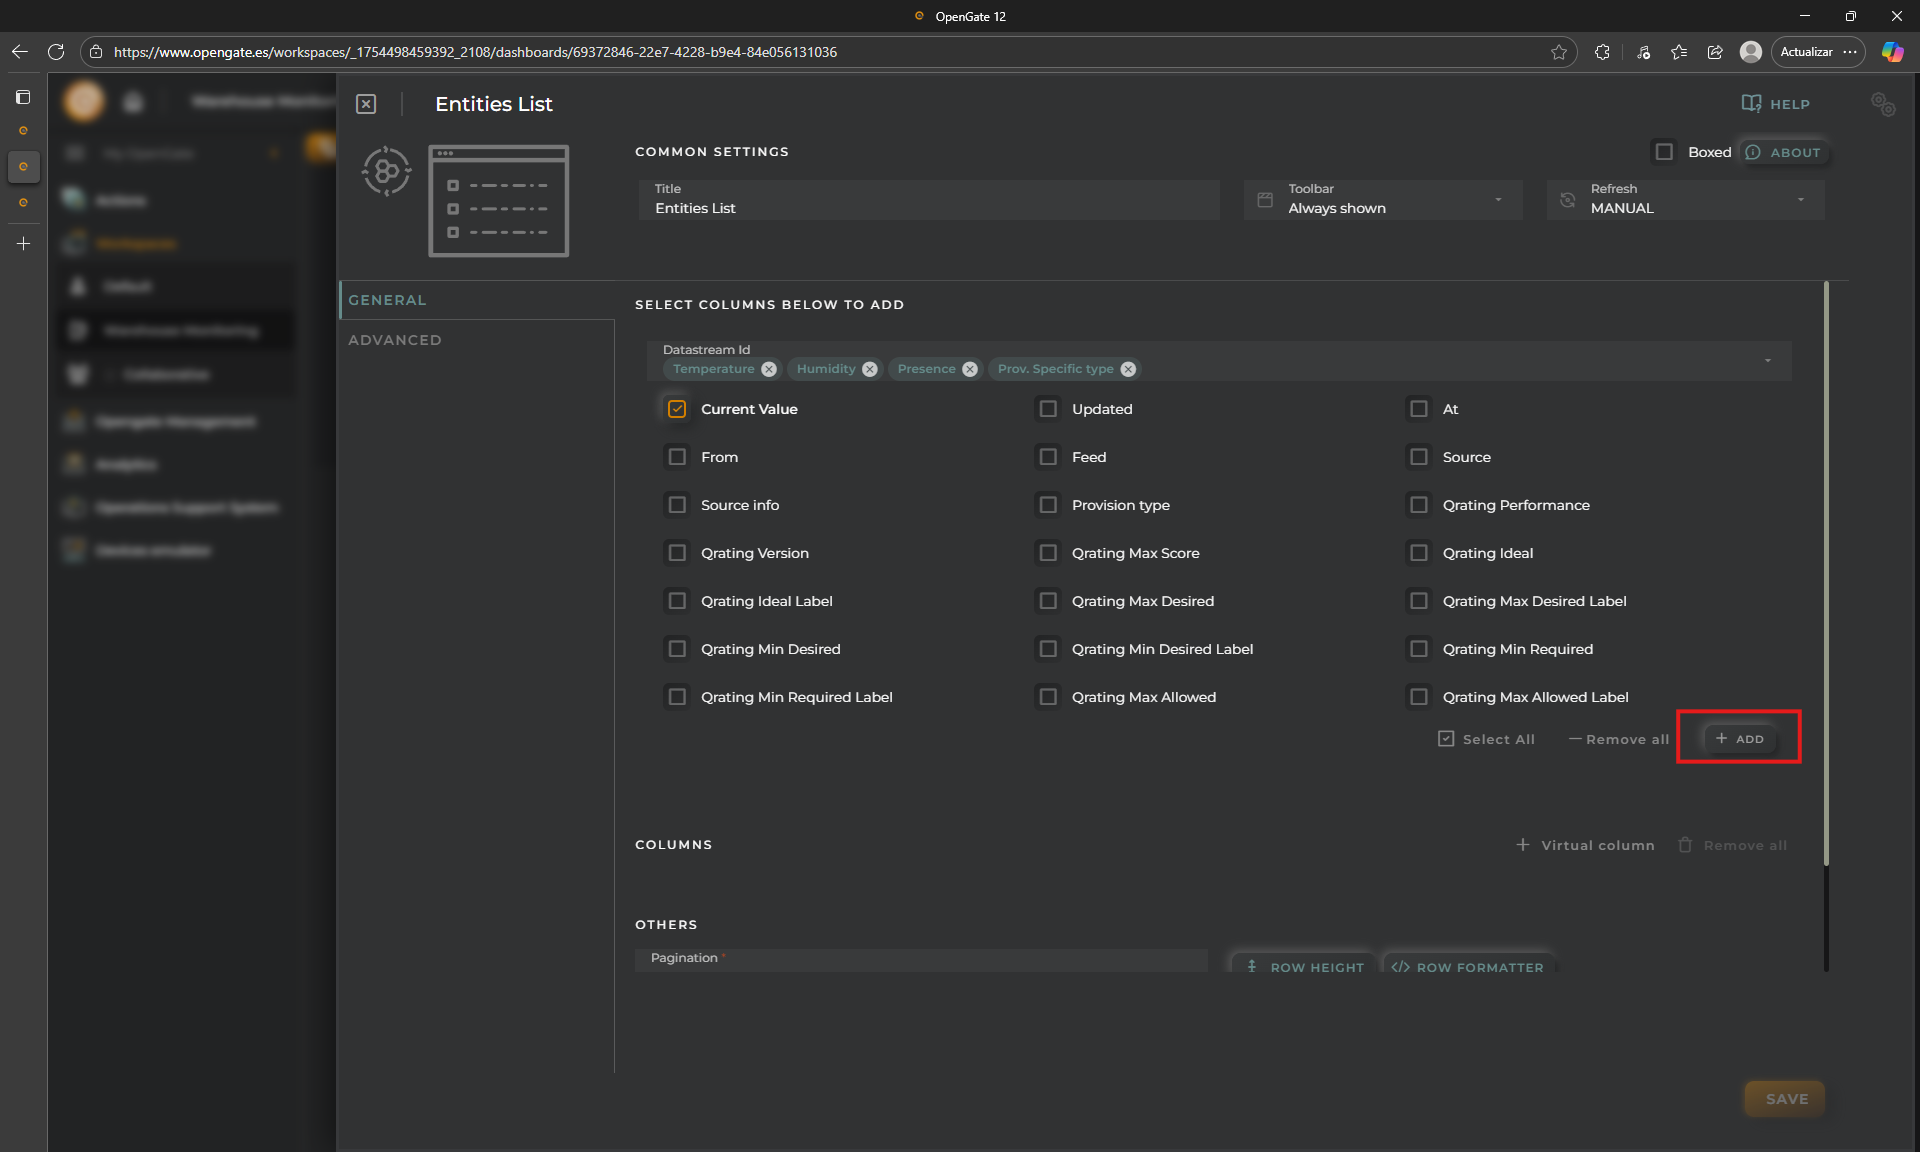
- **SELECT COLUMNS TO ADD**: This allows you to indicate what columns you want to see. The information is selected from datastreams list, OpenGate standard and custom, for provision, and collection datastreams. Fill this with: `temperature`, `humidity`, `presence` from our datamodel "warehouse" and `provision.device.specificType`, `provision.device.identifier`, `provision.asset.identifier` from the OpenGate standard data models. You can choose what datastream property show in the table. Check on "**Current Value**" and click on "**+ ADD**"
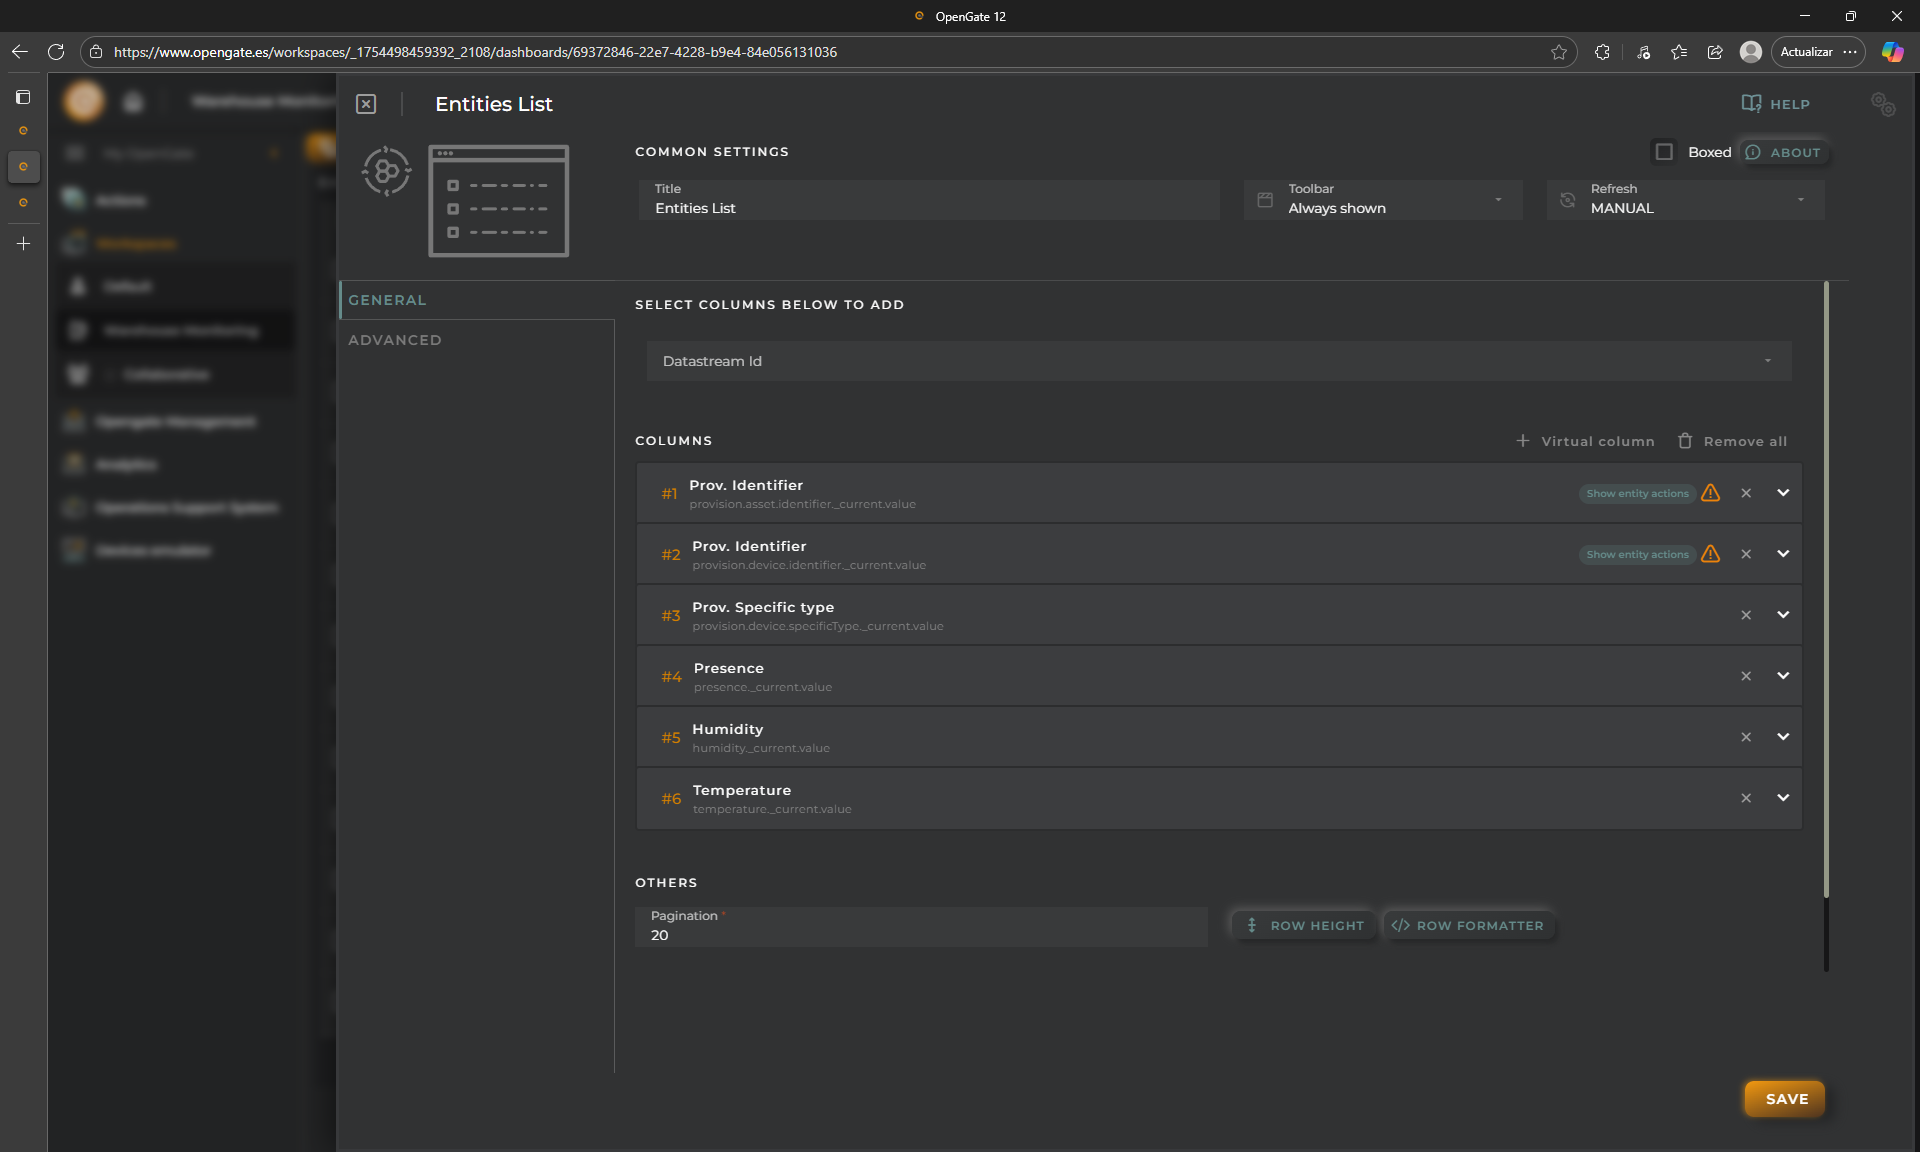
- **PAGINATION**: The standard value is 10, change it to `20`.
4. Then you will see the columns that the widget will show. Keep it as is, but you can change some things such order, name or apply formaters, we will see this later
5. Save the widget and the widget will be added to the dashboard automatically.
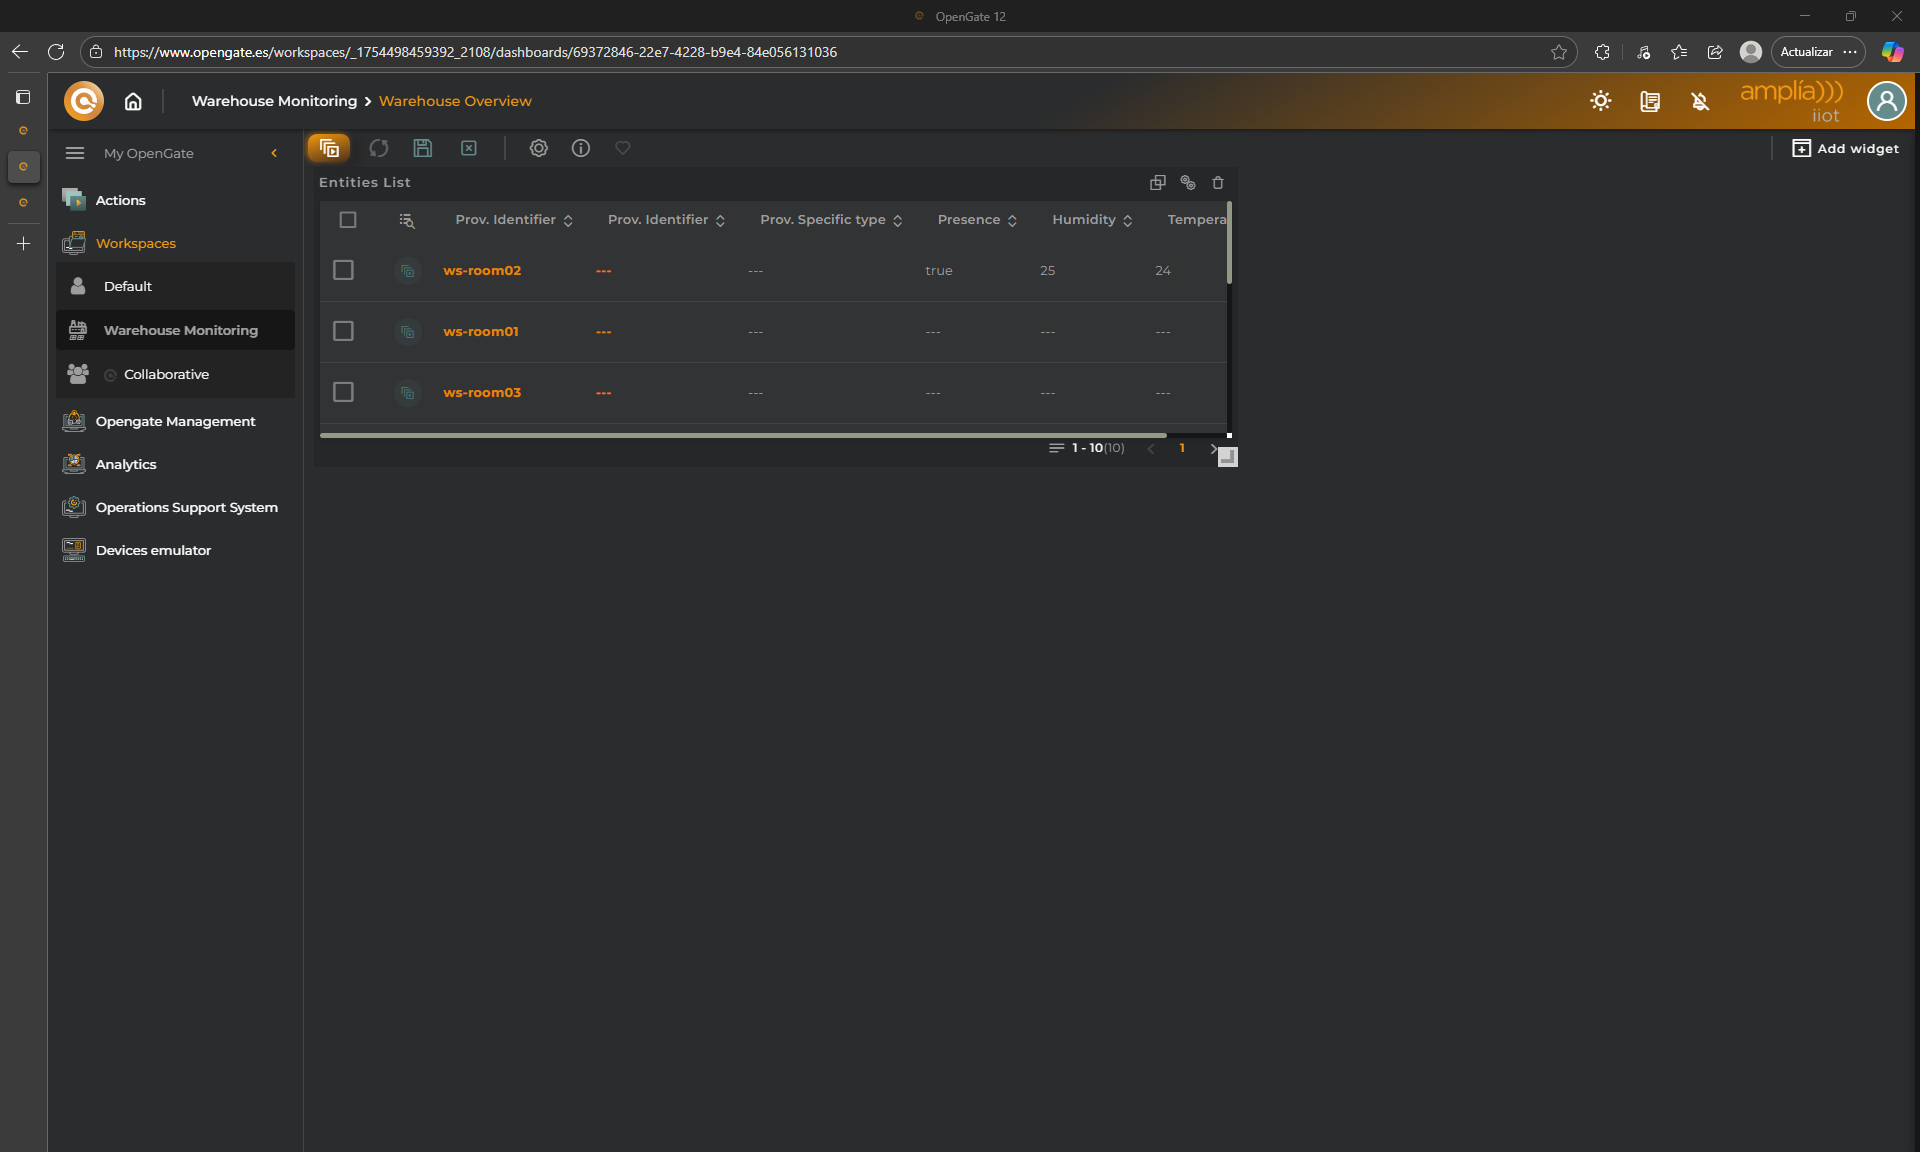
Use the bottom-right arrow icon on the widget to adjust the widget size, and click on "**SAVE**" icon in the Dashboard toolbar.
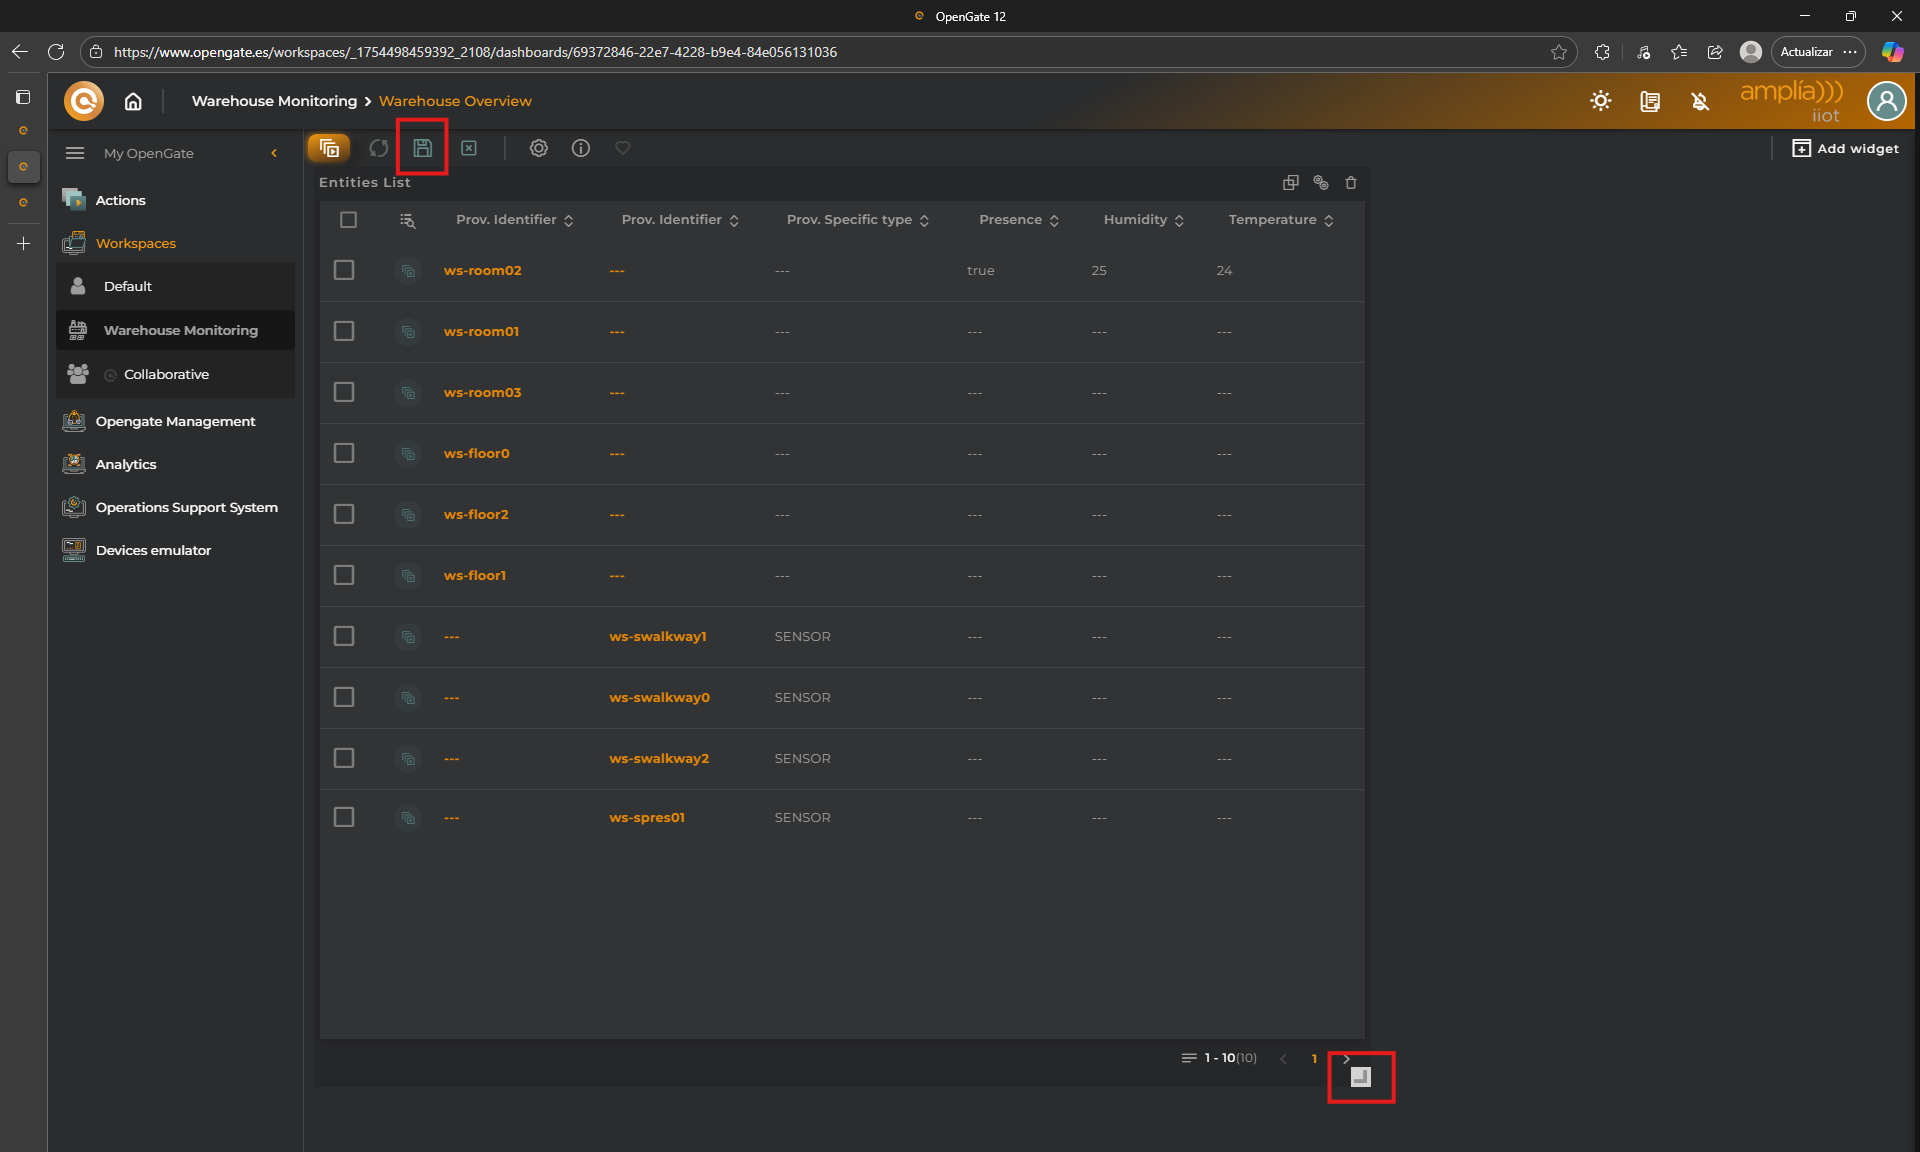
**🎉 Congratulations you have your first dashboard with one widget!!!**
### 🗺️ Map Widget
Let's continue by adding a map widget.
1. Like you performed before, click **Add Widget** and choose **Maps**
The "Maps" widget is another powerful tool that can be configured to show a lot of customizable information of your entities, directly over a geolocated map. For this tutorial, we keep the widget as default. But lets review what the widget will show:
- "provision.device.location": This marker represents the **provision** location of a device
- "entity.location": This marker represents the location **collected** for a device
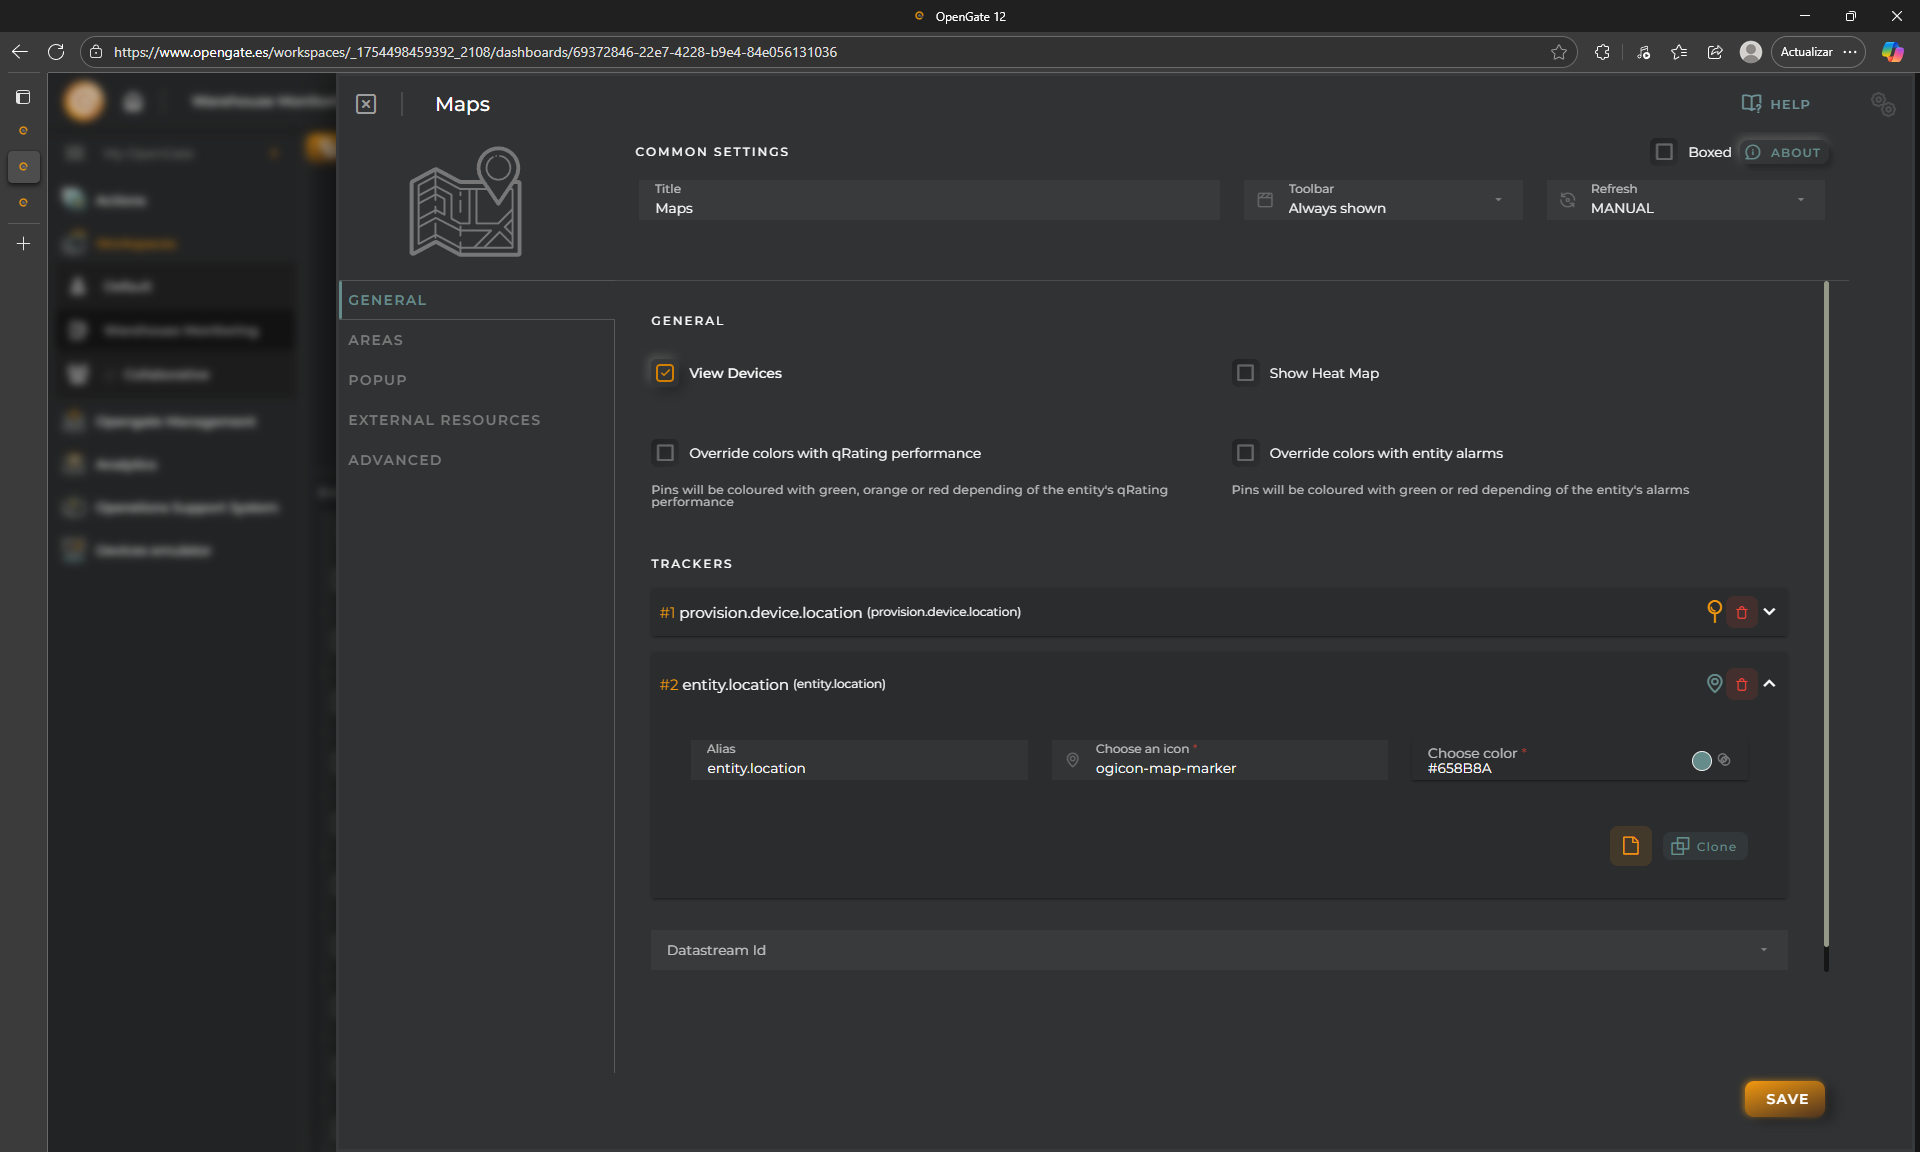
2. Save the widget and move it to the right part. Try to achieve this
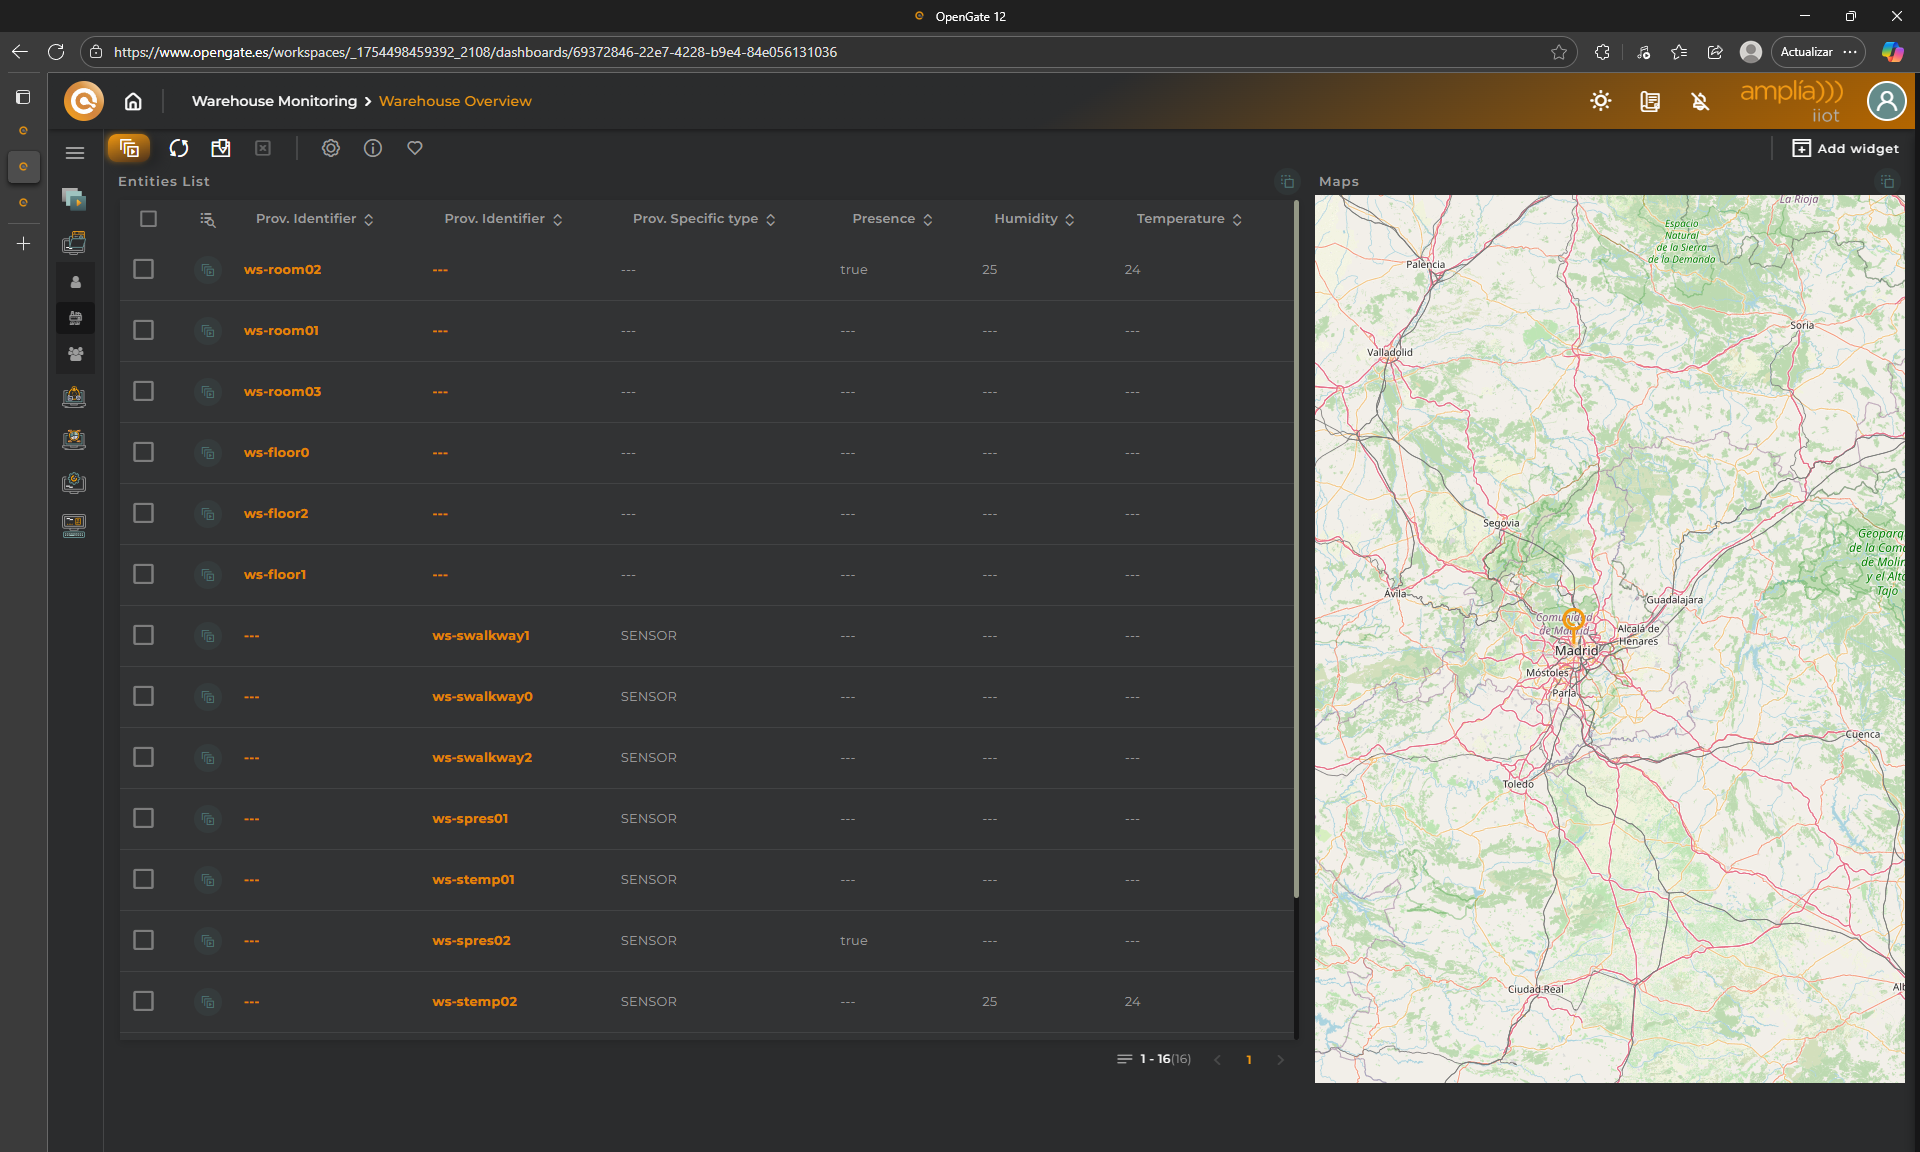
### ✅ Finish your work
I know, I know... we did not enter the location for all devices, but you can do it with what you have learned in this tutorial.
I give you a clue, you can do it in two ways depending on the information that you want to represent:
1. Use OpenGate Device Emulator, to collect the location of the entities
2. Use EDIT device option, from the menu of each entity in the widget table, to provision the location of the entities
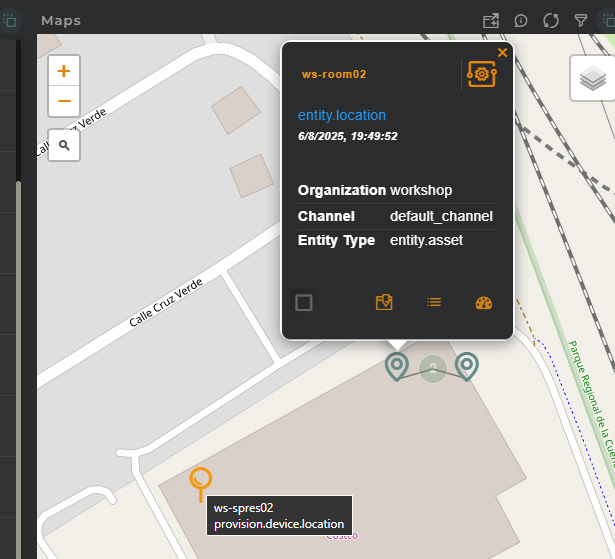
Use both if you wish and refresh the dashboard, now you see the map position. Enjoy the Maps widget, move around, CNTRL+SCROLL to zoom in/out, and click on some device to see its information. Look this:
---
## 🔍 Applying Filters
We have configured a great dashboard, but we can adjust it to refine the dashboard view.
Because we want to use this dashboard as "Warehouse Overview", we’ll create a basic filter to only see our warehouse rooms information.
### 🧮 Filter the "Entities list" widget
Remember, these entities are assets. The entity type is recorded in OpenGate standard datamodel using 'resourceType' datastream.
So that, lets reconfigure our widget to apply a filter:
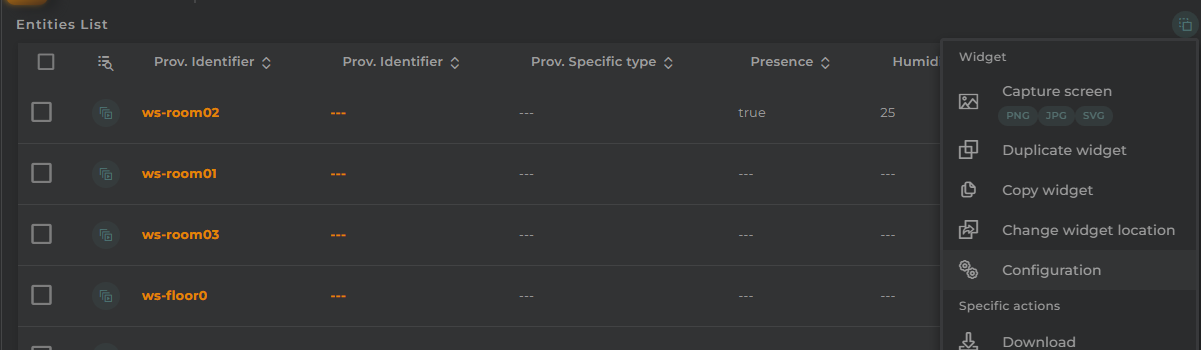
1. Open the widget configuration from the **widget menu**:
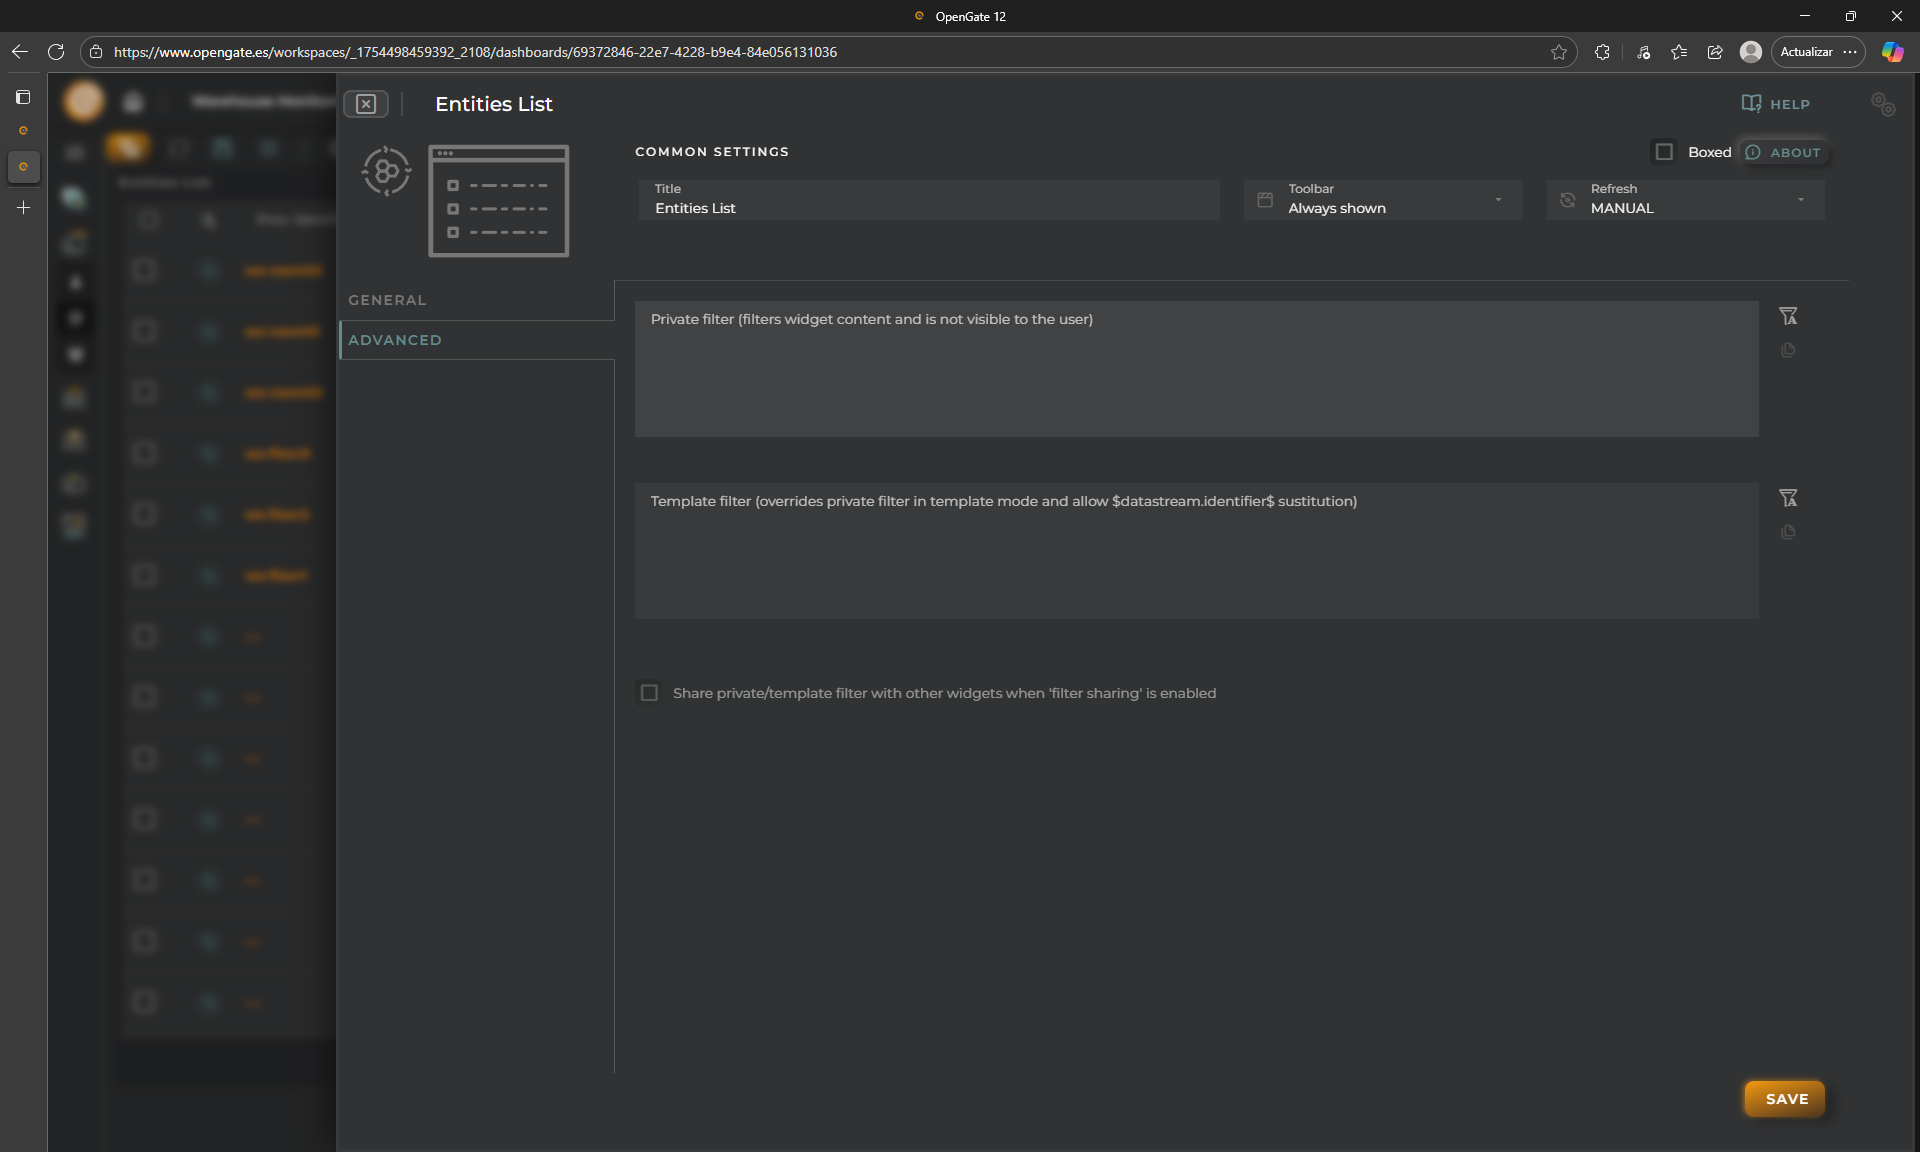
2. Go to the "**ADVANCED**" tab and click on "**Private filter**"
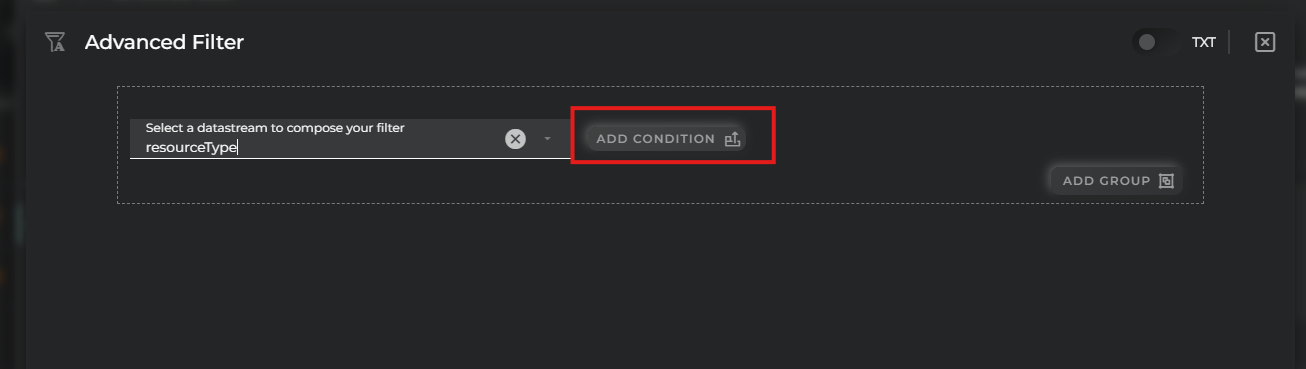
3. Choose `resourceType` and click on "**ADD CONDITION**"
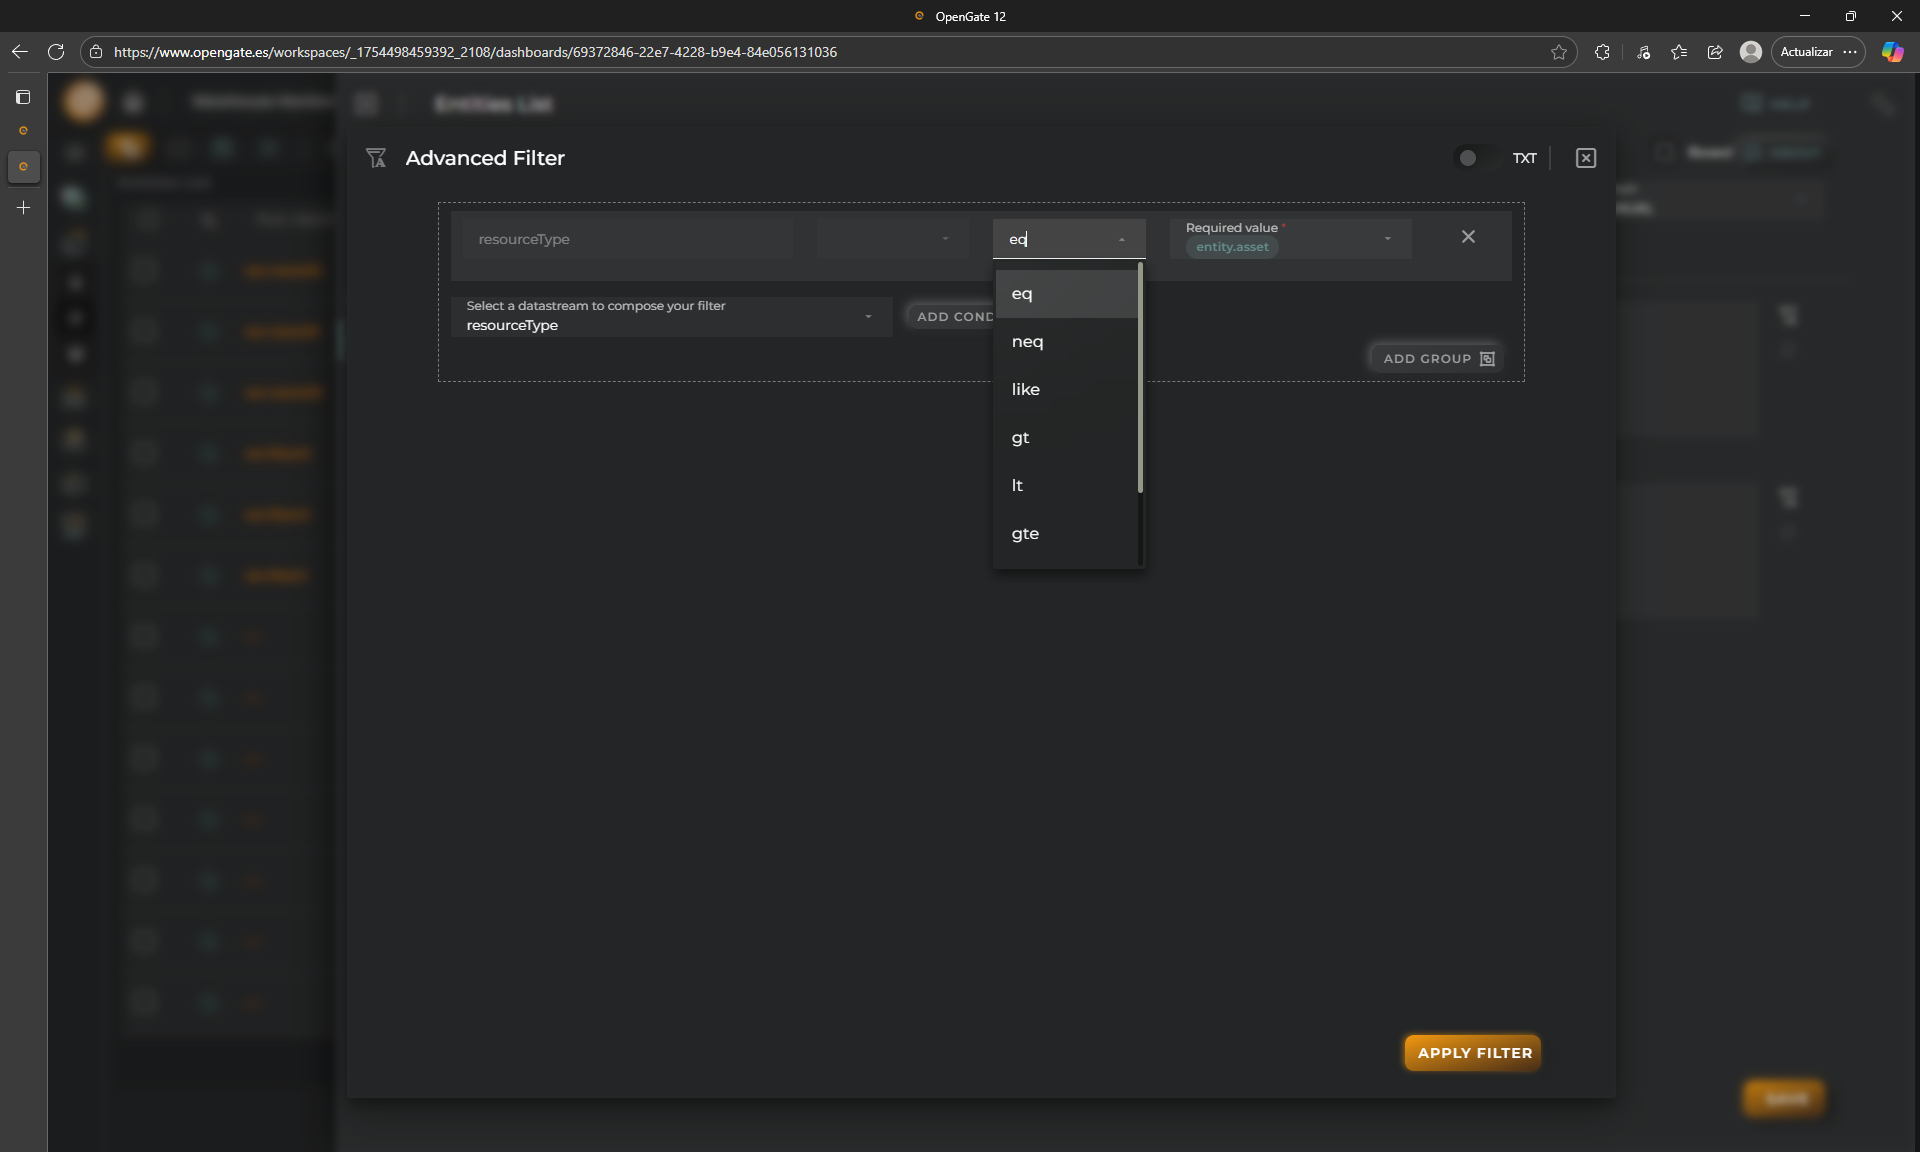
4. Choose "eq" (that means equals) for the condition operator, and fill `entity.asset` in the value. Click on "**APPLY FILTER**"
5. Let's do a couple of things more.
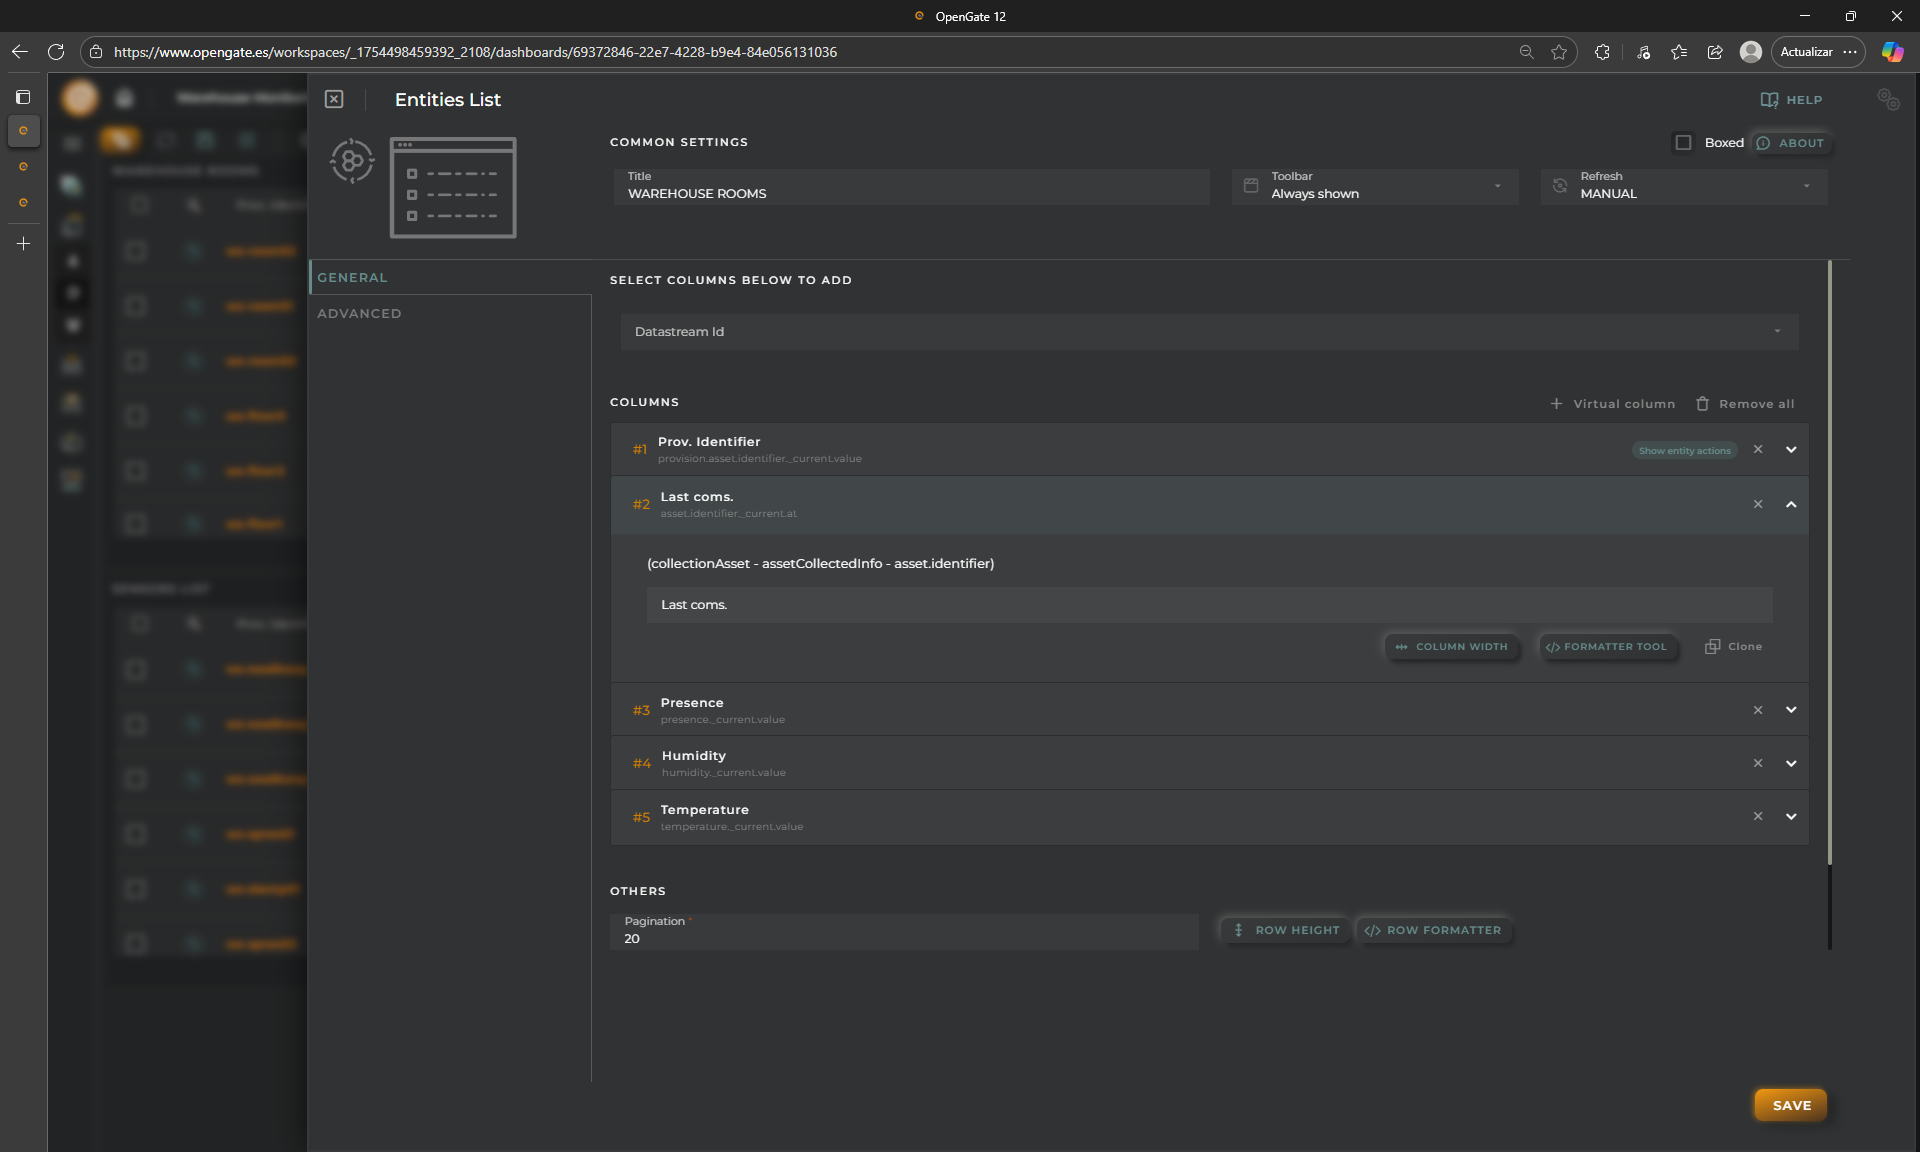
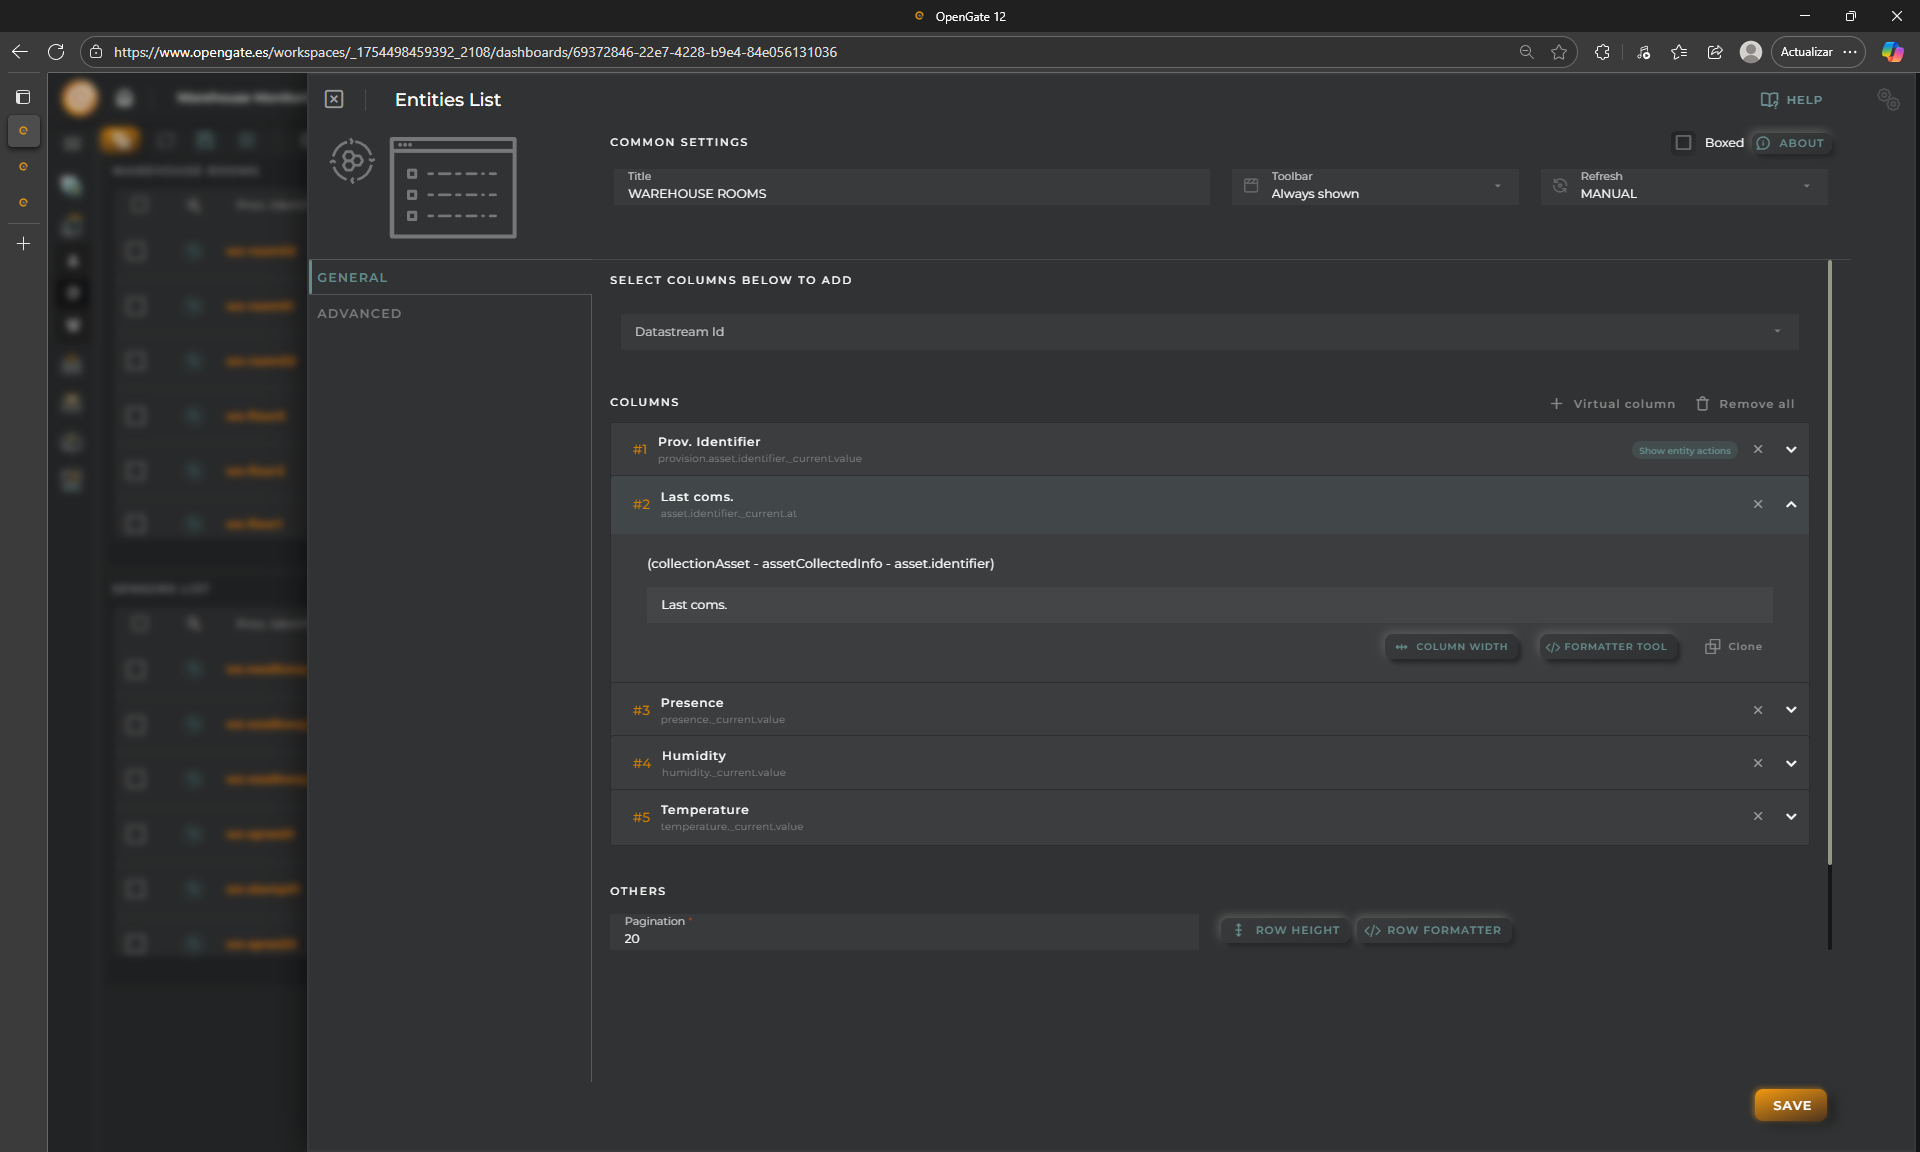
- Add a new column using `asset.identifier` datastream and choose `at`. This will create a new column that shows each time some asset information is updated by one of its related devices. Edit it and change its name to `Last coms.`
- Remove columns `provision.device.specificType` and `provision.device.identifier`, note that these datastreams are relevant for devices, not for assets, so we can safely remove them from this view!
You should have something like this:
6. Click on "**SAVE**" to apply the changes. The widget will now display only assets, with the updated column layout
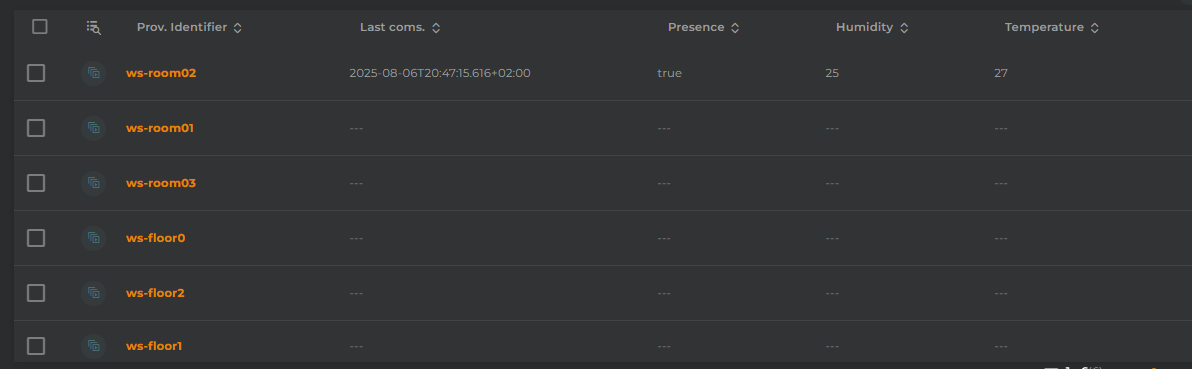
This will ensure that only assets (not devices or other entities) are shown in the dashboard.
### 🗺️ Do the same with the "Map" widget
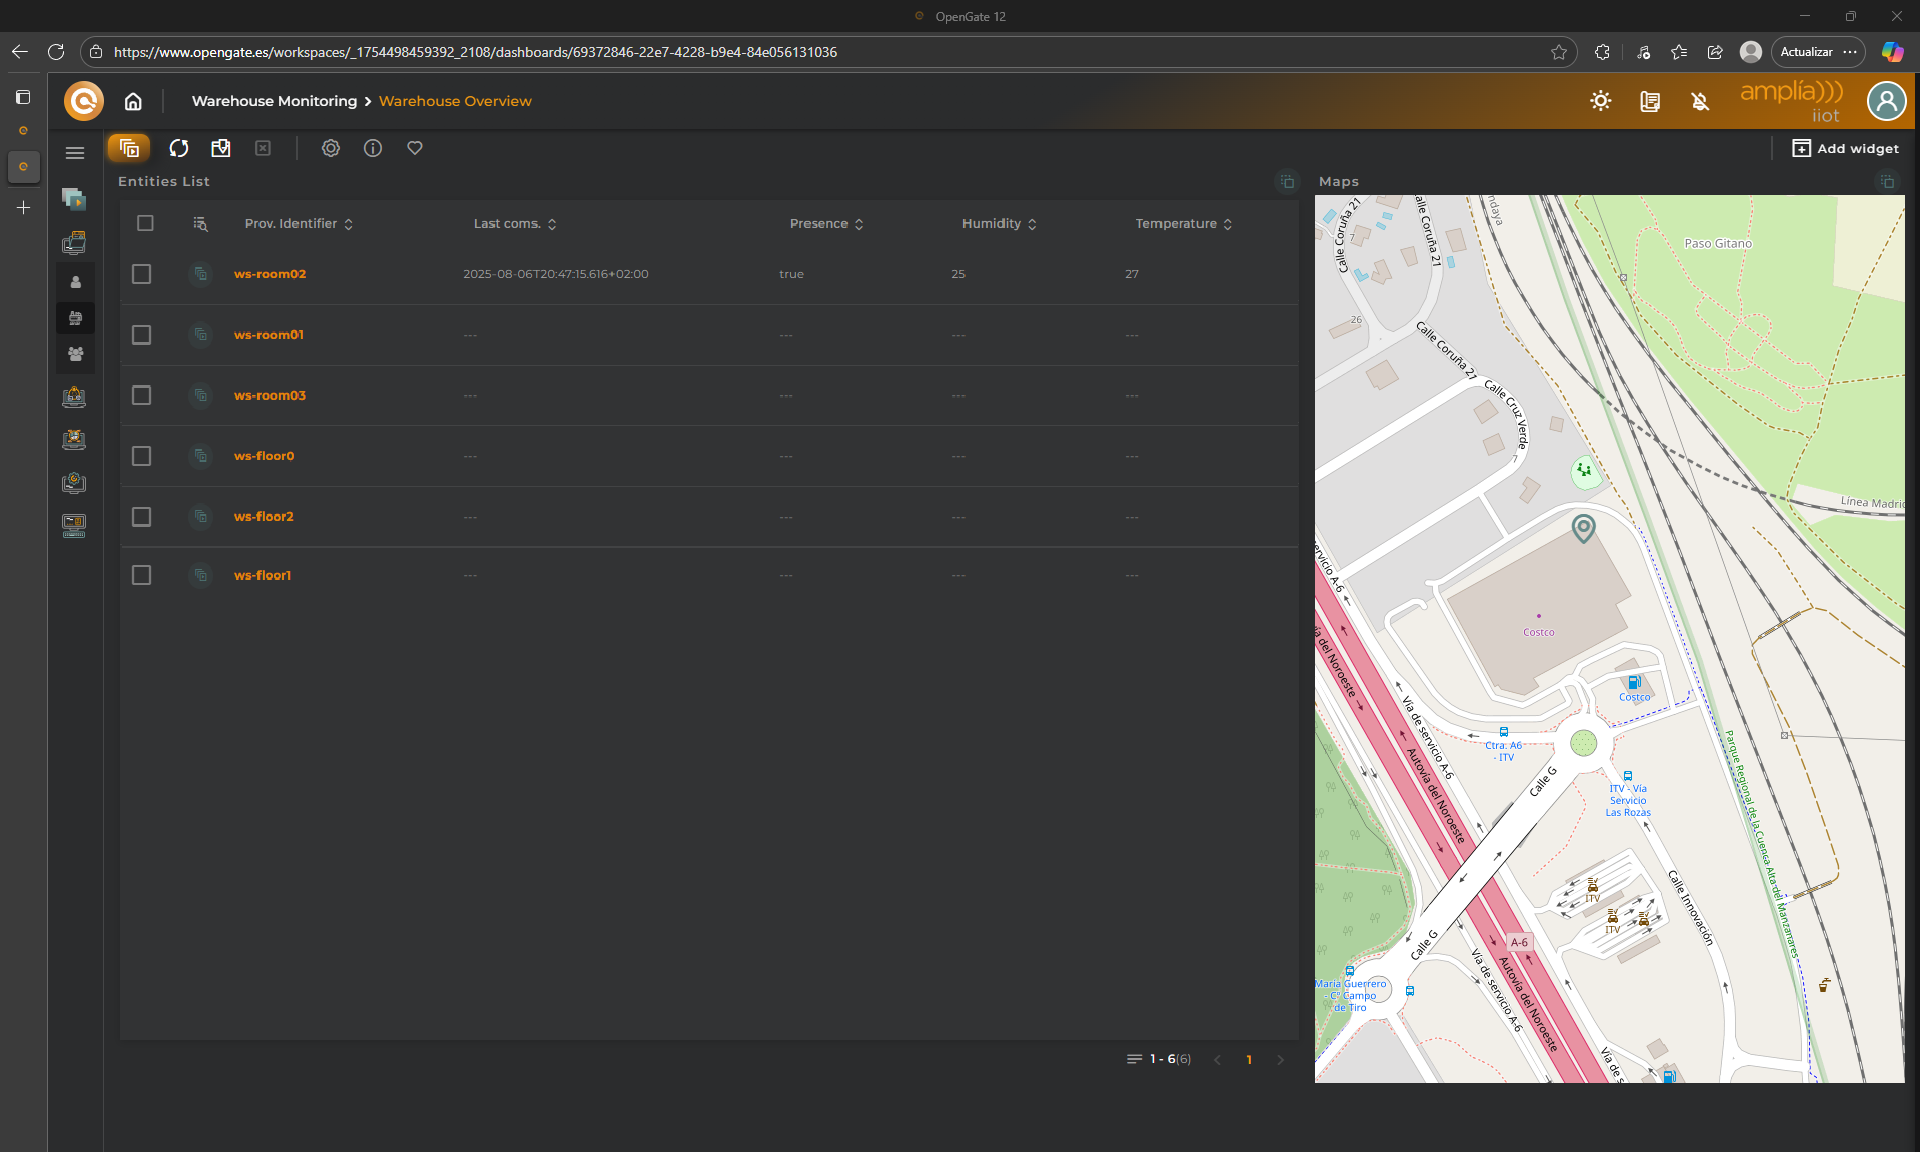
Repeat the job with the map widget. All OpenGate widgets have similar configuration options so you know what you need.
You should accomplish something like this. Only the information from your assets is visible:
### ➕ Want more?
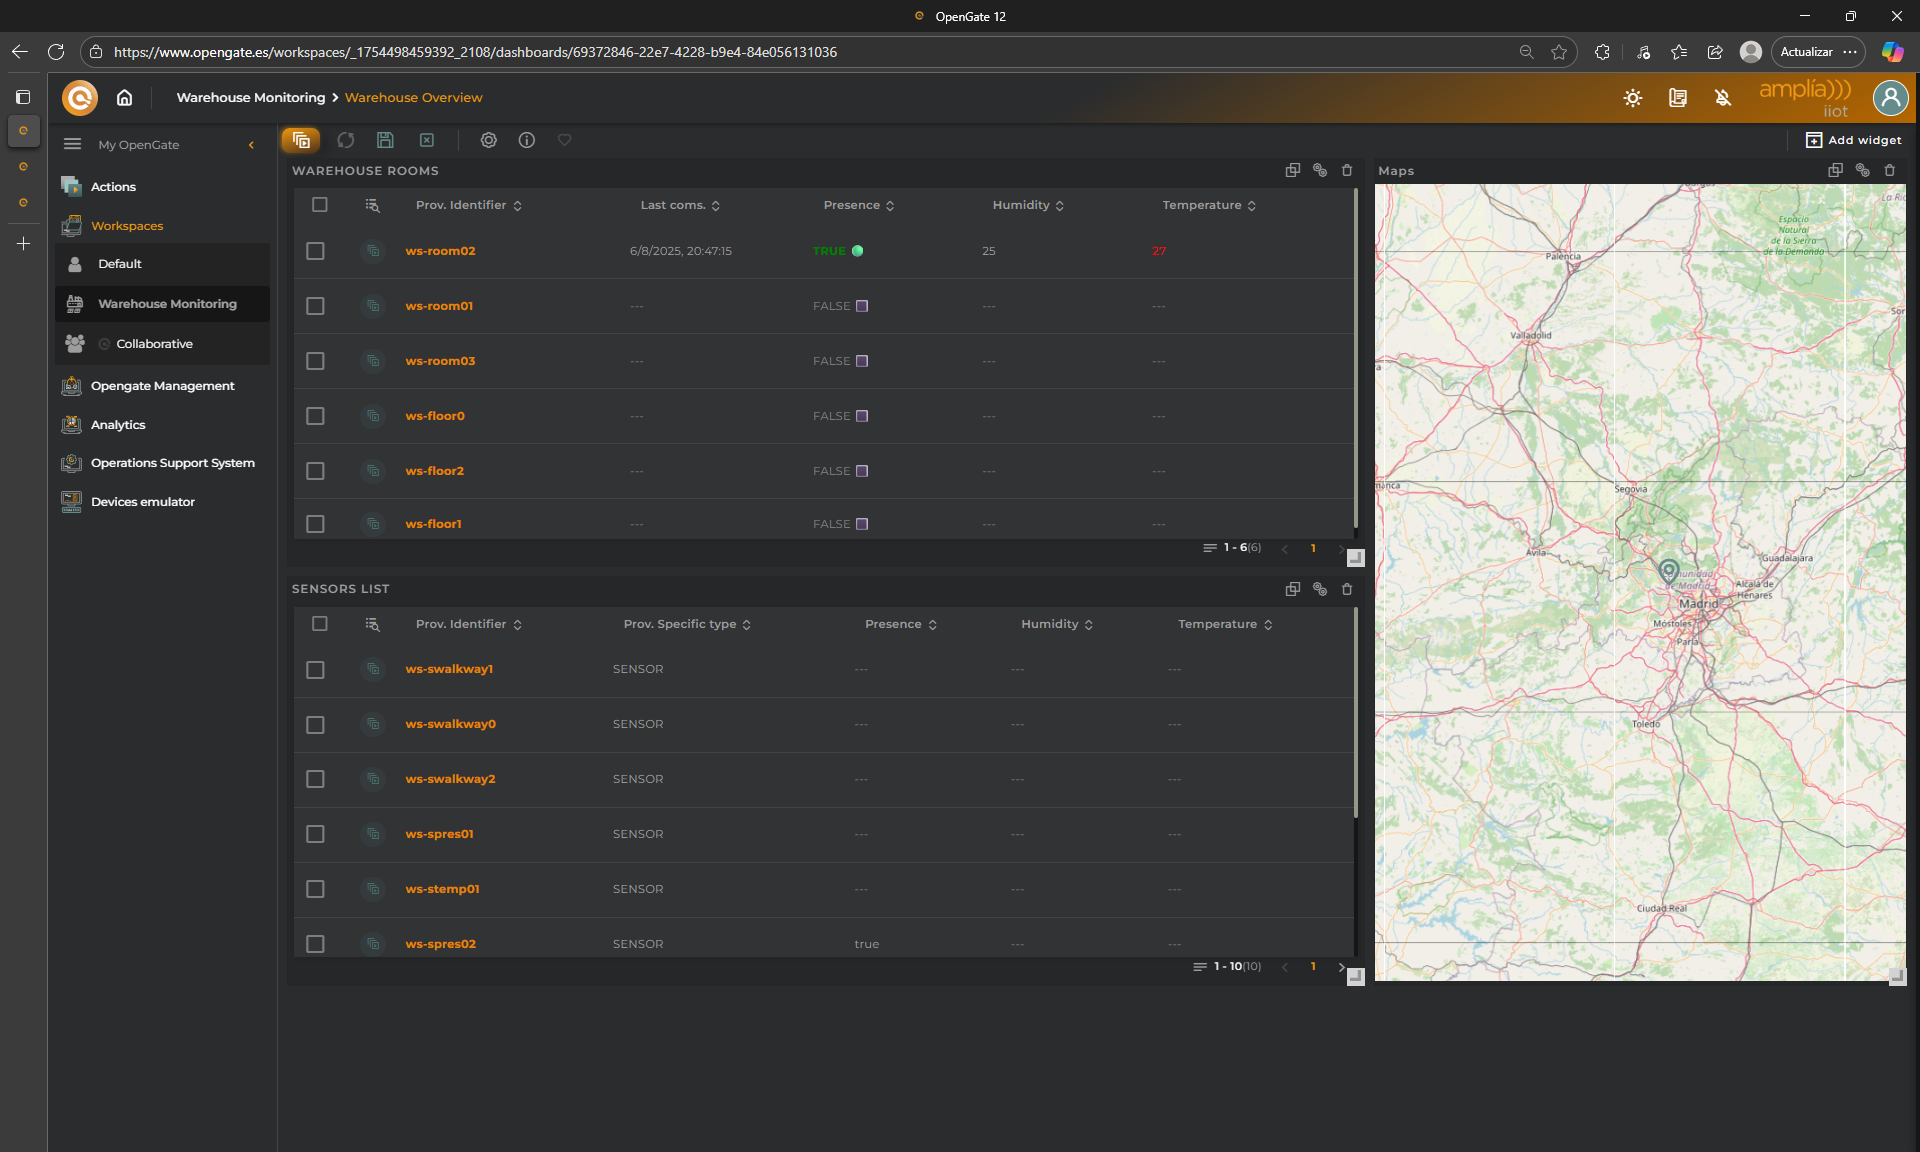
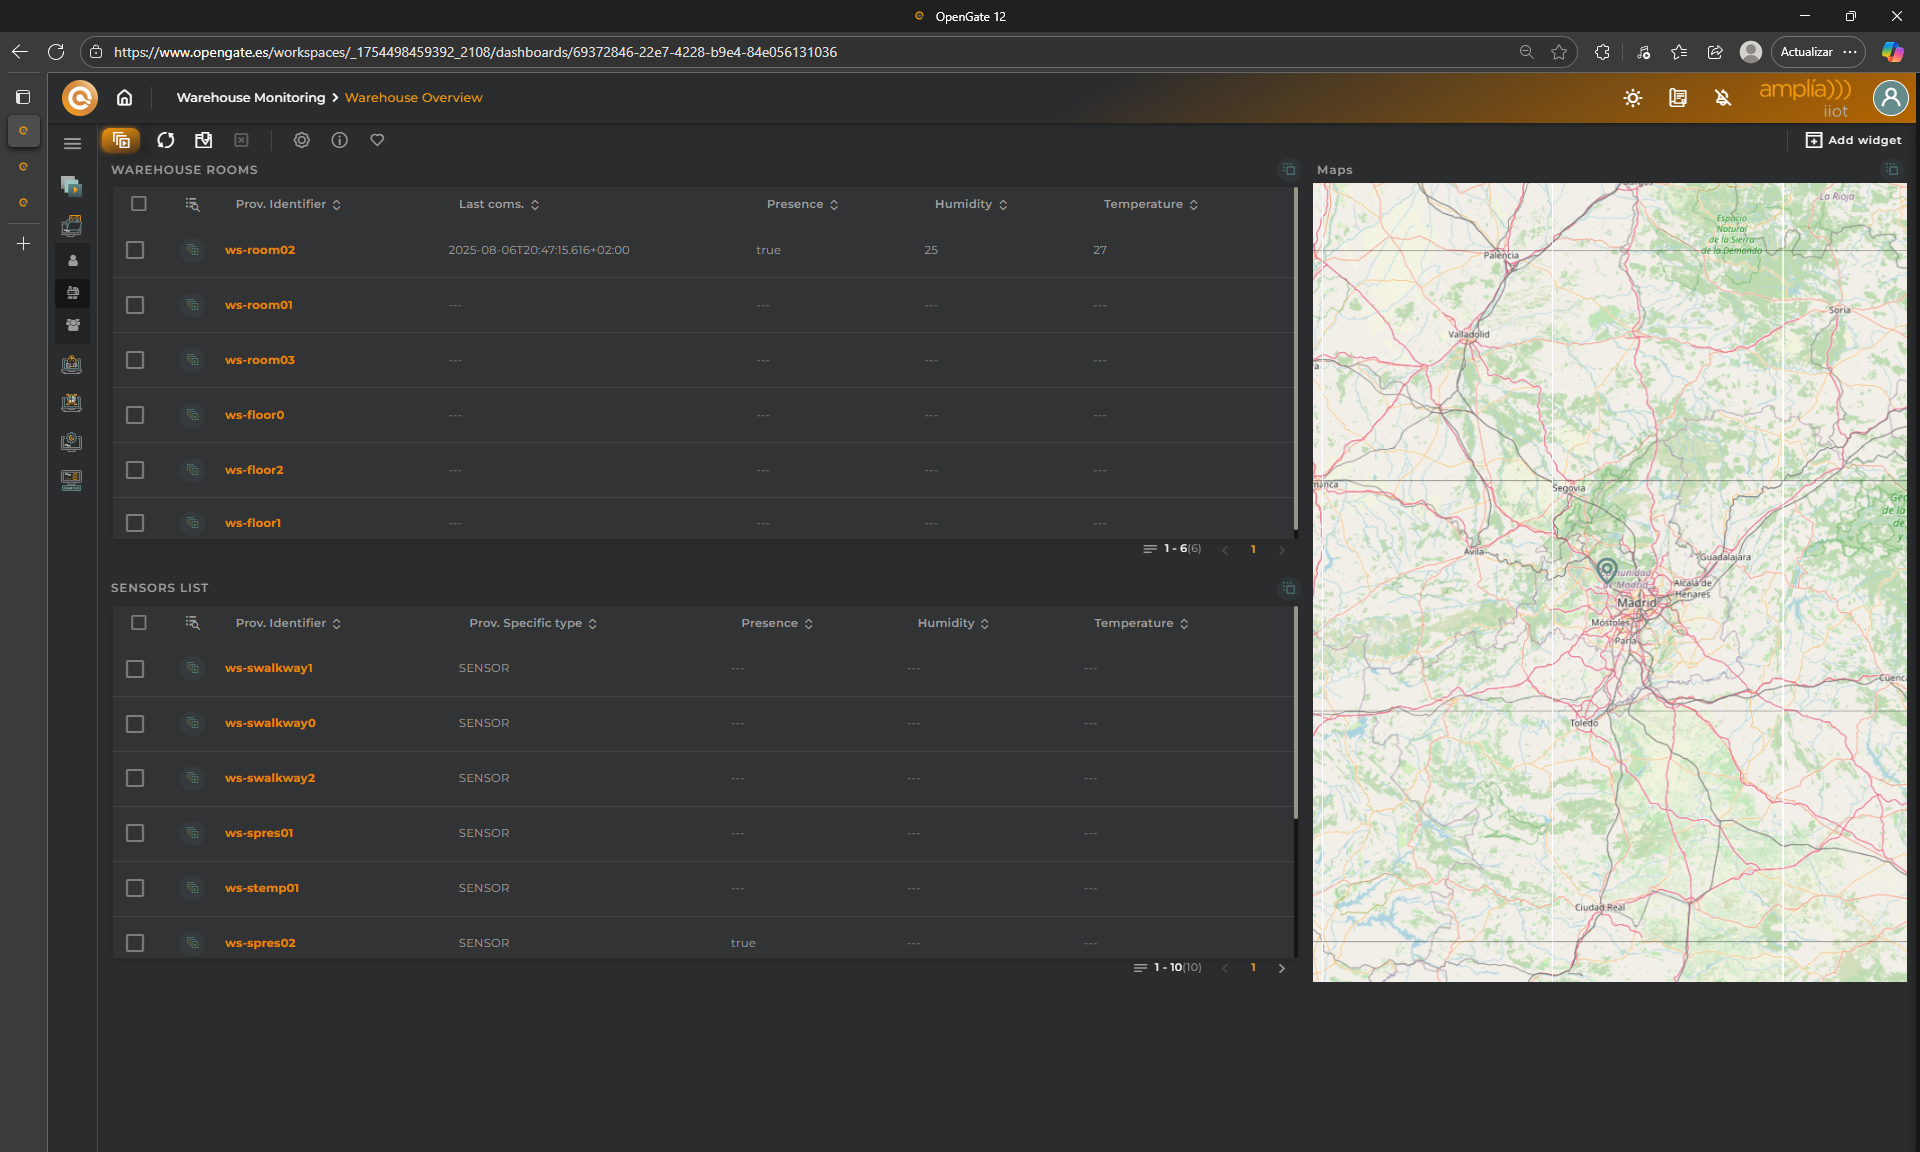
Repeat all the process and create another entities List widget filtered to show only devices and change the widget names to achieve this dashboard:
---
## 🎨 Applying Formatters
Although this may not be part of this basic tutorial, we think that will be relevant for you to know about this feature... Let's improve our dashboard to another level of customization using "**formatters**". This allows you to customize with all the power of web development and its native technologies HTML, CSS and javascript.
Here you have infinite possibilities so for this tutorial we will do the following to our "*WAREHOUSE ROOMS*" widget:
1. Format dates: The ISO format is not for everybody. Let's convert a raw ISO timestamp like `2026-01-01T12:00:00Z` into a readable date.
2. Temperature colors: Apply a code color for temperature datastream values
3. Presence indicator: Remark the presence detected
**NOTE**: We assume that you have knowledge in web development, HTML, CSS and javascript.
### 📅 1. Format dates
Formatters are both simple to use and incredibly powerful. Let's start with a formatter code to change date appearance.
1. Open the widget configuration and click on "**formatter**" on the column 'Last coms.'
2. Paste the code below, click on "**EVALUATE**" to check code errors, and "**OK**" to save your changes
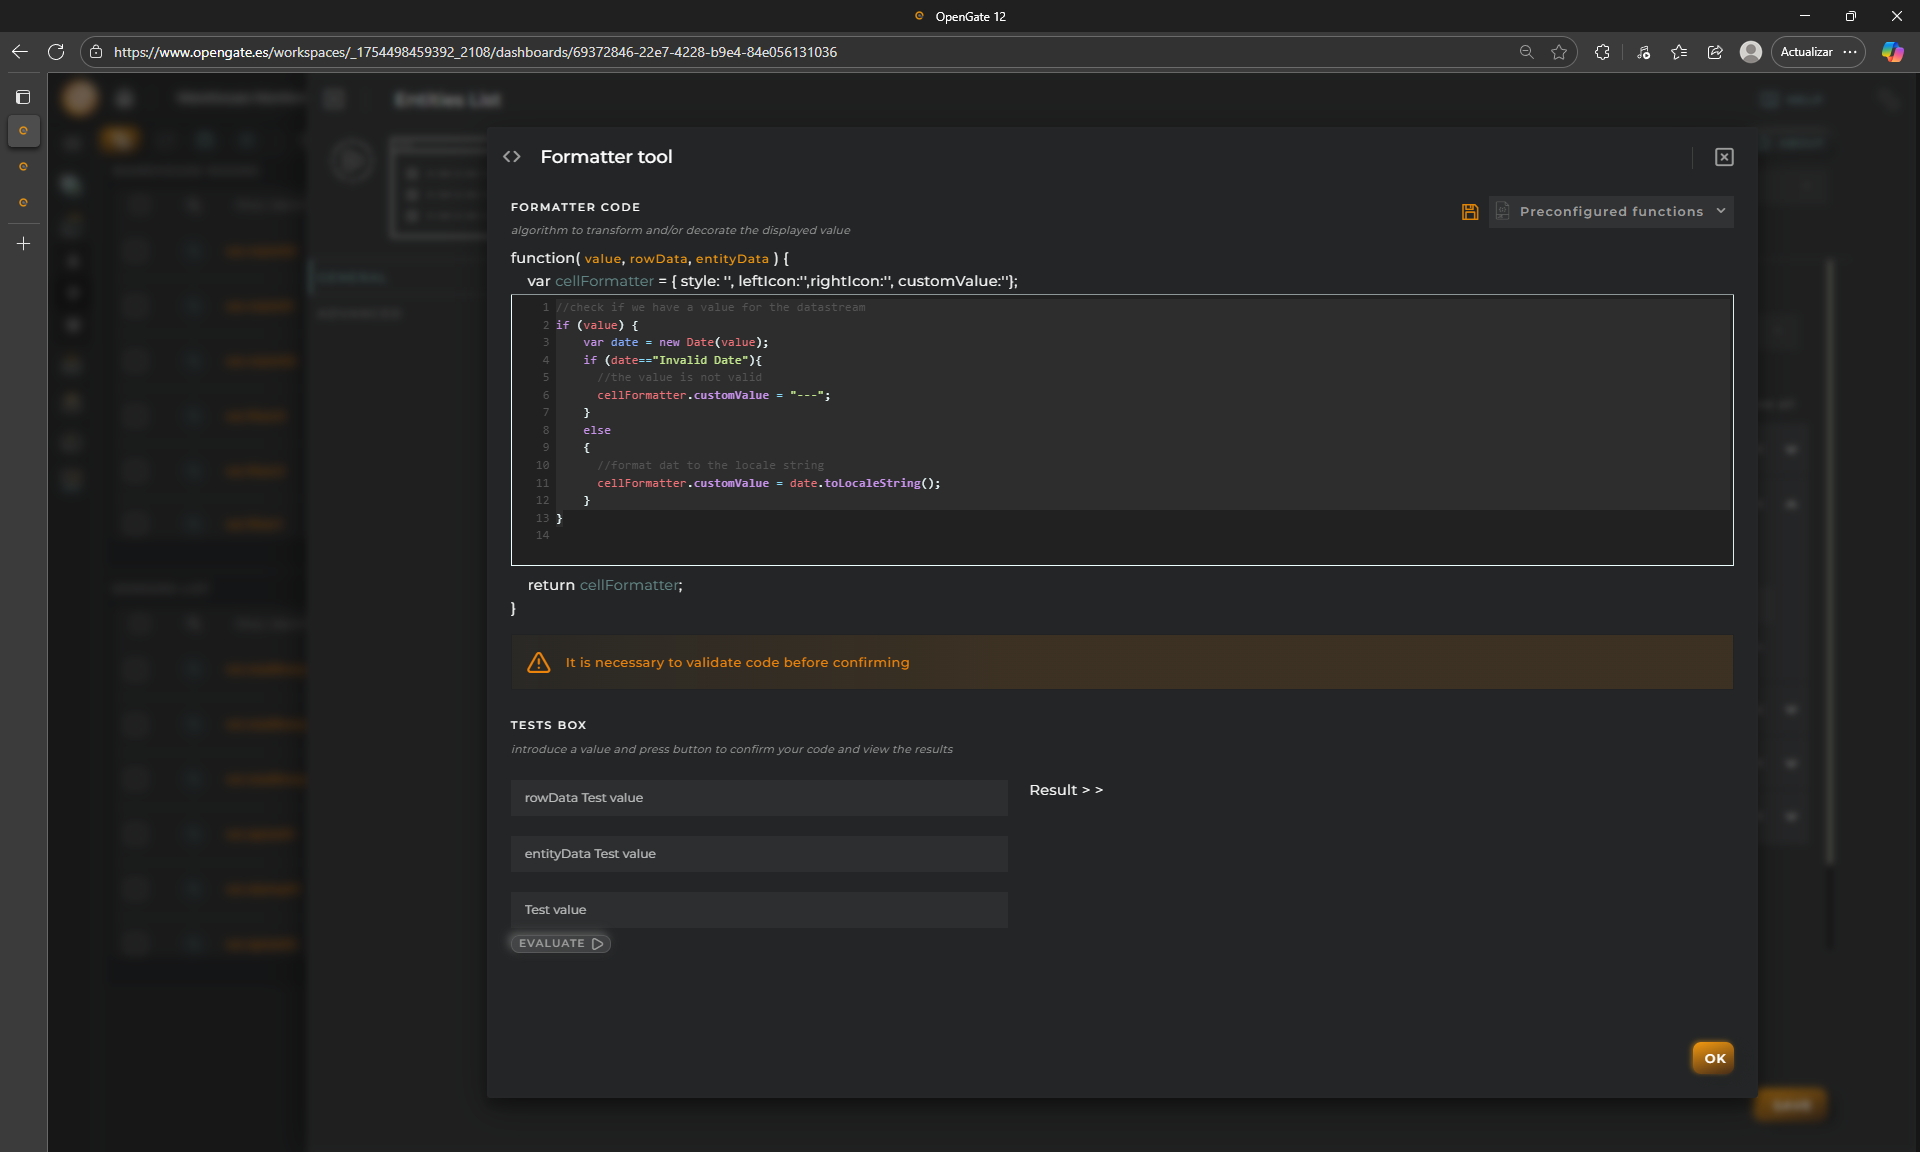
``` javascript
//check if we have a value for the datastream
if (value) {
var date = new Date(value);
if (date=="Invalid Date"){
//the value is not valid
cellFormatter.customValue = "---";
}
else
{
//format dat to the locale string
cellFormatter.customValue = date.toLocaleString();
}
}
```
### 🌡️ 2. Temperature colors
Repeat the process with the column `Temperature` and the code below
``` javascript
if (value) { //If value exists
if (value < 18){
// Cold
cellFormatter.style = 'color:lightblue;';
}else if (value >= 18 && value < 22 ){
// ideal temperature... using custom green color
cellFormatter.style='color:#20BB38FF;';
}else if (value >= 22){
//more than 22 ºC is hot...
cellFormatter.style='color:red;';
}else{
//grey
cellFormatter.style='color:#808080;';
}
}
```
### 👁️ 3. Presence indicator
One more time. Edit column `Presence`
``` javascript
if (value === true) {
//You can change the cell value for a custom one and even use emojis 🎉🎉!!
cellFormatter.style = 'color:green;';
cellFormatter.customValue = "TRUE 🟢";
} else {cellFormatter.customValue = "FALSE 🔳";cellFormatter.style = 'color:grey;';}
```
### 🎉 4. Check the result
Click on "SAVE" on the widget configuration and check the result... Pretty powerful, right?