Alarms and the Rules Engine
Alarms and the rules engine
Axiom Border decides locally. A probe that only forwards data is useless the moment the uplink drops, so alarm evaluation runs on the device, against data it already holds, with no dependency on the platform.
There are two ways to express what should raise an alarm:
| Mechanism | Use it for | Defined via |
|---|---|---|
| Checks — declarative rules | Thresholds, event matches, dead-machine detection | /checks API |
| Scripts — rules written in JavaScript | Anything with logic: correlation, state, arithmetic, calls to the AI model | /scripts API |
Checks cover most of what monitoring needs and need no code. Scripts exist for the cases checks cannot express.
Where you work with alarms
Alerts in the console is the operator’s view: the alarms currently raised, the history of what has been logged, and the Rules configuration button that opens the editor for the rules described below. An autoreload toggle keeps the list current while you watch an incident develop.
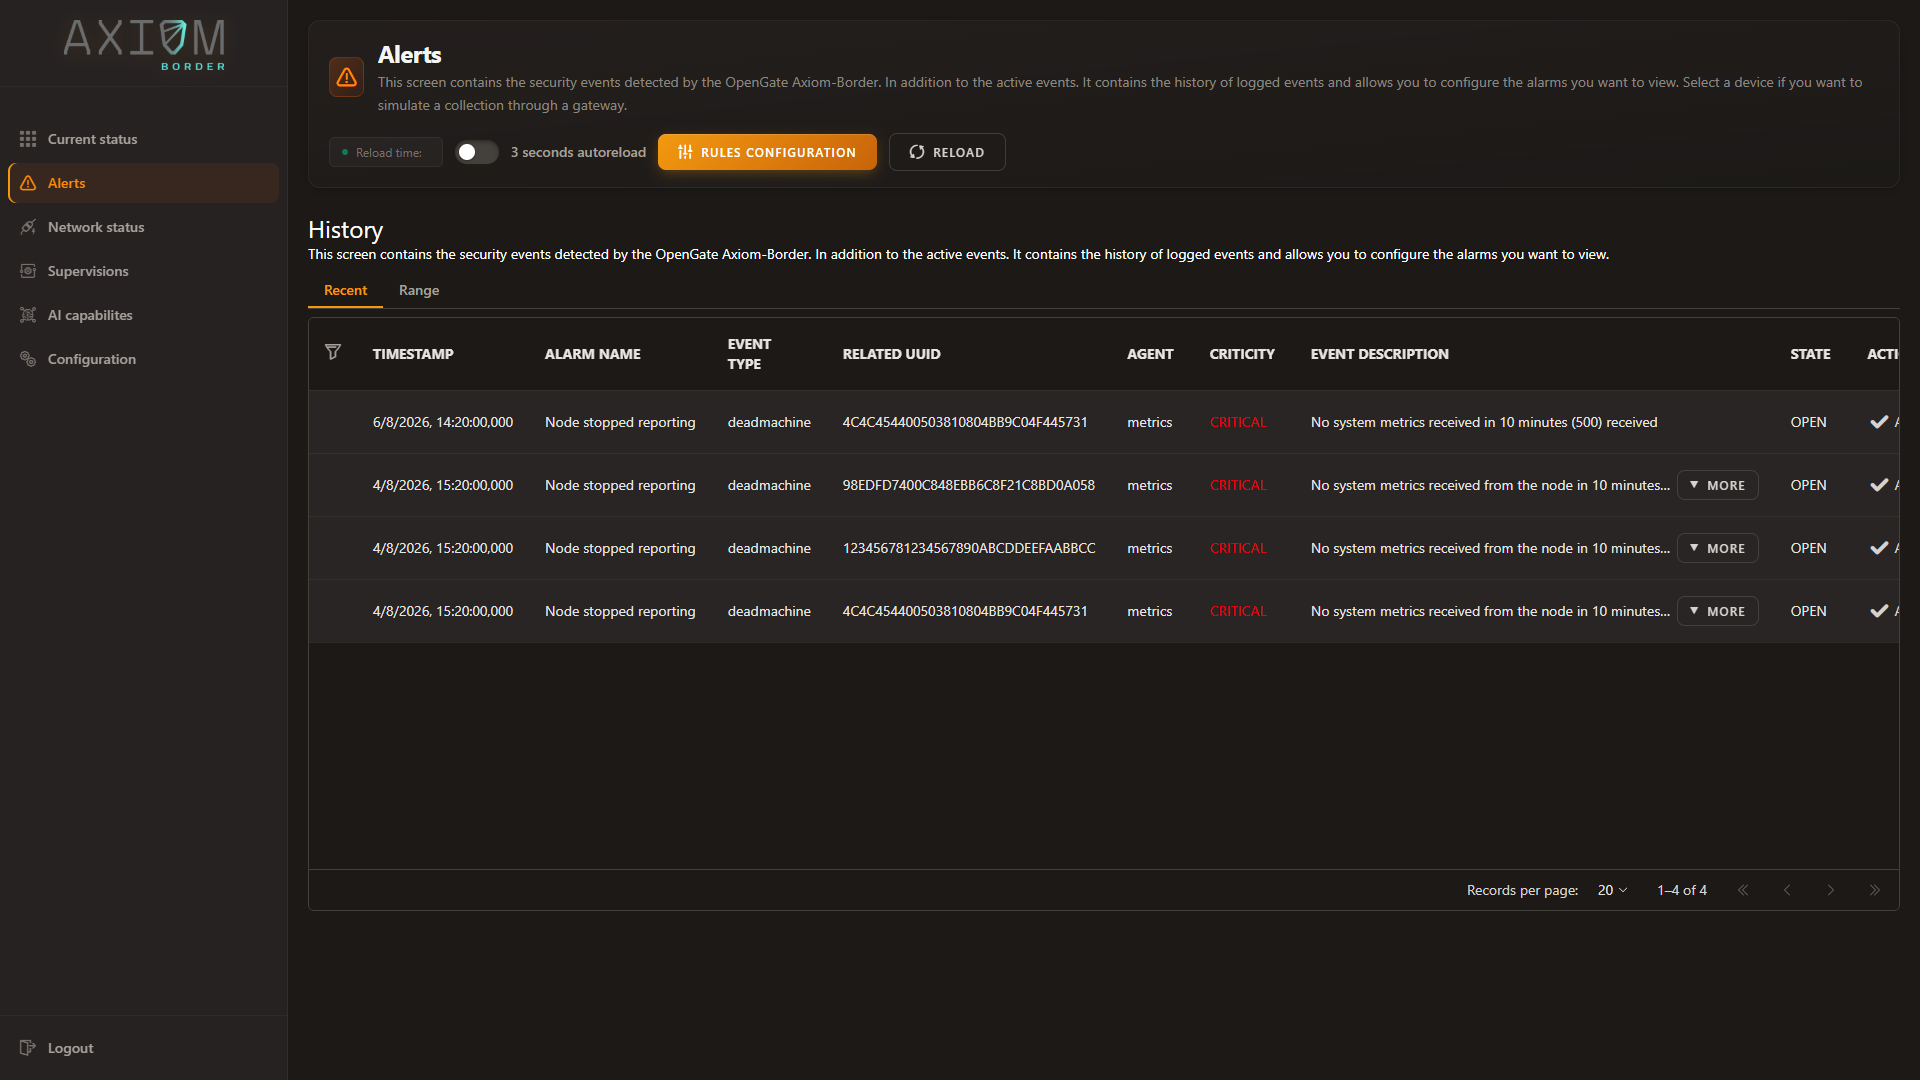
Each row names the alarm, the check type behind it, the node it came from, the agent, the severity and a description that includes when the condition was first seen. ACK acknowledges the selected alarm.
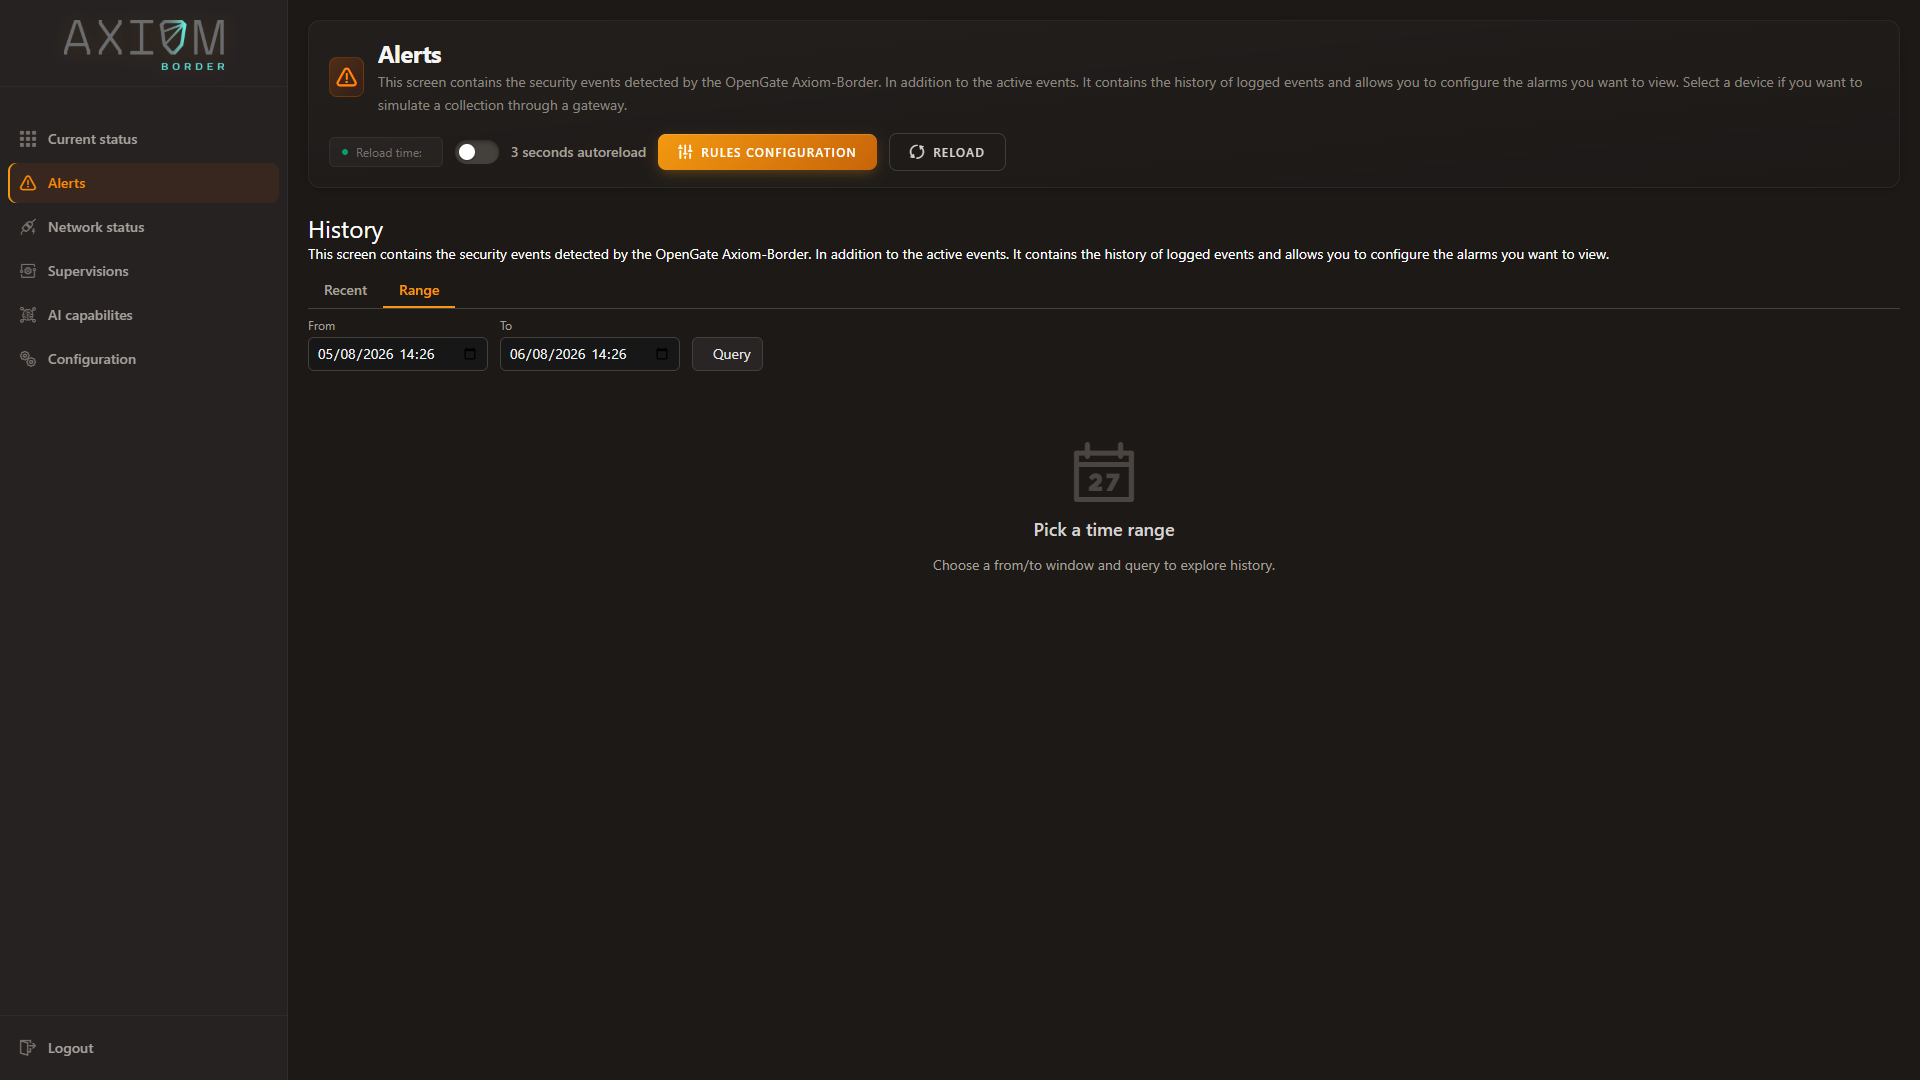
Two tabs sit above the table. Recent reads the live feed — the most recent alarms the probe already holds, answered immediately. Range queries a time window from history instead, which is what you want when reconstructing an incident after the fact:
Rules configuration opens the Alarm config screen, which is where both kinds of rule live — the declarative alarm rules in the upper table, and the JavaScript Expert System at the bottom with its own enable switch:
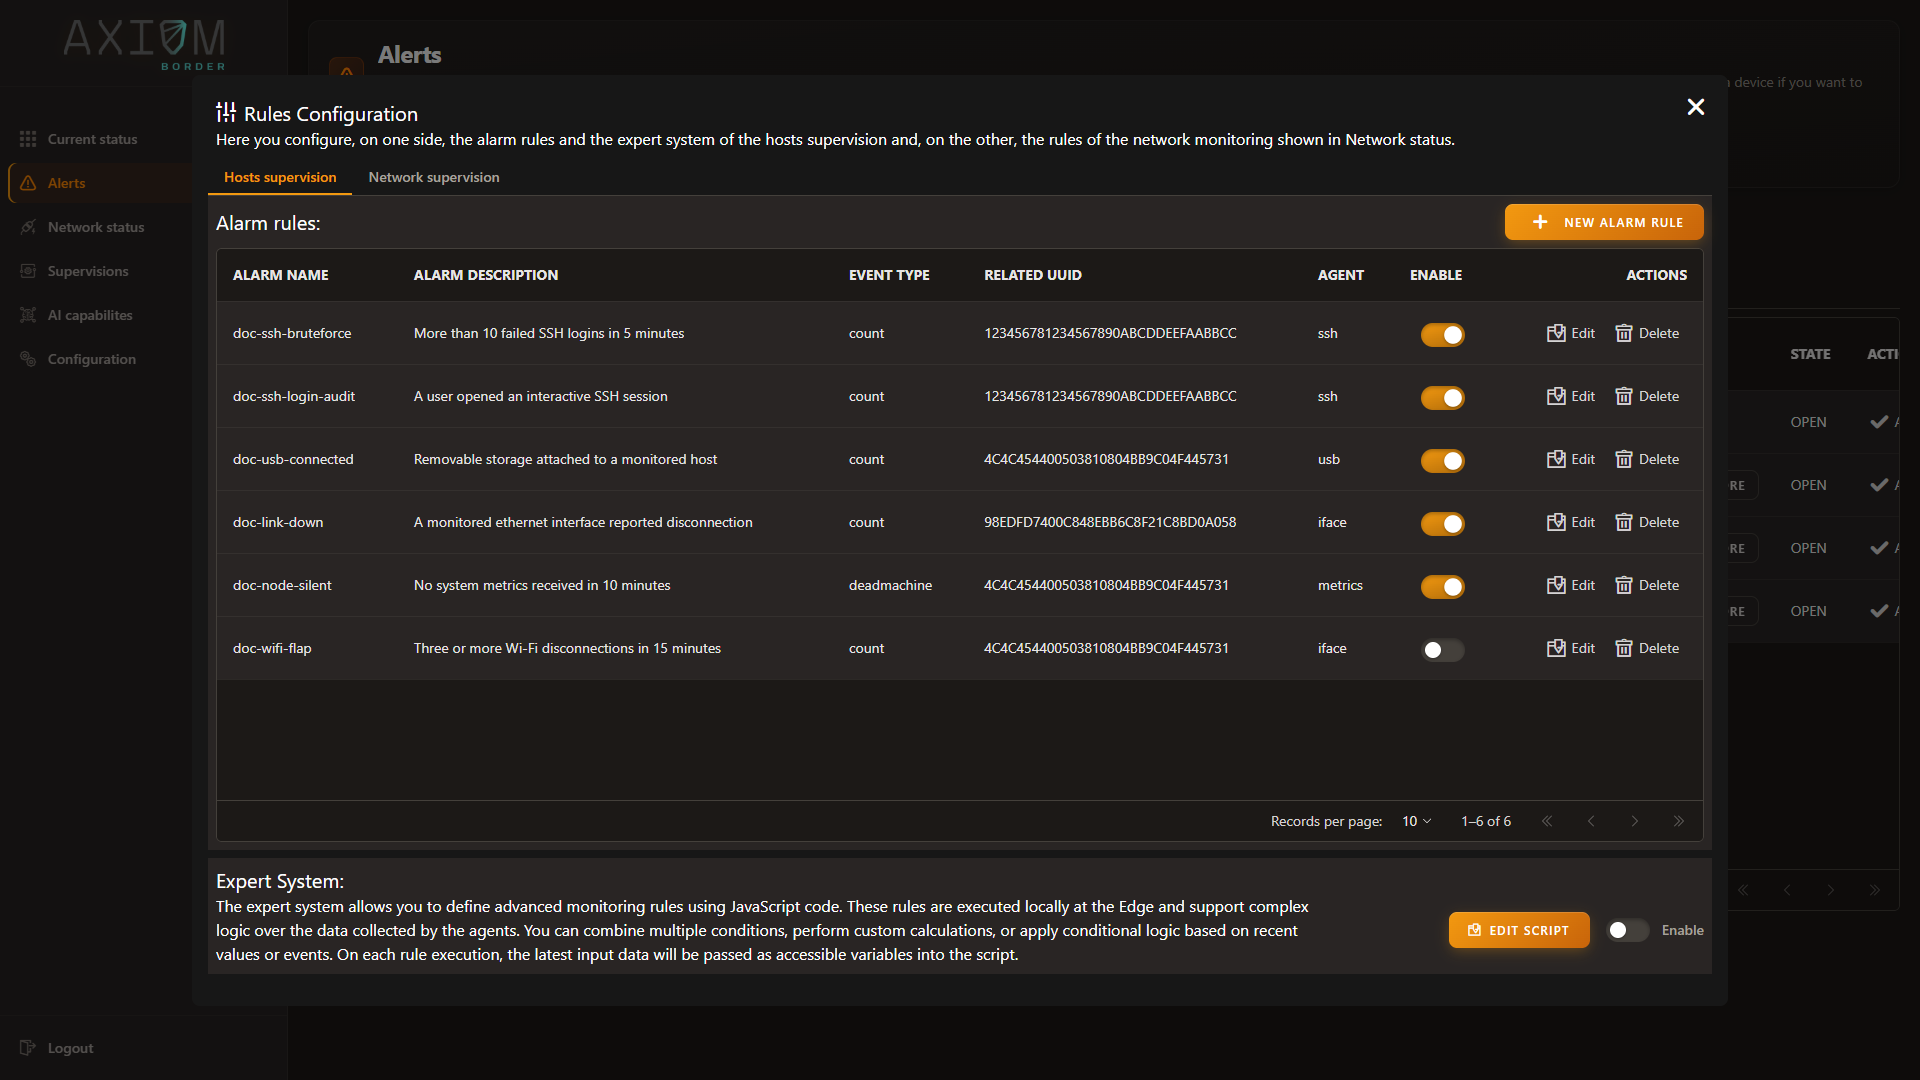
Everything on this page can be done from that screen or from the API, and both paths are shown together wherever they differ.
Checks — declarative rules
A check watches one event type from one agent over a time window, and raises an alarm when its condition holds.
flowchart TB
    EV["Event arrives"] --> MATCH{"Matches<br>a check?"}
    MATCH -->|no| DROP["Stored only"]
    MATCH -->|yes| TYPE{"Check type"}
    TYPE -->|count| CNT{"Count over<br>threshold?"}
    TYPE -->|deadmachine| SILENT{"Silent for<br>the window?"}
    CNT -->|no| WAIT["Keep counting"]
    CNT -->|yes| FIRE["Raise alarm"]
    SILENT -->|yes| FIRE
    FIRE --> COAL{"Alarm<br>already open?"}
    COAL -->|yes| INC["Increment count"]
    COAL -->|no| NEW["New alarm"]
The two check types
ctype |
Fires when | threshold |
|---|---|---|
count |
The event occurs at least threshold times within freqs |
Required |
deadmachine |
No events arrive from the node within freqs |
Not used, send 0 |
deadmachine is the one worth calling out: it alarms on absence, which is how you detect a node that
stopped reporting rather than a node reporting something bad.
Alarming on every occurrence
To raise an alarm whenever an event happens at all, use a count check with "threshold": 1 and a short
freqs. The first matching event trips the condition immediately.
Creating a check
From Alerts → Rules configuration, use New alarm rule. The wizard walks three steps — Rule config, Alarm config and Summary — and collects exactly the fields described above:
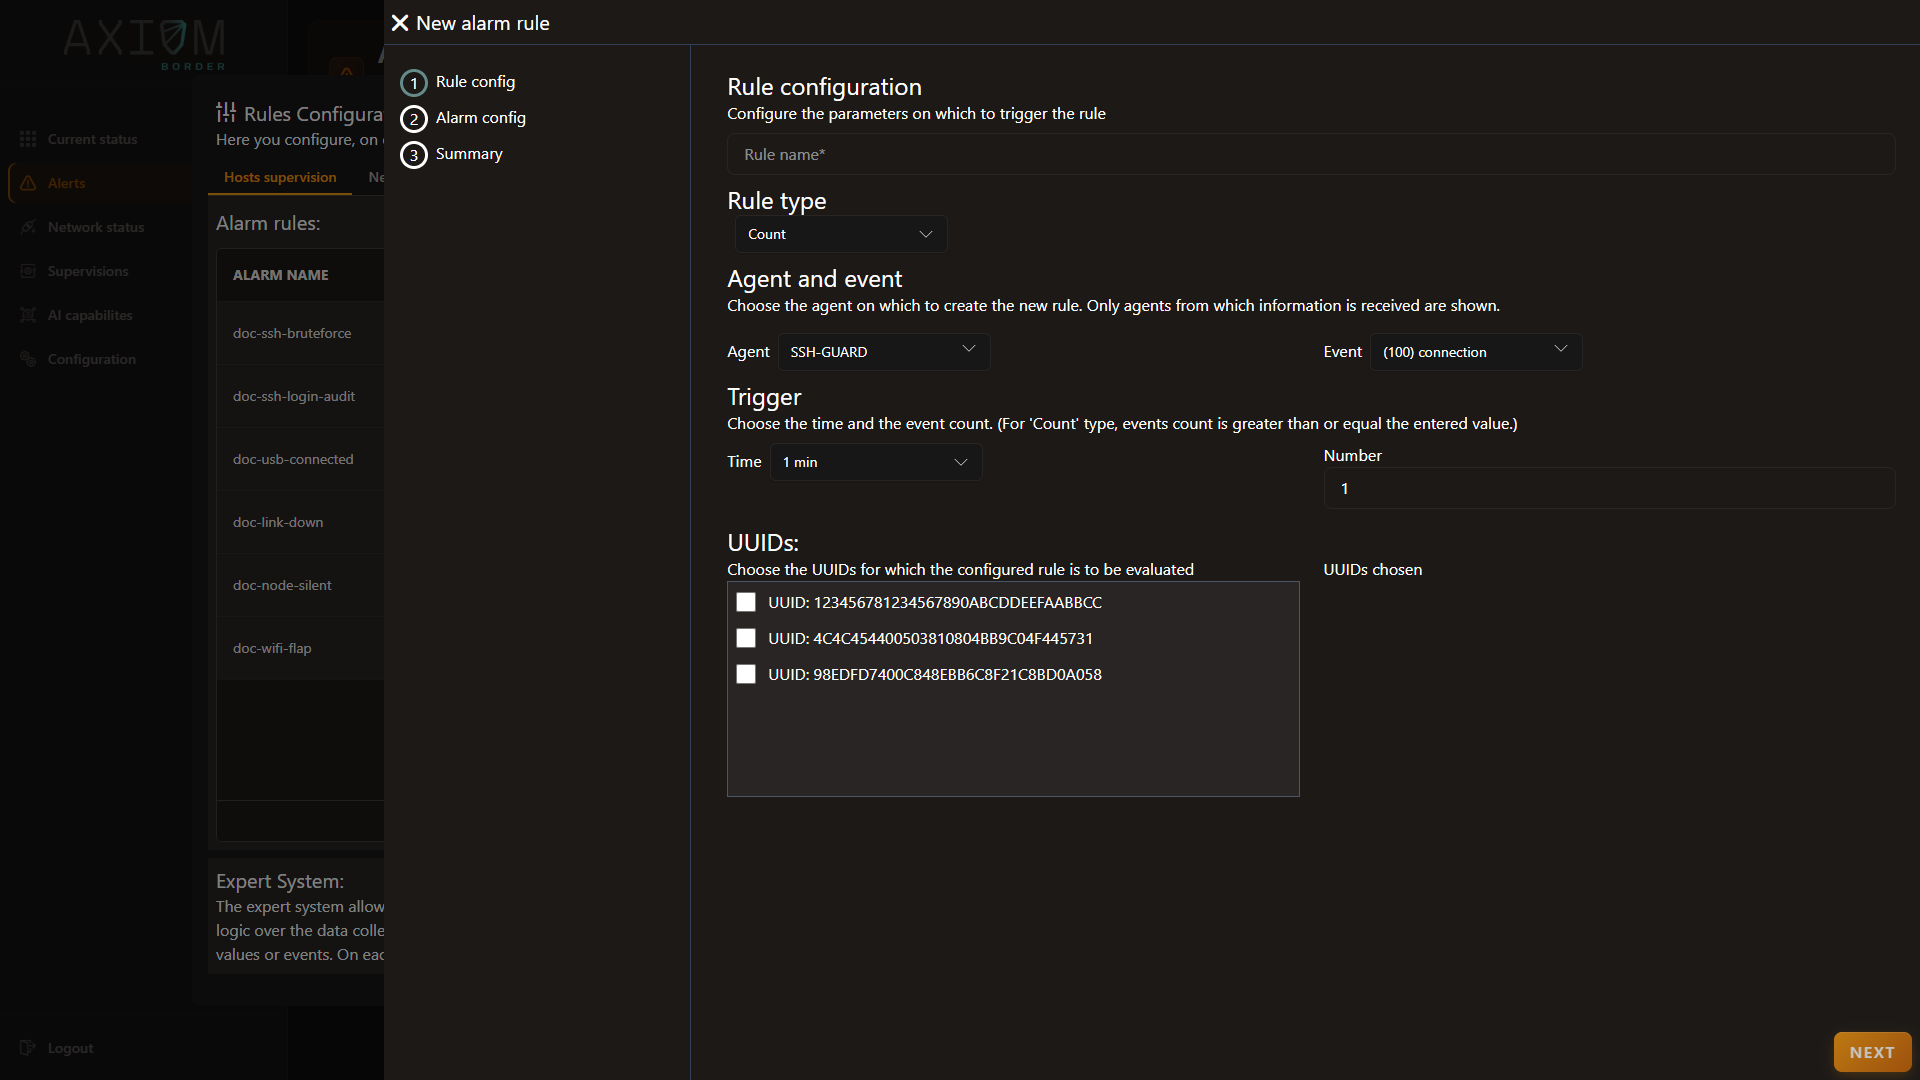
Rule type is the check type, Agent and event choose what to watch, Trigger sets the window and the count, and UUIDs selects the nodes. Only agents actually reporting in are offered, which is why a rule cannot be created before its agent has sent data.
Every field is required on create. freqs is a duration string — 30s, 5m, 1h. level is info,
low, medium, high or critical. uuids lists the nodes the check applies to, and accepts alias names when
the request carries ?alias=true.
A worked example: catching a node that went quiet
The most valuable check is usually the one that alarms on silence. In the wizard, choose dead machine as the rule type, pick the agent that reports the node’s health, set the window to something comfortably longer than its reporting interval — ten minutes against a one-minute heartbeat — and select the nodes it applies to.
There is no threshold to set: the condition is that nothing arrived. Give the alarm a name an operator will understand at three in the morning, such as Node stopped reporting.
Managing checks
The rules table on Alerts → Rules configuration lists every check, and each row carries its own edit and delete actions. Editing reopens the same wizard.
Three things cannot be changed after creation
Editing a check keeps its rule type, its agent and its event. To change what a check watches, or how it evaluates, delete it and create it again. Everything else — threshold, window, severity, alarm text, nodes, whether it is enabled — edits normally.
To pause a check without losing its definition, switch it off rather than deleting it.
Alarm coalescing
A brute-force attempt that trips a threshold every five minutes for an hour should be one alarm with a count, not twelve identical alarms. Axiom Border coalesces repeated firings of the same rule against the same node into a single open alarm:
| Field | Meaning |
|---|---|
firstSeen |
When the condition first held |
lastSeen |
The most recent firing |
count |
How many times it has fired |
The alarm stays open and accumulating until someone acknowledges it. Acknowledgement is what closes the coalescing window — the next occurrence after an acknowledgement opens a fresh alarm, so the operator gets a new signal rather than a silent increment on something they already dealt with.
Acknowledging
Select the alarm on the Alerts view and use ACK. It is marked as seen, with who acknowledged it and when.
If someone else got there first, the action is refused rather than applied twice — worth knowing when two operators are working the same incident.
Reading alarms
The two tabs above the table reach the same events by different routes:
| Tab | Reads | Use it for |
|---|---|---|
| Recent | The probe’s live in-memory feed | Watching an incident unfold. Answers instantly, however much history the probe holds |
| Range | The stored history over a time window | Reconstructing what happened after the fact |
Columns filter individually, and the autoreload control keeps the list current while you watch.
Each alarm carries its name and description, the check type behind it, the node and agent it came from, its severity, when it was raised, whether it has been acknowledged, and the coalescing trio of first seen, last seen and count.
A small tolerance window absorbs clock skew
Evaluation applies a short grace period — ten seconds by default — around each window boundary, so an event landing milliseconds outside one is still counted. Without it, a node whose clock drifts slightly would silently miss conditions it genuinely met.
Rule scripts
For logic that a declarative check cannot express, Axiom Border runs rule scripts written in JavaScript. They are evaluated on the device, server-side, on events you did not trigger.
In the console these are the Expert System, edited from Alerts → Rules configuration → Edit script. The editor opens on a working skeleton, so you can see the shape a script must have before writing one:
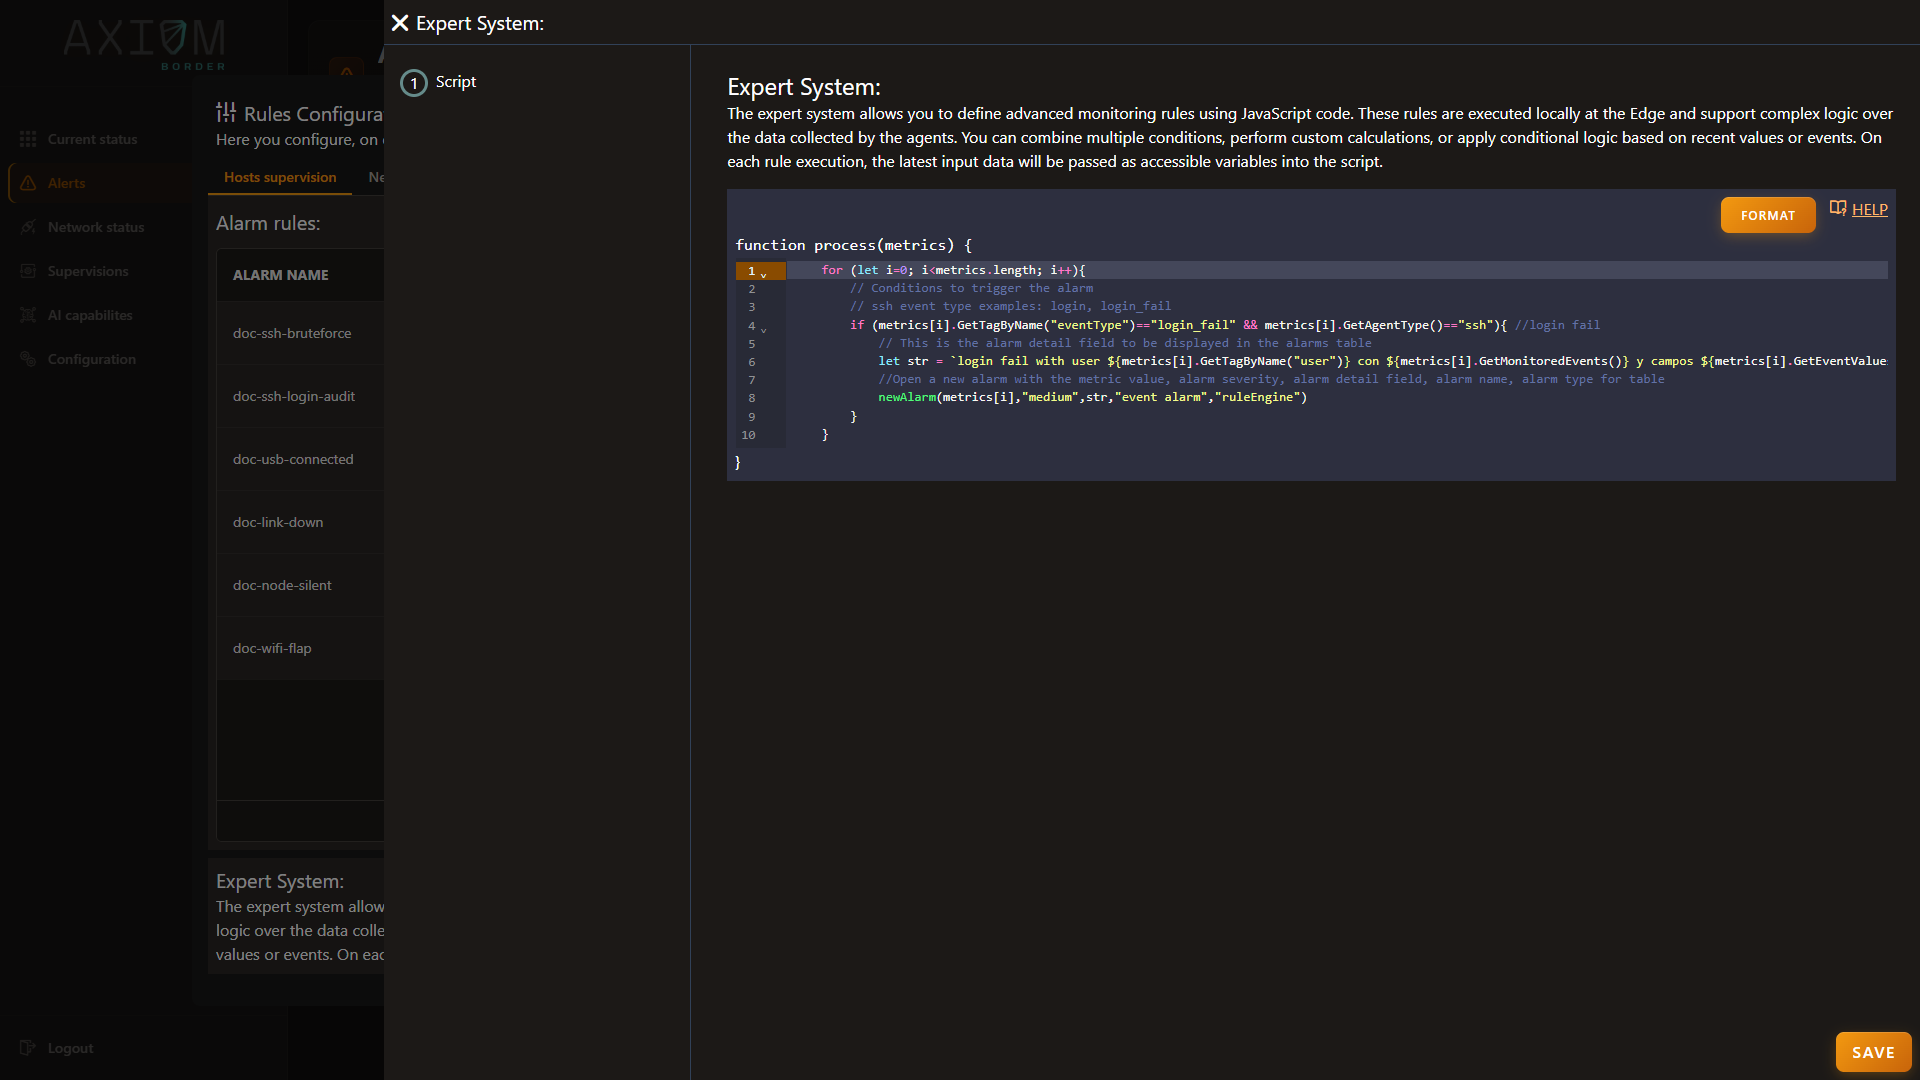
Note the Enable switch beside the editor on the Alarm config screen: a saved script does nothing until it is turned on.
How scripts are organised
A script is identified by name, and the name determines when it runs. Scripts named after an agent —
ssh, iface, usb, metrics — run on events for that agent. Scripts named after a probe — network,
vulns, snmp, sniff — run on that probe’s findings. A general-purpose rulesengine script runs over
every ingested batch.
Every script has an enabled state, set with the ?enabled= query parameter when you upload it and
reported by GET /scripts. A disabled script is stored but never invoked.
The script contract
A script must define a function called process, which receives the batch of metrics:
metrics is not a real JavaScript array
Iterate it by index with .length, as above. .filter(), .map() and .forEach() are not available
and will throw. This is the single most common mistake when writing a first rule.
SetT0() and SetT1() bracket your processing and are what populate the timing fields in the audit
record. They are not required for the rule to work, but including them is the convention and it makes
slow rules visible.
Available globals
| Function | Purpose |
|---|---|
newAlarm(metric, criticality, description, alarmName, eventType) |
Raise an alarm |
newPredict(payloadJSON, agentType) |
Call the AI model for inference |
newGetMetrics(agentType) |
Fetch the AI model’s own metrics |
filterByIp(metrics, ip) |
Subset of the batch matching an IP |
filterByProbe(metrics, probe) |
Subset matching a probe name |
distinctIps(metrics) |
Distinct IPs, in first-appearance order |
print(...) |
Write to the log at debug level |
Each metric exposes: GetTagByName(key), GetFieldByName(key), ExistsField(key), GetMetricName(),
GetAliasName(), GetAgentType(), GetMonitoredEvents(), GetEventValues(), GetTime(), SetT0(),
SetT1() and String().
A worked example, raising an alarm when a scan finds a risky port open:
The tags and fields available per probe are documented in the header comment of each deployed script, so
read the script with GET /scripts/{scriptname} before writing rules against it.
What probe rules can react to
Probe rules react to appearances and changes: a new host, a new open port, a changed SNMP value. To
alarm on a node that stops responding, use a deadmachine check against that node’s agent data instead —
that is exactly what checks on absence are for.
Saving and enabling a script
Everything happens in the Expert System editor on the Alarm config screen: write or paste the script, save it, and use the Enable switch beside it.
A saved script does nothing until it is enabled
Saving and enabling are two separate actions, and the most common report of “my rule never fires” is a saved script with the switch still off. The editor shows the switch right next to it for exactly this reason.
Scripts can also be managed through the API — /scripts lists them with their enabled state, and each
one can be read, replaced or deleted by name. That is what an automated deployment would use; from a
browser the editor is the shorter path.
Always set a script timeout
Each script invocation is bounded by gojaTimeout. Define it explicitly: without a value the limit is
zero and no script runs at all, which shows up as missing alarms rather than as an error. The shipped
value is 8s.
Scripts can call the AI model
A script can invoke inference against a deployed AI capability, using the predict endpoint configured
under trainerDetails.predict. This is what connects anomaly detection to alarm generation: the model
scores an event, and the script decides whether that score warrants an alarm.
Timeouts and retries for that call come from trainerDetails.predict — default 10 s, one retry. Note
that the call is bounded by gojaTimeout as well, so a predict timeout longer than the script timeout
cannot complete. Keep gojaTimeout comfortably above the predict timeout if your rules use inference.
See AI capabilities for deploying a model in the first place.
Security probe results reach the rules engine too
Security probe findings are evaluated by the rules engine and audited exactly like agent metrics. A scan finding can therefore raise an alarm the same way a metric can — a newly discovered host, a critical vulnerability, a port that opened when it should not have. See Security probes.
Choosing between a check and a script
Reach for a check when the condition is “this event, this many times, this window”. It is declarative, visible in the API, and cannot fail in interesting ways.
Reach for a script when you need to remember something between events, combine two signals, compute a value, or ask the model. The cost is that scripts are code: they need a timeout that works, they fail in ways checks do not, and they are harder to audit at a glance.
If a check can express it, use the check.
Where alarms go next
Locally, alarms land in eg_alarms and surface through the feeds above and in the web console.
If OpenGate integration is enabled, alarms and executions also publish over the embedded MQTT broker and are forwarded to the platform, which is how a fleet of probes becomes a single operational picture. See MQTT and OpenGate operations.