Metrics Ingestion and Audit
Metrics ingestion and audit
Axiom Border’s data comes from two origins. The first one the probe captures by itself: the traffic it sniffs and the scheduled scans it runs against the network around it, with no cooperation from the equipment it watches. The second one is reported to it: every monitored machine runs an oda-lite agent that watches the machine from the inside and sends what it sees.
flowchart TB
    NET["The network around<br>the probe"]:::ext
    MACH["The monitored machines<br><i>an oda-lite agent on each</i>"]:::ext
    NET -->|"sniffing and<br>scheduled scans"| P["<b>Axiom Border</b>"]
    MACH -->|"SSH · USB · interface<br>· health events"| P
    P --> ST[("Metrics store<br><i>history and exports</i>")]
    P --> LP["Live pipeline<br><i>rules · alarms · audit</i>"]
    classDef ext fill:#e9edfa,stroke:#486ac9,color:#101010
Whatever the origin, the data ends in the same two places: the metrics store, which keeps the history behind queries and exports, and the live pipeline, where rules are evaluated, alarms are raised and the audit trail is written. This page follows that flow — the two origins first, then the pipeline, then how to read everything back.
What the probe captures by itself
The network-facing half needs nothing installed on the monitored equipment:
- Traffic capture — continuous sniffing of the configured interfaces, persisted periodically to
the
networktrafficbucket. Configured undersecurityProbes.sniffing. - Scheduled assessments — the discovery, vulnerability and SNMP probes run on their configured
intervals, keep the asset inventory current, and record per-scan aggregates (
scanmetrics) and host up/down state (availability).
Both are documented in Security assessment. What matters on this page is that
their results are data like any other: they land in the store, their executions are audited, and the
audit log’s agent filter accepts the probe names (network, vulns, snmp, sniff) alongside the
agent channels.
What the agents report
The host-facing half is delivered by oda-lite, a lightweight monitoring agent that ships alongside
Axiom Border as a separate component with its own release cycle — the version you have is the one your
package includes. It is the whole of the monitoring deployment role: a machine with that role runs
only the agent, reporting to a central probe. The probe’s own machine runs one too, so the central host
is watched exactly like every other node.
An agent watches four things, and each maps to a channel — the “Guards” of the console views:
| Channel | In the console | What arrives |
|---|---|---|
ssh |
SSH-Guard | SSH activity: connections, successful and failed logins, logouts, per-session byte counters — tagged with user, ip and port |
iface |
IFACE-Guard | Network interfaces appearing, disappearing or changing state, with the interface name, type and MAC address |
usb |
USB-Guard | USB devices connected and disconnected, with device names, ID and manufacturer |
metrics |
METRIC-Guard | The node’s reporting-health heartbeat: ram_usage, prepared_vars and sent_vars. Its silence is what a node stopped reporting alarm keys on |
Those four names are what the API calls {agentType}: they appear in the read paths
(/recent/{agentType}), in the audit log’s agent filter, and as the group routing tag on every
event.
flowchart TB
    AG["oda-lite agents<br>on each machine"]:::ext
    OTH["Other reporters<br><i>optional</i>"]:::ext
    AG -->|":9090/agents<br>line protocol"| COL["oda-lite on the probe host<br><i>central profile</i>"]
    OTH -->|":9091/metrics<br>JSON"| COL
    COL -->|"one bucket<br>per channel"| ST[("Metrics store")]
    COL -->|"POST /telegraf"| LP["Live pipeline<br>rules · alarms · audit"]
    classDef ext fill:#e9edfa,stroke:#486ac9,color:#101010
On the probe host, oda-lite runs in its central profile: besides watching its own host, it listens for everyone else on two ports —
| Listener | Format | Who posts there |
|---|---|---|
:9090/agents |
InfluxDB line protocol | The oda-lite agents on the monitored machines |
:9091/metrics |
JSON | Other reporting processes. A metric arriving without a channel tag that carries the reporting-health fields is routed to the metrics channel automatically |
Everything it receives — its own guards’ events included — goes two ways at once: each channel is written to its bucket in the metrics store, and every event is forwarded to the probe’s live pipeline, so rules, alarms, audit and the recent feeds see it immediately.
Two operational handles worth knowing:
- The agent is a systemd service on every node:
systemctl status oda-lite. Its configuration is generated by the installer at/etc/oda-lite/oda-lite.conf— this is also where the listener ports move if 9090 or 9091 collide with something else. - Agents buffer briefly and flush every few seconds, so an event appears in the console with at most a few seconds of delay — instantly is the wrong expectation, but a minute is a problem.
SSH events need verbose sshd logging
The SSH monitor reads authentication logs, which means sshd must log at LogLevel VERBOSE and
rsyslog must be populating /var/log/auth.log. The installer configures both for the roles that need
them. On a host where SSH events never appear, check those two things first.
Seeing what is reporting in
Supervisions in the console lists the channels the probe is receiving data from. Each card is one channel, with a status dot, the last event it delivered, and the nodes it is monitoring.
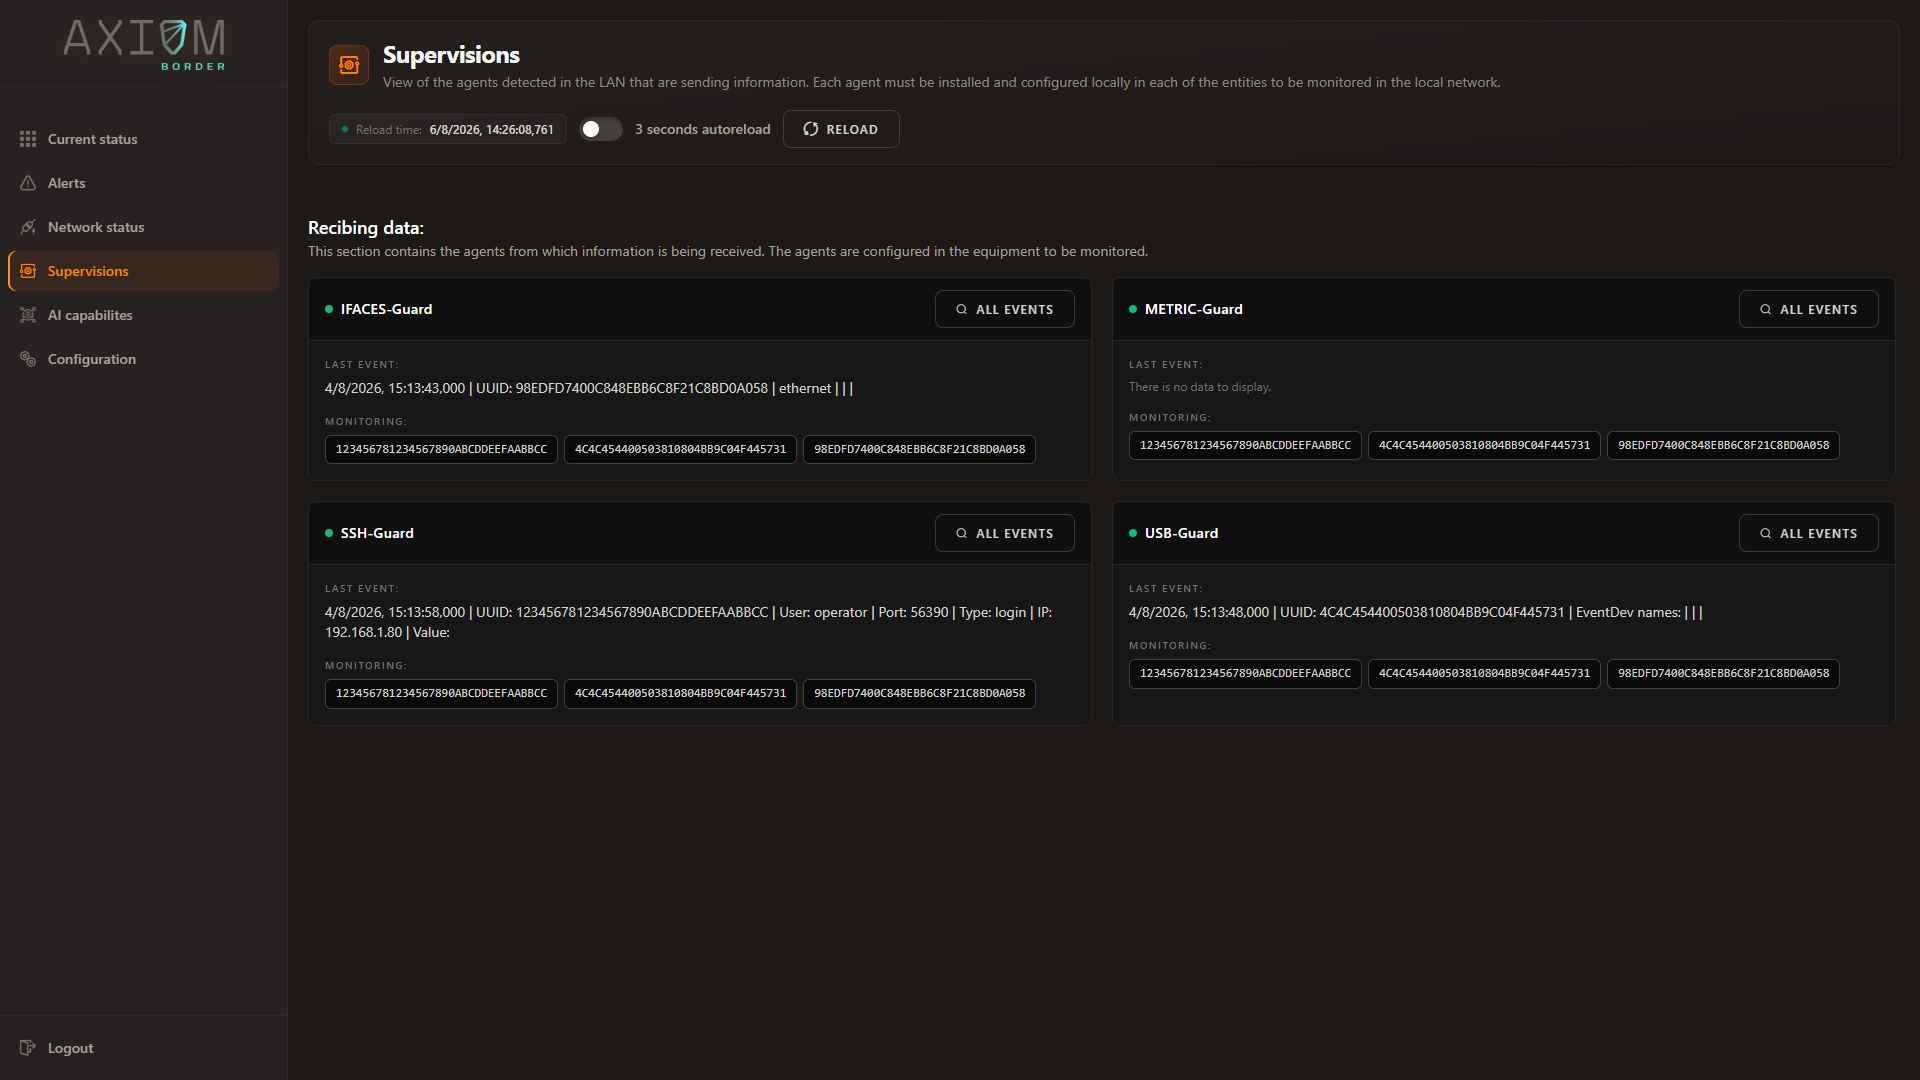
This is the first place to look when data is not arriving: a channel with no recent event means the agent has either stopped, or never reached the probe. In the capture above METRIC-Guard is in exactly that state — there is no data to display. All events opens the full history for that channel.
The same data, turned around — Hosts Status
Supervisions answers which channels are reporting. Hosts Status answers how is each machine doing, which is the same data indexed the other way: one block per node, a status dot per monitor, the last event each one delivered, and the alarms currently open against that node.
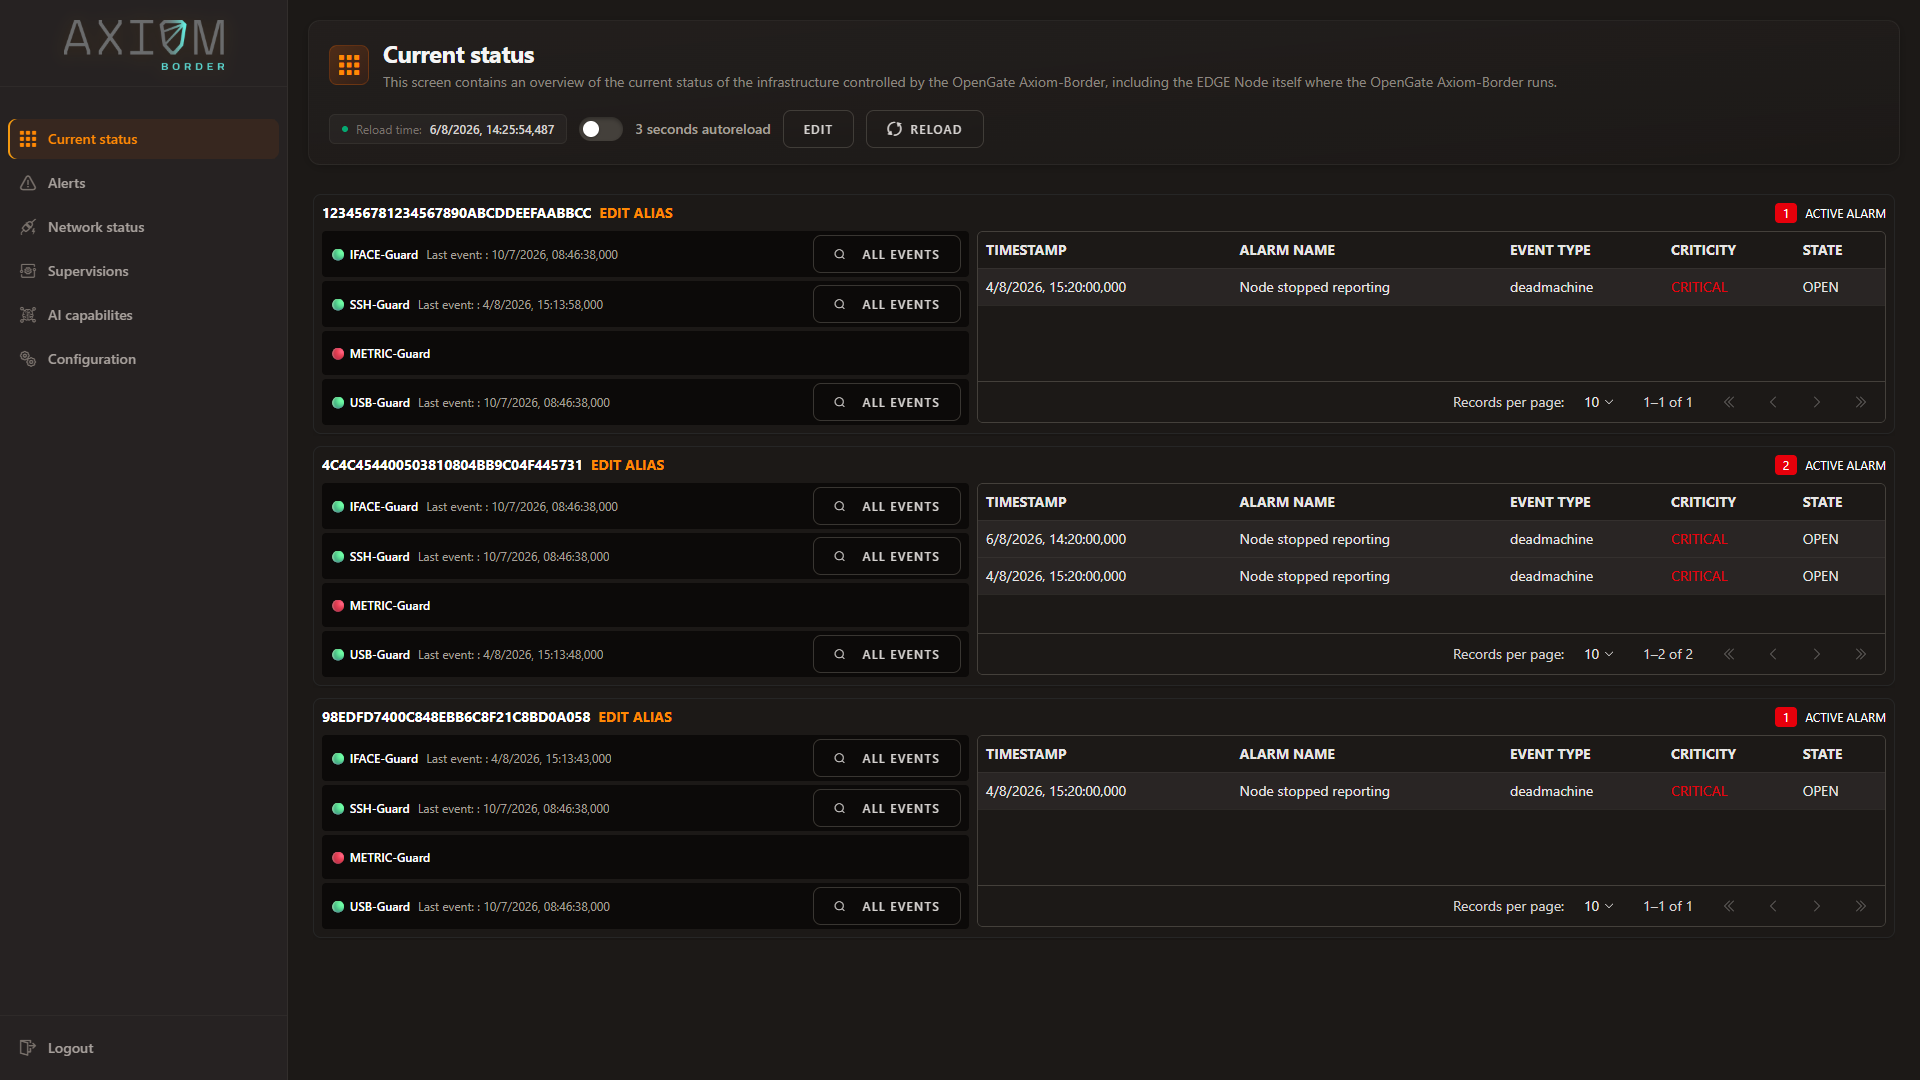
The value of this view is that a problem is visible two ways at once. In the capture above the METRIC-Guard dot is red on all three nodes, and the alarm table beside it reads Node stopped reporting — the missing telemetry and the alarm it raised, side by side. That is the same silence the Supervisions view shows as an empty channel, seen from the node’s point of view instead of the channel’s.
Use Supervisions when you are asking whether a monitor is working, and Hosts Status when you are asking whether a machine is healthy.
The live pipeline: rules, alarms and audit
Events reach the probe itself through a single door, POST /telegraf — the same endpoint the collector
forwards into.
The ingestion door is not open to the network
Reporting processes are unattended, so they cannot carry a session the way an operator does. Rather than leaving the endpoint public, the probe waives the token only for callers inside a configured range, which defaults to loopback. Everything else must authenticate like any other request.
Widen that range only as far as the machines that genuinely report in. Anyone who can post here can inject measurements — and therefore trigger rules and raise alarms.
Payload format
The body is {"metrics": [...]} and every metric requires all four fields:
| Field | Type | Meaning |
|---|---|---|
name |
string | Becomes the measurement in the store. In practice the machine ID of the reporting node |
timestamp |
int64 | Epoch in seconds, not milliseconds |
tags |
map of string | Must include group, which routes the metric to a channel |
fields |
map | The event’s values, numeric or string |
The group tag is the routing key:
group value |
Channel | History bucket |
|---|---|---|
SSH |
ssh |
ssh_bucket |
USBS |
usb |
usb_bucket |
IFACES |
iface |
network_bucket |
METRICS |
metrics |
metrics_bucket |
SECSCAN |
Routed by the additional probe tag |
scanmetrics |
Beyond group, the conventional tags are eventType, ip, port and user — these are what rules
and queries filter on.
The response is 200 with an empty body, or 400 if the JSON does not parse.
A 200 does not mean the rules ran
The recent feeds are updated immediately, so a /recent/* query straight after ingestion will show the
event. Rule evaluation, auditing and alarm generation are asynchronous, so the 200 confirms acceptance,
not evaluation. If you are testing a rule, allow a moment and check the alarms feed rather than inferring
from the ingestion response.
This endpoint feeds the pipeline, not the history
POST /telegraf drives the recent feeds, the rules engine and the audit trail — it does not write
the event itself to the metrics store. History is written by the collector. An event posted directly
here can raise alarms and will show in the recent feeds, but it leaves no history and will not appear
in range queries or exports. To feed your own data in fully, post to the collector’s listeners —
:9090/agents in line protocol or :9091/metrics in JSON — and let it fan out to both places.
Reading data back
Everything up to here is visible in the console. What follows is not: pushing data in and pulling data out are the two jobs the console does not cover, because they exist to feed something else — a dashboard, an export, an integration. This is the part of the product where the API is the right tool rather than a shortcut.
There are three ways to read, and choosing the right one is the difference between a responsive UI and a slow one.
Recent feeds — for live views
These answer in microseconds, serving the most recent events the probe already holds without running a
historical query. Feed depth is capped by pagination.maxRecentEvents, default 1000.
Optional request fields: limit, uuids to filter by node, and orderBy for presentation order. Note
that orderBy only affects how the returned page is sorted — the feed always yields the most recent
events, so asc does not page backwards through history.
The warming flag is true while the feed is still being seeded after a restart. Surface it in a UI as a
loading state rather than presenting a partial feed as complete.
Three feeds exist: /recent/{agentType} for events, /recent/alarms for alarms, and /recent/auditlog
for audit entries. The audit variant takes timeOrder instead of orderBy and adds eventsId and
agent filters — the latter also accepting the probe names network, vulns, snmp and sniff.
There is no total or pages in the response. The client paginates locally over what it received.
Paginated ranges — for historical queries
A range read is answered in one of two ways, and the response metadata tells you which one you got:
meta field |
Meaning |
|---|---|
randomAccess |
true: page numbers work, so you can jump to any page. false: follow nextCursor instead |
exact |
true: total and pages are exact. false: total is an upper bound |
Narrow ranges answer with full random access. Wide ones switch to sequential reading, and nextCursor
carries the position of the following page.
To continue a sequential read, send only the cursor field — no from, no to, no page.
Read randomAccess before drawing a pager
When randomAccess is false, page numbers are meaningless and total is an upper bound, not a count.
A UI that renders “page 12 of 340” from that metadata will be wrong. Read meta.randomAccess on every
response and switch between a numbered pager and a “load more” control accordingly.
Pagination limits are configurable — see Configuration.
Exports — for taking data elsewhere
Streaming CSV, which is the one to use:
The range is mandatory here, and a range exceeding pagination.rangeExportMaxRows (default
500 000) is rejected with 400 asking you to narrow it. That guard is deliberate.
Parquet, which behaves differently:
Parquet export writes server-side and overwrites
This endpoint returns 200 with an empty body — it does not return the file. It writes to a fixed
path, <outputParquetPath>/influxquery.parquet, so every call overwrites the previous one. Unlike
the CSV export, the range is optional and no row-count limit applies, so a broad query can produce a very
large export. Always pass a range on a populated bucket, and collect the file from the server before the
next call.
Other read helpers
| Endpoint | Purpose |
|---|---|
GET /lastevent/{agentType} |
Latest event per device as semicolon-separated CSV. Sets X-Recent-Warming: true while the feed is still seeding |
GET /uuids/{agentType} |
Node UUIDs present in one channel’s bucket |
GET /uuids |
Map of UUID to the channels it appears in |
Aliases — making UUIDs readable
Nodes are identified by machine ID, which is unreadable. An alias maps one to a name, and every read
endpoint accepts ?alias=true to perform the translation. The console displays aliases wherever it
lists nodes, but creating them is an API operation:
With ?alias=true, the uuids filter in a request body also accepts alias names, so a client can work
entirely in readable names. Note that DELETE /alias takes the alias name, as {"name": "..."}, not
the UUID.
Audit
Every significant action is audited to the audit_logs bucket. Two ways to read it:
The agent filter accepts the four channel names and the four probe names. Filtering by vulns is how you
answer “what was scanned, when, and by whom” — including the warning entry that every intrusive OT scan
generates.
Auditing follows the rule script
An agent’s or probe’s activity is audited when its rule script is enabled. Disabling a script therefore costs you the audit records for that agent or probe as well as its rules — the events are still ingested and stored, but they leave no audit trail.
If you need an audit trail for a particular agent, check the enabled state with GET /scripts and make
sure its script exists and is enabled, even if the script itself does nothing. See
Alarms and the rules engine.
Storage layout
Where each kind of data ends up. The four channel buckets are written by the collector; everything else is written by the probe itself:
| Bucket | Contents |
|---|---|
ssh_bucket, usb_bucket, network_bucket, metrics_bucket |
Per-channel agent events |
eg_alarms |
Raised alarms |
audit_logs |
Audit trail |
networktraffic |
Passive sniffing flow data |
availability |
Host up/down state from the probes |
scanmetrics |
Aggregated scan metrics |
Buckets are created on first start if absent. Note that no retention policy is applied by default — configure retention in InfluxDB according to your disk budget, or the metrics buckets will grow without bound. An Influx bucket with no retention is a common cause of a probe slowly filling its disk.