MQTT and OpenGate Operations
MQTT and OpenGate operations
Axiom Border carries its own MQTT broker, so a probe is a message bus as well as a monitoring probe. Three independent pieces make up the messaging layer:
| Piece | Role |
|---|---|
| Embedded broker | The MQTT broker running on the probe, on loopback. Optional TLS listener for remote clients |
| Event client | Publishes execution lifecycle events. Publish-only |
| Operations client | Subscribes to OpenGate operations and answers them |
On top of that sits the optional OpenGate integration, which reports inventory upward (collect) and
registers devices (provision).
The local bus, first: scans publish their lifecycle, and anything that can connect to the broker can follow it.
flowchart TB
    SCAN["Security scans"] -->|"started<br>finishedok<br>failed"| EVC["Event client"]
    EVC --> BROKER["Embedded broker<br>loopback TCP 1883"]
    BROKER --> UI["Web console<br><i>via the API bridge</i>"]
    BROKER --> SUB["External<br>subscribers"]:::ext
    classDef ext fill:#e9edfa,stroke:#486ac9,color:#101010
Then the platform side, where OpenGate drives scans and receives inventory.
flowchart TB
    PLAT["OpenGate platform"]:::ext -->|"operation"| OPS["Operations client<br>odm/operation"]
    OPS -->|"launches"| SCAN2["Security scan"]
    OPS -->|"response"| PLAT
    INV["Provision and collect<br>inventory reports"] -->|"HTTP or MQTT"| PLAT
    classDef ext fill:#e9edfa,stroke:#486ac9,color:#101010
The embedded broker
The broker listens on loopback only, on TCP port 1883. It is not reachable from the network, and that is the shipped posture rather than a suggestion.
The console does not connect to it directly. It reaches the bus through a bridge inside the API’s own encrypted connection: the console asks for a single-use ticket that expires in seconds, and exchanges it when the connection is upgraded. So the live notifications you see in the console travel over the same authenticated, encrypted channel as everything else, and no separate port is opened for them.
A TLS listener on 8883 exists for the case where you genuinely need remote clients, including mutual TLS with client certificate verification. It is off by default.
This bus is the one inbound path that does not check a session
Operations arriving on the broker launch scans on the probe, and they are not authenticated by the API’s session mechanism — that is what makes the loopback default load-bearing rather than merely tidy.
If you point the operations client at a remote broker, the probe requires an encrypted connection and refuses a plaintext one unless you explicitly override it. Whoever can reach that broker can make the probe scan.
Before exposing the broker on any network you do not fully control: restrict the port at the network level, set broker credentials — with both empty it accepts anonymous connections — and enable TLS. After changing TLS settings, confirm the broker came back up: if the certificates cannot be read it does not start, and the log says so.
Execution lifecycle events
Every security scan publishes its lifecycle to a single topic, mqtt.client.topic, which defaults to
axiom-border/executions. This is the alternative to polling the executions API.
| Field | Values |
|---|---|
event |
started, finishedok, failed |
type |
networkscan, vulns, snmp, snmpwalk, sniffing |
mode |
manual, auto, process |
elapsedTime, details |
Present on completion |
Note that type here is networkscan, while the REST API reports the same scan as nmap. Map the two
values if you correlate the event stream with the executions API.
Events are published on scan start, on completion, and on startup recovery for executions interrupted by a restart.
Events are dropped, not queued, when disconnected
While the connection to the broker is down, or when the topic is left empty, lifecycle events are not
buffered for later delivery — they are simply not published. Do not treat this topic as an audit trail.
The authoritative record is the execution history, readable through GET /security/executions; the MQTT
stream is a convenience for live UIs.
Events are published with the configured QoS (default 1) and retain flag (default true), and the client reconnects every 5 seconds while the broker is unreachable.
OpenGate operations over MQTT
The operations client lets the OpenGate platform trigger scans on the probe remotely. It subscribes to
mqtt.ops.topicSubscribe (default odm/operation) and replies on mqtt.ops.topicPublish (default
odm/response/{device-id}, with the device ID substituted at runtime).
Request envelope
name, id and deviceId are all mandatory. A request missing any of them, or one that does not parse,
is logged and silently ignored — no response is published. An unknown operation name does get a
response, with ERROR_PROCESSING and Unsupported operation.
Response envelope
There are exactly two result codes: SUCCESSFUL and ERROR_PROCESSING.
SUCCESSFUL means accepted, not completed
The operation response is published as soon as the scan is launched, not when it finishes — and it does not carry the execution UUID. There is no field for it in the envelope.
To follow a scan triggered over MQTT, subscribe to the execution events topic or poll
GET /security/executions. In particular, an intrusive OT scan that the configuration lock rejects is
still answered with SUCCESSFUL; the rejection shows up afterwards as a failed execution.
The four operations
| Operation | REST equivalent |
|---|---|
hostNetworkScan |
POST /security/scan/network |
hostVulnScan |
POST /security/scan/vulns |
hostSnmpScan |
POST /security/scan/snmp |
hostSnmpWalkScan |
POST /security/scan/snmp/walk |
Both surfaces drive the same scan engine, so they share the same locking, history and safety gates. The differences are in what each surface exposes.
hostVulnScan takes targets, timeout, level, severity and intrusive — all optional. It does
not expose templatesDir, so the configured resolution cascade always applies. The intrusive flag is
gated by securityProbes.vulnScan.allowIntrusive exactly as over REST.
hostNetworkScan takes targets, timeout, timing and portFilter. Four options are fixed for
MQTT-launched scans: port scanning is always on, OS detection is always on (which requires
privileges), service detection is always off, and UDP is always off. There is no force equivalent
either, so a scan launched while another manual network scan is running is rejected with
ERROR_PROCESSING and manual network scan already running.
hostSnmpScan and hostSnmpWalkScan take targets, port, timeout, credentials in an snmp
object, and either oids (mandatory for the GET) or walkRoot (defaulting to the enterprises subtree
.1.3.6.1.4.1).
The SNMP field names differ from REST
The MQTT snmp object uses different names than the REST customParams: user rather than username,
authType rather than authProtocol, privKey rather than privPass, and privType rather than
privProtocol. The version field is snmpVersion.
Also: only the first entry of targets is used, and these credentials form an ephemeral profile that
ignores stored profiles and associations entirely. mib and profileName are not exposed over MQTT.
Request payloads are not logged
Because operation parameters can carry SNMP community strings and v3 passphrases, request payloads are deliberately not written to the log — only the operation name, ID and device ID. Responses, which carry no credentials, are logged in full.
OpenGate provision and collect
Separate from operations, the integration reports upward on a schedule — and it is inert until you enable it. Everything it needs is on one screen, Configuration → OpenGate:
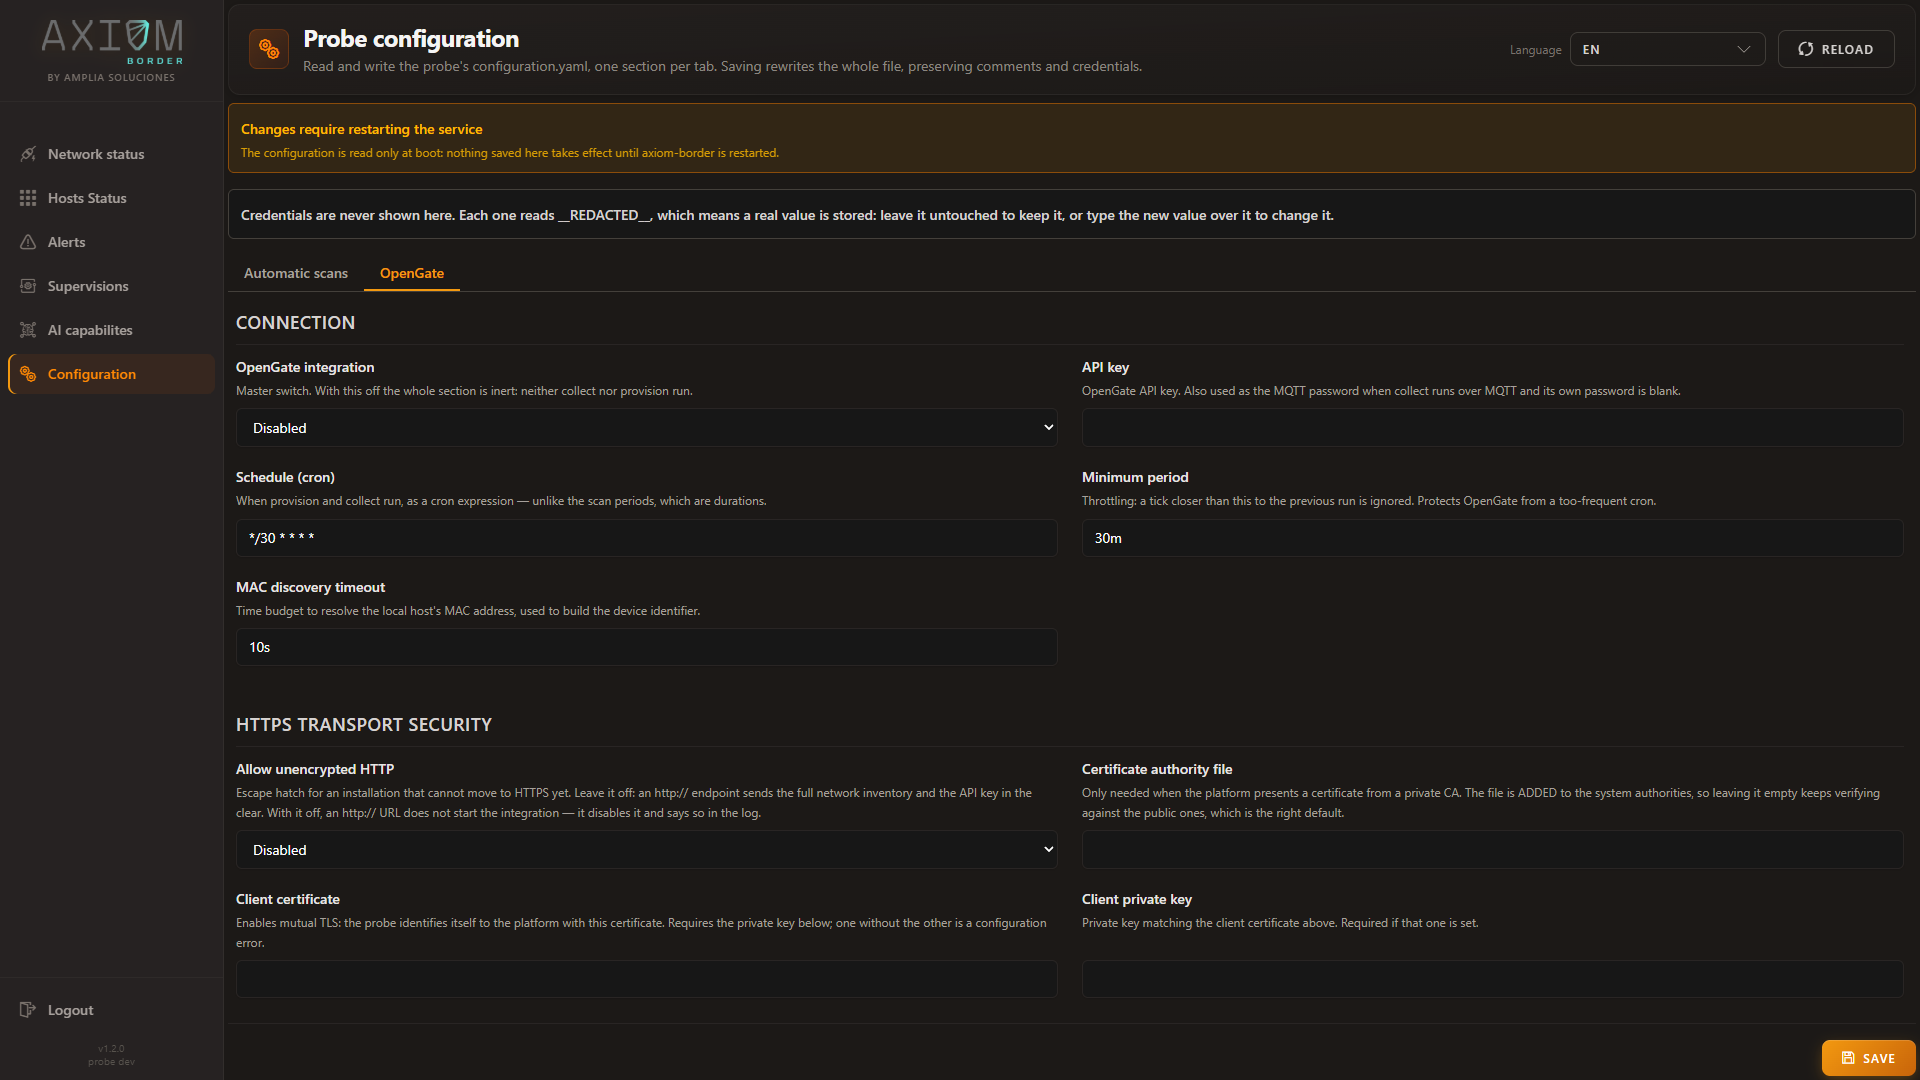
| Setting | What it decides |
|---|---|
| OpenGate integration | The master switch. With it off, neither collect nor provision runs |
| API key | Authorises the probe to the platform. Also serves as the MQTT password when collect runs over MQTT and no separate password is set |
| Schedule | When provision and collect run, as a cron expression — unlike the scan periods, which are durations |
| Minimum period | A floor that protects the platform from a too-frequent schedule |
Below it, HTTPS transport security governs how the probe talks to the platform: whether a private certificate authority is needed, and whether the probe presents a client certificate of its own for mutual TLS.
An unencrypted platform URL stops the integration
Allow unencrypted HTTP is off, and leaving it off is the right choice. What travels on this link is the full inventory of your network together with the API key that authorises it — in the clear, over plain HTTP.
With the escape hatch off, a plaintext platform URL does not start the integration: it disables it and records why. It exists only for an installation that genuinely cannot move to HTTPS yet.
Scheduling and throttling
A five-field cron expression (default */30 * * * *) drives both, with descriptors such as @hourly
accepted. An empty or invalid expression means the integration does not run at all — check the log for a
warning if nothing is happening.
minPeriod (default 30 minutes) is a floor: if the cron expression would fire more often than that, the
schedule falls back to a fixed interval of minPeriod and logs a warning. Cycles never overlap — a cycle
due while the previous one is still running is skipped and logged.
Provision
Provisioning registers discovered hosts with the platform. It builds an Excel workbook — one row per host,
with device ID, addressing, state and the location metadata from opengate.collect.address — and uploads
it to the bulk endpoint.
The upload requires exactly 201 Created; anything else aborts the provision. The result is then polled
up to pollMaxAttempts times (default 10, every 5 seconds), and only counts as success when the platform
reports every submitted host as successful.
Provision is HTTP only — there is no MQTT variant.
Collect
Collect sends the accumulated per-host inventory: identity, ports, vulnerabilities and SNMP entries, with timestamps.
Transport is chosen by collect.mode: mqtt, or http for anything else including an empty value. Over
HTTP the payload is posted with the X-ApiKey header; over MQTT it is published to collect.mqtt.topic,
falling back to opengate.apiKey as the password when no MQTT password is set.
Chunking. With collect.sendByParts: true, each host is split into several messages: a header with the
scalar fields plus one chunked block at a time — ports, then SNMP, then vulnerabilities — sized by
collect.partSize.* (default 100 each). This matters on metered or constrained links where a host with
hundreds of findings would otherwise produce one oversized message. With chunking off, each host is a
single message.
A failed chunk is logged and the cycle continues with the next one, so one bad message does not abort the whole report.
Device identity
The device ID is derived per host as <ip>-<MAC with dots>, for example
192.168.1.50-00.11.22.33.44.55. Hosts without a discoverable MAC get the placeholder
AA.BB.CC.DD.EE.FF. This is the same format accepted by
GET /security/results/last?deviceId=, so an ID seen in the platform can be looked up on the probe
directly.
Before each cycle, hosts missing a MAC or hostname get a quick nmap ping scan to fill the gaps, bounded by
macDiscoveryTimeout (default 10 s).
A fixed collect.deviceId behaves differently per transport
Setting collect.deviceId forces one identifier for all hosts over HTTP, but the MQTT path always uses
the per-host derived ID. If you rely on this override, use HTTP transport — or better, leave it empty and
let each host keep its own identity, which is almost always what you want.
Configuration reference
Everything here is configured under the mqtt and opengate blocks. See
Configuration for the field-by-field tables, including the TLS options and the
retry parameters for both provision and collect.