Security Probes
Security probes
Axiom Border assesses the network it sits on with four probes. They share one execution model, one audit trail and one accumulated view of results, so the findings of each one reinforce the others instead of living in separate reports.
| Probe | What it answers | Requires |
|---|---|---|
| Network discovery | What is out there, and what is it listening on? | Nothing beyond a target range |
| Vulnerability scanning | Which of those services are vulnerable? | Nothing — the checks ship with the product |
| SNMP | What does the device say about itself? | A reachable SNMP agent and credentials |
| Passive analysis | What is actually crossing the wire? | A capture interface |
Each runs two ways: automatically on a schedule you configure, and manually from the console when you want an answer now.
flowchart TB
    DISC["Network discovery<br><i>live hosts and ports</i>"]
    DISC --> VULN["Vulnerabilities"]
    DISC --> SNMP["SNMP identity"]
    PASS["Passive analysis"] --> INV
    VULN --> INV
    SNMP --> INV
    DISC --> INV[("Consolidated<br>inventory")]
    INV --> ALARM["Alarms and<br>audit trail"]
Network discovery establishes the baseline for the two probes that ask questions, and that ordering matters: a vulnerability scan with no explicit target scans every host in the baseline, so discovery must have run for it to have anything to do. Newly discovered hosts also trigger a vulnerability scan on their own, grouped together after a short delay, so new assets get assessed without waiting for the next scheduled sweep.
Passive analysis stands apart — it needs no baseline, because it is not asking anyone anything. See Passive and active for why the two must not be read as the same kind of result.
Network status — where all of it lands
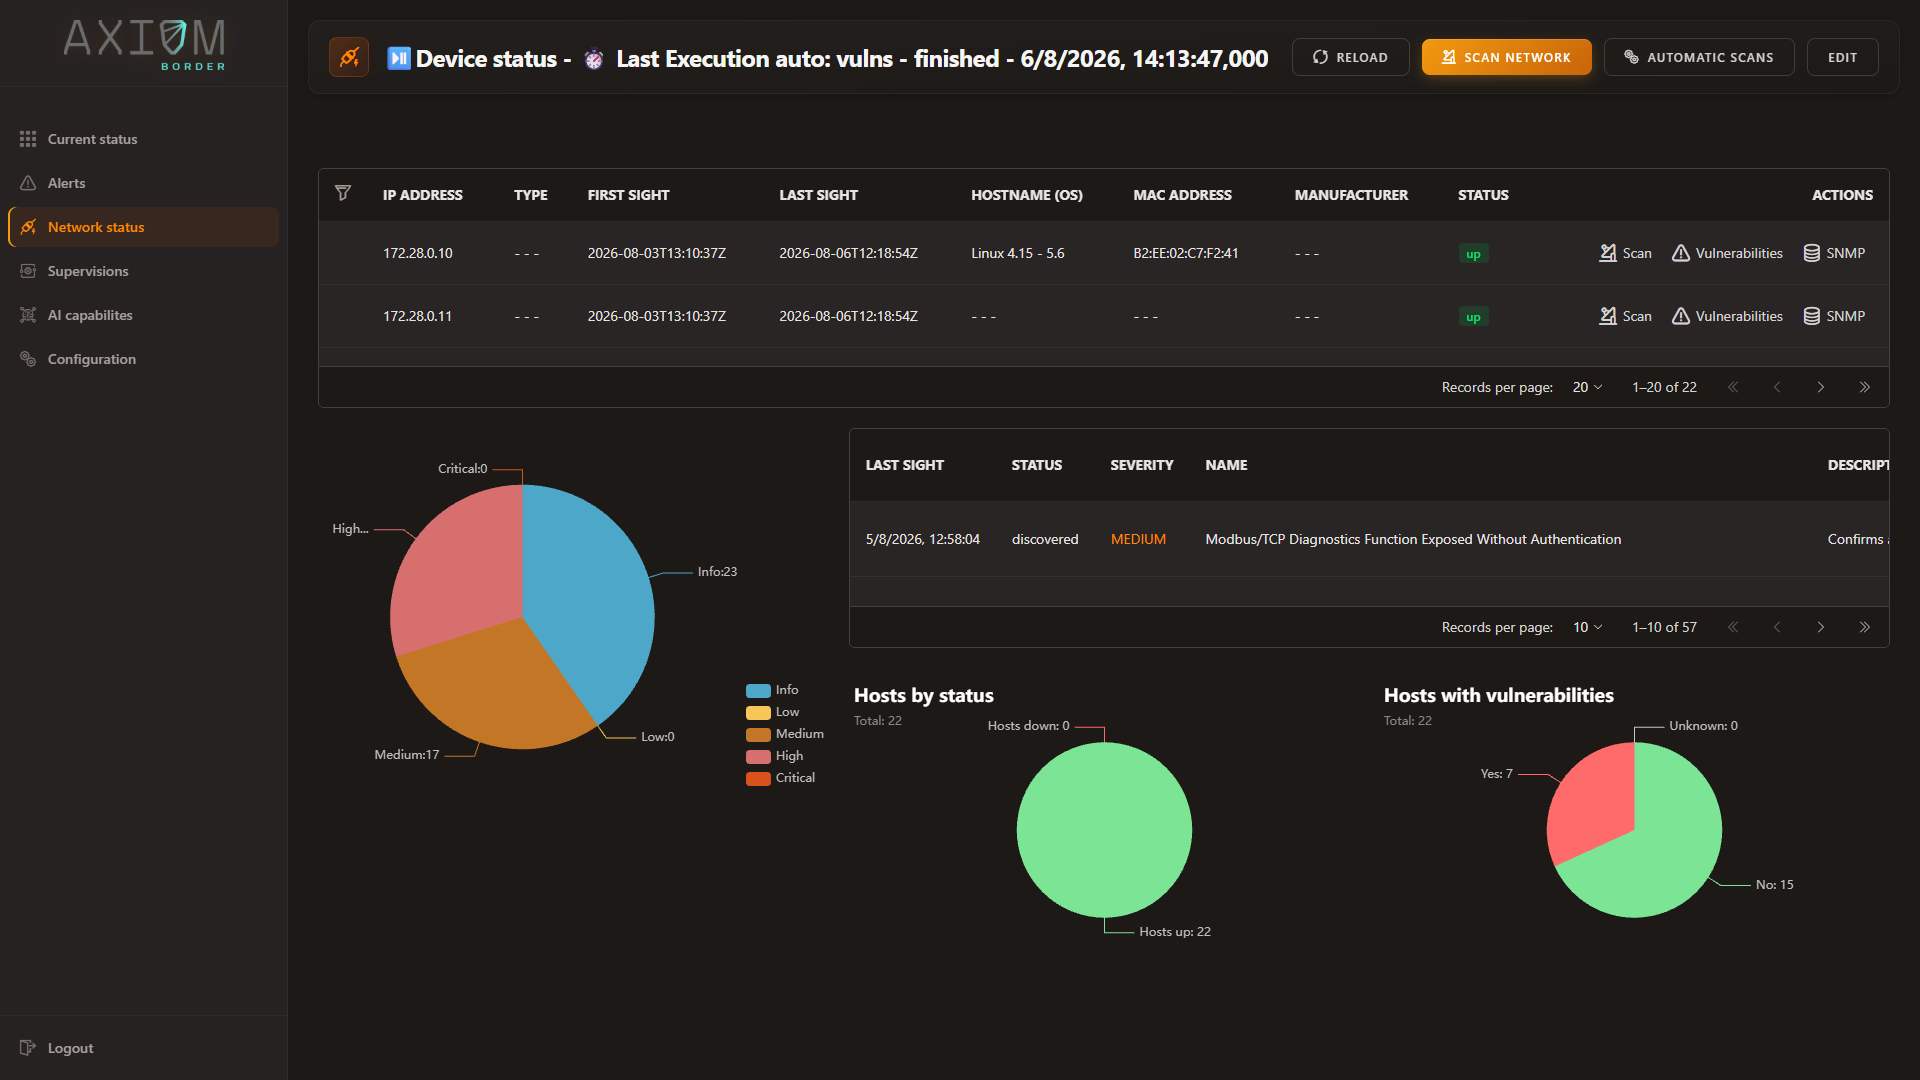
The header names the last assessment that ran and how it finished, so you can tell at a glance whether what you are looking at is current. Three buttons launch and configure the probes:
| Button | What it does |
|---|---|
| Scan network | Runs a discovery scan now, against a target you choose |
| Passive analysis | Opens what the listening probe has worked out, with its evidence |
| Automatic scans | Jumps to the schedules for all of them, in Configuration |
Each host row carries its own actions — Ports, Vulnerabilities and SNMP — each opening that host’s detail and each able to re-scan just that host, so you can reassess one asset without sweeping the whole range.
Network discovery and port scanning
Scan network opens the launch dialog. Every option the probe supports is here, so there is no reason to drop to the API for a scan:
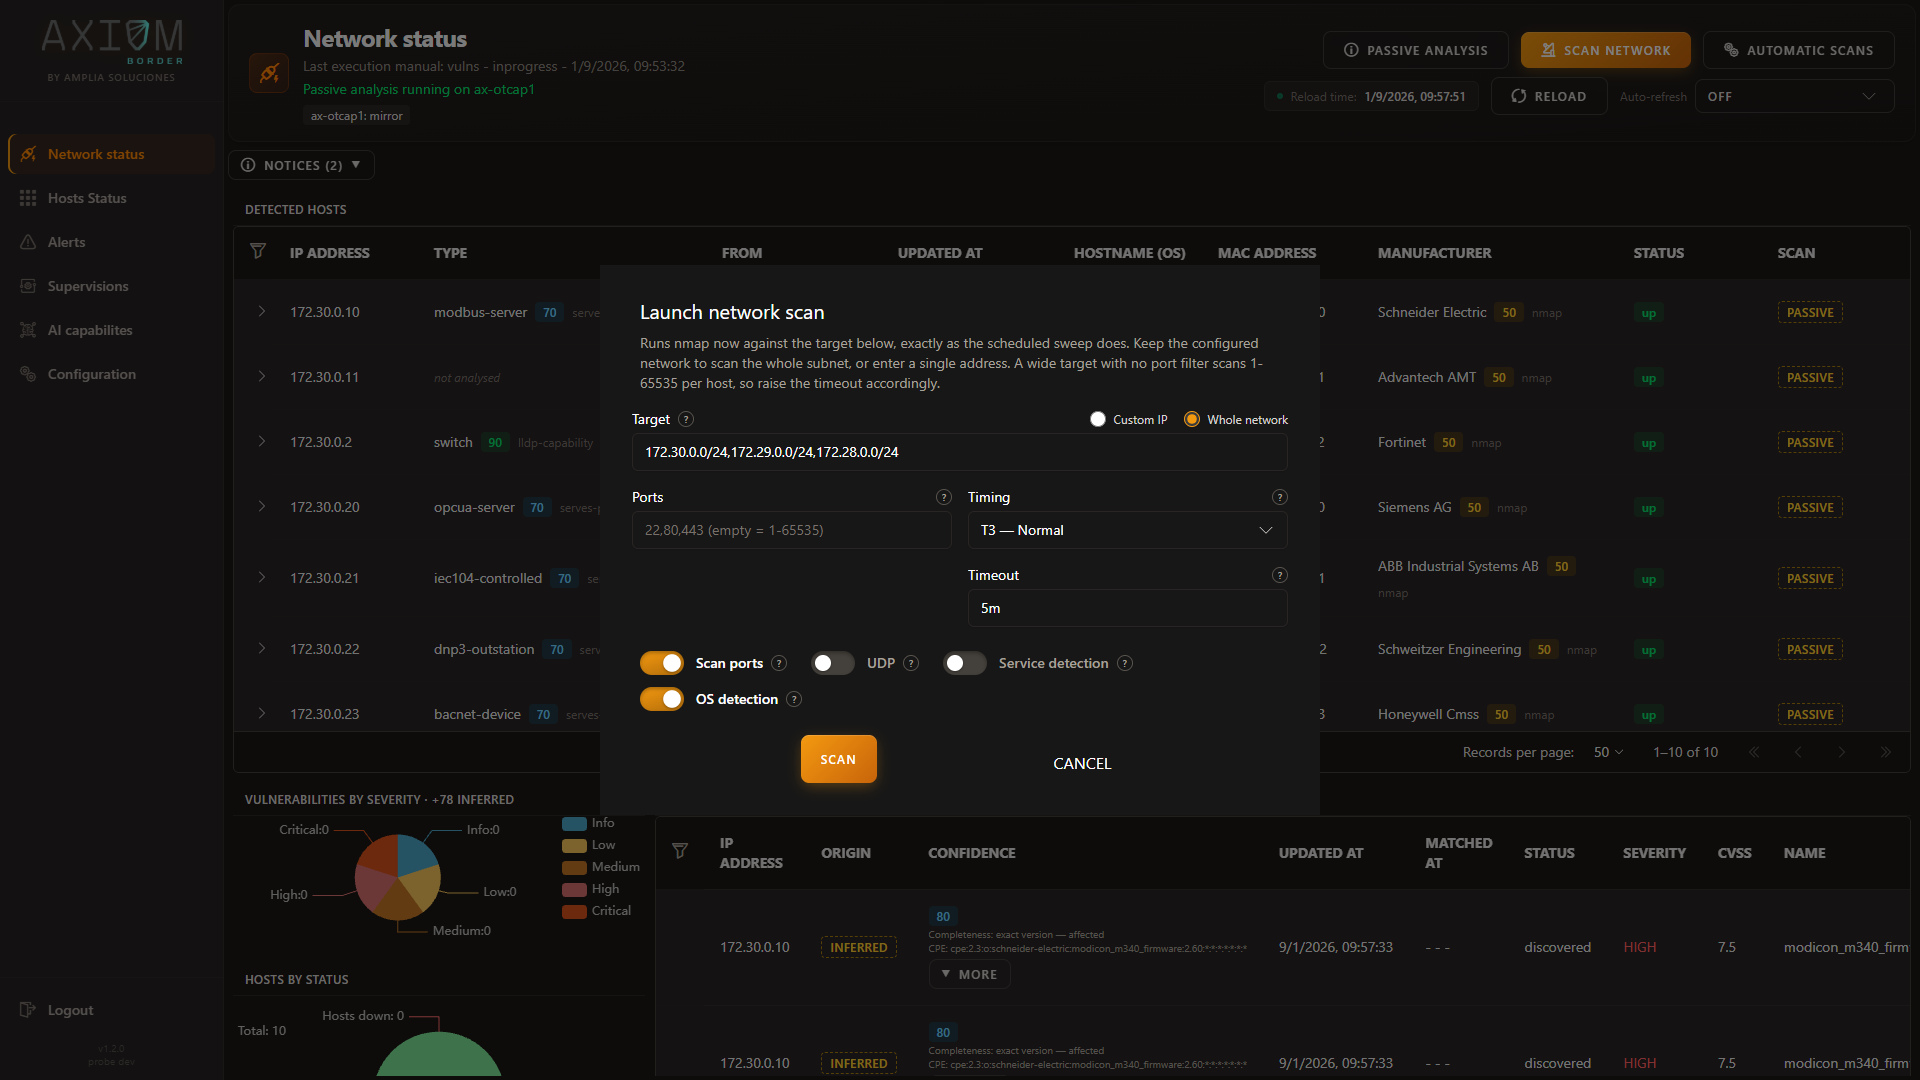
| Field | What to know |
|---|---|
| Target | Whole network uses the configured range; Custom IP scans a single address |
| Ports | Leave empty and it scans all 65,535 per host. On a /24 at cautious timing, that is a long scan — narrow it |
| Timing | Five presets from cautious to flat out, each with a one-line description of what it trades away |
| Timeout | Raise it whenever you widen the target or the port range |
| Scan ports · UDP · Service detection · OS detection | UDP is slow — restrict the port list rather than sweeping. OS detection needs the probe to run privileged |
A port list worth copying for industrial networks
1-1024,502,2404,20000,47808 covers the common IT range plus the Modbus, IEC-104, DNP3 and BACnet ports,
so industrial assets show up in the baseline the vulnerability probe later works from.
One discovery scan at a time
Launching a second while one is running is refused. Forcing it cancels the running scan and marks it failed with the reason, rather than letting it look as though it completed.
What discovery gives you per host
A host’s Ports panel lists what it is listening on, with the service the scan identified and when each port was first and last seen:
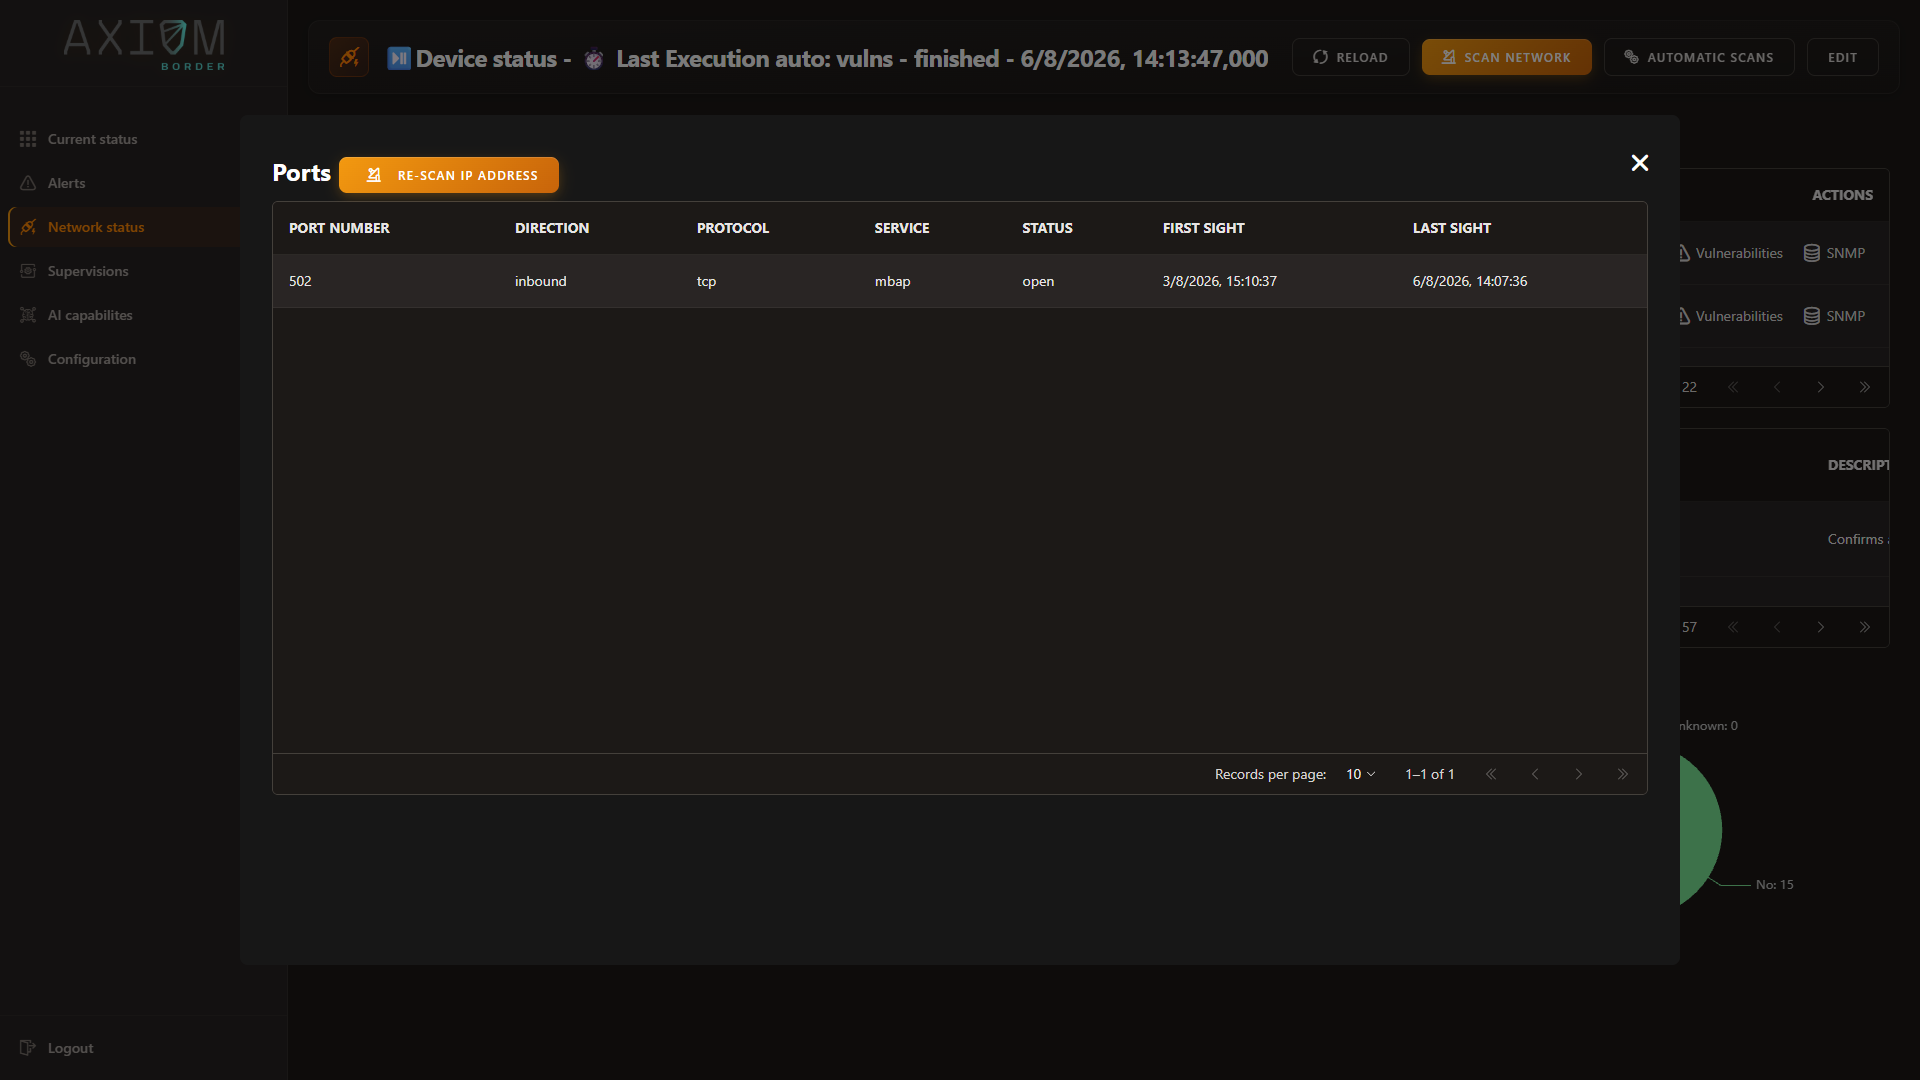
The first-seen and last-seen pair is what makes this more than a snapshot: a port with a recent first seen is new, and that is usually the thing worth acting on. The panel re-scans just this host, so you can confirm a change without sweeping the range again.
Scheduled discovery is configured under Configuration → Automatic scans, in the nmap block.
Vulnerability scanning
Two distinct halves. The generic half uses the bundled upstream template set. The OT/ICS half uses Axiom Border’s own suite of 57 industrial protocol checks, which travel inside the product and work with no internet access. Both are covered in Catalogs: vulnerabilities, OIDs, MIBs and more.
Open a host’s Vulnerabilities panel and use Re-scan IP address vulnerabilities:
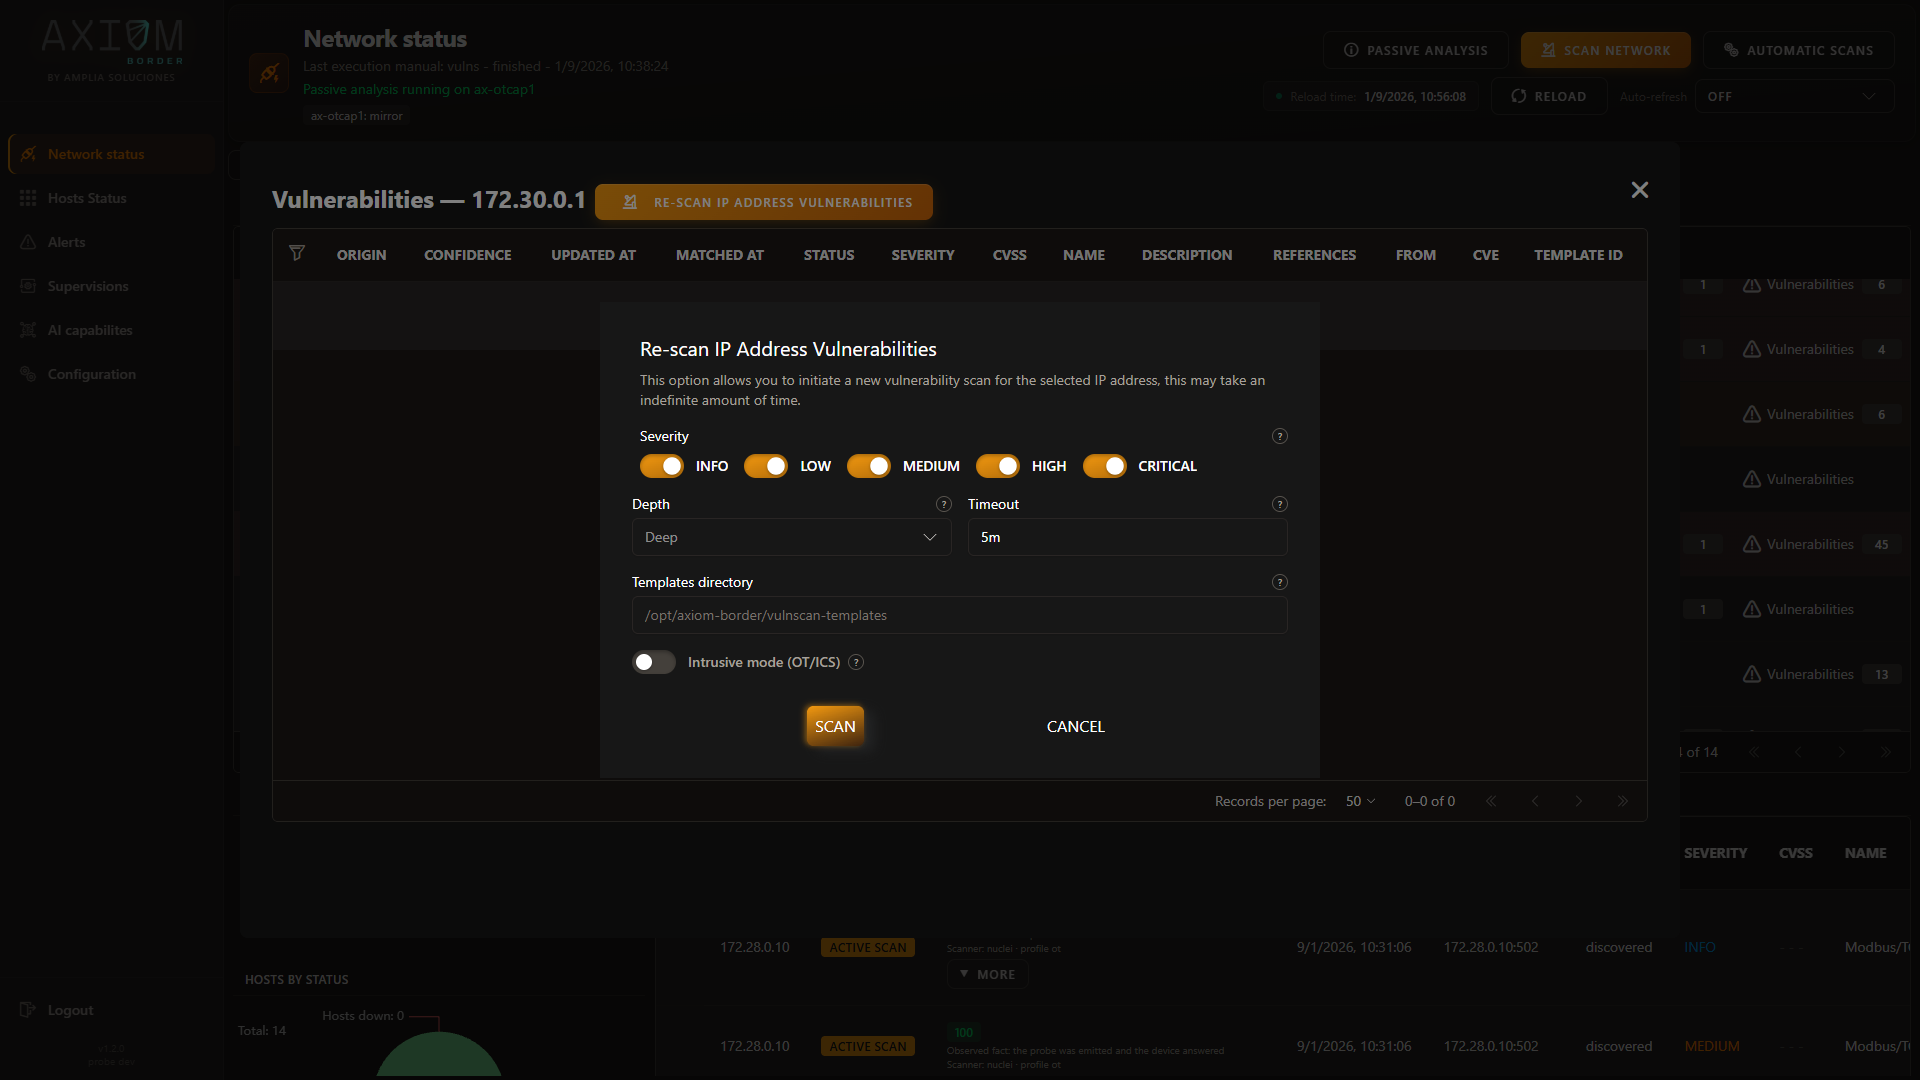
Depth is the setting that matters most, and the dialog explains each option as you select it:
| Depth | What runs |
|---|---|
| Light | Technology detection and TLS only. Checks no CVEs |
| Medium | Adds known CVEs, misconfigurations and default credentials |
| Deep | All of the above, plus exposures, network services and the OT/ICS suite |
| OT/ICS (industrial) | The industrial suite on its own — Modbus, IEC-104, DNP3, BACnet, OPC UA |
Selection is by check family rather than by folder, so it does not depend on how the template set is laid out on disk.
Severity toggles which findings are reported at all, and Intrusive mode (OT/ICS) is the switch that adds checks which write to the device rather than only reading it.
Intrusive mode needs two locks released, not one
The switch in this dialog is only one of two locks. The probe must also be configured to permit intrusive scanning at all, and that setting is off on every installation.
With it off, the scan is not quietly downgraded to a read-only run — it is accepted and then ends as failed, and nothing is scanned at all. That matters more than it sounds: a request for intrusive mode you were not authorised to make does not come back as a clean read-only report, it comes back as no report.
The Network status header names the reason, so you are not left looking at a scan that did nothing and said nothing. It is recorded with the execution and in the service log as well.
Read OT/ICS vulnerability scanning before enabling anything against a live plant.
Reading a finding
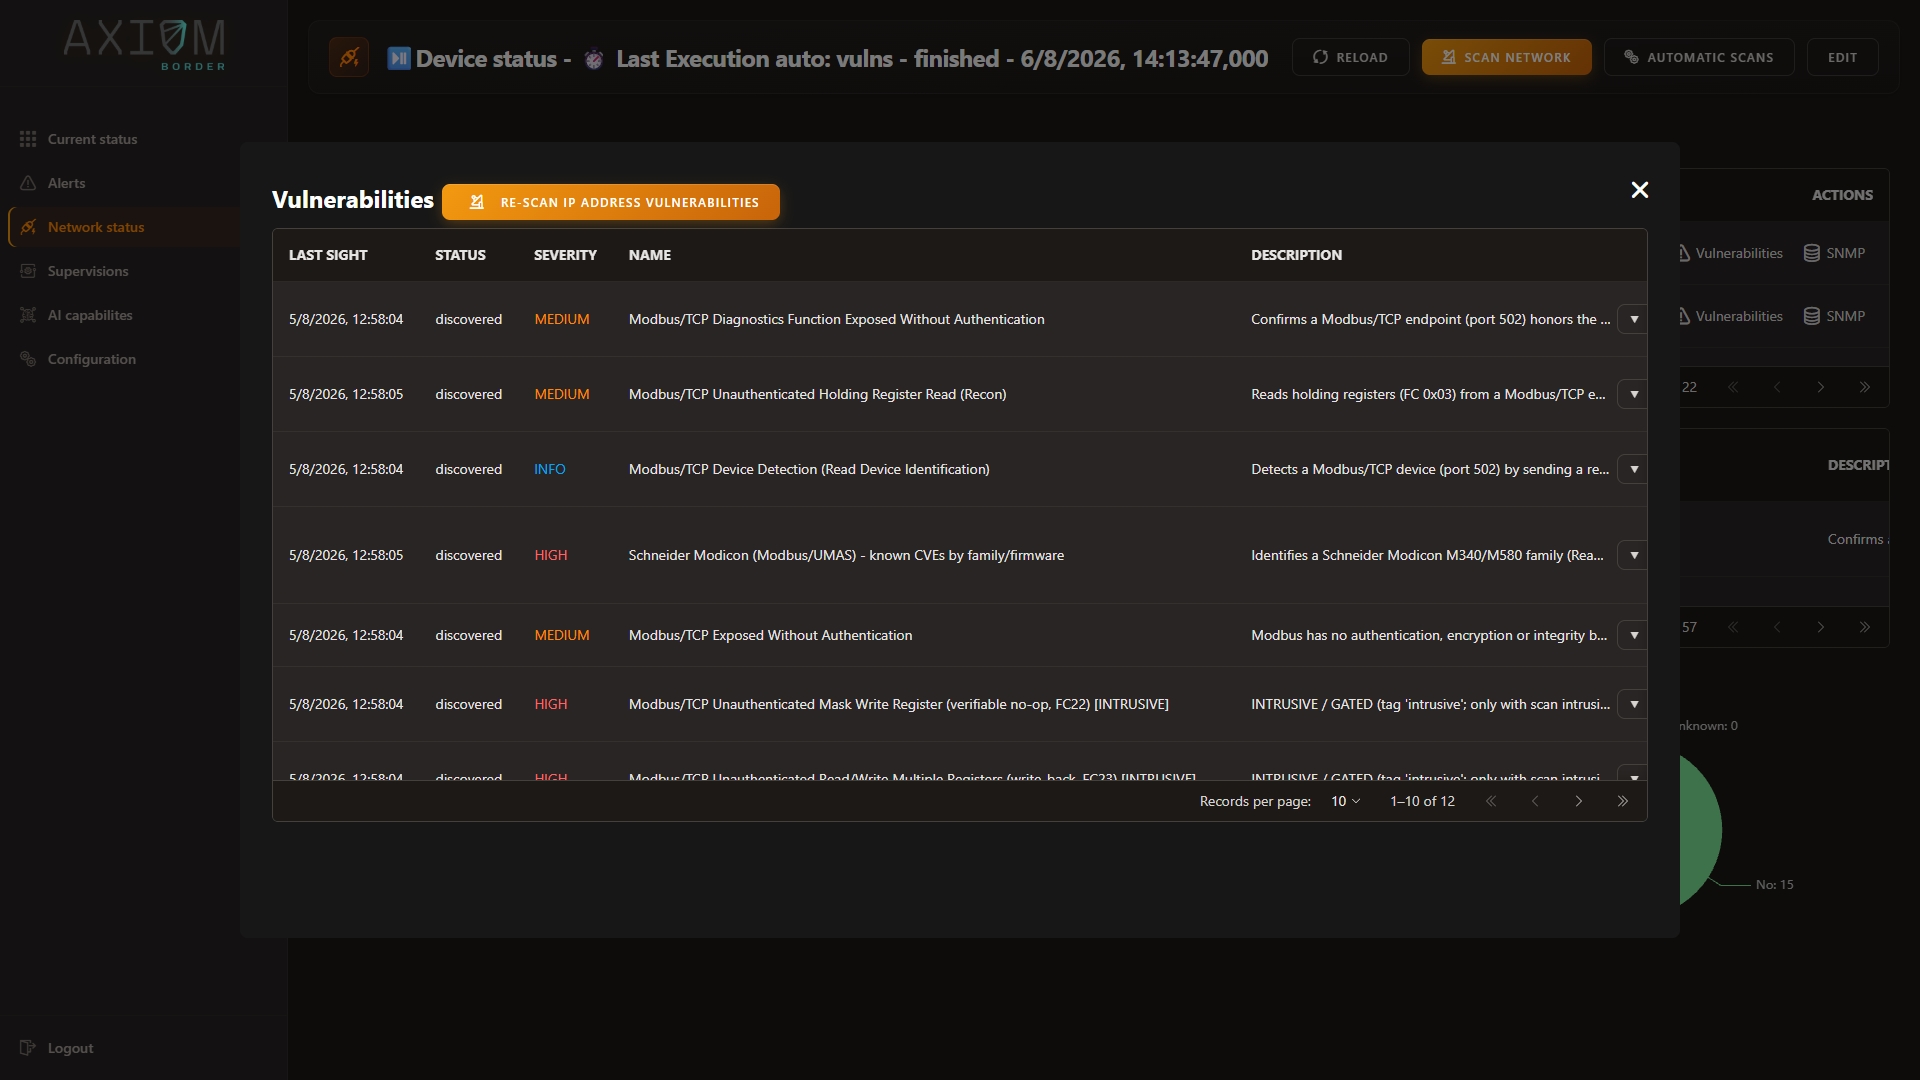
Name says what was confirmed — Modbus/TCP Diagnostics Function Exposed Without Authentication — and Description explains how it was confirmed and why it matters. CVE is empty whenever the finding is an exposure rather than a published vulnerability, so Template ID is the stable way to refer to one.
Origin is the column to read first: probe means the request was sent and the target answered, while
inferred means it was derived from the device’s identity with no traffic emitted — a lead to verify,
not a demonstrated fact. Confidence qualifies it further, and where an inference has evidence behind
it, the Evidence toggle in that column opens it.
Checks from the write/control layer are marked twice over: the name ends in [INTRUSIVE] and the
description opens with INTRUSIVE / GATED.
Detected, and what is merely potential
The table is titled Detected vulnerabilities, and the word is doing real work. It holds what was confirmed by an active scan, plus inferences where the product was actually identified. What it does not hold is the surface attributable to a device known only down to its manufacturer — that would be hundreds of rows the probe cannot stand behind, burying the findings you can act on.
That surface is not discarded. It is summarised above the table, as a count with its severity breakdown and a recommendation to scan the host actively.
An amber Vulnerabilities button means look inside
On Network status, a host whose potential surface is being summarised rather than listed shows its Vulnerabilities row action in amber. Without that cue a host with a hundred unconfirmed CVEs behind it reads exactly like a clean one from the collapsed row — which is the one thing an assessment tool must never do.
There is a cap on how many unconfirmed CVEs a single device lists individually before it switches to a
summary — 30 by default. Version-confirmed findings are never summarised, however many there are.
The cap is sniffing.passiveVulnRowLimit in Configuration; a negative value removes
it and lists everything.
SNMP — interrogation and profiles
Open a host’s SNMP action to query it. The panel takes symbolic names as readily as numeric OIDs and carries a Standard OIDs helper that explains the common ones in plain language, so you do not need a MIB browser open beside you:
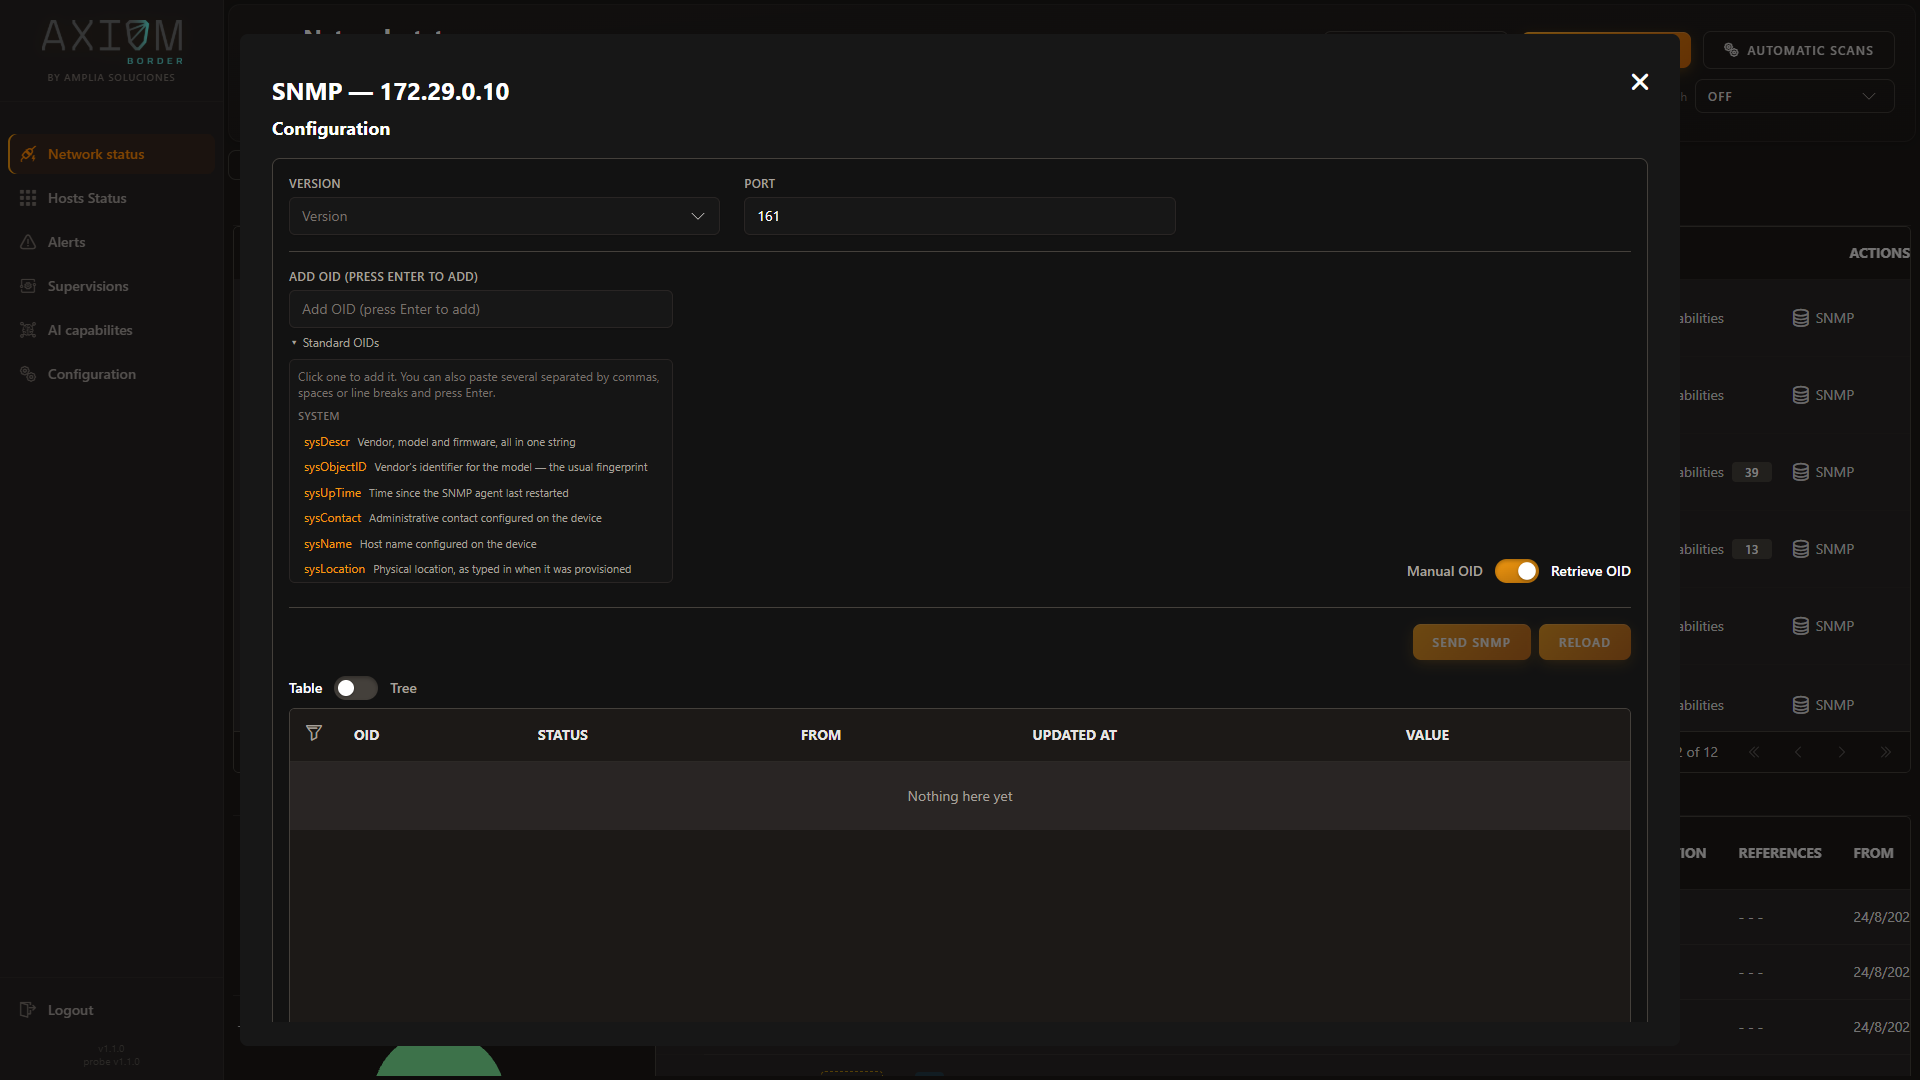
Results render as a table or as a tree, and the tree is the one to use after a walk. How names resolve to numbers and back is covered in Catalogs: vulnerabilities, OIDs, MIBs and more.
Profiles instead of credentials
Rather than supplying credentials with every query, store them once as a profile and bind it to the hosts it applies to. The console has a wizard for this, with predefined profiles to start from, reachable from the SNMP panel’s profile selector.
Supported versions are v1, v2c and v3. For v3 the console explains the three security levels as you choose between them — only authPriv both authenticates and encrypts, and it is the only one that hides what is being polled rather than merely proving who is asking.
Resolution order when a scan runs: the profile named in the request, then the profile bound to that host, then the configured default. A target that resolves to no profile is skipped, and the execution says so.
Prefer profiles over one-off credentials
Credentials passed inline with a single query are persisted with that execution record and appear in its detail afterwards. Profiles keep them out of execution history entirely. Use inline credentials for one-off diagnostics only.
Note
The scheduled SNMP probe runs a discovery pass first, with a fixed budget. A /24 at cautious timing will
exhaust it, so narrow the range or raise the discovery timing value in Configuration.
Passive analysis
The one probe you do not launch. It listens continuously on its capture interface and emits nothing, building an inventory indexed by MAC address alongside the address-indexed one the active probes fill.
Passive analysis on the Network status header opens what it has established:
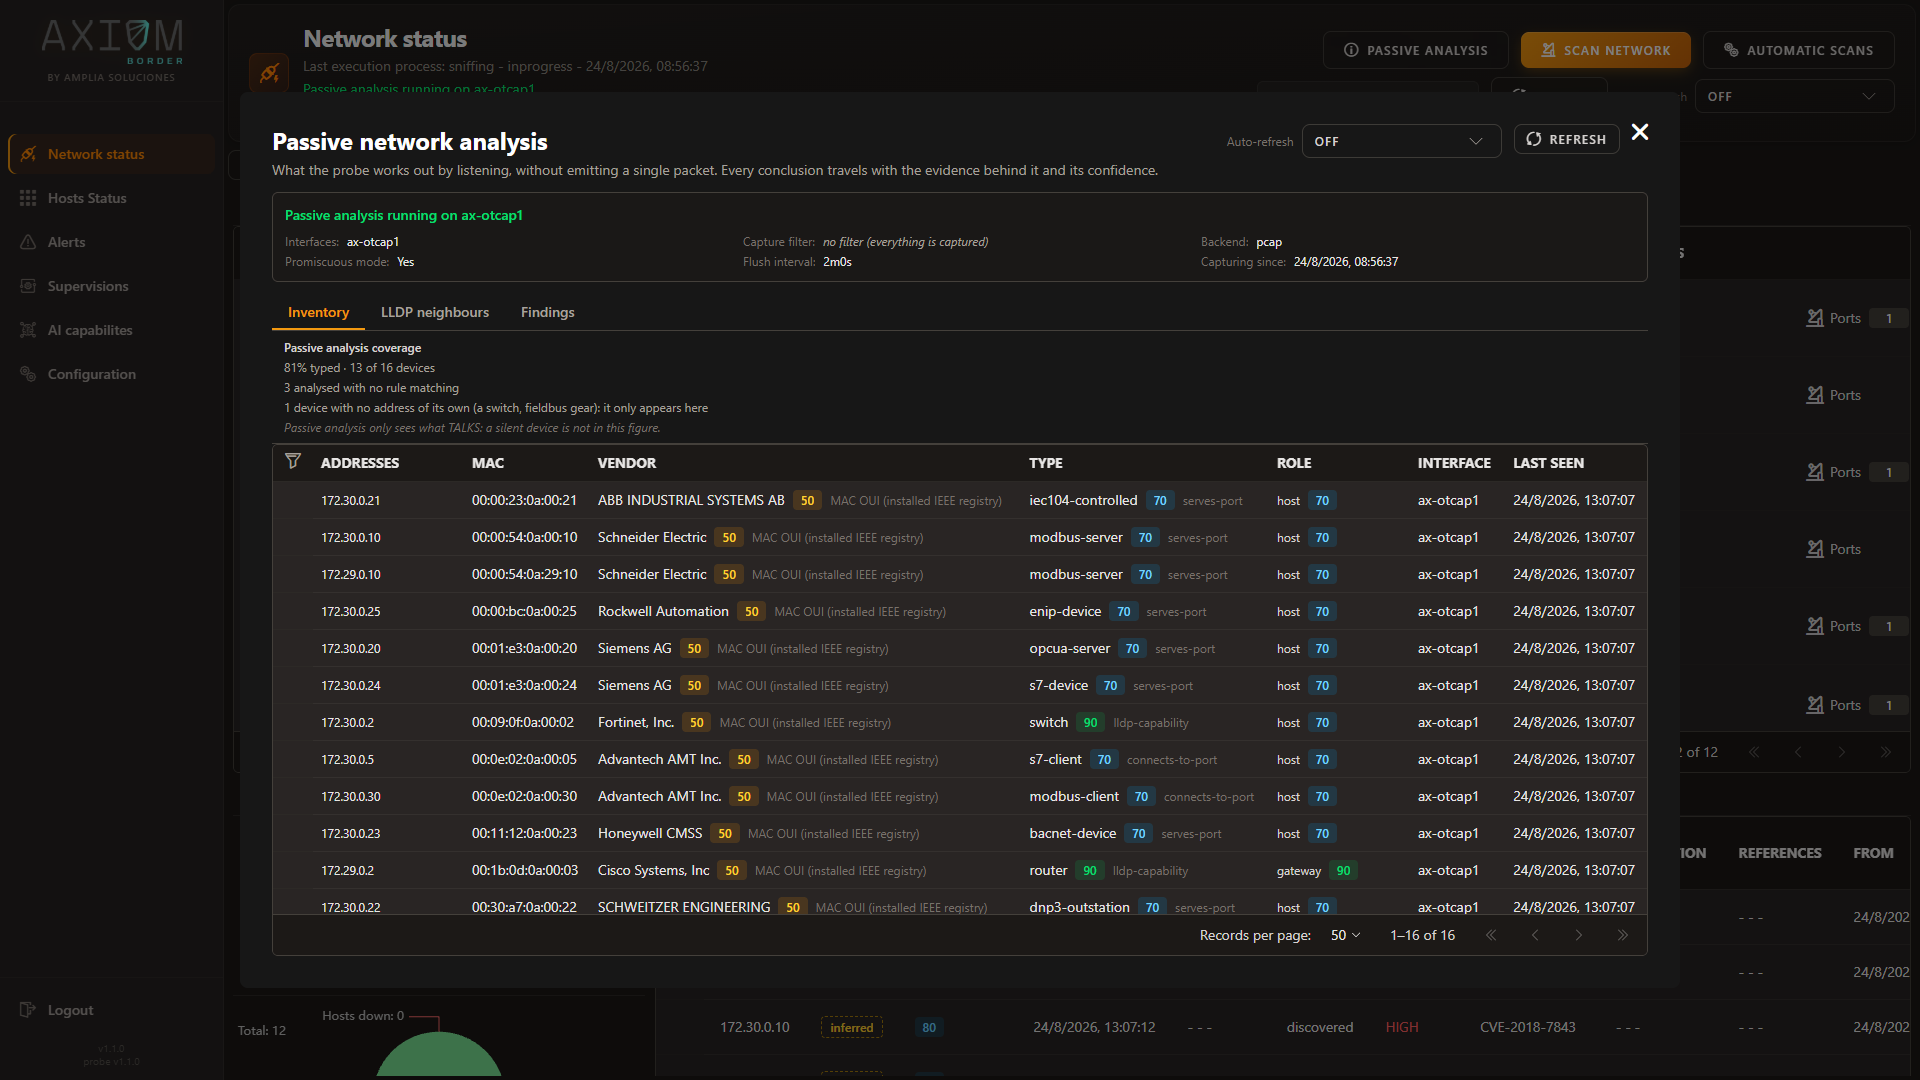
Three tabs: the per-device Inventory with vendor, type, role and the confidence behind each, the LLDP neighbours it has overheard, and Findings such as the capture-point verdict, gateway identification and address conflicts.
The type and role columns are where the industrial coverage shows. The probe recognises thirteen industrial protocols carried over IP — Modbus, S7comm, OPC UA, DNP3, IEC-104, EtherNet/IP, BACnet, CODESYS, MELSEC, PTP, HART-IP, KNXnet/IP and FINS — and records which side is serving and which is asking. It also reads four protocols that travel directly over Ethernet with no IP layer at all: IEC 61850 GOOSE and Sampled Values, PTP/IEEE 1588, and PROFINET DCP. On a substation or production segment those are frequently the bulk of the traffic, and nothing that keys off addresses and ports can describe them. See Passive and active for the full picture, including which ports are vendor convention rather than registered and are therefore reported at lower confidence.
The neighbours tab is LLDP only. The probe sees and counts Cisco’s own discovery frames, but it does not derive neighbours from them — so a segment of Cisco equipment speaking CDP rather than LLDP produces traffic the probe accounts for and a neighbour table that stays empty. That is a limitation, not a fault to chase. The coverage note above the table states plainly what the figure leaves out — passive analysis only sees what talks, so a silent device is not counted.
Everything about it is configured under Configuration → Automatic scans, in the sniffing block: which interfaces to capture on, an optional capture filter, which observed addresses reach the host inventory, how often what it learns is persisted, and whether it infers vulnerabilities from identity.
The interface name is the usual culprit
Capture failing silently almost always comes down to the interface name, which must be the one the
capture library uses: eth0 or enp3s0 on Linux, en0 on macOS. The friendly name from the operating
system’s own network settings does not work.
The Notices panel on Network status reports capture conditions directly — a rejected capture filter, or analysis stopped by an error — so check there before assuming the network is quiet.
The shared execution model
Every launch is asynchronous: the request is accepted, the work continues in the background, and the Network status header reports the state of the most recent run as it progresses. A run ends as finished or failed, and a run interrupted by a probe restart is moved to failed on start-up rather than being left in progress forever.
Executions also publish over MQTT
For integrations that would rather not poll, the embedded broker publishes started, finished and failed events for every execution. See MQTT and OpenGate operations.
The merged result view
An individual execution tells you what one probe found. The Network status table tells you what is known about a host, merged across all four probes: address and hostname, MAC address, manufacturer and device type with their provenance, operating system, status, when it was first and last seen, then the per-probe contributions — ports from discovery, findings from vulnerability scanning, values from SNMP, and traffic counters from passive analysis.
The first-seen and last-updated pair is what turns the baseline into change detection: a host with a recent first-seen is new to the network.
This same merged view is available through the API for dashboards and integrations, at
GET /security/results/last.
Feeding results into rules
Probe results reach the rules engine, so a finding can raise an alarm the same way a metric can — a new host appearing, a critical vulnerability, a port opening that should not be open. See Alarms and rules.