Not every problem can be solved from the cloud. A substation in a valley with no coverage, a factory
floor whose OT segment must never route to the internet, a remote pumping station on a metered
link — all of them still need metrics, alarms and security visibility. Edge Products are the part
of the OpenGate family that runs where the assets are, does the work locally, and synchronises with
the platform only when it makes sense to.
They share three design commitments:
Offline-first. Local persistence and local decision-making. Connectivity is an optimisation,
never a prerequisite. A device that loses its uplink keeps ingesting, keeps evaluating rules and
keeps raising alarms; it reconciles when the link returns.
Self-contained deployment. Installation bundles carry their own dependencies, so a target host
can be provisioned without reaching a package mirror.
Optional platform integration. Each product is useful standalone, and becomes more useful when
registered against OpenGate — telemetry flows up, operations flow down.
Available products
Axiom Border is a lightweight network and asset monitoring probe. It ingests
metrics, raises alarms, runs security and vulnerability assessments — including OT/ICS industrial
protocols — resolves SNMP OIDs against a bundled MIB catalogue, and exposes everything through a
JWT-protected REST API and an embedded web UI. It runs fully disconnected and can optionally report
to OpenGate over HTTP or MQTT.
Axiom Border is a network and asset monitoring probe you install at the edge, close to the equipment
it watches. It is not an agent that reports to a cloud: it observes, decides and acts on its own, on
the machine, and centralising into OpenGate is something you switch on afterwards if a fleet-wide view is
useful to you.
It works fully disconnected, and it does four jobs that normally take four separate tools:
flowchart TB
    A["Your network<br>servers · devices · PLCs"]:::ext --> P["<b>Axiom Border</b>"]
    P --> M["Metrics<br>and alarms"]
    P --> S["Security<br>assessment"]
    P --> C["Web console"]
    M --> OG["OpenGate<br><i>optional</i>"]:::ext
    S --> OG

    classDef ext fill:#e9edfa,stroke:#486ac9,color:#101010
Monitors the hosts and devices around it, collecting metrics and keeping the history locally.
Raises alarms on its own, from rules you define, with no need to reach a server first.
Assesses security — discovers assets, scans ports and services, detects vulnerabilities, queries
SNMP and observes traffic without emitting a packet. It carries its own suite of 57 industrial
protocol checks and recognises sixteen OT protocols as it listens, four of them carried directly
over Ethernet with no IP address involved. That is what sets it apart from a general-purpose scanner.
Integrates with OpenGate when you want a fleet-wide view — and keeps working exactly the same when
the link is down.
Start here
Presenting Axiom Border explains the product in seven short readings: what it is, the
loop it runs, its four probes, how passive and active analysis hand over to each other, how an event
becomes an actionable alarm, the models that run on the probe, and the security posture it deploys with.
Read that first. The rest of this section is how to operate what it describes.
What it needs to run
Axiom Border installs from a single self-contained package that carries everything it depends on, so
the target machine needs no internet access and no manual preparation.
Requirement
Operating system
Ubuntu 22.04 or 24.04, Debian 12 or 13 — 64-bit
Machine
2 CPU cores and 2 GB RAM minimum; 4 cores and 4 GB recommended
Disk
4 GB free minimum, 20 GB recommended for history
Network
Access to the network you want to monitor
Internet
Not required
It installs in one of two roles — central, the complete node, or monitoring, a remote node that
reports into a central one. Only the central role carries the metrics database and the components behind
the optional anomaly-detection feature.
Axiom Border can perform checks that write to industrial devices. This is switched off by default and
needs two separate confirmations to enable — but the responsibility for authorising it is yours. Read
OT/ICS vulnerability scanning before enabling anything against a live
plant.
The rest of this section explains how to operate the probe. This part explains what it is and
why it behaves the way it does — the seven ideas that, once you have them, make every screen in the
console read the way it was meant to.
Read it in order the first time. Each page assumes the one before it.
What the two installation paths deploy, and where each kind of data lives
Documented version
The text describes Axiom Border v1.3.1. The console captures were taken on v1.2.0, so a few
details have moved on since — most visibly the vulnerabilities table, which v1.3.1 renamed and gave a
potential-surface summary. Where a capture and the text disagree, the text describes the current
console.
Most edge monitoring works one way: a collector gathers data, ships it somewhere, and a platform decides
what it means. Take the link away and the collector is a data recorder at best.
Axiom Border is built on the opposite premise. It is not an agent that reports to a cloud. It is an
autonomous node that observes the network around it, decides what matters against rules it holds locally,
and acts on that decision — on the machine, with no server in the loop. Centralising into OpenGate is
something you switch on afterwards if a fleet-wide view is useful to you. It is never what makes the
probe work.
That single decision is why the product looks the way it does:
The decision engine is on the probe. Alarms are raised where the data is, not where the platform is.
Everything it needs travels with it. The vulnerability database, the vendor registry, the MIB
catalogue, the scan templates, the metrics store, the container runtime and the web console are all
installed with the product. A probe in an isolated network is useful the moment it starts.
Nothing is fetched at run time. There is no feed to update before a scan means anything, and no
service to call before a finding can be interpreted. What exactly it carries, where each data set comes
from and how to refresh it in the field is set out in
Catalogs: vulnerabilities, OIDs, MIBs and more.
Why this matters in an industrial network
Isolated OT segments are isolated on purpose. A tool that needs to reach the internet to stay useful is
a tool that is either useless there or a hole in the isolation. Axiom Border needs neither.
The specification, in one table
Deployment roles
central — the full node: probe, metrics store and the container runtime for the AI capability. monitoring — a remote node that reports into a central one
Installation path
A single supported path, the Keystone deployment agent, and it is 100 % offline. Roughly 5–8 minutes for a central node, 1–2 for a monitoring one
Footprint
About 141 MB for a central core package and 89 MB for a monitoring one, plus the bundled data packs, which are published once and reused across versions
Management surface
The embedded web console and a REST API, both served by the probe itself, both over HTTPS unconditionally — localhost included
Internet access
Not required, at install time or afterwards
HTTPS is not optional
There is no plaintext listener to fall back to. A probe reached over http:// refuses the connection, and
that applies to localhost as much as to anything else. On first boot the probe issues its own
certificate from a local authority, so it works with no PKI and no internet — see
Security posture for replacing it with your own.
The two roles
A single probe covers a site on its own. The roles exist for when one site is not the whole picture.
flowchart LR
    M1["monitoring<br><i>remote node</i>"] --> C
    M2["monitoring<br><i>remote node</i>"] --> C["<b>central</b><br>probe · metrics store<br>console · AI"]
    C -.->|optional| OG["OpenGate"]:::ext
    classDef ext fill:#e9edfa,stroke:#486ac9,color:#101010
A central node is a complete Axiom Border: it watches its own network, holds the history, serves the
console, and can additionally receive from monitoring nodes. A monitoring node is the light end of
the fleet — it watches the machine it runs on and reports into the central one.
The dotted arrow is the point. OpenGate sits outside the boundary, it is optional, and it starts
switched off.
How you work with it
Through the console. The probe serves its own web interface; point a browser at its address and log
in. Everything on the pages that follow is described from that interface, because that is how the probe
is meant to be operated.
A REST API exists underneath for integrating the probe with your own systems, and OpenGate drives the
probe over it. It is not the operator’s path.
The console has six views, in the order the sidebar lists them:
View
What it is for
Where it is documented
Network status
Everything discovered on the network: assets, ports, vulnerabilities, and the passive inventory behind them
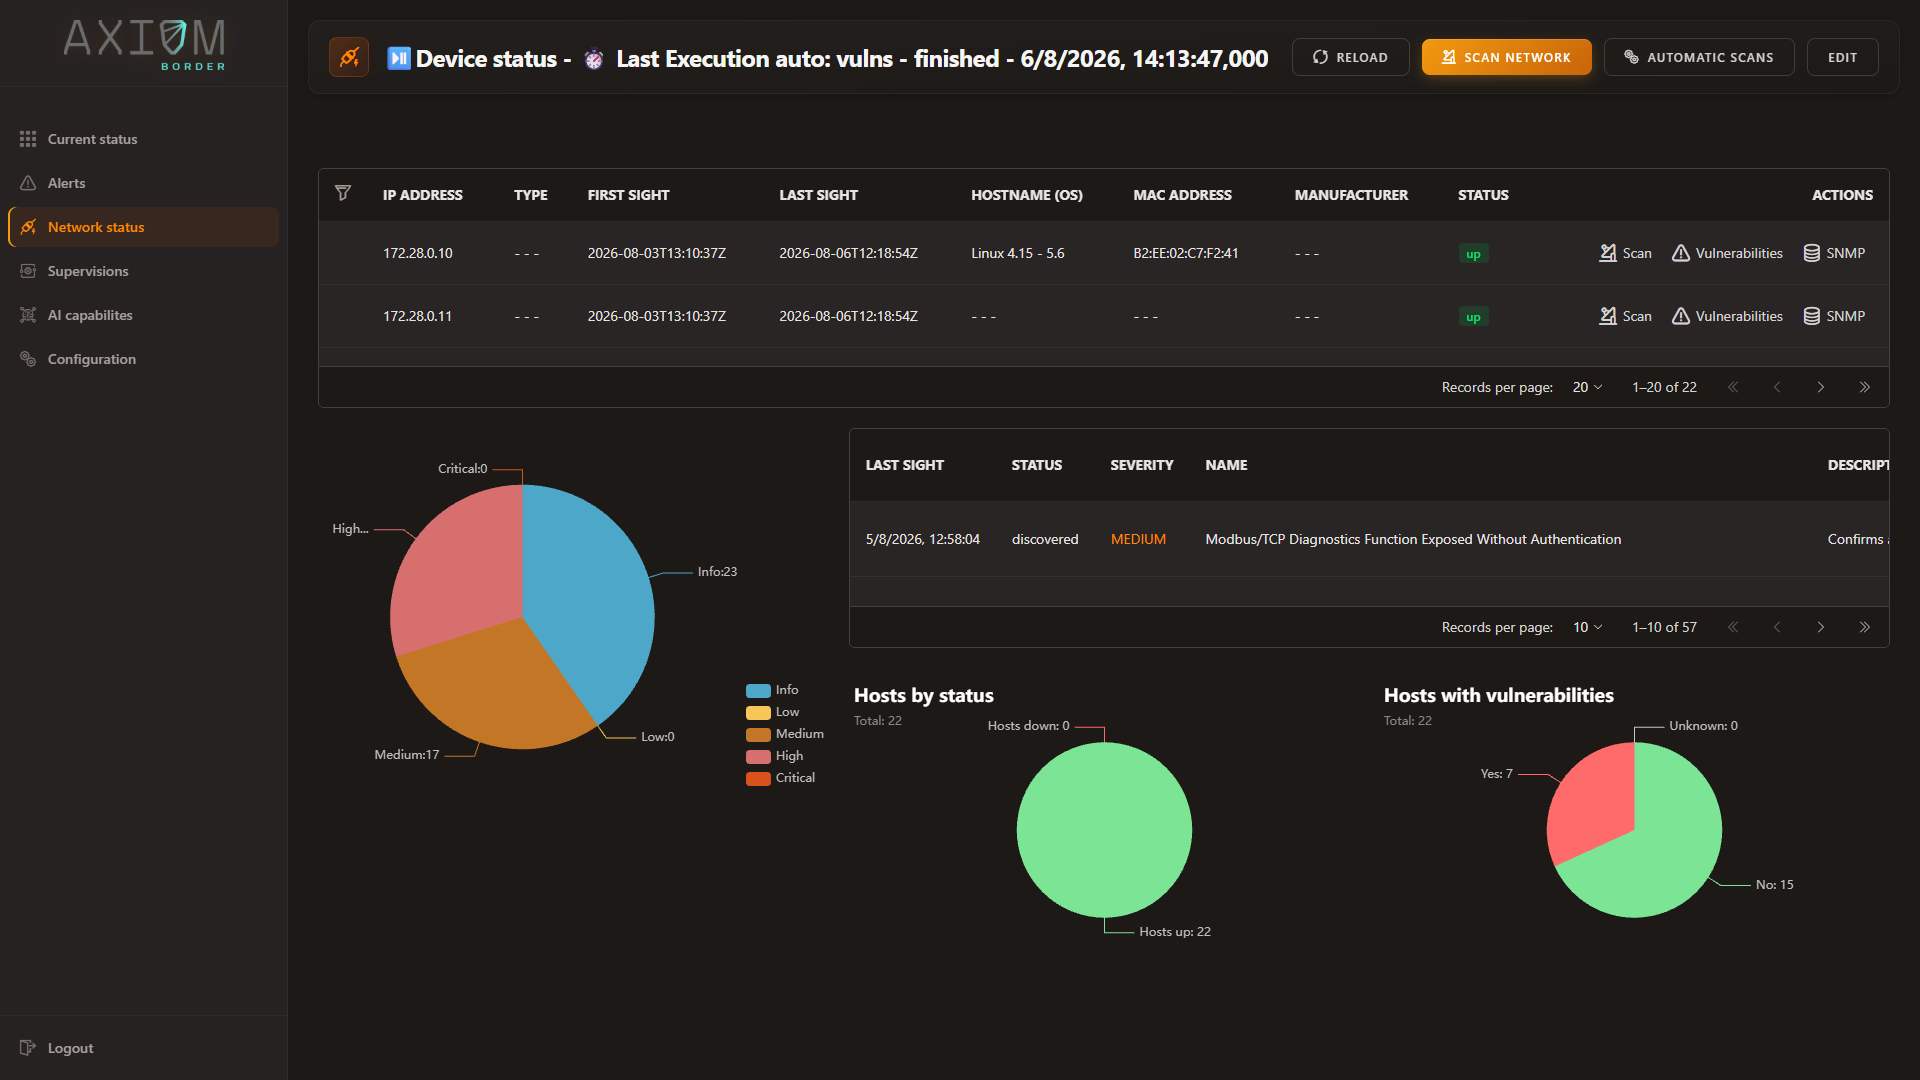
Network status is the landing view, which tells you where the product thinks the centre of gravity
is: what is out there, and is it exposed.
Next:The full loop — the four stages a single observation travels through.
The Full Loop
Ingest, observe, decide, act
Everything Axiom Border does fits into four stages. They run in parallel and on their own clocks —
the numbering follows a single observation through the product, not an order of execution. What binds
them together is that all four write to the same local state, and all four can raise an alarm.
flowchart LR
    I["<b>1 · INGEST</b><br>from the machines"] --> O["<b>2 · OBSERVE</b><br>from the network"]
    O --> D["<b>3 · DECIDE</b><br>local rules"]
    D --> A["<b>4 · ACT</b><br>alarm and notice"]
    A -.->|optional| C["OpenGate"]:::ext
    classDef ext fill:#e9edfa,stroke:#486ac9,color:#101010
1 · Ingest — what the machines report about themselves
Every monitored machine runs a lightweight agent that watches it from the inside and sends what it
sees. Four monitors, each answering one question:
Monitor
What it watches
SSH-Guard
Interactive sessions and login attempts against the machine
USB-Guard
Devices attached to and removed from its ports
IFACES-Guard
The state of its physical network interfaces
METRIC-Guard
The machine’s own health, and the heartbeat that proves it is still reporting
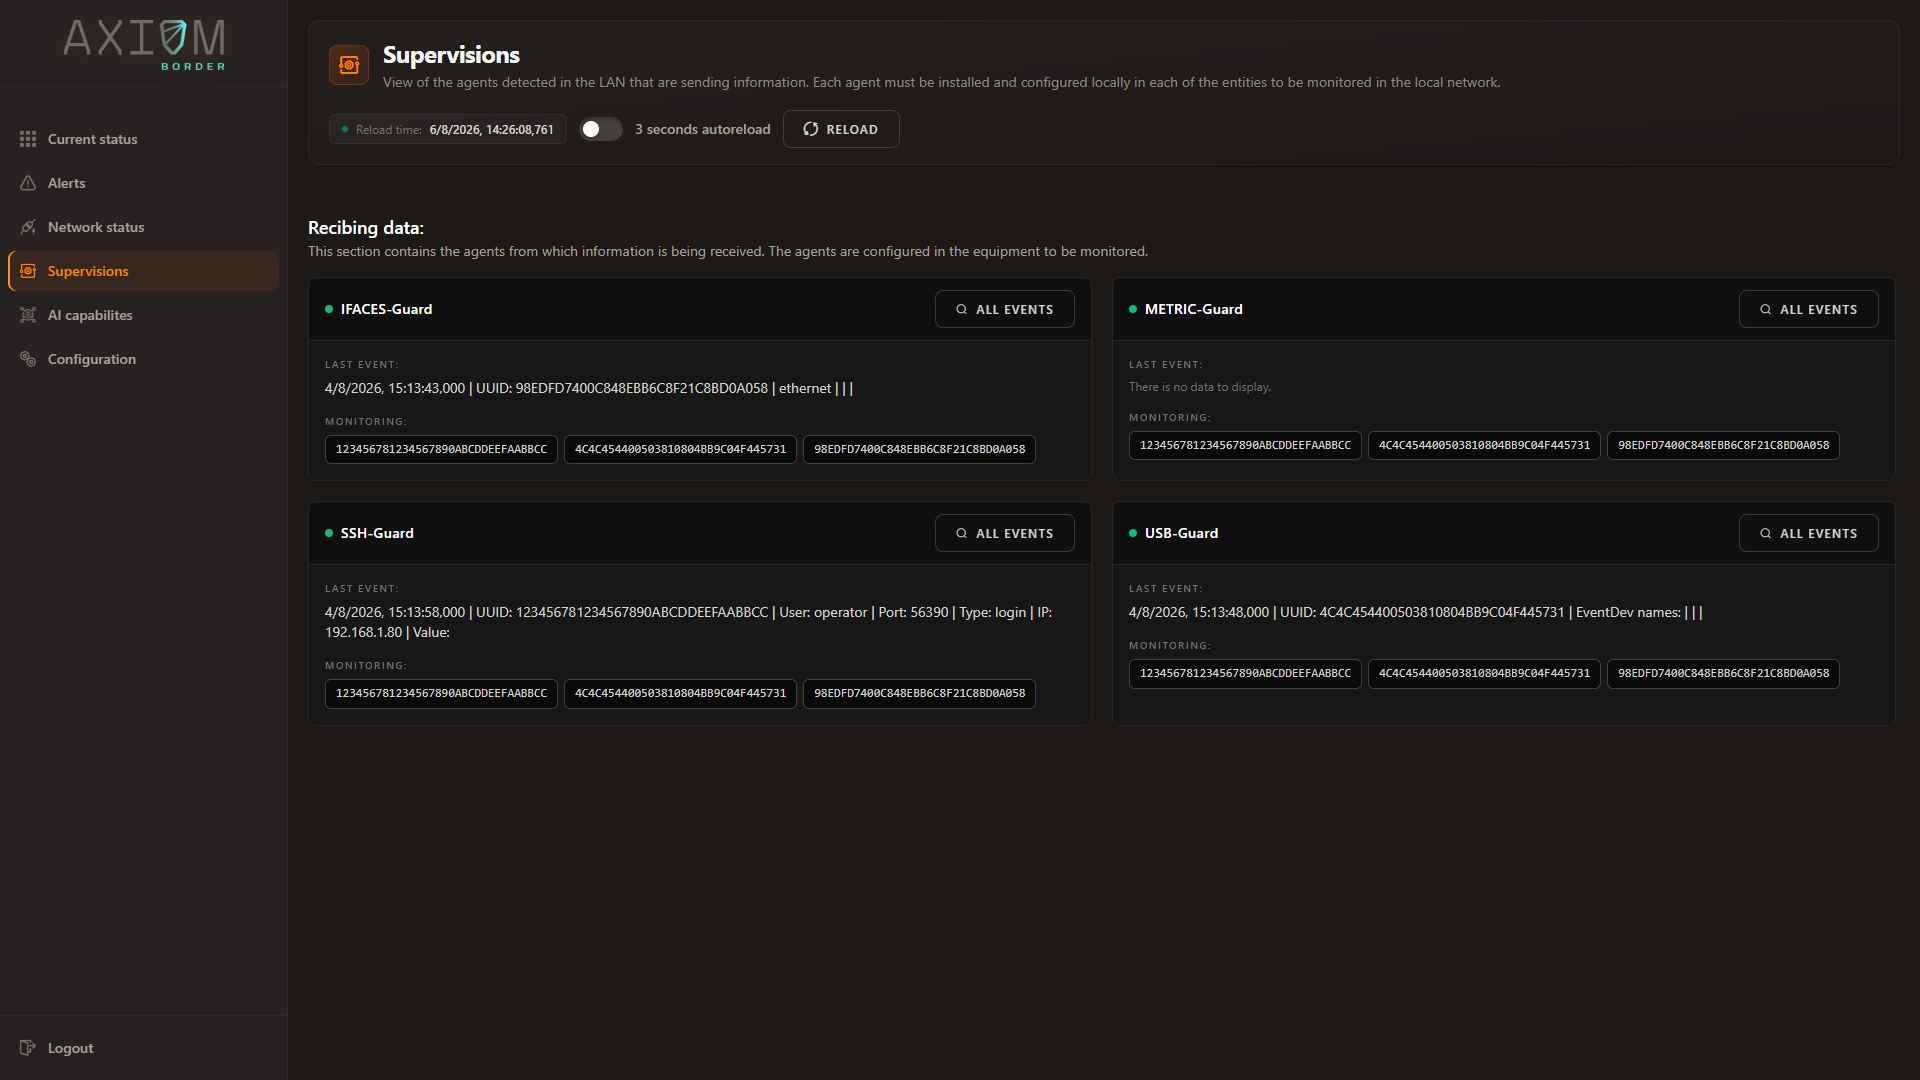
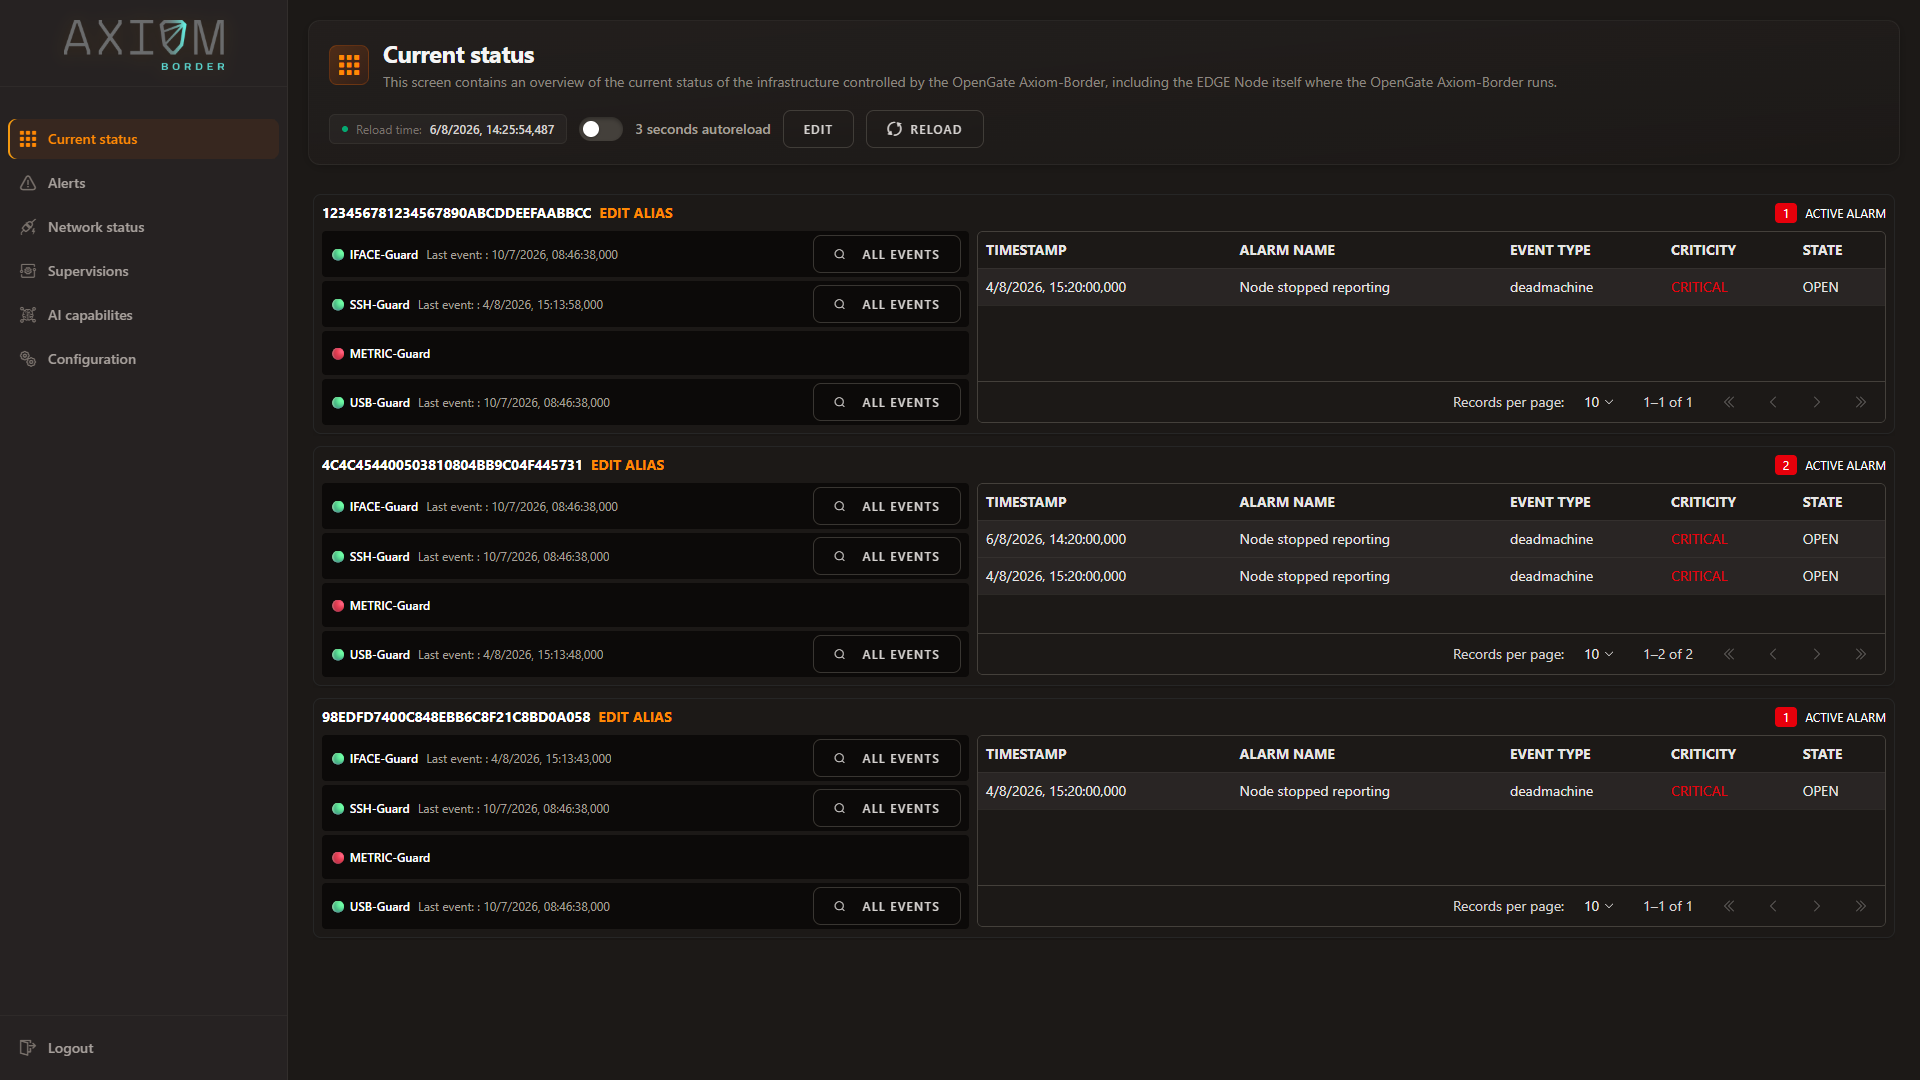
You see this stage in two views. Supervisions lists the agents reporting in, one card per monitor,
with the last event each delivered. Hosts Status turns the same data around and shows one block per
machine, with the alarms currently open against it.
2 · Observe — what the probe works out for itself
Four probes on the network, one listening and three asking, each with its own scheduler. This is the
stage that needs no cooperation from the equipment it watches, and it is covered in full on the next
page: The four probes.
Everything they find lands in Network status.
3 · Decide — rules that run on the probe
Two mechanisms, both evaluated locally against data the probe already holds:
Rules on each event, as it arrives. One rule set per probe, so a rule can react to a new host, a
newly opened port or a changed value the moment it is observed.
Periodic checks against the history. Counting occurrences over a window, and detecting the absence
of them — a node that stopped reporting is a condition you can only see by looking for silence.
Both are edited from Alerts → Rules configuration. Neither needs the uplink, which is the whole
point: a probe whose link is down still decides.
4 · Act — the alarm, and who hears about it
A raised condition becomes a coalesced alarm — one alarm with a count, not one alarm per occurrence —
which lands on the operator’s Alerts view and in the probe’s live feed, so the console’s counter moves
immediately. From event to alarm covers how that works and why it is built that way.
And then, only if you asked for it, the same alarm goes out to OpenGate.
Nothing leaves the machine by default
This is the commercially important half of the loop, so it is worth stating plainly:
The OpenGate integration is optional and starts inert. It has to be configured and enabled before a
single byte goes anywhere.
The message broker the console listens on lives on loopback. It is not exposed to the network.
All four probes write to local storage before any decision to publish exists.
A probe you install and never configure for the cloud is a probe that never talks to one. What travels
when you do enable it is the complete inventory of your network, which is exactly why the probe refuses
to start that integration over an insecure address — see Security posture.
Axiom Border looks at the network with four probes. The split that matters is not what they scan but
whether they speak: one of them observes without emitting a single packet, and three of them ask
questions and read the answers.
Probe
How it works
What it produces
When it runs
Passive analysis
Listens to the traffic reaching its capture interface. Emits nothing
Assets indexed by MAC address, which address belongs to which device, LLDP neighbours, the services actually in use, sixteen industrial protocols in play — four of which never touch IP, traffic volume per host, what kind of point the probe is plugged into, and vulnerabilities inferred from device identity
Continuously, persisting what it has learned on a configurable interval
Network discovery
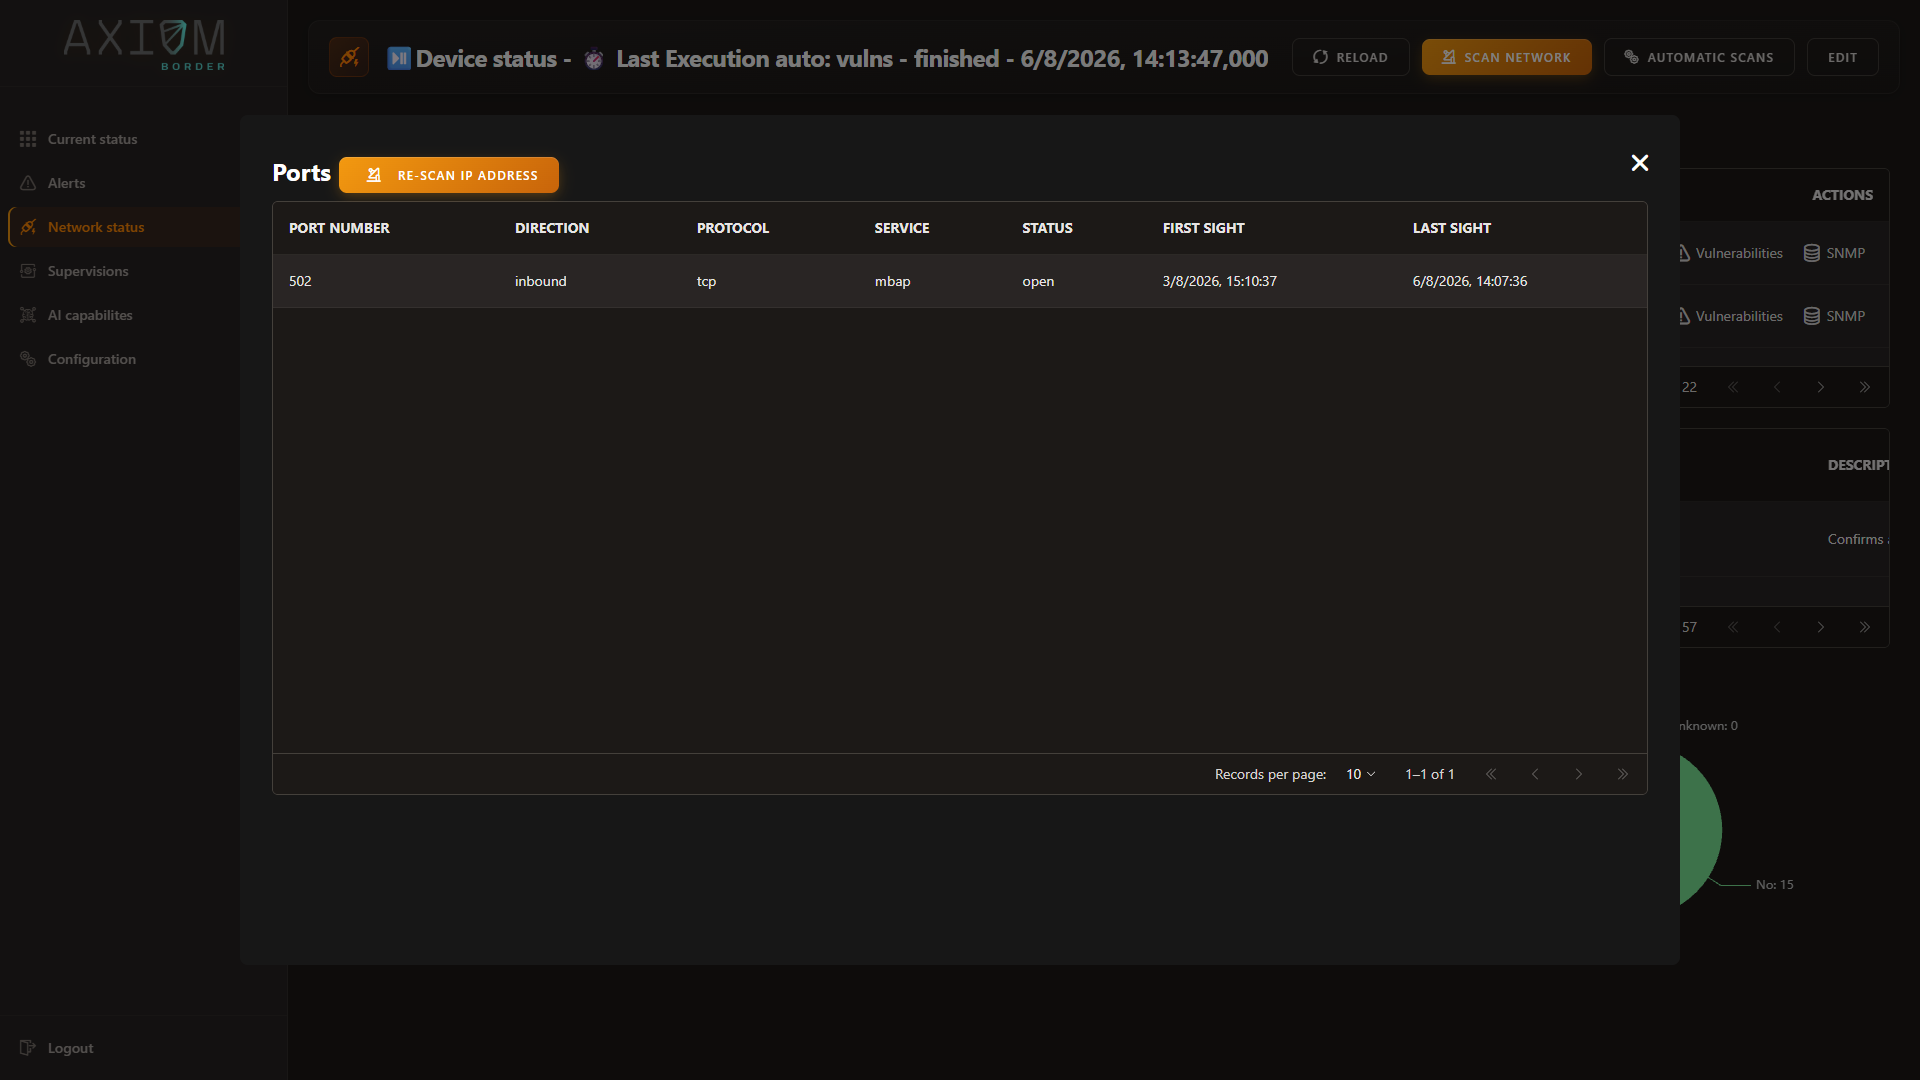
Port scanning over TCP, and UDP if you ask for it
The real state of a port — open or closed — the service behind it, and an operating-system guess
On a schedule, or on demand
Vulnerability scanning
A template engine that sends the probes a check needs
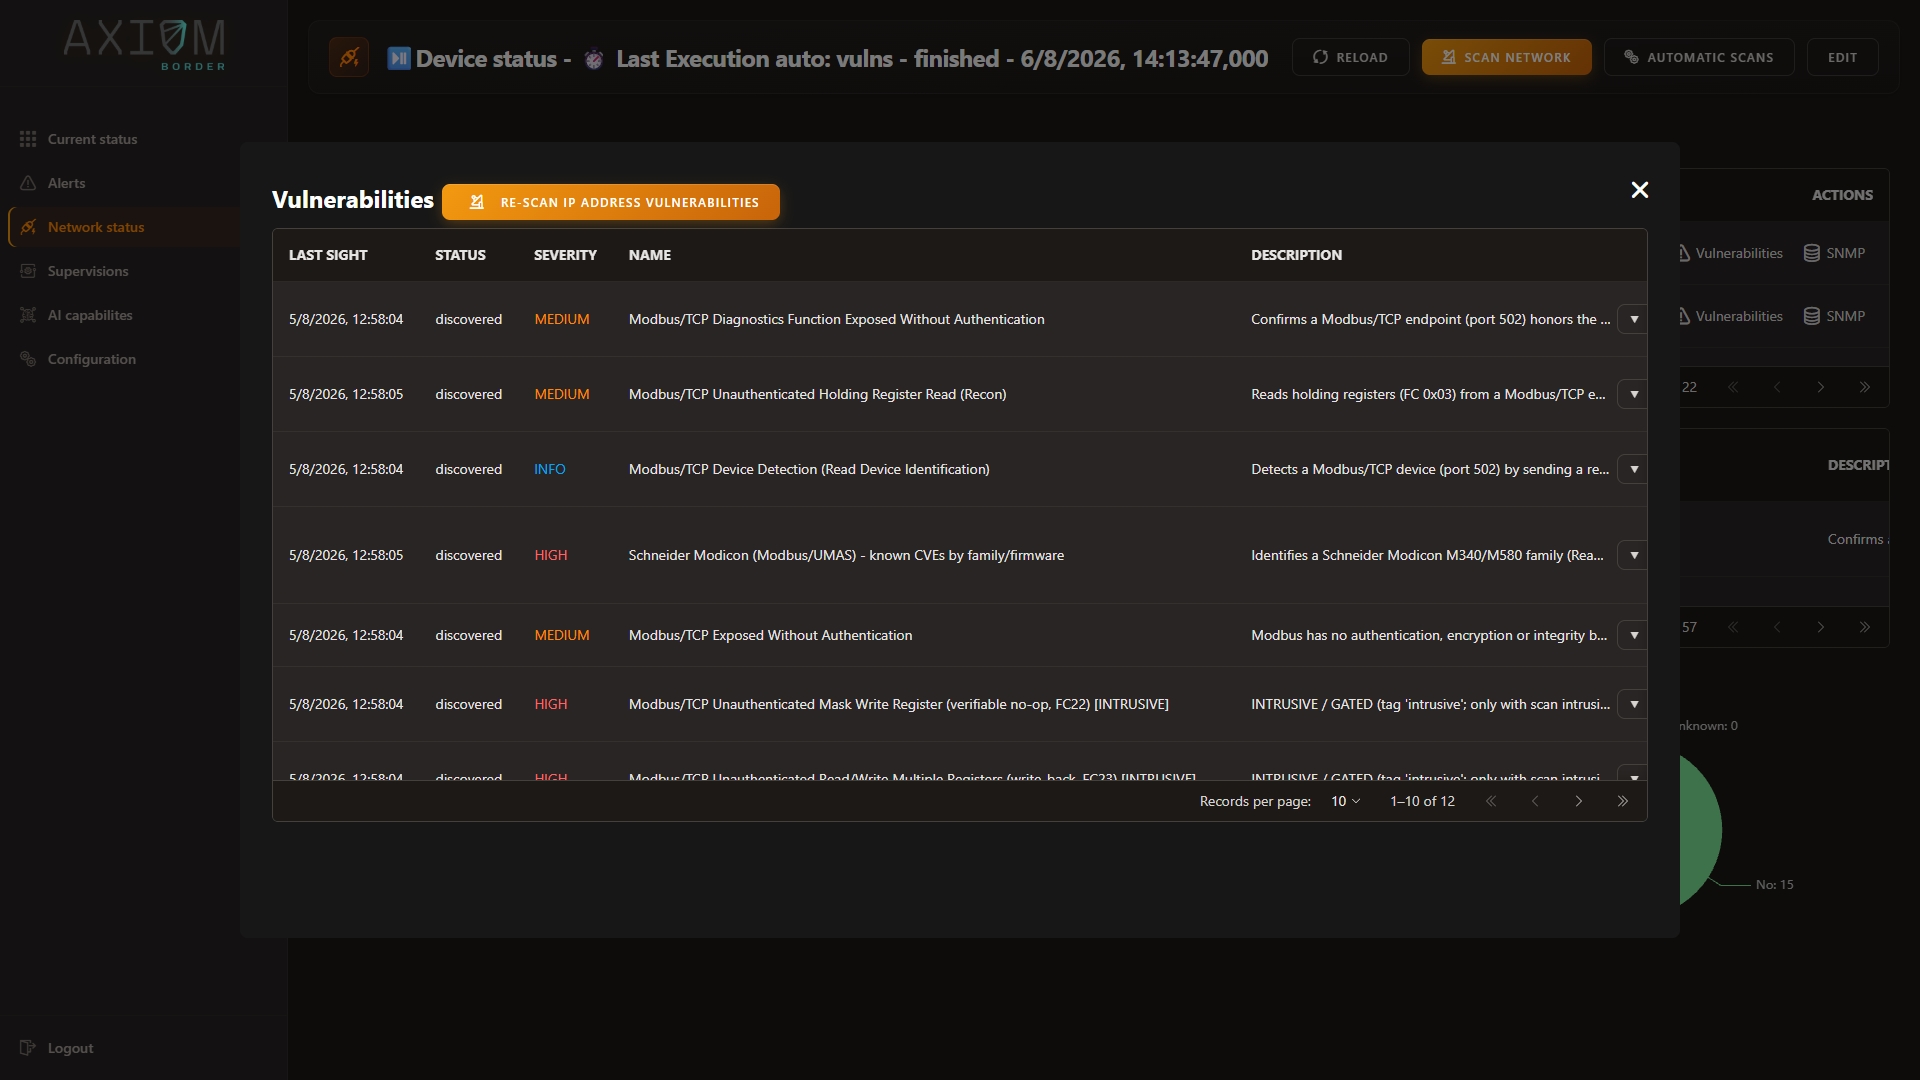
Findings with their severity, the check that fired, and what it matched. Includes a purpose-built industrial suite for Modbus, IEC-104, DNP3, BACnet and OPC UA
On a schedule. The layer that writes to devices needs two separate locks released
SNMP
Queries v1, v2c or v3, using stored credential profiles
Values by symbolic name or numeric OID, and full sweeps, resolved against the bundled vendor catalogue
On a schedule, or on demand
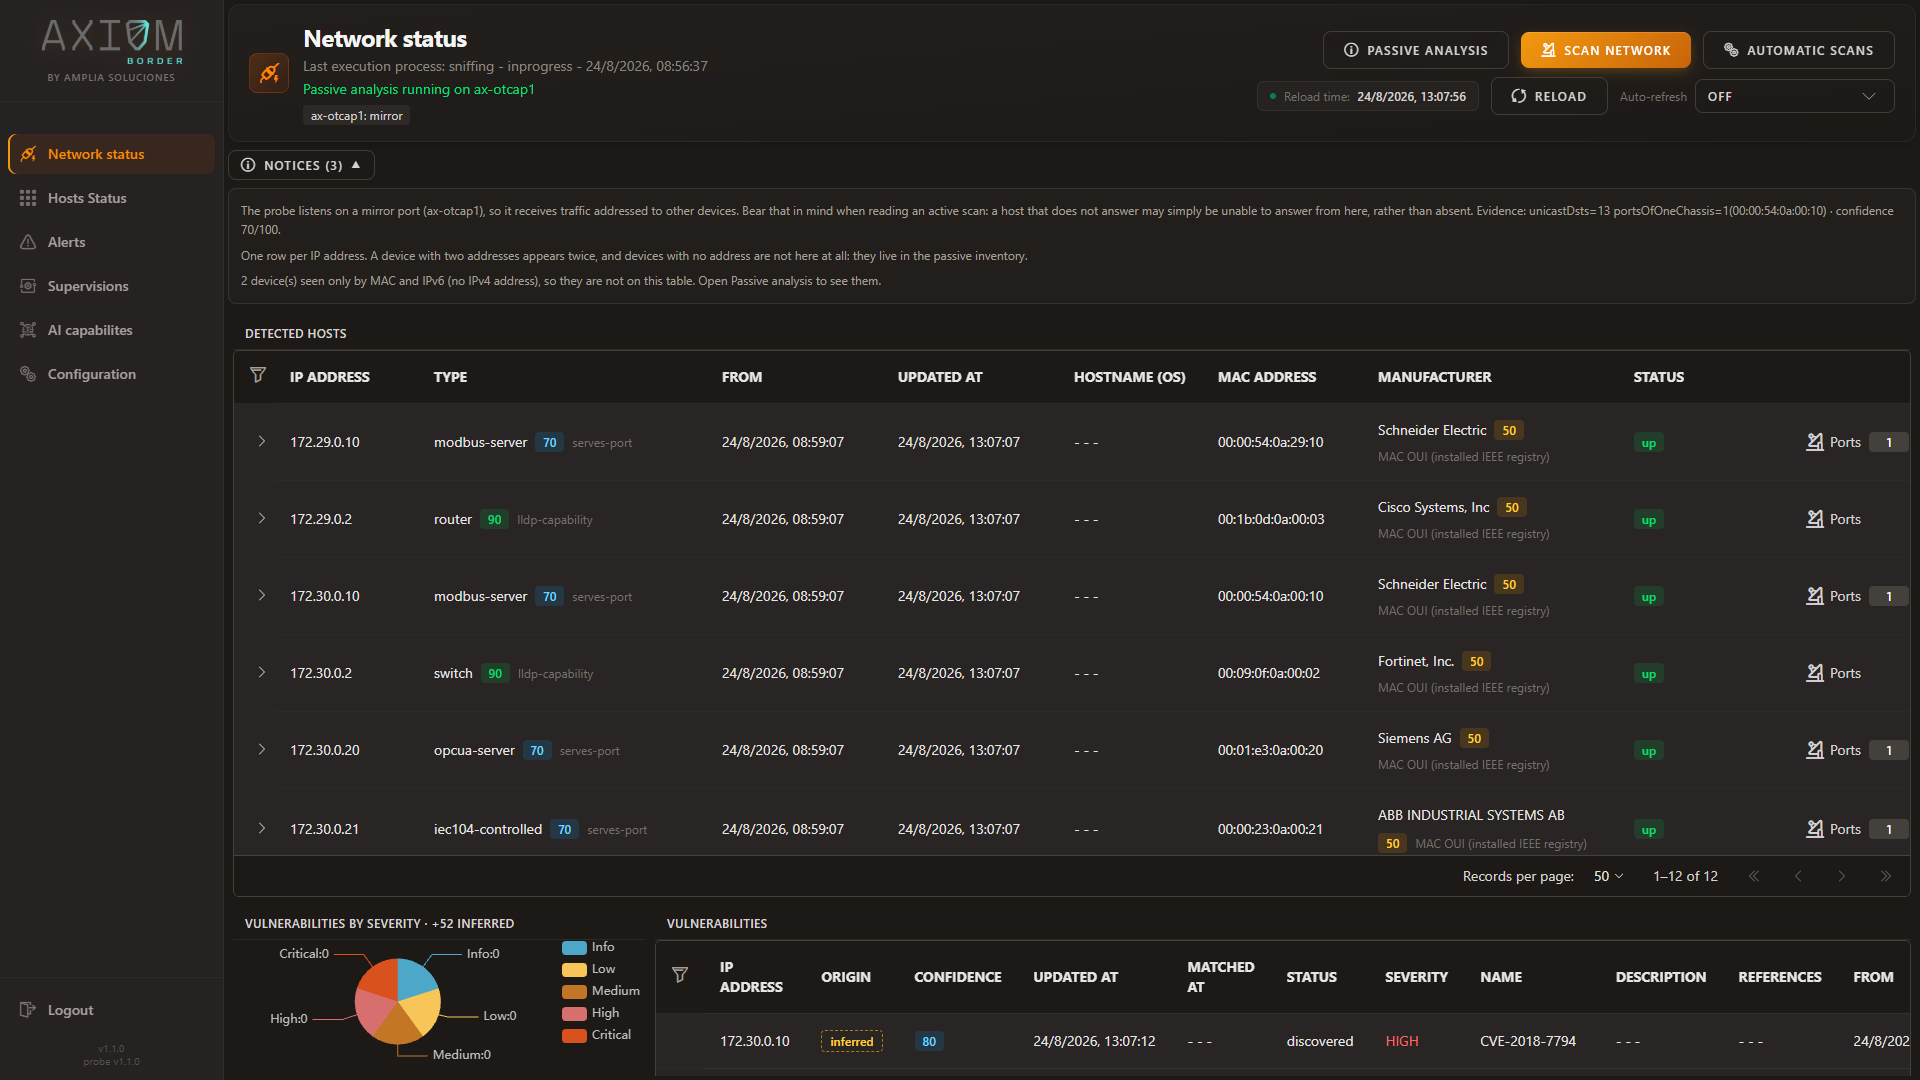
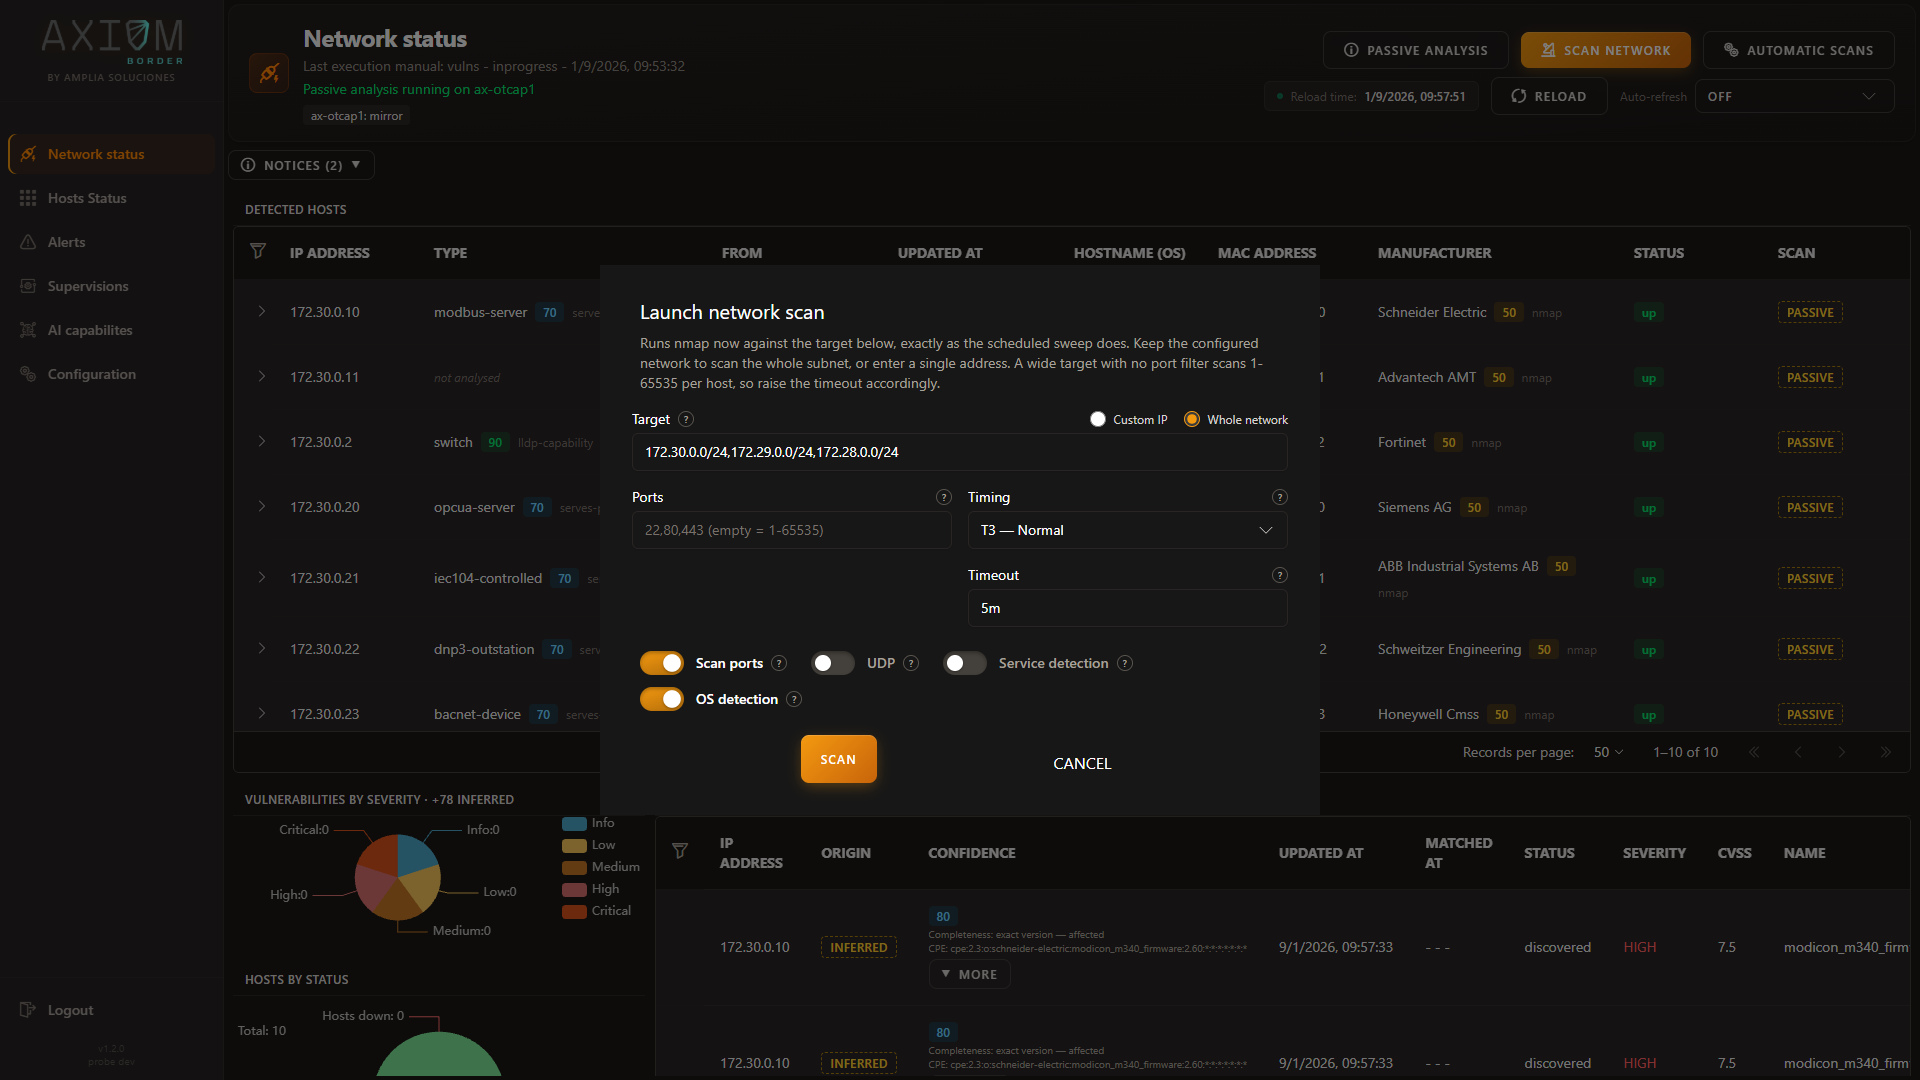
All four feed the same Network status view, and their launch controls sit in its header:
Passive analysis opens what the listening probe has worked out, on its own terms.
Scan network launches a discovery run now.
Automatic scans opens the schedules for all of them, in the Configuration view.
Turning off the passive probe does not stop discovery
The four are independent. Switching continuous passive analysis off leaves discovery, vulnerability
scanning and SNMP populating the inventory as before — and the reverse holds too. What you lose is the
half of the picture that nothing else can produce, which the next page is
entirely about.
The contract the three active probes share
Launching a scan does not block. The three asking probes behave identically here, and knowing the
contract is what lets you tell “still working” from “gave up”:
The request is accepted immediately and comes back with an identifier for that run.
The run reports one of three states: in progress, failed, or finished successfully.
Only one discovery run happens at a time. Asking for a second one while the first is going is
refused, unless you explicitly force it — which cancels the running one and marks it as failed rather
than pretending it finished.
The Network status header shows the state of the most recent run, so the view always says whether what
you are looking at is current or still being assembled.
A scan interrupted by a restart does not hang forever
If the probe restarts while a scan is running — a reboot, a service restart, a power cut — that run can
never finish, because the process that owned it is gone. On start-up, every execution still marked as
in progress is moved to failed.
The practical consequence: a run that shows as in progress is genuinely in progress. It is not a ghost
left over from last week, and you do not have to guess which it is.
What each probe is for, in practice
Reach for network discovery to answer what is listening here, right now. It is the only one that
can confirm a port is genuinely open, because it is the only one that knocks.
Reach for vulnerability scanning once discovery has given it a baseline to work from. Its
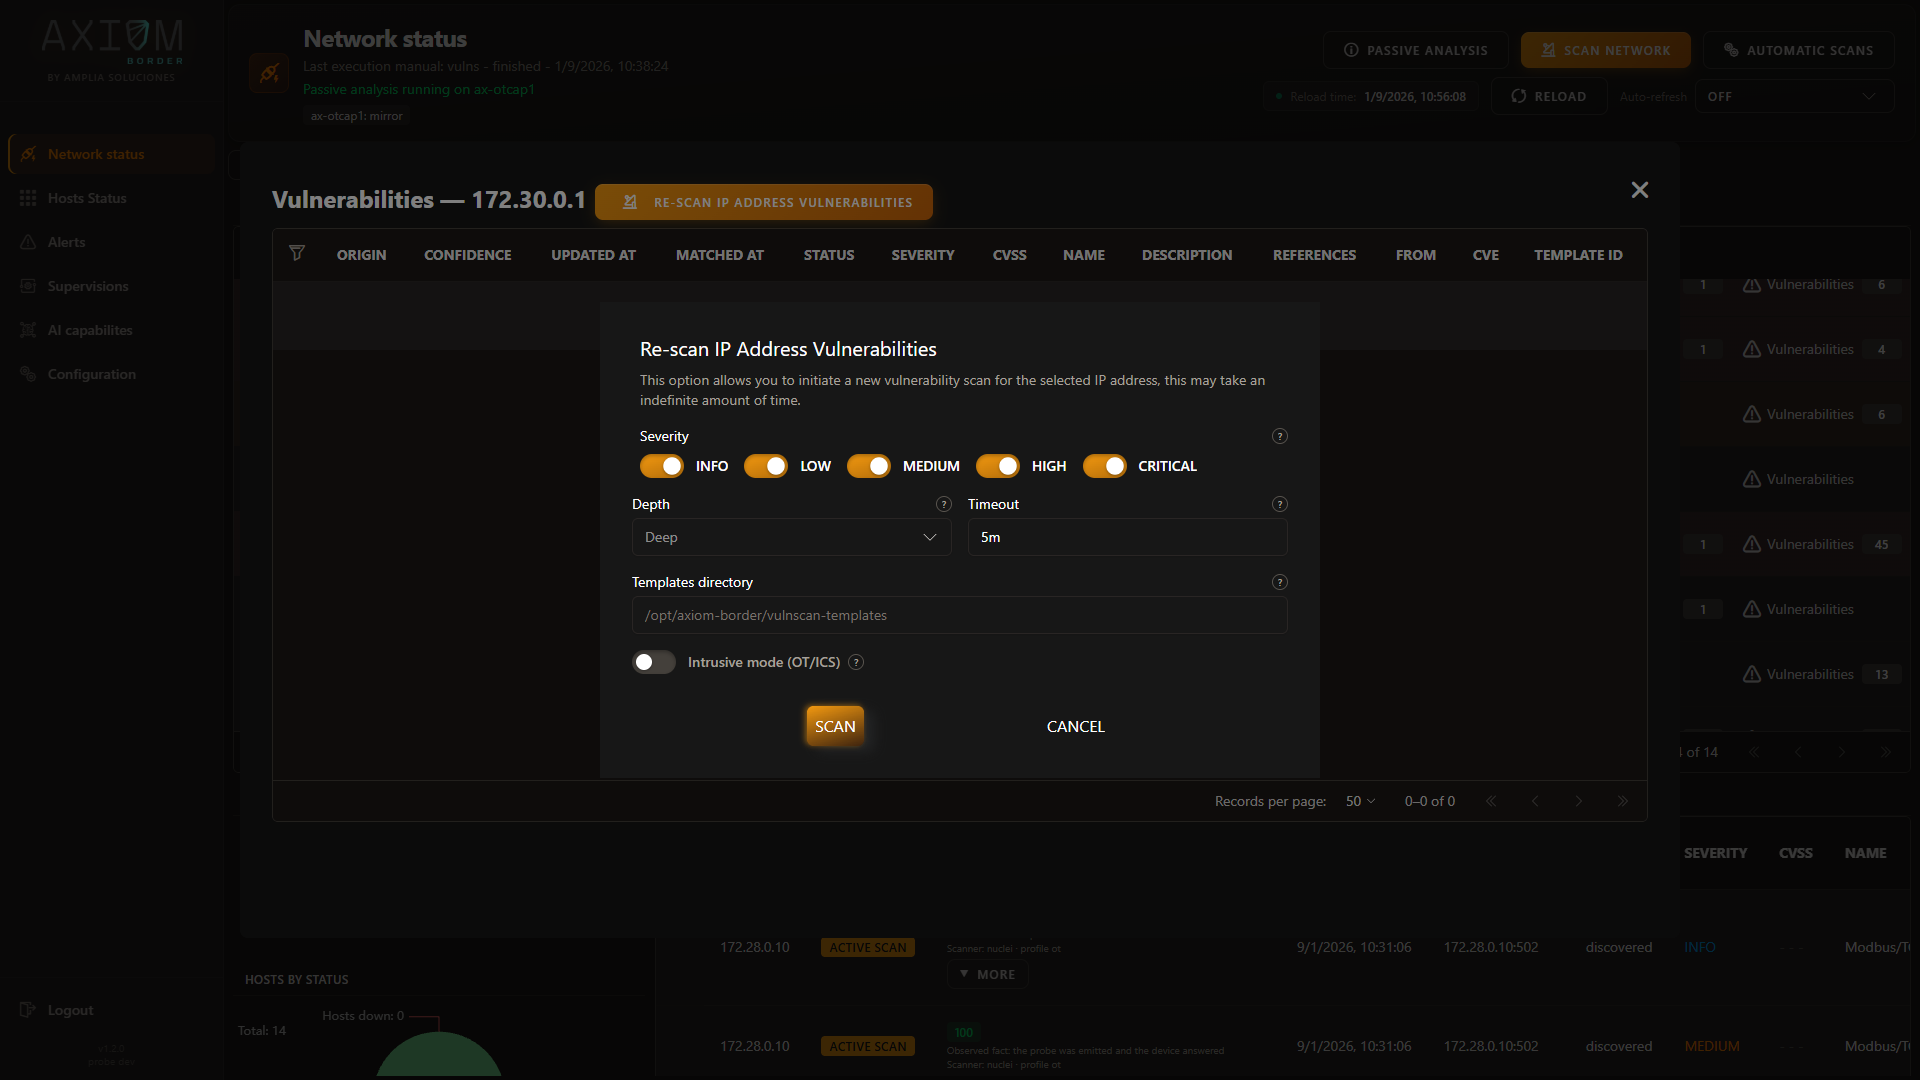
industrial suite is what separates this from a general-purpose scanner, and its write-capable checks
are switched off behind two locks — read
OT/ICS vulnerability scanning before enabling anything against
a live plant.
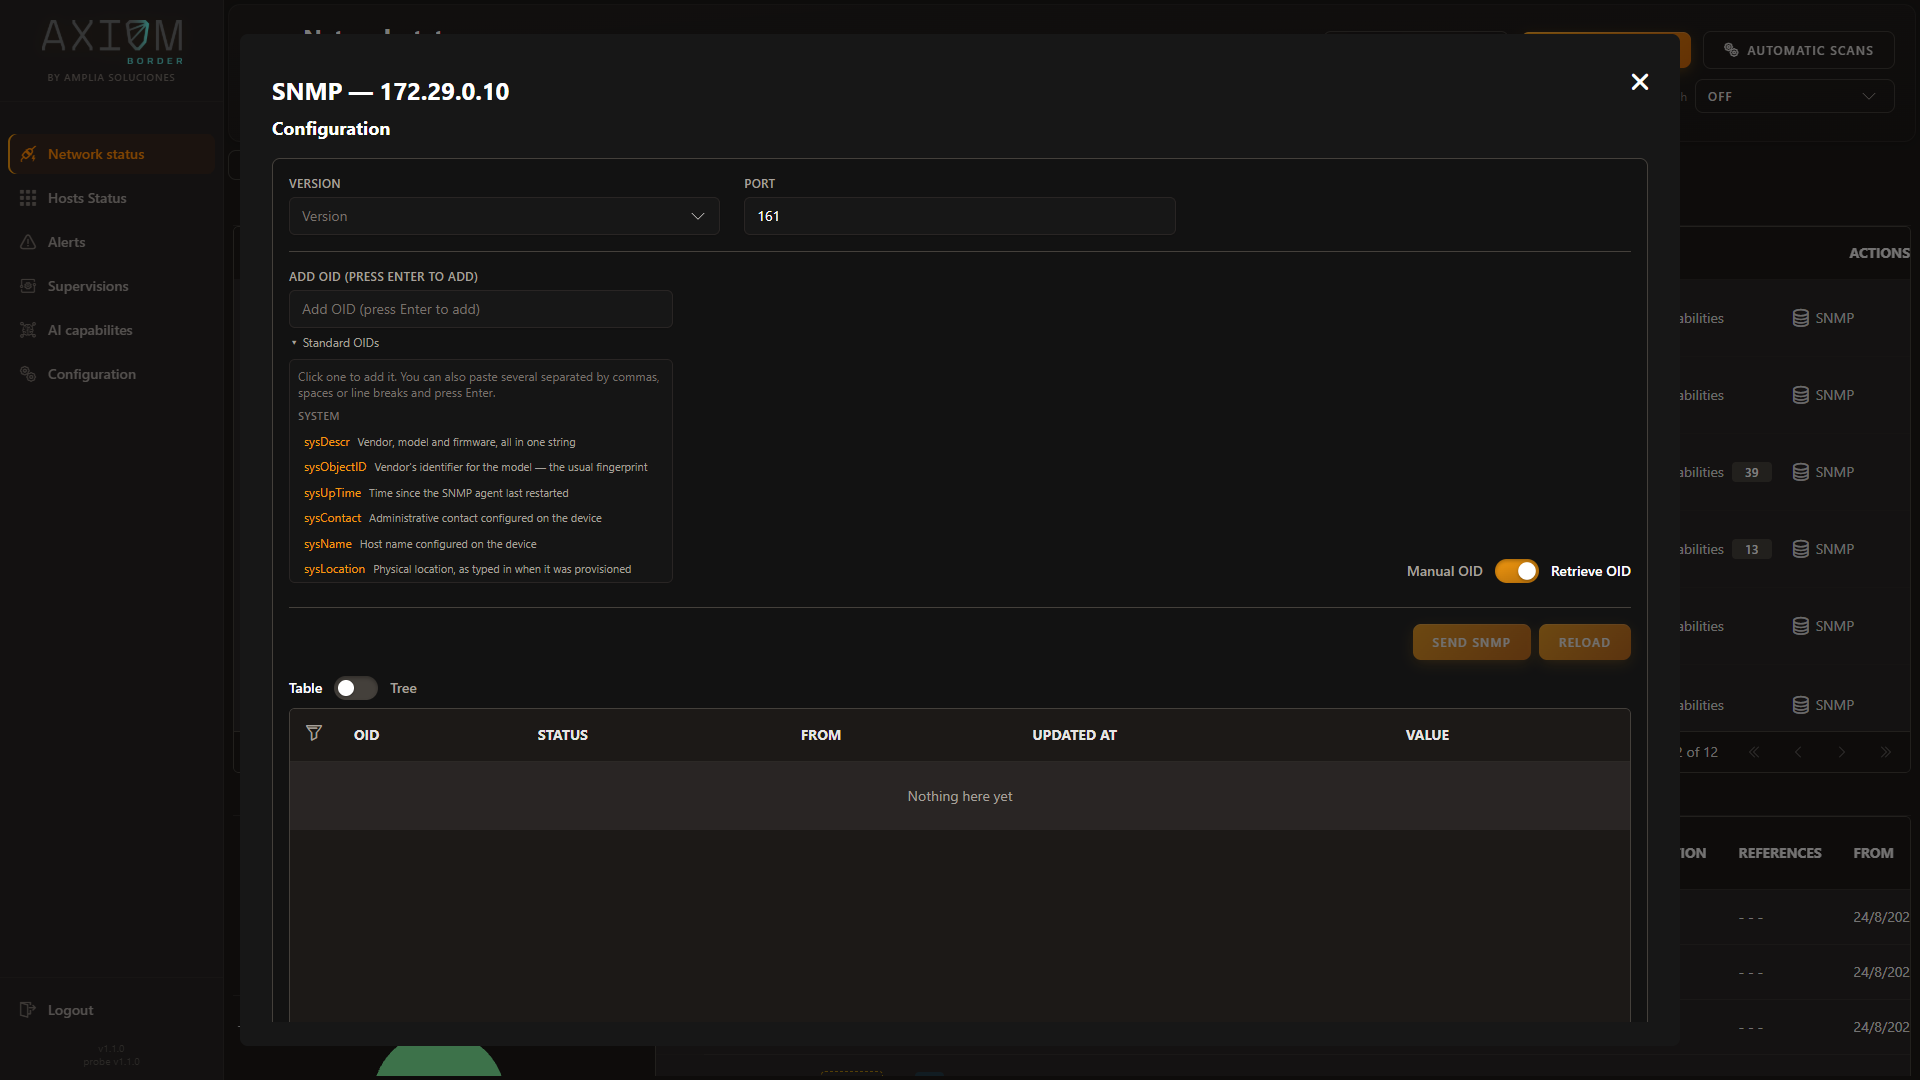
Reach for SNMP when you want the device’s own account of itself. Symbolic names work without
internet access because the vendor catalogue ships with the product.
Passive analysis you do not reach for. It is always running, and it is the one that works when the
other three cannot.
Next:Passive and active — why these are two kinds of claim, not two views of
the same data.
Passive and Active
Two kinds of claim, not two views
This is the piece that gets misread most often, so it is worth saying whole. Passive and active analysis
are not two windows onto the same inventory. They produce different kinds of statement about the
network, and the product is built so that neither one can quietly erase the other.
The console says so on the face of it. In the vulnerabilities table on Network status, every finding
carries an Origin:
Origin
What it means
probe
The request was sent and the target answered. Demonstrated.
inferred
Derived from the device’s identity, with no traffic emitted. It is not proof — verify before acting.
An inferred finding also carries how complete the identity behind it was, and that completeness decides
what the probe is allowed to claim: the exact version licenses a plain affected; vendor and
product with no version is potentially affected, verify; and the vendor alone pins no CVE to the
host at all, so it is reported as a potential surface to go and confirm. The probe never hands you a
conclusion without telling you what it rests on.
Five things worth knowing
1. The passive probe decides whether an active scan means anything
The correct way to install a probe in an industrial network is on a mirror port or a TAP: it receives
everything and cannot be answered. On such a port an active scan returns nothing — and that nothing means
“nobody can reply to me from here”, not “there is nothing here”.
So classifying the connection point is the first thing the passive probe does, and the console leads with
the verdict. Open Notices on Network status:
The probe listens on a mirror port, so it receives traffic addressed to other devices. Bear that in mind
when reading an active scan: a host that does not answer may simply be unable to answer from here,
rather than absent.
Without that line, half a day goes into working out why the discovery scan cannot find a network that is
plainly there.
2. They discover along different axes
The passive probe indexes by MAC address. The active probes index by IP address. That is not a
detail of bookkeeping — it changes what each one is capable of seeing at all.
Passive analysis sees equipment with no IP address of its own: a fieldbus device, an unmanaged
switch, a protection relay publishing multicast. None of these will ever produce a row in an active
scan, however long you run it.
Active scanning sees ports nobody happens to be using right now. A service that is listening but
idle emits nothing to listen to, so passive analysis cannot know it is there.
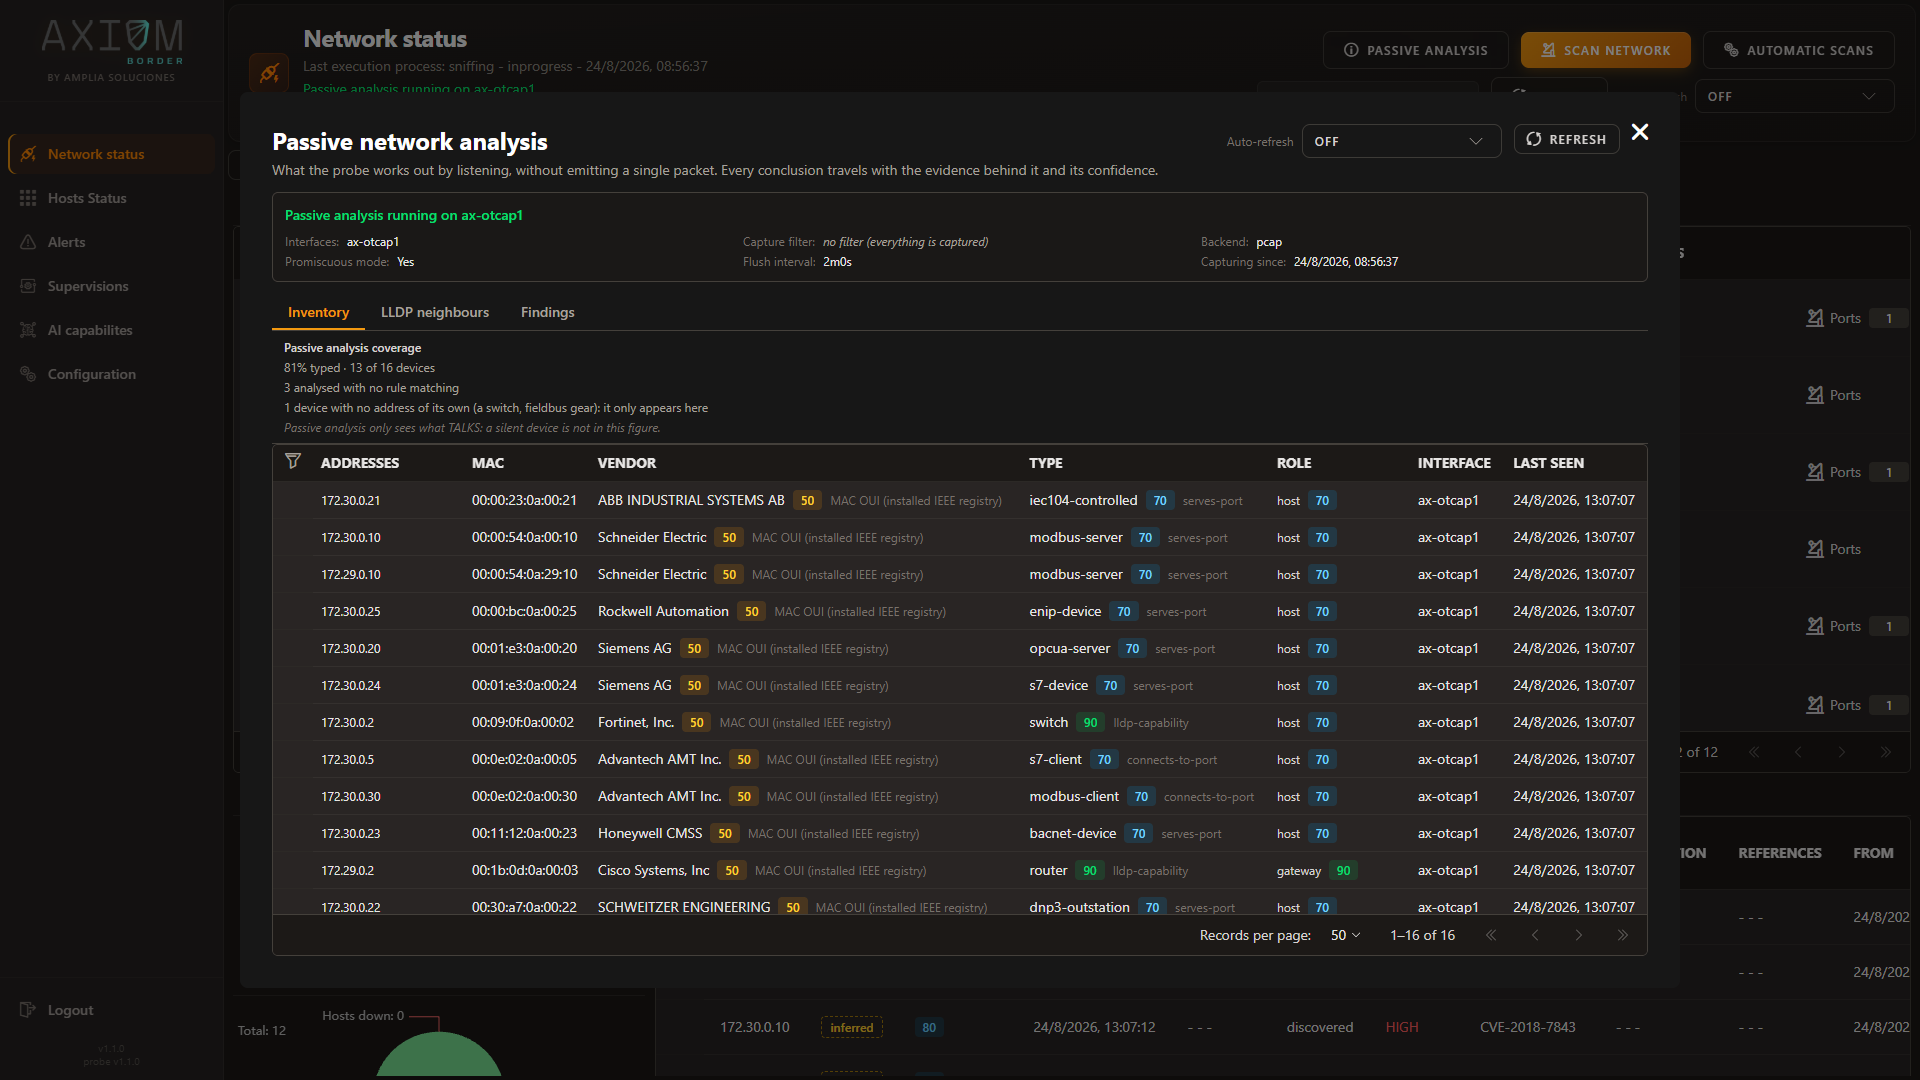
Neither set contains the other. In the capture below the passive inventory holds 16 devices where the
address-indexed table on the same probe holds 12, and the coverage note explains the gap in the probe’s
own words:
Note the closing caveat there, which is the honest limit of the technique: passive analysis only sees
what talks — a silent device is not in this figure.
3. The passive probe feeds the active ones
The relationship is not merely parallel. What listening establishes is used to make the asking sharper:
An SNMP target that is not yet in the inventory gets a quick discovery pass first, so the query goes to
something known to be there.
A vulnerability scan that comes back with nothing gets a discovery pass too, for one specific reason:
to tell “unreachable” apart from “nothing wrong with it”. Those look identical in an empty
report and mean completely different things.
4. Neither origin overwrites the other
Both write into the same identity record, and neither is allowed to win by arriving last. Each leaves its
claim, its confidence and the evidence behind it, and the value you see is derived from all of them.
You can read this directly in the console. A manufacturer is shown with a confidence score and the source
that produced it — the vendor registry installed on the probe, the device’s own declaration over its
maker’s discovery protocol, or an active scan’s own table — each with its caveat attached. A registry
entry names the network card; a device declaring itself names the device. Those are not the same
claim, and the console does not pretend they are.
So when the active scan says Schneider Electric where the registry said Moxa, that disagreement is
kept as data rather than resolved in silence. Nearly always it is telling you something true and
useful: a network card from one vendor inside another vendor’s cabinet.
“Undecided” is a result, not a gap
A device the passive probe analysed without any rule matching is labelled undecided, and one written
before passive analysis was available is labelled not analysed. They are shown differently on purpose:
the first is a conclusion, the second is an absence of one. Neither is a failure, and neither is
presented as an unknown you should chase.
5. An active scan does not close a passive inference
The one to hold on to.
A passive inference is not the outcome of a test. It is a statement about what a device is, drawn from
how it behaves on the wire. An active scan failing to reproduce it does not refute it — the scan may not
have looked for it, may not have been able to reach it, or may have been reading a mirror port where
nothing can answer in the first place.
“I did not find it” is not “it is gone.” So a scan that comes back quiet leaves existing passive
findings standing, and the console keeps showing them with their origin and their confidence. If you want
one retracted, retract it deliberately — do not let an empty scan do it for you.
What it understands on the wire
Listening is only worth as much as what the probe can make sense of. It reads industrial traffic at two
levels, and the second is the one a general-purpose scanner does not have at all.
Over IP — thirteen industrial protocols
Recognised from the conversation itself, which means the probe also records which side is serving and
which is asking. That distinction is half the value: a station polling a controller and the controller
answering are very different things to find on a segment.
Protocol
Port
Protocol
Port
Modbus/TCP
502
BACnet/IP
47808/udp
S7comm
102
EtherNet/IP
44818 · 2222/udp
OPC UA
4840
PTP
319–320/udp
DNP3
20000
HART-IP
5094/udp
IEC 60870-5-104
2404
KNXnet/IP
3671/udp
CODESYS
1200
FINS
9600/udp
MELSEC
5007
Four of those — CODESYS, MELSEC, KNXnet/IP and FINS — sit on ports their vendors use by convention
rather than by registration, which someone else is entitled to use for something unrelated. They are
still reported, because leaving a controller untyped merely because its maker never registered a port is
the more expensive mistake. They are simply published at a lower confidence, visible to you in the
console, so weaker evidence never passes for strong evidence.
Directly over Ethernet — where there is no IP to work with
The traffic that matters most in a substation or on a production line often has no IP layer at all.
Nothing that keys off addresses and ports can describe it. Axiom Border reads it natively:
Protocol
What it establishes
IEC 61850 GOOSE
The protection and control messaging between relays
IEC 61850 Sampled Values
The measurement stream feeding those relays
PTP / IEEE 1588
Who the network’s grandmaster clock is — the time source the protection equipment trusts, where an unexpected one is a finding in itself
PROFINET DCP
Devices announcing and being addressed on a PROFINET segment
PTP appears in both lists because it is genuinely spoken both ways, so the two tiers together come to
sixteen distinct protocols, not seventeen.
Without these, a probe on such a segment could report a busy cable and nothing more. Traffic carried
inside stacked VLAN tags is followed through the tags rather than measured from a fixed offset, so a
QinQ segment reads correctly instead of producing confidently wrong values.
What it will not guess
The probe names a device’s role only where the evidence supports it — a Modbus server, a DNP3
outstation, an IEC-104 controlling station, a GOOSE publisher, a PTP node. It deliberately stops short of
labelling something a PLC, an RTU or an HMI from traffic alone, because that is a claim about
the device’s function that the wire does not actually establish. An honest protocol role beats a
plausible-sounding guess.
Side by side
Active scanning
Passive analysis
Footprint on the network
Emits. Against a PLC, an aggressive scan is a genuine operational risk
Zero packets. Nothing a control device could misread
Identity is based on
The IP address
The MAC address, which survives a change of addressing
Equipment with no IP
Invisible
Inventoried
On a mirror port or TAP
No reply means no results
Works normally — and says why the active scan came back empty
Topology
Does not see it
Neighbours with their chassis and port, gateway verdict, address conflicts
Services
The real state of the port, confirmed
The services actually in use, and which side is serving
Traffic volume
—
Counters per host, and the breakdown behind them
Industrial protocols
The five the OT suite tests against
Thirteen over IP, plus four that never touch IP at all
Industrial posture
What the templates test for
What the equipment declares about itself as it operates
They are complementary, and the product treats them that way. Use the active probes to confirm; use the
passive one to know what is worth confirming, and to see the part of the network the active ones cannot
reach.
Three different things can raise an alarm on an Axiom Border probe:
A periodic check counting occurrences of an event over a window and finding too many.
A dead-machine check finding a node that has gone silent — alarming on absence, which is the only
way to catch a node that stopped reporting rather than one reporting something bad.
A rule deciding, in code, that what it just saw is worth an alarm.
All three arrive at the same gate, and what that gate does is the single most operationally significant
thing in this part of the product.
Coalescing by identity
Two alarms that say the same thing about the same device are the same alarm. When a condition trips
repeatedly, the probe does not create a new alarm each time. It recognises the identity of the alarm —
which agent, which device, which name and type, which severity, which underlying description — and folds
the repeat into the alarm that is already open. What changes are its fields:
Field
Meaning
First seen
When the condition first held
Last seen
The most recent time it fired
Count
How many times it has fired
This pays twice over, and the two payoffs are worth separating because they matter to different people.
For the operator. A brute-force attempt that trips a threshold every five minutes for an hour is
one thing happening, and it should read as one row with a count of twelve. Twelve identical rows are
not twelve times the information — they are the same information, twelve times, pushing everything else
off the screen. An alert repeated a thousand times is an alert, not a thousand alerts.
For the probe. Every distinct alarm is a distinct series in the history. Minting a fresh identity per
occurrence makes that history grow without bound and slows every query made against it. Coalescing keeps
the history of a busy probe queryable months later.
One row with a count is the signal, not a summary
When you see a count of 40 on an alarm, the probe is not telling you it collapsed 40 alarms to save room.
It is telling you the condition has held 40 times since it first fired, and it is still open. The count
is the severity information.
Acknowledging is not silencing
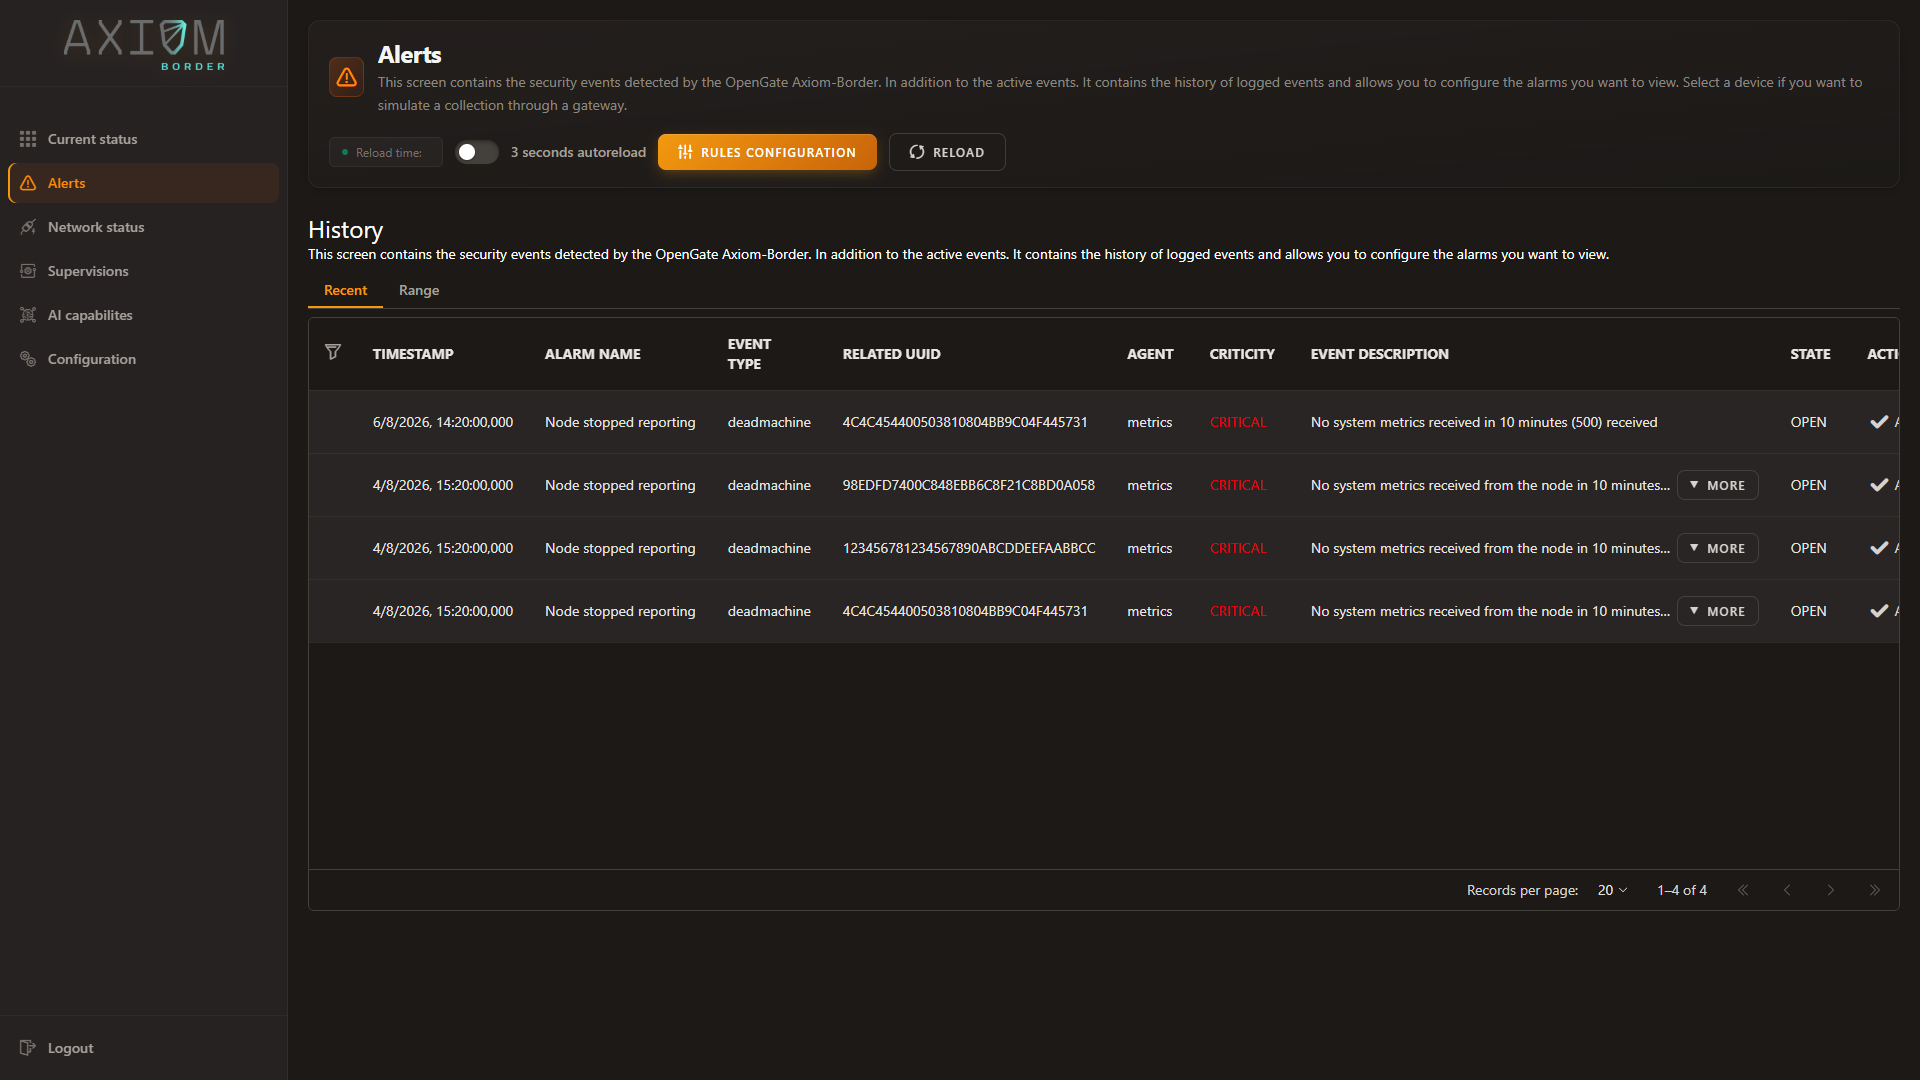
ACK on the Alerts view marks an alarm as seen, which closes the coalescing window on it.
The consequence is deliberate: the next occurrence after an acknowledgement opens a fresh alarm. It
does not silently add one to a count on something you already dealt with. If the condition comes back, you
get told again.
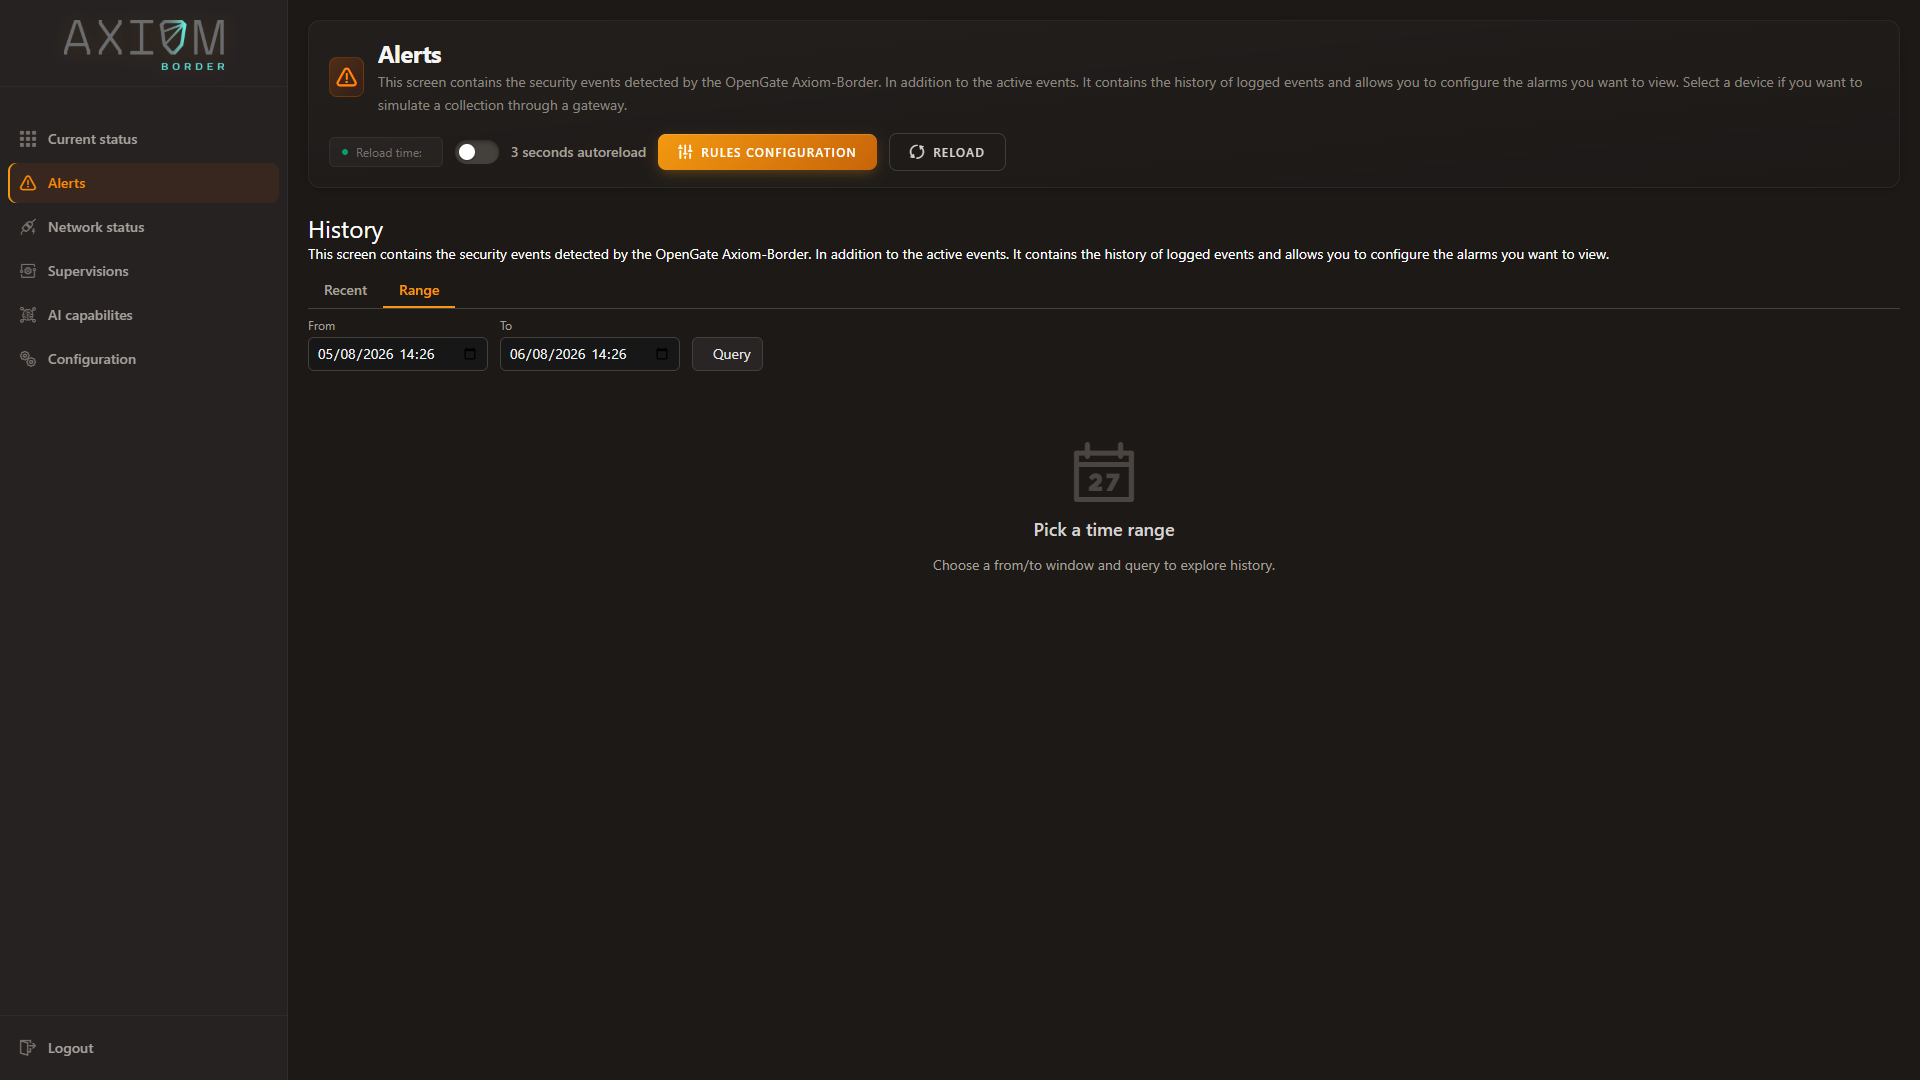
Two tabs sit above the table. Recent reads the probe’s live feed — the alarms it already holds in
memory, answered instantly. Range queries a window of history instead, which is what you want when
reconstructing an incident after the fact.
Open alarms survive a restart
The state of what is currently open is kept on the probe itself, not held in memory and lost on the next
service restart. A probe that reboots comes back knowing which alarms were open and which had been
acknowledged — and a quiet week does not make it forget either.
Rules that already know what changed
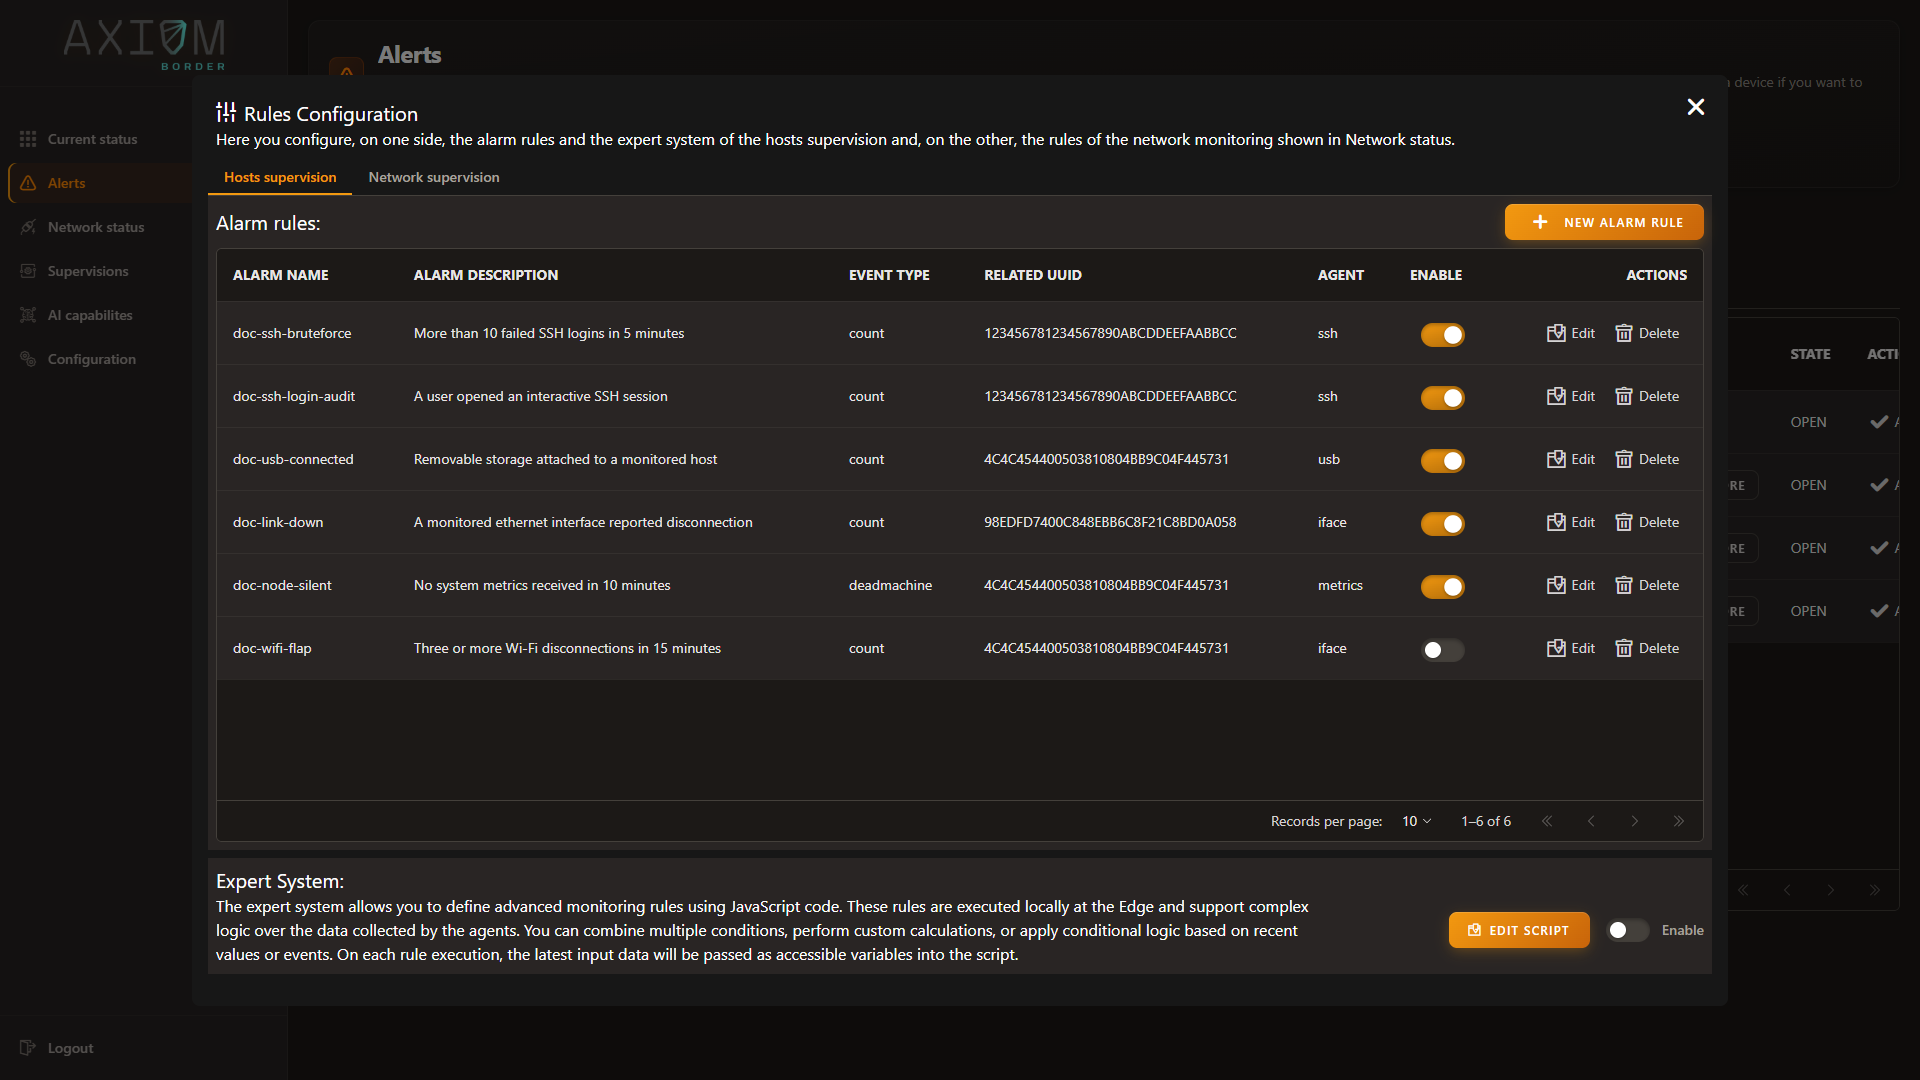
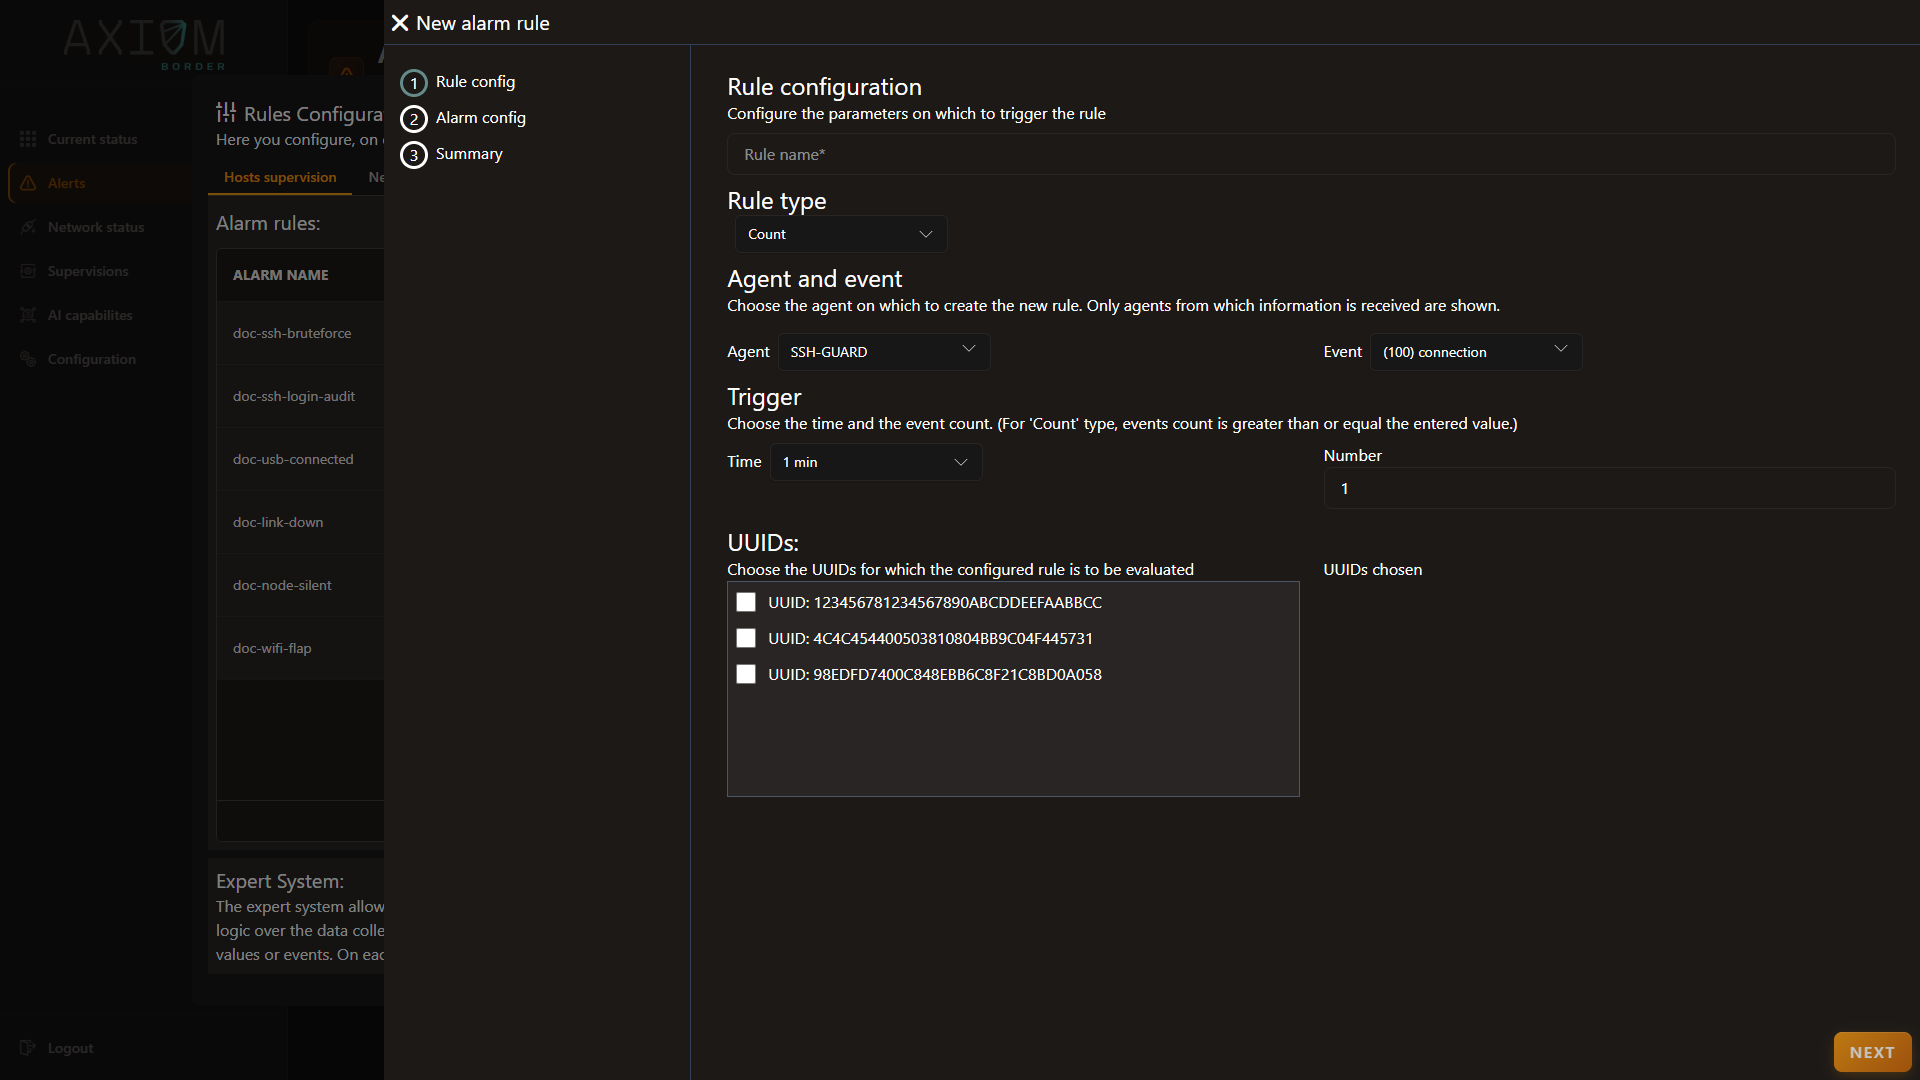
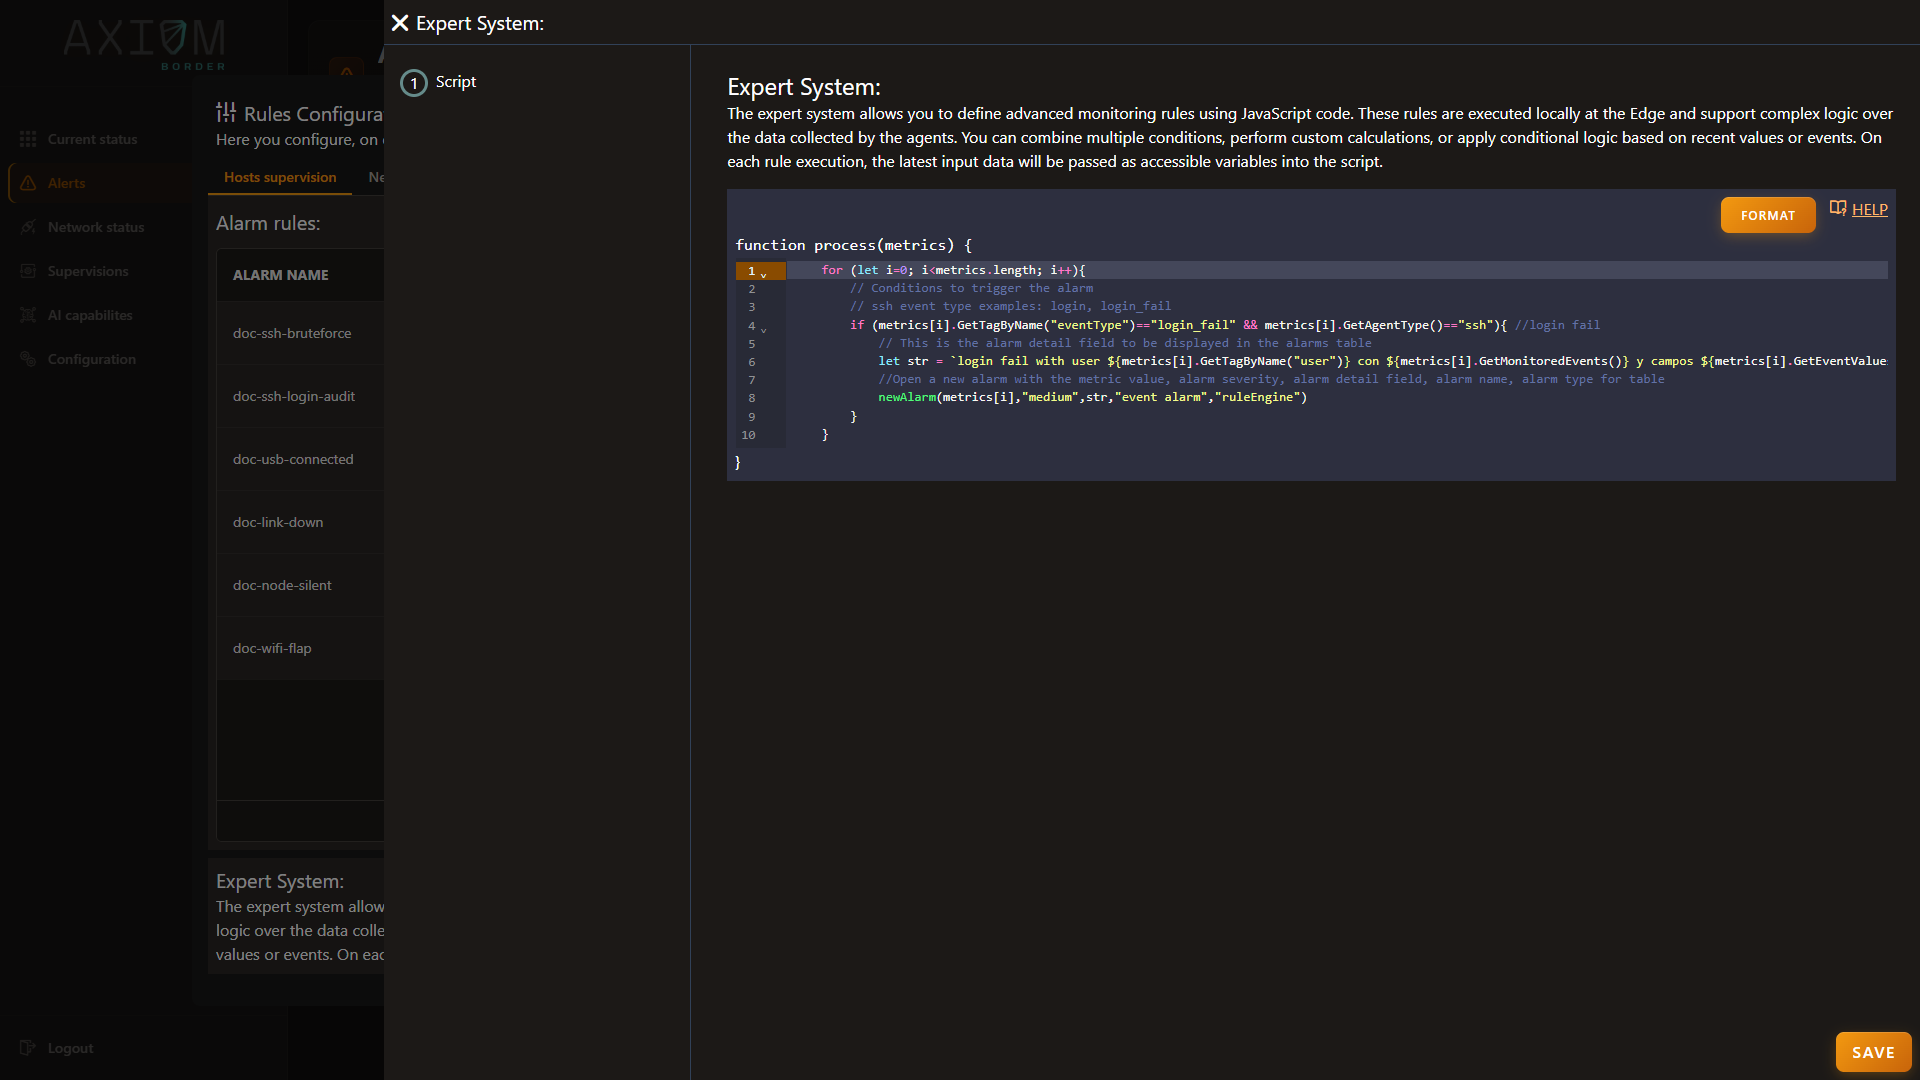
Rules are edited from Alerts → Rules configuration, where the declarative alarm rules sit in the upper
table and the scripted Expert System sits below with its own enable switch:
There is one rule set per probe — one for discovery, one for vulnerability scanning, one for SNMP and
one for passive analysis — and each receives that probe’s findings already enriched with what changed
since the last time the probe saw the same thing:
whether this is new,
whether the value changed,
and what the previous value was.
That is why a rule can say “this port is new” or “this value moved” without querying any history to
find out. The comparison has already been made by the time the rule runs.
Each probe reports at its own granularity — one finding per vulnerability, one per host and one per port
for discovery, one per value for SNMP, one per traffic flow and per port for passive analysis.
Rules are per probe, not across probes
A rule sees one probe’s findings. Correlating across probes — this port opened and that vulnerability
appeared — is outside what the rules engine does; each evaluation belongs to a single probe. Build that
correlation where you have the whole picture, in OpenGate.
The live feed
Every alarm is also pushed onto a small in-memory feed of the most recent events, oldest dropping off the
end. It is what the console reads to paint its counter and its Recent tab, which is why those respond
instantly however much history the probe has accumulated.
Full operating detail — creating checks, writing rules, the fields available to them — is in
Alarms and rules.
Next:AI on the probe — when the rule needs a model to decide.
AI on the Probe
Inference happens on the node
Axiom Border can detect anomalies with machine-learning models, and the important word is where: the
models run on the probe, in containers on the same machine. There is no call to an external service,
no data sent away to be scored, and no dependency on a link being up.
That follows from the same premise as everything else here. A probe that had to reach a hosted model to
decide would be a probe that stops deciding the moment the link drops — and would mean the traffic
patterns of an isolated industrial network leaving it in order to be analysed.
The images the models run from are installed with the product, so an air-gapped probe can train and infer
with nothing fetched from anywhere.
The circuit, end to end
flowchart LR
    D["Agent data<br>on the probe"] --> T["Trainer<br>container"]
    T --> M["Model<br>on the probe"]
    R["Rule"] -->|asks| M
    M -->|anomaly| R
    R --> A["Alarm"]
Training. The probe exports the data it holds for one agent and hands it to that agent’s trainer
container. Retraining is scheduled rather than manual, can be cancelled while it runs, and its state is
kept — so you can tell a model that is training from one that failed to.
Inference. The rule for an agent asks the model to score what it just received. If the answer comes
back as an anomaly, the same rule raises the alarm.
And that alarm is an alarm like any other. It goes through the same coalescing gate described in
From event to alarm — same identity rules, same count, same acknowledgement behaviour. An
anomaly detected by a model is not a second class of signal with its own inbox; it lands on Alerts
beside everything else, and an operator does not need to know which mechanism produced it to act on it.
Health. A rule can also read the model’s own metrics, and the probe polls the models’ health
endpoints. This matters more than it sounds: a model that has stopped answering is then an observable
fact rather than a silence that looks exactly like “no anomalies today”.
Where you manage it
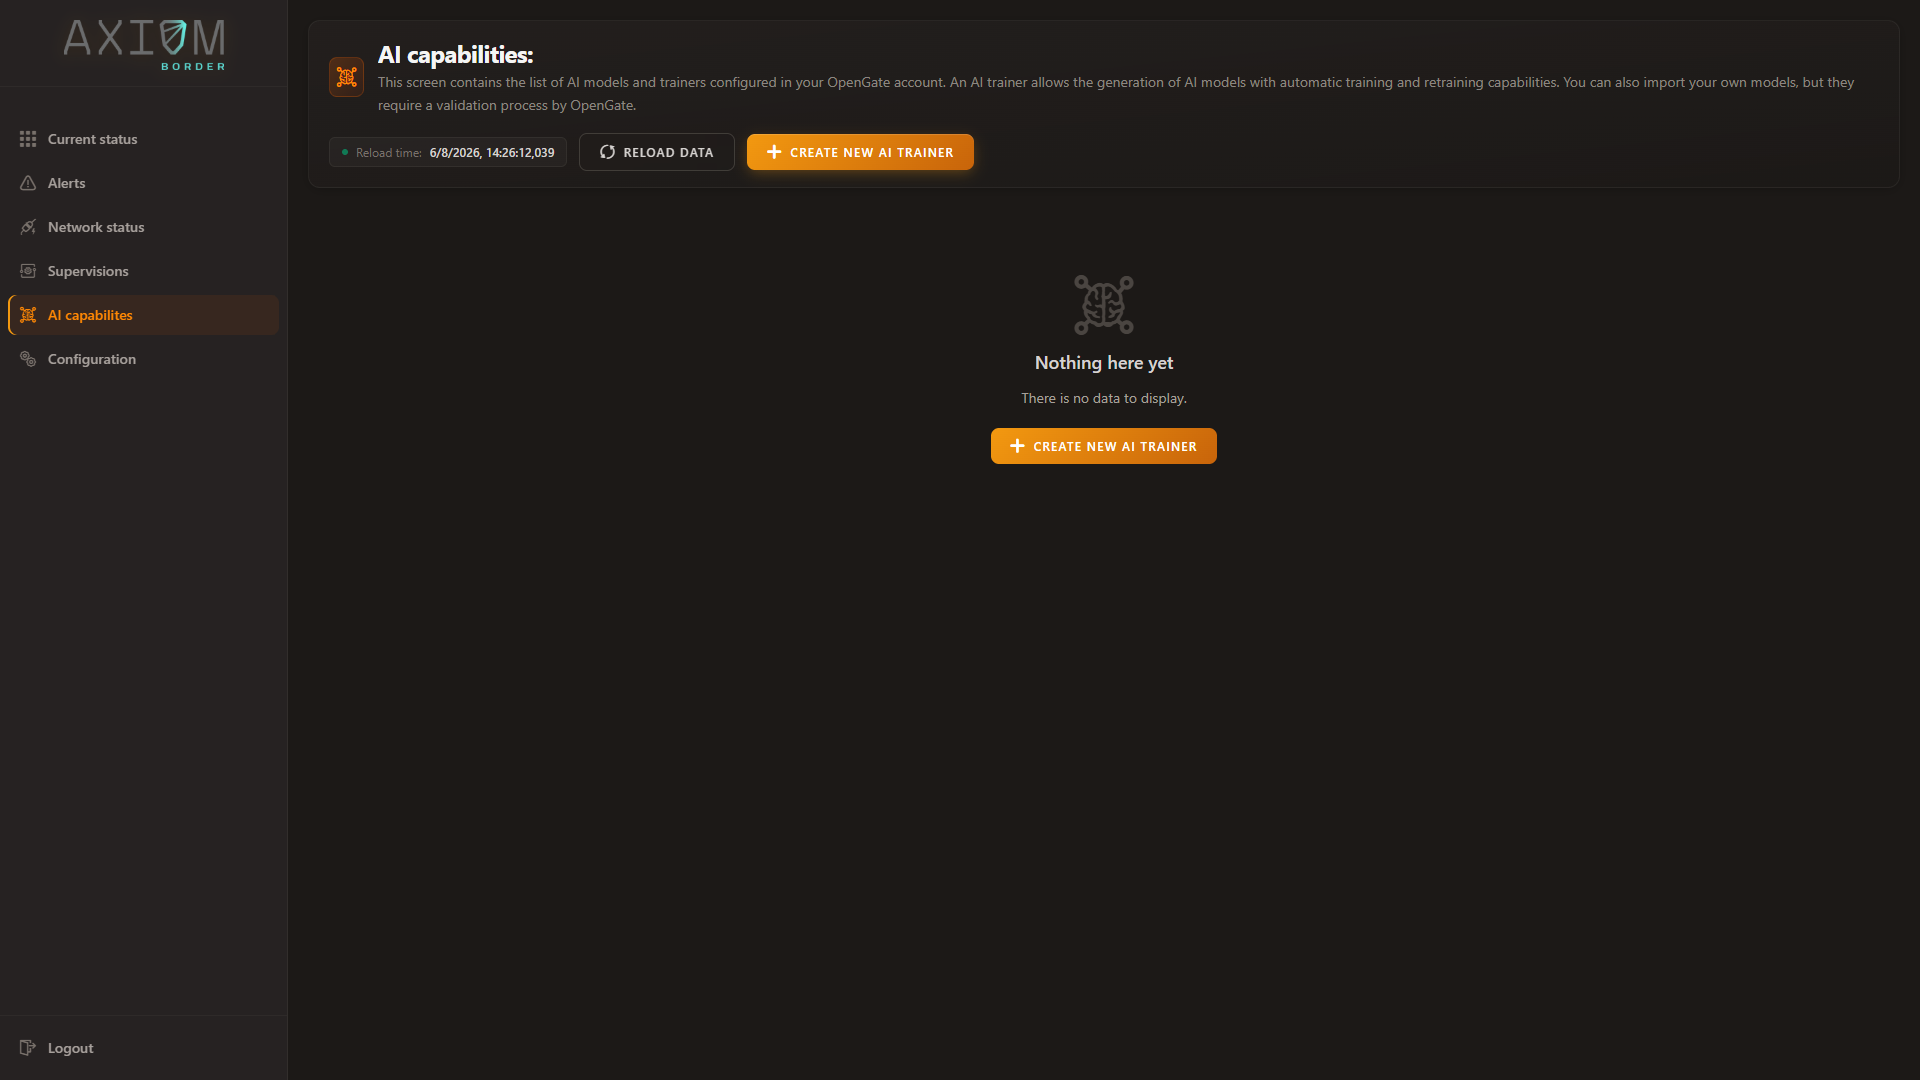
AI capabilities in the console lists the models and trainers configured on the probe:
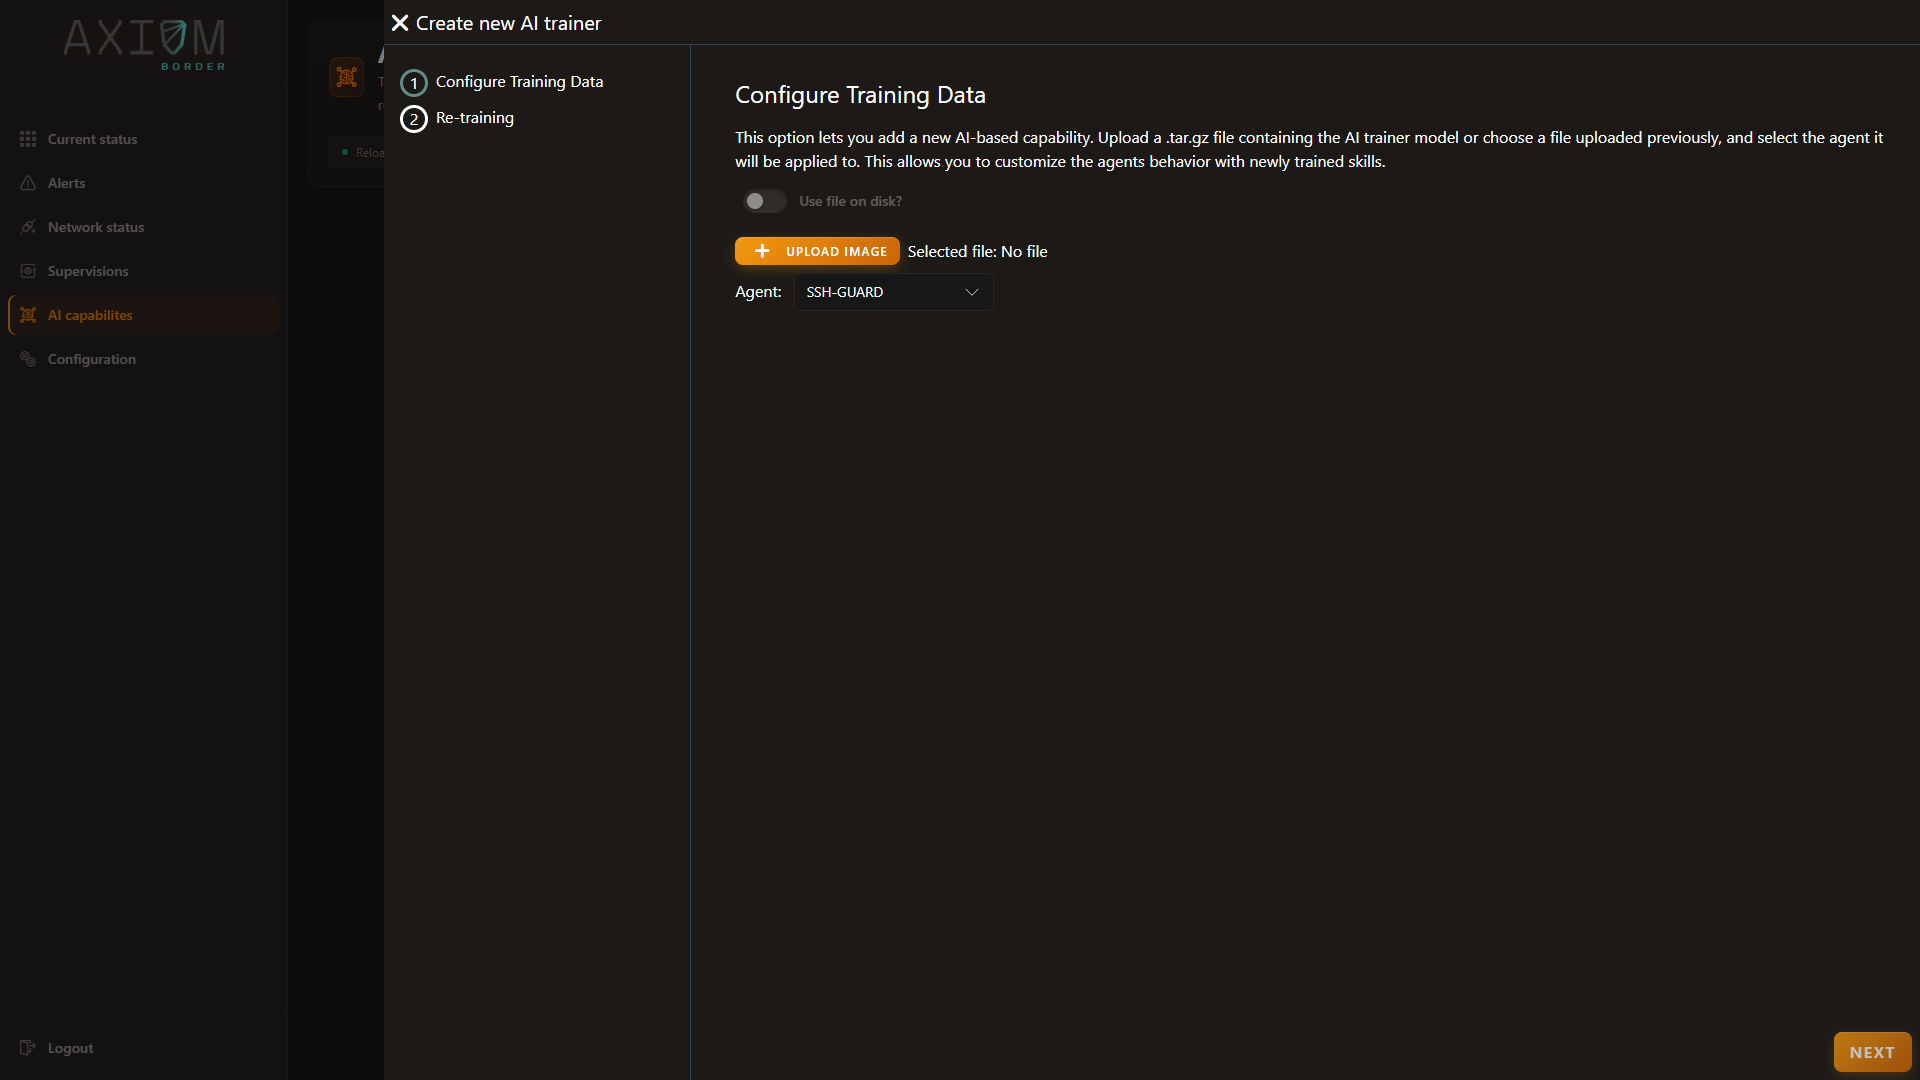
Adding one walks a wizard: upload the trainer package, or pick one already on the probe, and choose the
agent it applies to.
Deploying, restarting, deleting and importing images are all driven from here. The rule that calls the
model is enabled in step with the capability itself, so a model you deploy is a model that gets asked.
Linux, and the central role only
The container runtime the models need is Linux-only, and only the central role installs it. A
monitoring node does not run models, and neither does a probe running natively on Windows — which is a
development scenario, not a supported production one. On such a host the AI capability simply does not
start, and the deployment controls have nothing behind them.
If you intend to use anomaly detection, deploy the probe as central on Linux.
Full operating detail — image formats, the training cycle, calling inference from a rule — is in
AI capabilities.
Next:Security posture — the probe’s own attack surface, and where each kind
of data lives.
Security Posture
The posture is deployed, not offered
Axiom Border sits inside the network it watches, which makes its own surface part of the product. What
follows is not a list of hardening options to consider. It is what the installation puts in place, on
both roles, with no decisions required from you.
Front
What is deployed
Console and API
HTTPS unconditionally, localhost included. There is no plaintext listener to fall back to
Certificate
Issued by a local authority on the probe at first boot — no external PKI, no internet. Replaceable with your own, and reloaded without dropping connections
Sessions
Token-based, signed with a key generated for that installation. Repeated failed logins from one address are throttled, and every login is written to the audit trail
Message bus
The embedded broker listens on loopback only, and its WebSocket listener is off. The console reaches it through a bridge inside the API’s own encrypted connection, using a single-use ticket that expires in seconds
Metrics ingestion
Not open to the network. The authentication step is waived only for callers inside a configured range, which defaults to loopback
Configuration
Reading the configuration back returns it with every secret redacted. Comments and formatting survive untouched
Cloud egress
Optional, and inert until configured. An insecure address stops the integration from starting at all
Why the certificate is self-issued
An air-gapped probe cannot reach a certificate authority, and requiring one before the console works
would mean either no encryption or no probe. So the probe issues its own on first boot and is usable
immediately over HTTPS.
Your browser will not recognise that authority, which is expected on first contact. If your organisation
runs its own PKI, install its certificate on the probe instead — see
Configuration.
The same applies to anything else that talks to the probe. Command-line examples throughout this
documentation pass curl -sk, where -k is what accepts the probe’s own certificate; once you have
installed a certificate your systems already trust, drop it.
Why an insecure cloud address is an error, not a warning
If you point the OpenGate integration at a plaintext address, the integration refuses to start. That
is deliberate and it is not adjustable.
What travels over that link is the complete inventory of your network — every asset, every open port,
every vulnerability found — together with the credential that authorises it. Sending that unencrypted is
not a configuration preference with a trade-off. It is a mistake, and the probe treats it as one.
Secrets are never shown back to you
The Configuration view reads and writes the probe’s settings from the browser, and it says plainly
what it does with credentials:
Each stored credential reads as redacted rather than as its value: leave it untouched to keep it, or type
a new value over it to change it. Saving rewrites the file while preserving its comments — and a save
that would quietly turn a protection off is rejected rather than accepted in silence.
Configuration is read at start-up
The banner at the top of that view is worth reading before you save: settings are read when the service
starts, so nothing saved here takes effect until the probe restarts. The console offers to do it for you
where the deployment allows.
Where each kind of data lives
Three stores, each chosen for what is asked of it:
Store
What it holds
The probe’s local state
Everything that must be exactly right and must survive a restart: alarm rules and scripts, device aliases, scan executions, SNMP credential profiles, the host and port inventory, findings, the provenance behind every identity claim, and the alarms currently open
The metrics database
Everything that is a series over time: agent metrics, the audit trail, network traffic, availability, scan metrics and alarm history
The in-memory feed
The most recent events per stream, so the console’s live counters answer instantly. Kept across restarts so a fresh probe comes back warm, and reconciled with the history in the background
The practical consequence for an operator: the console’s Recent tabs read the third one and are
instant; the Range tabs read the second and are as fast as the window you ask for. Neither is more
correct than the other — they are the same events, reached two ways.
What backing up means here
Because the three stores hold different things, a backup that covers only the metrics database keeps your
history and loses your rules, profiles and inventory. Operation and maintenance
covers what to back up and how to restore it.
That closes the tour. From here, Configuration is where you adapt a running probe
to your environment.
Configuration
Configuration
Axiom Border reads a single file, configuration.yaml, from the directory given by the
AXIOM_CONFIG_DIR environment variable (default: config). An example file,
configuration_example.yaml, is supplied alongside it — copy it rather than editing it in place, so you
always keep an untouched reference.
You will rarely edit the file by hand: the console’s Configuration view and the REST API write
this same file — see Changing the configuration below.
No hot reload — restarts are mandatory
Every field in this file requires a service restart to take effect. There are no exceptions. The
file is read once, when the service starts. If you change a value and nothing happens, you have not
restarted the service. Saving from the console on a managed deployment restarts the service for you;
everywhere else the restart is yours to run:
sudo systemctl restart axiom-border
An invalid file stops the service
If configuration.yaml is missing or is not valid YAML, Axiom Border refuses to start rather than
running with defaults. This is intentional — a monitoring probe silently running on the wrong
configuration is worse than one that will not come up. Check the log if the service does not start.
Changing the configuration
Three paths write the same file. The web console is the recommended one: it edits the settings a
running deployment actually tunes, validates them before writing, and on a managed deployment restarts
the service for you. The REST API covers automation and driving a probe without shell access. Editing
the file over a shell always works — it is just the least guarded of the three.
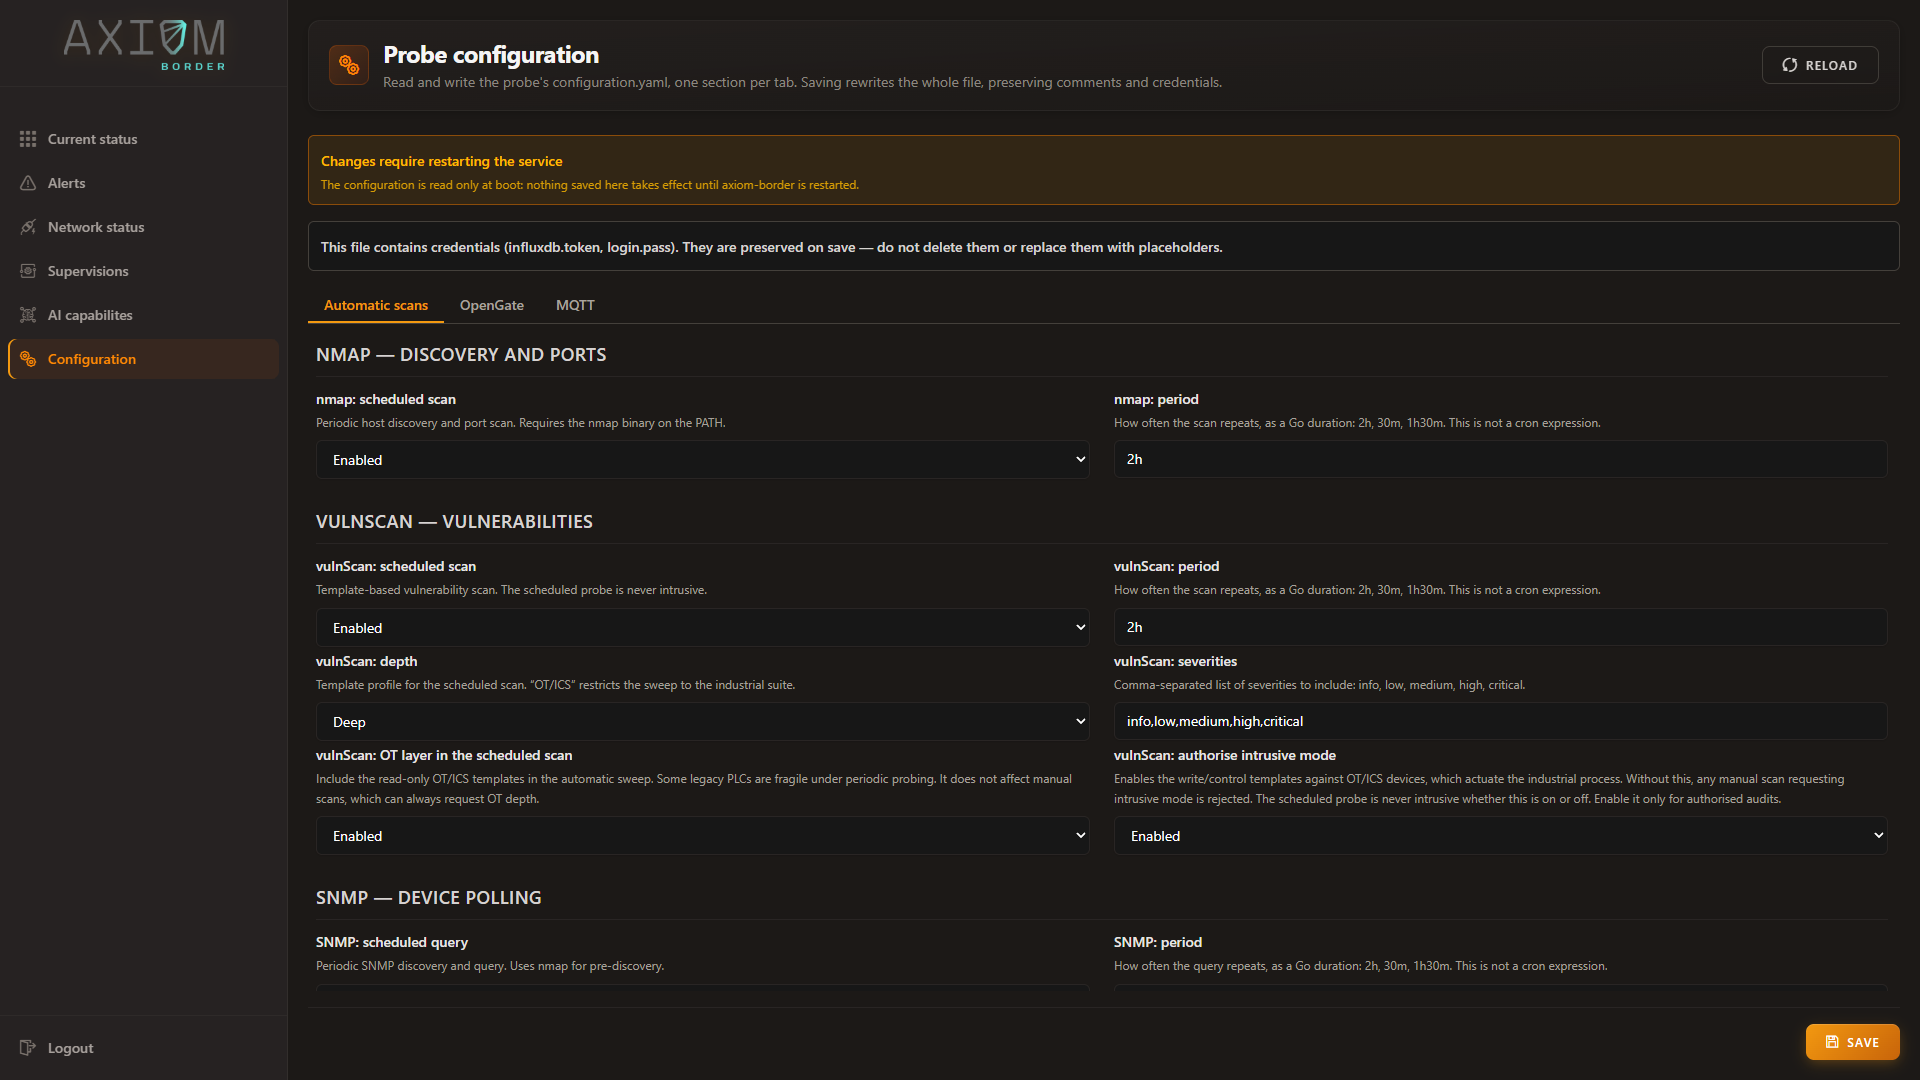
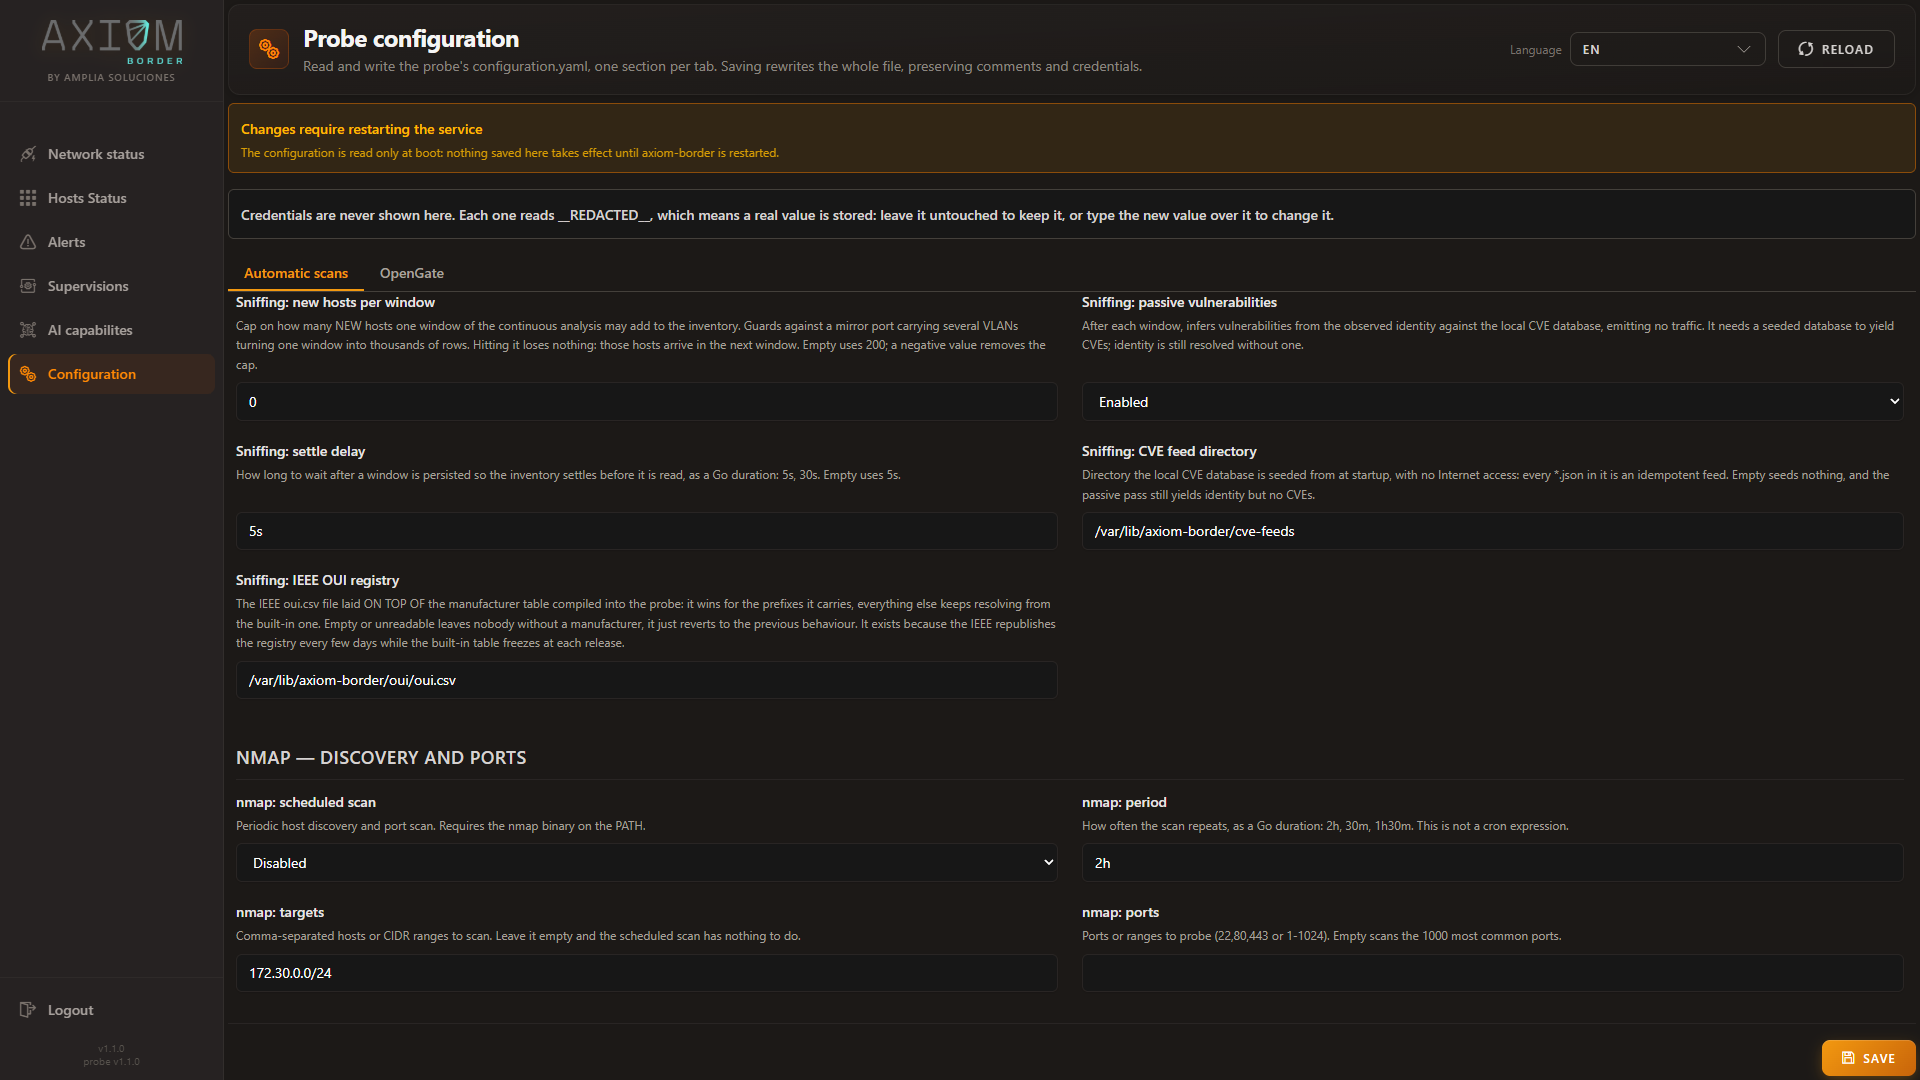
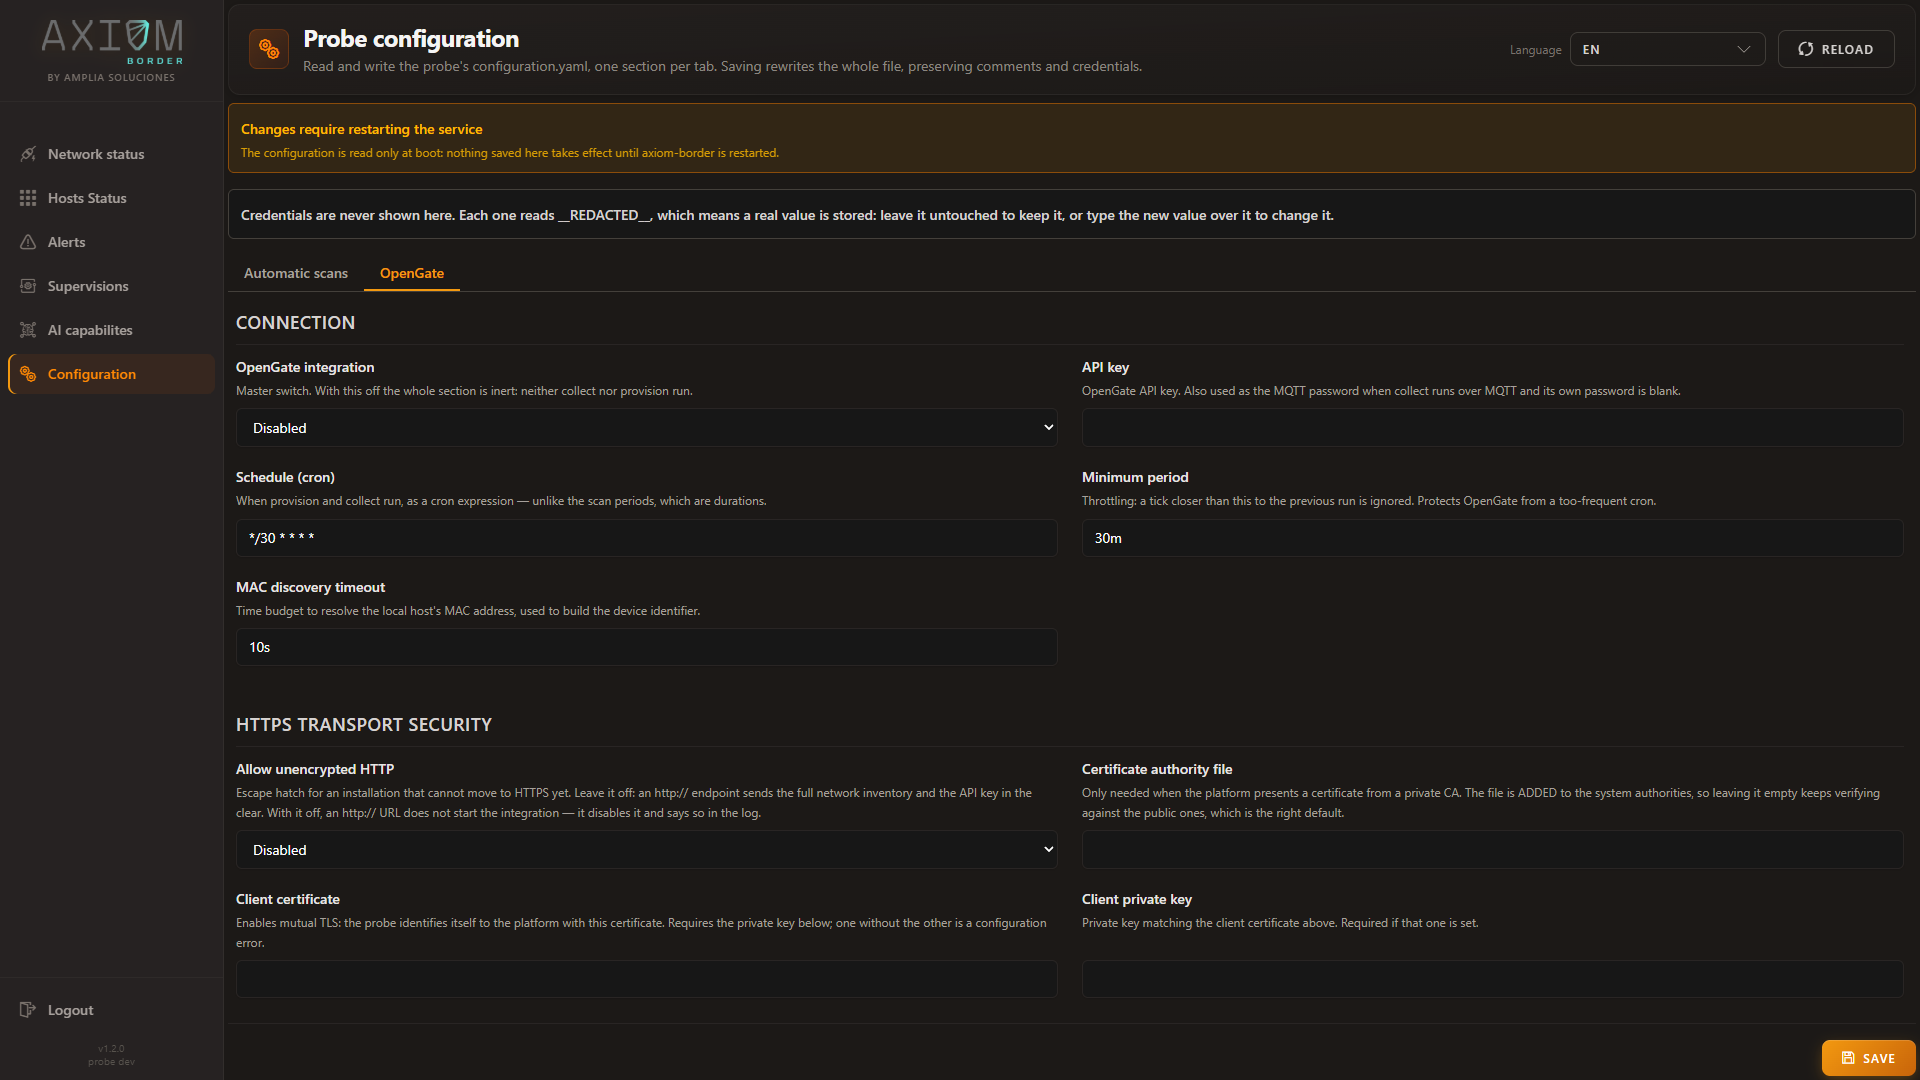
Open Configuration in the side menu. The view edits configuration.yaml itself, one group of
settings per tab:
Each field is labelled in plain language rather than by its YAML key — nmap: period for schedule,
vulnScan: depth for level — and the reference further down this page maps them to the keys they
write. The two notices at the top are permanent, not the result of saving: they are there to tell you
before you edit that nothing applies until the service restarts, and that the file holds credentials
which are preserved for you.
Tab
What it edits
Automatic scans
The securityProbes switches and intervals: enable and schedule for nmap, vulnScan and snmp; the vulnerability scan’s level, severity and OT switches; the sniffing block, including where the probe reads its catalogues from
OpenGate
The whole opengate block — connection, collect and provision
MQTT
The whole mqtt block — the embedded broker with its WebSocket and TLS listeners, the internal publisher and the operations client
Everything else — logger, login, influxdb, apiPort, pagination and the per-probe details not
listed above, scan targets included — is changed through the API or the file.
Network status has a shortcut straight here: its Automatic scans action opens this view on the
first tab, which is where you land when a scheduled scan looks stale or too frequent.
The forms are a window onto the file, not a copy of it. Saving rewrites the whole file but preserves
everything the forms do not manage: comments, credentials, and every key outside the three tabs.
Leaving a field blank removes its key from the file, returning that setting to its unset behaviour.
Durations, ports and cron expressions are checked as you edit, and Save stays disabled while any
field holds an invalid value — an invalid document never reaches the probe.
What happens after Save depends on the deployment:
On a managed deployment, the console asks the deployment manager (Keystone) to restart
the service and waits until it reports healthy again — when the green confirmation appears, the
change is already live. The console is unresponsive for the few seconds the restart takes.
On a plain systemd installation, the file is written and an amber banner stays on screen until
you restart the service yourself: sudo systemctl restart axiom-border.
If the automatic restart fails, the write has still succeeded. Restart by hand —
keystonectl restart axiom-border, or sudo systemctl restart axiom-border — and the saved
configuration applies.
Changing apiPort or the login credential raises an explicit lockout warning: the file is written
anyway, so before restarting make sure you can reach the new port or know the new password.
GET /config returns the current YAML and PUT /config replaces it. This exists so a probe can be
configured for a customer environment without shell access to the host.
# 1. Authenticatecurl -X POST http://localhost:8083/auth/login \
-H "Content-Type: application/json"\
-d '{"username":"<user>","password":"<your-password>"}'# 2. Download the current file as a starting template (authenticated — it contains secrets)curl -H "Authorization: Bearer <jwt-token>"\
http://localhost:8083/config -o configuration.yaml
# 3. Edit it, then upload the COMPLETE filecurl -X PUT http://localhost:8083/config \
-H "Authorization: Bearer <jwt-token>"\
-H "Content-Type: application/x-yaml"\
--data-binary @configuration.yaml
# 4. Applysudo systemctl restart axiom-border
The PUT response reports what happened:
{
  "restartRequired": true,
  "message": "configuration written; restart axiom-border to apply",
  "backup": "/opt/axiom-border/config/configuration.yaml.bak",
  "warnings": ["apiPort changes 8083 -> 9083 (may affect API access after restart)"]
}
Field
Meaning
restartRequired
Always true — configuration only takes effect at startup
message
Confirmation text
backup
Path of the previous file’s backup. Omitted when there was no previous file
warnings
Present only when non-empty. Raised when apiPort or the login credentials change, because either can lock you out
Console and API end in the same validated write, with three guarantees:
Validation before writing. The document is validated exactly as at startup and checked for the
six mandatory fields. Invalid YAML or a missing field returns HTTP 400 and
nothing is written.
Atomic replacement. The file is written to a temporary file in the same directory and renamed.
Backup of the previous file, forced to 0600 because it contains secrets.
The write is a full replacement, and the backup is a single level
PUT /config expects the complete file, not a patch — fetch, edit, send back whole. The console
handles this for you and sends the full document with your edits applied.
The backup is always the same filename, configuration.yaml.bak, and it is overwritten on every
write. There is only one level of history. If you need more, copy it aside yourself before saving.
To recover from a lockout, restore that file and restart.
Where the file lives
Deployment
Path
Installed with install.sh (systemd)
/opt/axiom-border/config/configuration.yaml
Managed deployment
/var/lib/axiom-border/config/configuration.yaml — a stable path outside the per-version working directory
Overriding any field with an environment variable
Every key can be overridden from the environment by upper-casing it and replacing dots with
underscores. A .env file in the working directory is also loaded.
Configuration key
Environment variable
logger.logLevel
LOGGER_LOGLEVEL
influxdb.token
INFLUXDB_TOKEN
login.pass
LOGIN_PASS
This is the recommended way to handle secrets: keep the tokens and passwords out of the YAML file
entirely and inject them through the environment or your secret manager.
Required fields
Only six fields are validated as mandatory. If any is missing, the configuration is rejected:
Everything else is optional and has a documented default.
logger
Backend logging, to console and to size-rotated files.
Field
Type
Default
Description
directory
string
./logs
Destination directory for rotated log files
inFile
bool
true
Write to file
inConsole
bool
true
Echo to stdout
colorInConsole
bool
true
ANSI colour codes on stdout. Disable when piping to a file or to journald
logLevel
string
DEBUG
DEBUG | INFO | WARN | ERROR
processId
string
""
Process label added to every line; empty means no label
fileName
string
egprobe.log
Base log filename; rotation appends suffixes
maxSize
int (MB)
20
File size before rotation
maxBackups
int
20
Number of rotated files kept
compress
bool
true
gzip rotated backups
Tip
DEBUG is the shipped default and it is verbose enough to flood a journal on a busy probe. For
production, INFO is the sane choice.
login
The single credential that protects the whole API except /auth/login.
Field
Type
Required
Description
user
string
Yes
API username
pass
string
Yes
SHA256 hex digest of the password, not the password itself
Generate the digest before writing it:
echo -n "yourPassword" | sha256sum
At login, the probe hashes the submitted password and compares it against this value.
Change the shipped credential
The example file carries a placeholder digest so that a fresh installation can log in. It must be
replaced before the probe is reachable by anything. Treat a deployment still carrying the example
digest as unauthenticated.
influxdb
Connection to the metrics database (InfluxDB 2.x) that stores metrics, audit records, scan results and
alarms.
Field
Type
Default
Required
Description
url
string
http://127.0.0.1:8086
Yes
Metrics database endpoint
org
string
axiom
Yes
Organisation
token
string
—
Yes
Token with read/write permission on the organisation. Prefer injecting via INFLUXDB_TOKEN
buckets
[]string
see below
No
Buckets created at startup if they do not already exist
Default bucket set: network_bucket, ssh_bucket, metrics_bucket, usb_bucket, eg_alarms,
audit_logs, networktraffic, availability, scanmetrics. The four per-channel event buckets are
populated by the oda-lite collector, the rest by the probe itself — see
Metrics ingestion.
The probe starts even when the metrics database is unreachable, and every feature that depends on it
is inoperative until it recovers. This is deliberate for edge deployments where the database may be a
separate node that boots later.
alerts and audit
Block
Field
Type
Default
Description
alerts
offset
duration
10s
Tolerance window applied to the alarm evaluation query range
alerts
bucket
string
eg_alarms
Bucket where alarms are written and read
audit
bucket
string
audit_logs
Bucket for audit events: logins, configuration changes, executions
Top-level keys
Field
Type
Default
Required
Description
apiPort
string
8083
Yes
HTTP service port. Binds on 0.0.0.0
outputParquetPath
string
./
No
Destination directory for on-demand Parquet exports
dbPath
string
""
No
Local state database file. Empty resolves to ./db.dat, relative to the working directory
gojascriptsDir
string
""
No
Directory holding rule scripts. Empty resolves to resources/gojascripts
gojaTimeout
duration
8s
No, but set it
Maximum execution time for a rule script per event
Two settings worth pinning down
Always set dbPath to an absolute path in production (for example
/var/lib/axiom-border/db.dat). Deployments that use per-version working directories will otherwise
create a fresh, empty database on every upgrade and appear to have lost all state.
Always set gojaTimeout explicitly. Without a time limit, rule scripts do not run at all.
pagination
Controls the two read modes over the metrics database. Every field has a default, so the block can be
omitted entirely.
Field
Type
Default
Description
maxRecentEvents
int
1000
Number of most recent events kept per stream, which is also the cap of the /recent/* feed
rangePageSize
int
100
Default page size for range queries
rangeMaxPageSize
int
500
Maximum accepted pageSize
rangeMaterializeMaxRows
int
40000
Row threshold. Below it, the whole range is cached, which allows jumping to any page and reporting an exact total. Above it, results are delivered sequentially, page after page
rangeCacheTTL
duration
60s
Lifetime of a cached range entry
rangeCacheMaxEntries
int
8
Maximum ranges cached at the same time. Beyond it, the least recently used range is discarded
rangeExportMaxRows
int
500000
Row cap for the streaming CSV export. A range exceeding it returns HTTP 400 asking you to narrow the window
trainerDetails
HTTP client settings for the AI container. Only relevant on Linux with a container engine available —
see AI capabilities.
Field
Type
Default
Description
serviceTlsCert
string
""
Client TLS certificate towards the AI container
serviceTlsKey
string
""
Matching private key
trainerContainerName
string
trainer
Base container name. The effective name is <trainerContainerName>-<agent>
Three sub-blocks — metrics, healthCheck and predict — share the same four fields. The {port}
literal in each URL is substituted at runtime with the port of the corresponding AI agent.
Sub-block
url
timeout
retries
timeBetweenRetries
Purpose
metrics
https://127.0.0.1:{port}/api/metrics
2s
1
2s
Collect metrics from the AI container
healthCheck
https://127.0.0.1:{port}/health
2s
20
5s
Wait for container startup — 20 attempts at 5 s gives roughly 100 s of margin
predict
https://127.0.0.1:{port}/api/predict
10s
1
2s
Inference, invoked from rule scripts
Note
Use whole seconds for timeBetweenRetries; fractions of a second are not honoured.
securityProbes
Security probes run two ways: automatically on an interval (schedule), and manually from the API or
UI. Results are stored in local state and in the metrics database — scanmetrics for aggregates,
availability for up/down.
Probes ship disabled, and the first scan runs at startup
nmap, vulnScan and snmp all default to enabled: false. Enable them only after confirming their
dependencies are present on the target host, because the first scan of an enabled probe runs as soon
as the service starts, not after the schedule interval has elapsed. A probe enabled without its
dependencies — the nmap binary on PATH, a readable templates directory, a valid capture interface —
will log errors on every boot.
securityProbes.nmap
Host discovery, port scanning and optional fingerprinting. Requires the nmap binary on PATH.
Field
Type
Default
Description
enabled
bool
false
Enable the scheduled probe
schedule
duration
2h
Interval between sweeps. Zero or negative falls back to 2h
targets
[]string
["192.168.1.0/24"]
Hosts and CIDR ranges to scan
portFilter
string
""
Port list such as "22,80,443". Empty means nmap’s top 1000
udp
bool
false
Add a UDP scan. Slow
udpPorts
string
common UDP ports
UDP ports probed when udp: true
timing
string
""
T1–T5. T2 is cautious, T4 is reasonable on healthy networks
scanPorts
bool
true
When false, ping scan only (-sn)
service
bool
false
Service and version detection (-sV)
os
bool
false
OS fingerprinting (-O). Implies a SYN scan, which needs raw sockets and therefore root
timeout
duration
5m
Abort if nmap does not finish
securityProbes.vulnScan
Template-based vulnerability scanning, including the embedded OT/ICS suite. The scan engine ships
inside the product — there is no scanner binary to install.
Field
Type
Default
Description
enabled
bool
false
Enable the scheduled probe
schedule
duration
2h
Sweep interval. Also re-triggered by event, with debounce, when new hosts are recorded
severity
string (CSV)
info,low,medium,high,critical
Severity filter, given as one comma-separated string
level
string
profundo
Depth, translated to template tags — see below
templatesDir
string
""
Templates directory override for the scheduled probe
defaultTemplatesDir
string
./vulnscan-templates
Deployment-wide fallback
timeout
duration
5m
Scan cut-off. A request may override it
allowTemplateUpdates
bool
true
Whether the probe may refresh templates from the network
allowTemplateBundleUpload
bool
true
Whether an authenticated operator may upload a template set. Separate key on purpose — see below
allowIntrusive
bool
false
Master lock for OT/ICS intrusive mode
enableOT
bool
false
Add read-only OT templates to the scheduled sweep
userAgent
string
""
HTTP User-Agent for the web checks. Empty keeps a neutral, randomised browser value per request; set it only when a deployment needs a deterministic one
A level value not in the table above applies no tag filter at all, so the scan walks the entire
template tree with only the severity filter. This is rarely what anyone intends and is dramatically
slower. Check for typos.
Templates directory resolution order: the templatesDir field of the scan request, then
securityProbes.vulnScan.templatesDir, then defaultTemplatesDir, then a vulnscan-templates
directory next to the product binary. Relative paths resolve against the working directory.
allowTemplateUpdates behaviour:
true (default, including when the key is absent): best-effort refresh to the latest template
release. Being offline or having GitHub blocked does not abort the scan — local templates are
kept. An empty directory triggers a full download.
false: strict offline kill-switch. The network is never touched, even when the directory is empty.
If nothing is on disk the scan fails with a clear error.
allowTemplateBundleUpload is a different question, which is why it is a different key.allowTemplateUpdates asks may this process reach the network; this one asks may an authenticated
operator replace the template set. The deployed recipe sets the first to false — correctly, an OT
segment has no route out — so reusing it for uploads would have left the offline update path disabled
on every real deployment, which is the one scenario the product exists for. Set this to false to
freeze the templates at whatever the deployment installed; that is a posture, not the same decision as
closing egress. See Offline maintenance.
The OT suite never depends on this
The OT/ICS templates ship inside the product and the bundled set is restored after every template
update, so they survive a wipe-and-replace by the template manager and work with
allowTemplateUpdates: false on an air-gapped network. See
OT/ICS vulnerability scanning.
allowIntrusive governs the write/control layer of the OT suite over both REST and MQTT. A
request asking for intrusive mode while this is false is rejected, and the execution ends as
failed with an explicit message. The scheduled probe is never intrusive regardless of this flag.
enableOT adds the read-only ot tag to the scheduled sweep even when level would not include
it. It never enables the intrusive layer. Some older PLCs are fragile in the face of unexpected
connections; enable it only if the OT network tolerates periodic probing.
Recommended steady state for a probe on an industrial segment:
securityProbes:
vulnScan:
enabled: truelevel: "medio"enableOT: true# continuous read-only OT visibilityallowIntrusive: false# write layer bolted shutallowTemplateUpdates: false# air-gapped: never reach for the networkdefaultTemplatesDir: "/opt/axiom-border/vulnscan-templates"
securityProbes.snmp
Field
Type
Default
Description
enabled
bool
false
Enable the scheduled probe
schedule
duration
2h
Interval. Zero or negative falls back to 2h
targets
[]string
["192.168.1.0/24"]
Hosts and CIDR ranges to interrogate
mibDir
string
MIBS/JSON-FORMAT
MIB catalogue in JSON format
mib
string
synology
Default MIB when no device match is found
port
int
161
SNMP destination port
timeout
duration
2m
SNMP operation cut-off
oids
[]string
sysDescr, sysName, sysObjectID
OIDs fetched by GET
walkRoot
string
""
Root OID for the walk. Empty means sysDescr
workers
int
32
Walk parallelism. Zero or negative becomes 1
Host pre-discovery has a fixed 30 s limit
This probe uses nmap for host pre-discovery, with a fixed 30 second limit. A /24 range at T2 timing
will exhaust it. Narrow the range or raise the main nmap timing value.
With neither oids nor walkRoot set there is nothing for the probe to do.
securityProbes.sniffing
Continuous traffic capture with periodic persistence to the networktraffic bucket.
Field
Type
Default
Description
interfaces
[]string
[]
Interfaces to capture. An empty list disables sniffing — there is no separate enabled switch for this block
bpf
string
""
BPF filter. Empty captures all IPv4
promiscuous
bool
true
Put the NIC in promiscuous mode
backend
string
pcap
Capture mode. pcap is the supported value
duration
duration
10m
Default window for a manual capture
flushInterval
duration
5m
Persistence interval for continuous capture. Zero or negative becomes 1 minute
passiveVuln
bool
true in the deployed recipe
Infer vulnerabilities from the passive identity (CPE→CVE) after each window, emitting no traffic
passiveVulnDelay
duration
5s
Grace period after a flush, so the inventory settles before the inference reads it
passiveVulnRowLimit
int
30
How many CVEs a device whose product is known but version is not may list one by one. Above the cap that device shows a summary with the count and severity breakdown instead. Version-confirmed findings are never summarised. A negative value removes the cap
cveFeedDir
string
""
Directory the local CVE database is seeded from at startup, offline. Empty disables seeding
ouiFile
string
""
IEEE OUI registry (oui.csv, verbatim) laid on top of the manufacturer table compiled into the binary. Its assignments win for the prefixes it carries; everything else keeps resolving from the built-in table, so empty, absent or unreadable is the pre-existing behaviour and cannot degrade anything. Refreshed in place with POST /security/oui-overlay
This table is not exhaustive
The sniffing block has grown several fields that are not listed here yet (enabled, filterTargets,
interestNetworks, maxHostsPerFlush, snaplen). config/configuration_example.yaml is complete and
is the reference until this page catches up.
Interface naming is platform-specific and is the most common source of a probe that captures nothing:
Platform
Format
Example
Linux
Simple name
eth0, enp3s0, wlan0
macOS
BSD name
en0
Windows
Npcap NPF device path
\\Device\\NPF_{GUID}
On Windows, the friendly name (Ethernet, Wi-Fi) does not work. Discover the NPF path with
nmap --iflist and read the WINDEVICE column.
opengate
Optional cloud integration: inventory reporting (collect) and provisioning (provision). The whole
section is inert when enabled: false.
Field
Type
Default
Description
enabled
bool
false
Master switch
apiKey
string
""
Secret. Sent as the X-ApiKey header over HTTP, and used as the default MQTT password when collect.mqtt.password is empty
cron
string
*/30 * * * *
Five-field cron expression for provision and collect. Descriptors such as @hourly are accepted. Empty or invalid means the integration does not run
minPeriod
duration
30m
Throttle. If the cron interval is shorter than this, the cron is ignored and a plain ticker at minPeriod is used instead
macDiscoveryTimeout
duration
10s
Limit for resolving the local host MAC
opengate.collect
Field
Type
Default
Description
enabled
bool
false
Enable collected-data reporting
mode
string
mqtt
http or mqtt
urlTemplate
string
OpenGate south collect endpoint
URL template; {{deviceID}} is substituted
deviceId
string
""
Force a fixed device ID. Empty derives one per host from IP and MAC
sendByParts
bool
false
Split the payload into components: ports, SNMP, vulnerabilities
partSize.ports
int
100
Port rows per chunk
partSize.snmp
int
100
SNMP entries per chunk
partSize.vulnerabilities
int
100
Vulnerabilities per chunk
retryCount
int
3
Retries for the collect publish or POST
retrySleep
duration
5s
Wait between retries
mqtt.broker
string
""
OpenGate broker URL. Required for mode: mqtt; empty skips sending
mqtt.username
string
""
MQTT username
mqtt.password
string
""
Secret. Empty falls back to opengate.apiKey
mqtt.topic
string
""
Publish topic, accepts {{deviceID}}. Required for mode: mqtt
Template with {organizationName} and {provisionProcessorId} placeholders
searchUrl
string
OpenGate north bulk search endpoint
Endpoint for querying bulk status
organizationName
string
""
Target OpenGate organisation. Needed when enabled
provisionProcessorId
string
""
Provision processor ID. Needed when enabled
retryCount
int
3
Retries for the bulk file upload
retrySleep
duration
5s
Wait between retries
pollMaxAttempts
int
10
Maximum bulk result polls
pollSleep
duration
5s
Wait between polls
mqtt
Three independent blocks: broker is the MQTT broker embedded in the product, client is the internal
publisher of executions and alarms, and ops is the client that listens for OpenGate operations and
answers them.
mqtt.broker
Field
Type
Default
Description
enabled
bool
true
Start the embedded broker
host
string
0.0.0.0
TCP listener interface
port
int
1883
MQTT TCP port
username
string
""
Broker authentication. Empty username and password together allow anonymous access
password
string
""
Secret
ws.enabled
bool
true
Secondary WebSocket listener, used by the web UI
ws.host
string
0.0.0.0
Not configurable — the WebSocket listener always binds on all interfaces
ws.port
int
1888
WebSocket port
ws.path
string
/ws
WebSocket endpoint path. A leading slash is added if missing
CA used to validate clients. Needed when verify is on
tls.certFile
string
""
Server certificate. Needed when TLS is enabled
tls.keyFile
string
""
Server private key. Needed when TLS is enabled
Anonymous by default
With username and password both empty the embedded broker accepts anonymous connections. On any
network you do not fully control, set credentials and enable TLS. If you do enable TLS, supply a
complete and valid certificate set: an incomplete TLS block prevents the broker from starting at all.
mqtt.client
Field
Type
Default
Description
enabled
bool
true
Start the internal publisher
broker
string
tcp://127.0.0.1:1883
Broker URL, by default the embedded one. Empty disables the client with a warning
Auto-reconnect is always on, retrying every 5 seconds, with a 10 second initial connection timeout.
Neither is configurable.
mqtt.ops
Field
Type
Default
Description
enabled
bool
true
Start the operations listener
broker
string
tcp://127.0.0.1:1883
Broker to subscribe against
username
string
""
MQTT username
password
string
""
Secret
topicSubscribe
string
odm/operation
Incoming OpenGate operations topic
topicPublish
string
odm/response/{device-id}
Response topic; {device-id} is substituted at runtime
qos
int
1
QoS for both subscribe and publish
retain
bool
false
Retain flag on responses
If broker, topicSubscribe or topicPublish is empty, the operations module does not start.
Metrics Ingestion and Audit
Metrics ingestion and audit
Axiom Border’s data comes from two origins. The first one the probe captures by itself: the
traffic it sniffs and the scheduled scans it runs against the network around it, with no cooperation
from the equipment it watches. The second one is reported to it: every monitored machine runs an
oda-lite agent that watches the machine from the inside and sends what it sees.
flowchart TB
    NET["The network around<br>the probe"]:::ext
    MACH["The monitored machines<br><i>an oda-lite agent on each</i>"]:::ext
    NET -->|"sniffing and<br>scheduled scans"| P["<b>Axiom Border</b>"]
    MACH -->|"SSH · USB · interface<br>· health events"| P
    P --> ST[("Metrics store<br><i>history and exports</i>")]
    P --> LP["Live pipeline<br><i>rules · alarms · audit</i>"]
    classDef ext fill:#e9edfa,stroke:#486ac9,color:#101010
Whatever the origin, the data ends in the same two places: the metrics store, which keeps the
history behind queries and exports, and the live pipeline, where rules are evaluated, alarms are
raised and the audit trail is written. This page follows that flow — the two origins first, then the
pipeline, then how to read everything back.
What the probe captures by itself
The network-facing half needs nothing installed on the monitored equipment:
Traffic capture — continuous sniffing of the configured interfaces, persisted periodically to
the networktraffic bucket. Configured under
securityProbes.sniffing.
Scheduled assessments — the discovery, vulnerability and SNMP probes run on their configured
intervals, keep the asset inventory current, and record per-scan aggregates (scanmetrics) and host
up/down state (availability).
Both are documented in Security assessment. What matters on this page is that
their results are data like any other: they land in the store, their executions are audited, and the
audit log’s agent filter accepts the probe names (network, vulns, snmp, sniff) alongside the
agent channels.
What the agents report
The host-facing half is delivered by oda-lite, a lightweight monitoring agent that ships alongside
Axiom Border as a separate component with its own release cycle — the version you have is the one your
package includes. It is the whole of the monitoring deployment role: a machine with that role runs
only the agent, reporting to a central probe. The probe’s own machine runs one too, so the central host
is watched exactly like every other node.
An agent watches four things, and each maps to a channel — the “Guards” of the console views:
Channel
In the console
What arrives
ssh
SSH-Guard
SSH activity: connections, successful and failed logins, logouts, per-session byte counters — tagged with user, ip and port
iface
IFACE-Guard
Network interfaces appearing, disappearing or changing state, with the interface name, type and MAC address
usb
USB-Guard
USB devices connected and disconnected, with device names, ID and manufacturer
metrics
METRIC-Guard
The node’s reporting-health heartbeat: ram_usage, prepared_vars and sent_vars. Its silence is what a node stopped reporting alarm keys on
Those four names are what the API calls {agentType}: they appear in the read paths
(/recent/{agentType}), in the audit log’s agent filter, and as the group routing tag on every
event.
flowchart TB
    AG["oda-lite agents<br>on each machine"]:::ext
    OTH["Other reporters<br><i>optional</i>"]:::ext
    AG -->|":9090/agents<br>line protocol"| COL["oda-lite on the probe host<br><i>central profile</i>"]
    OTH -->|":9091/metrics<br>JSON"| COL
    COL -->|"one bucket<br>per channel"| ST[("Metrics store")]
    COL -->|"POST /telegraf"| LP["Live pipeline<br>rules · alarms · audit"]
    classDef ext fill:#e9edfa,stroke:#486ac9,color:#101010
On the probe host, oda-lite runs in its central profile: besides watching its own host, it listens
for everyone else on two ports —
Listener
Format
Who posts there
:9090/agents
InfluxDB line protocol
The oda-lite agents on the monitored machines
:9091/metrics
JSON
Other reporting processes. A metric arriving without a channel tag that carries the reporting-health fields is routed to the metrics channel automatically
Everything it receives — its own guards’ events included — goes two ways at once: each channel is
written to its bucket in the metrics store, and every event is forwarded to the probe’s live
pipeline, so rules, alarms, audit and the recent feeds see it immediately.
Two operational handles worth knowing:
The agent is a systemd service on every node: systemctl status oda-lite. Its configuration is
generated by the installer at /etc/oda-lite/oda-lite.conf — this is also where the listener ports
move if 9090 or 9091 collide with something else.
Agents buffer briefly and flush every few seconds, so an event appears in the console with at most a
few seconds of delay — instantly is the wrong expectation, but a minute is a problem.
SSH events need verbose sshd logging
The SSH monitor reads authentication logs, which means sshd must log at LogLevel VERBOSE and
rsyslog must be populating /var/log/auth.log. The installer configures both for the roles that need
them. On a host where SSH events never appear, check those two things first.
Seeing what is reporting in
Supervisions in the console lists the channels the probe is receiving data from. Each card is one
channel, with a status dot, the last event it delivered, and the nodes it is monitoring.
This is the first place to look when data is not arriving: a channel with no recent event means the
agent has either stopped, or never reached the probe. In the capture above METRIC-Guard is in
exactly that state — there is no data to display. All events opens the full history for that
channel.
The same data, turned around — Hosts Status
Supervisions answers which channels are reporting. Hosts Status answers how is each machine
doing, which is the same data indexed the other way: one block per node, a status dot per monitor, the
last event each one delivered, and the alarms currently open against that node.
The value of this view is that a problem is visible two ways at once. In the capture above the
METRIC-Guard dot is red on all three nodes, and the alarm table beside it reads Node stopped
reporting — the missing telemetry and the alarm it raised, side by side. That is the same silence the
Supervisions view shows as an empty channel, seen from the node’s point of view instead of the
channel’s.
Use Supervisions when you are asking whether a monitor is working, and Hosts Status when you
are asking whether a machine is healthy.
The live pipeline: rules, alarms and audit
Events reach the probe itself through a single door, POST /telegraf — the same endpoint the collector
forwards into.
The ingestion door is not open to the network
Reporting processes are unattended, so they cannot carry a session the way an operator does. Rather than
leaving the endpoint public, the probe waives the token only for callers inside a configured range,
which defaults to loopback. Everything else must authenticate like any other request.
Widen that range only as far as the machines that genuinely report in. Anyone who can post here can
inject measurements — and therefore trigger rules and raise alarms.
Payload format
The body is {"metrics": [...]} and every metric requires all four fields:
Field
Type
Meaning
name
string
Becomes the measurement in the store. In practice the machine ID of the reporting node
timestamp
int64
Epoch in seconds, not milliseconds
tags
map of string
Must include group, which routes the metric to a channel
fields
map
The event’s values, numeric or string
The group tag is the routing key:
group value
Channel
History bucket
SSH
ssh
ssh_bucket
USBS
usb
usb_bucket
IFACES
iface
network_bucket
METRICS
metrics
metrics_bucket
SECSCAN
Routed by the additional probe tag
scanmetrics
Beyond group, the conventional tags are eventType, ip, port and user — these are what rules
and queries filter on.
The response is 200 with an empty body, or 400 if the JSON does not parse.
A 200 does not mean the rules ran
The recent feeds are updated immediately, so a /recent/* query straight after ingestion will show the
event. Rule evaluation, auditing and alarm generation are asynchronous, so the 200 confirms acceptance,
not evaluation. If you are testing a rule, allow a moment and check the alarms feed rather than inferring
from the ingestion response.
This endpoint feeds the pipeline, not the history
POST /telegraf drives the recent feeds, the rules engine and the audit trail — it does not write
the event itself to the metrics store. History is written by the collector. An event posted directly
here can raise alarms and will show in the recent feeds, but it leaves no history and will not appear
in range queries or exports. To feed your own data in fully, post to the collector’s listeners —
:9090/agents in line protocol or :9091/metrics in JSON — and let it fan out to both places.
Reading data back
Everything up to here is visible in the console. What follows is not: pushing data in and pulling data
out are the two jobs the console does not cover, because they exist to feed something else — a
dashboard, an export, an integration. This is the part of the product where the API is the right tool
rather than a shortcut.
There are three ways to read, and choosing the right one is the difference between a responsive UI and a
slow one.
Recent feeds — for live views
These answer in microseconds, serving the most recent events the probe already holds without running a
historical query. Feed depth is capped by pagination.maxRecentEvents, default 1000.
Optional request fields: limit, uuids to filter by node, and orderBy for presentation order. Note
that orderBy only affects how the returned page is sorted — the feed always yields the most recent
events, so asc does not page backwards through history.
The warming flag is true while the feed is still being seeded after a restart. Surface it in a UI as a
loading state rather than presenting a partial feed as complete.
Three feeds exist: /recent/{agentType} for events, /recent/alarms for alarms, and /recent/auditlog
for audit entries. The audit variant takes timeOrder instead of orderBy and adds eventsId and
agent filters — the latter also accepting the probe names network, vulns, snmp and sniff.
There is no total or pages in the response. The client paginates locally over what it received.
To continue a sequential read, send only the cursor field — no from, no to, no page.
Read randomAccess before drawing a pager
When randomAccess is false, page numbers are meaningless and total is an upper bound, not a count.
A UI that renders “page 12 of 340” from that metadata will be wrong. Read meta.randomAccess on every
response and switch between a numbered pager and a “load more” control accordingly.
Pagination limits are configurable — see Configuration.
The range is mandatory here, and a range exceeding pagination.rangeExportMaxRows (default
500 000) is rejected with 400 asking you to narrow it. That guard is deliberate.
This endpoint returns 200 with an empty body — it does not return the file. It writes to a fixed
path, <outputParquetPath>/influxquery.parquet, so every call overwrites the previous one. Unlike
the CSV export, the range is optional and no row-count limit applies, so a broad query can produce a very
large export. Always pass a range on a populated bucket, and collect the file from the server before the
next call.
Other read helpers
Endpoint
Purpose
GET /lastevent/{agentType}
Latest event per device as semicolon-separated CSV. Sets X-Recent-Warming: true while the feed is still seeding
GET /uuids/{agentType}
Node UUIDs present in one channel’s bucket
GET /uuids
Map of UUID to the channels it appears in
Aliases — making UUIDs readable
Nodes are identified by machine ID, which is unreadable. An alias maps one to a name, and every read
endpoint accepts ?alias=true to perform the translation. The console displays aliases wherever it
lists nodes, but creating them is an API operation:
With ?alias=true, the uuids filter in a request body also accepts alias names, so a client can work
entirely in readable names. Note that DELETE /alias takes the alias name, as {"name": "..."}, not
the UUID.
Audit
Every significant action is audited to the audit_logs bucket. Two ways to read it:
The agent filter accepts the four channel names and the four probe names. Filtering by vulns is how you
answer “what was scanned, when, and by whom” — including the warning entry that every intrusive OT scan
generates.
Auditing follows the rule script
An agent’s or probe’s activity is audited when its rule script is enabled. Disabling a script therefore
costs you the audit records for that agent or probe as well as its rules — the events are still ingested
and stored, but they leave no audit trail.
If you need an audit trail for a particular agent, check the enabled state with GET /scripts and make
sure its script exists and is enabled, even if the script itself does nothing. See
Alarms and the rules engine.
Storage layout
Where each kind of data ends up. The four channel buckets are written by the collector; everything
else is written by the probe itself:
Buckets are created on first start if absent. Note that no retention policy is applied by default —
configure retention in InfluxDB according to your disk budget, or the metrics buckets will grow without
bound. An Influx bucket with no retention is a common cause of a probe slowly filling its disk.
Alarms and the Rules Engine
Alarms and the rules engine
Axiom Border decides locally. A probe that only forwards data is useless the moment the uplink drops,
so alarm evaluation runs on the device, against data it already holds, with no dependency on the
platform.
There are two ways to express what should raise an alarm:
Mechanism
Use it for
Defined via
Checks — declarative rules
Thresholds, event matches, dead-machine detection
/checks API
Scripts — rules written in JavaScript
Anything with logic: correlation, state, arithmetic, calls to the AI model
/scripts API
Checks cover most of what monitoring needs and need no code. Scripts exist for the cases checks cannot
express.
Where you work with alarms
Alerts in the console is the operator’s view: the alarms currently raised, the history of what has
been logged, and the Rules configuration button that opens the editor for the rules described below.
An autoreload toggle keeps the list current while you watch an incident develop.
Each row names the alarm, the check type behind it, the node it came from, the agent, the severity and a
description that includes when the condition was first seen. ACK acknowledges the selected alarm.
Two tabs sit above the table. Recent reads the live feed — the most recent alarms the probe already
holds, answered immediately. Range queries a time window from history instead, which is what you want
when reconstructing an incident after the fact:
Rules configuration opens the Alarm config screen, which is where both kinds of rule live — the
declarative alarm rules in the upper table, and the JavaScript Expert System at the bottom with its
own enable switch:
Everything on this page can be done from that screen or from the API, and both paths are shown together
wherever they differ.
Checks — declarative rules
A check watches one event type from one agent over a time window, and raises an alarm when its condition
holds.
flowchart TB
    EV["Event arrives"] --> MATCH{"Matches<br>a check?"}
    MATCH -->|no| DROP["Stored only"]
    MATCH -->|yes| TYPE{"Check type"}
    TYPE -->|count| CNT{"Count over<br>threshold?"}
    TYPE -->|deadmachine| SILENT{"Silent for<br>the window?"}
    CNT -->|no| WAIT["Keep counting"]
    CNT -->|yes| FIRE["Raise alarm"]
    SILENT -->|yes| FIRE
    FIRE --> COAL{"Alarm<br>already open?"}
    COAL -->|yes| INC["Increment count"]
    COAL -->|no| NEW["New alarm"]
The two check types
ctype
Fires when
threshold
count
The event occurs at least threshold times within freqs
Required
deadmachine
No events arrive from the node within freqs
Not used, send 0
deadmachine is the one worth calling out: it alarms on absence, which is how you detect a node that
stopped reporting rather than a node reporting something bad.
Alarming on every occurrence
To raise an alarm whenever an event happens at all, use a count check with "threshold": 1 and a short
freqs. The first matching event trips the condition immediately.
Creating a check
From Alerts → Rules configuration, use New alarm rule. The wizard walks three steps — Rule
config, Alarm config and Summary — and collects exactly the fields described above:
Rule type is the check type, Agent and event choose what to watch, Trigger sets the window and the
count, and UUIDs selects the nodes. Only agents actually reporting in are offered, which is why a rule
cannot be created before its agent has sent data.
Every field is required on create. freqs is a duration string — 30s, 5m, 1h. level is info,
low, medium, high or critical. uuids lists the nodes the check applies to, and accepts alias names when
the request carries ?alias=true.
A worked example: catching a node that went quiet
The most valuable check is usually the one that alarms on silence. In the wizard, choose dead
machine as the rule type, pick the agent that reports the node’s health, set the window to something
comfortably longer than its reporting interval — ten minutes against a one-minute heartbeat — and select
the nodes it applies to.
There is no threshold to set: the condition is that nothing arrived. Give the alarm a name an operator
will understand at three in the morning, such as Node stopped reporting.
Managing checks
The rules table on Alerts → Rules configuration lists every check, and each row carries its own edit
and delete actions. Editing reopens the same wizard.
Three things cannot be changed after creation
Editing a check keeps its rule type, its agent and its event. To change what a check watches,
or how it evaluates, delete it and create it again. Everything else — threshold, window, severity, alarm
text, nodes, whether it is enabled — edits normally.
To pause a check without losing its definition, switch it off rather than deleting it.
Alarm coalescing
A brute-force attempt that trips a threshold every five minutes for an hour should be one alarm with
a count, not twelve identical alarms. Axiom Border coalesces repeated firings of the same rule against
the same node into a single open alarm:
Field
Meaning
firstSeen
When the condition first held
lastSeen
The most recent firing
count
How many times it has fired
The alarm stays open and accumulating until someone acknowledges it. Acknowledgement is what closes
the coalescing window — the next occurrence after an acknowledgement opens a fresh alarm, so the
operator gets a new signal rather than a silent increment on something they already dealt with.
Acknowledging
Select the alarm on the Alerts view and use ACK. It is marked as seen, with who acknowledged it
and when.
If someone else got there first, the action is refused rather than applied twice — worth knowing when
two operators are working the same incident.
Reading alarms
The two tabs above the table reach the same events by different routes:
Tab
Reads
Use it for
Recent
The probe’s live in-memory feed
Watching an incident unfold. Answers instantly, however much history the probe holds
Range
The stored history over a time window
Reconstructing what happened after the fact
Columns filter individually, and the autoreload control keeps the list current while you watch.
Each alarm carries its name and description, the check type behind it, the node and agent it came from,
its severity, when it was raised, whether it has been acknowledged, and the coalescing trio of first
seen, last seen and count.
A small tolerance window absorbs clock skew
Evaluation applies a short grace period — ten seconds by default — around each window boundary, so an
event landing milliseconds outside one is still counted. Without it, a node whose clock drifts slightly
would silently miss conditions it genuinely met.
Rule scripts
For logic that a declarative check cannot express, Axiom Border runs rule scripts written in JavaScript.
They are evaluated on the device, server-side, on events you did not trigger.
In the console these are the Expert System, edited from Alerts → Rules configuration → Edit script.
The editor opens on a working skeleton, so you can see the shape a script must have before writing one:
Note the Enable switch beside the editor on the Alarm config screen: a saved script does nothing until
it is turned on.
How scripts are organised
A script is identified by name, and the name determines when it runs. Scripts named after an agent —
ssh, iface, usb, metrics — run on events for that agent. Scripts named after a probe — network,
vulns, snmp, sniff — run on that probe’s findings. A general-purpose rulesengine script runs over
every ingested batch.
Every script has an enabled state, set with the ?enabled= query parameter when you upload it and
reported by GET /scripts. A disabled script is stored but never invoked.
The script contract
A script must define a function called process, which receives the batch of metrics:
functionprocess(metrics) {
for (vari=0; i<metrics.length; i++) {
varmetric=metrics[i];
metric.SetT0();
// your logic here
metric.SetT1();
}
}
metrics is not a real JavaScript array
Iterate it by index with .length, as above. .filter(), .map() and .forEach() are not available
and will throw. This is the single most common mistake when writing a first rule.
SetT0() and SetT1() bracket your processing and are what populate the timing fields in the audit
record. They are not required for the rule to work, but including them is the convention and it makes
slow rules visible.
Each metric exposes: GetTagByName(key), GetFieldByName(key), ExistsField(key), GetMetricName(),
GetAliasName(), GetAgentType(), GetMonitoredEvents(), GetEventValues(), GetTime(), SetT0(),
SetT1() and String().
A worked example, raising an alarm when a scan finds a risky port open:
varRISKY_PORTS= { 23:"telnet", 21:"ftp", 3389:"rdp", 445:"smb", 5900:"vnc" };
functionprocess(metrics) {
for (vari=0; i<metrics.length; i++) {
varm=metrics[i];
m.SetT0();
if (m.GetTagByName("kind") ==="port"&&m.GetFieldByName("portStatus") ==="open") {
varport=m.GetFieldByName("portNumber");
if (RISKY_PORTS[port]) {
newAlarm(m, "critical",
"Risky service "+RISKY_PORTS[port] +" exposed on port "+port,
"Risky port open", "port_discovery");
}
}
m.SetT1();
}
}
The tags and fields available per probe are documented in the header comment of each deployed script, so
read the script with GET /scripts/{scriptname} before writing rules against it.
What probe rules can react to
Probe rules react to appearances and changes: a new host, a new open port, a changed SNMP value. To
alarm on a node that stops responding, use a deadmachine check against that node’s agent data instead —
that is exactly what checks on absence are for.
Saving and enabling a script
Everything happens in the Expert System editor on the Alarm config screen: write or paste the script,
save it, and use the Enable switch beside it.
A saved script does nothing until it is enabled
Saving and enabling are two separate actions, and the most common report of “my rule never fires” is a
saved script with the switch still off. The editor shows the switch right next to it for exactly this
reason.
Scripts can also be managed through the API — /scripts lists them with their enabled state, and each
one can be read, replaced or deleted by name. That is what an automated deployment would use; from a
browser the editor is the shorter path.
Always set a script timeout
Each script invocation is bounded by gojaTimeout. Define it explicitly: without a value the limit is
zero and no script runs at all, which shows up as missing alarms rather than as an error. The shipped
value is 8s.
gojaTimeout: "8s"
Scripts can call the AI model
A script can invoke inference against a deployed AI capability, using the predict endpoint configured
under trainerDetails.predict. This is what connects anomaly detection to alarm generation: the model
scores an event, and the script decides whether that score warrants an alarm.
Timeouts and retries for that call come from trainerDetails.predict — default 10 s, one retry. Note
that the call is bounded by gojaTimeout as well, so a predict timeout longer than the script timeout
cannot complete. Keep gojaTimeout comfortably above the predict timeout if your rules use inference.
See AI capabilities for deploying a model in the first place.
Security probe results reach the rules engine too
Security probe findings are evaluated by the rules engine and audited exactly like agent metrics. A scan
finding can therefore raise an alarm the same way a metric can — a newly discovered host, a critical
vulnerability, a port that opened when it should not have. See Security probes.
Choosing between a check and a script
Reach for a check when the condition is “this event, this many times, this window”. It is
declarative, visible in the API, and cannot fail in interesting ways.
Reach for a script when you need to remember something between events, combine two signals,
compute a value, or ask the model. The cost is that scripts are code: they need a timeout that works,
they fail in ways checks do not, and they are harder to audit at a glance.
If a check can express it, use the check.
Where alarms go next
Locally, alarms land in eg_alarms and surface through the feeds above and in the web console.
If OpenGate integration is enabled, alarms and executions also publish over the embedded MQTT broker and
are forwarded to the platform, which is how a fleet of probes becomes a single operational picture. See
MQTT and OpenGate operations.
Security Probes
Security probes
Axiom Border assesses the network it sits on with four probes. They share one execution model, one audit
trail and one accumulated view of results, so the findings of each one reinforce the others instead of
living in separate reports.
Probe
What it answers
Requires
Network discovery
What is out there, and what is it listening on?
Nothing beyond a target range
Vulnerability scanning
Which of those services are vulnerable?
Nothing — the checks ship with the product
SNMP
What does the device say about itself?
A reachable SNMP agent and credentials
Passive analysis
What is actually crossing the wire?
A capture interface
Each runs two ways: automatically on a schedule you configure, and manually from the console when
you want an answer now.
Network discovery establishes the baseline for the two probes that ask questions, and that ordering
matters: a vulnerability scan with no explicit target scans every host in the baseline, so discovery must
have run for it to have anything to do. Newly discovered hosts also trigger a vulnerability scan on their
own, grouped together after a short delay, so new assets get assessed without waiting for the next
scheduled sweep.
Passive analysis stands apart — it needs no baseline, because it is not asking anyone anything. See
Passive and active for why the two must not be read as the same kind
of result.
Network status — where all of it lands
The header names the last assessment that ran and how it finished, so you can tell at a glance whether
what you are looking at is current. Three buttons launch and configure the probes:
Button
What it does
Scan network
Runs a discovery scan now, against a target you choose
Passive analysis
Opens what the listening probe has worked out, with its evidence
Automatic scans
Jumps to the schedules for all of them, in Configuration
Each host row carries its own actions — Ports, Vulnerabilities and SNMP — each opening that
host’s detail and each able to re-scan just that host, so you can reassess one asset without sweeping the
whole range.
Network discovery and port scanning
Scan network opens the launch dialog. Every option the probe supports is here, so there is no reason
to drop to the API for a scan:
Field
What to know
Target
Whole network uses the configured range; Custom IP scans a single address
Ports
Leave empty and it scans all 65,535 per host. On a /24 at cautious timing, that is a long scan — narrow it
Timing
Five presets from cautious to flat out, each with a one-line description of what it trades away
Timeout
Raise it whenever you widen the target or the port range
Scan ports · UDP · Service detection · OS detection
UDP is slow — restrict the port list rather than sweeping. OS detection needs the probe to run privileged
A port list worth copying for industrial networks
1-1024,502,2404,20000,47808 covers the common IT range plus the Modbus, IEC-104, DNP3 and BACnet ports,
so industrial assets show up in the baseline the vulnerability probe later works from.
One discovery scan at a time
Launching a second while one is running is refused. Forcing it cancels the running scan and marks it
failed with the reason, rather than letting it look as though it completed.
What discovery gives you per host
A host’s Ports panel lists what it is listening on, with the service the scan identified and when
each port was first and last seen:
The first-seen and last-seen pair is what makes this more than a snapshot: a port with a recent first
seen is new, and that is usually the thing worth acting on. The panel re-scans just this host, so
you can confirm a change without sweeping the range again.
Scheduled discovery is configured under Configuration → Automatic scans, in the nmap block.
Vulnerability scanning
Two distinct halves. The generic half uses the bundled upstream template set. The OT/ICS half
uses Axiom Border’s own suite of 57 industrial protocol checks, which travel inside the product and work
with no internet access. Both are covered in
Catalogs: vulnerabilities, OIDs, MIBs and more.
Open a host’s Vulnerabilities panel and use Re-scan IP address vulnerabilities:
Depth is the setting that matters most, and the dialog explains each option as you select it:
Depth
What runs
Light
Technology detection and TLS only. Checks no CVEs
Medium
Adds known CVEs, misconfigurations and default credentials
Deep
All of the above, plus exposures, network services and the OT/ICS suite
OT/ICS (industrial)
The industrial suite on its own — Modbus, IEC-104, DNP3, BACnet, OPC UA
Selection is by check family rather than by folder, so it does not depend on how the template set is laid
out on disk.
Severity toggles which findings are reported at all, and Intrusive mode (OT/ICS) is the switch
that adds checks which write to the device rather than only reading it.
Intrusive mode needs two locks released, not one
The switch in this dialog is only one of two locks. The probe must also be configured to permit intrusive
scanning at all, and that setting is off on every installation.
With it off, the scan is not quietly downgraded to a read-only run — it is accepted and then ends as
failed, and nothing is scanned at all. That matters more than it sounds: a request for intrusive mode
you were not authorised to make does not come back as a clean read-only report, it comes back as no
report.
The Network status header names the reason, so you are not left looking at a scan that did nothing
and said nothing. It is recorded with the execution and in the service log as well.
Name says what was confirmed — Modbus/TCP Diagnostics Function Exposed Without Authentication — and
Description explains how it was confirmed and why it matters. CVE is empty whenever the finding is
an exposure rather than a published vulnerability, so Template ID is the stable way to refer to one.
Origin is the column to read first: probe means the request was sent and the target answered, while
inferred means it was derived from the device’s identity with no traffic emitted — a lead to verify,
not a demonstrated fact. Confidence qualifies it further, and where an inference has evidence behind
it, the Evidence toggle in that column opens it.
Checks from the write/control layer are marked twice over: the name ends in [INTRUSIVE] and the
description opens with INTRUSIVE / GATED.
Detected, and what is merely potential
The table is titled Detected vulnerabilities, and the word is doing real work. It holds what was
confirmed by an active scan, plus inferences where the product was actually identified. What it does
not hold is the surface attributable to a device known only down to its manufacturer — that would be
hundreds of rows the probe cannot stand behind, burying the findings you can act on.
That surface is not discarded. It is summarised above the table, as a count with its severity breakdown
and a recommendation to scan the host actively.
An amber Vulnerabilities button means look inside
On Network status, a host whose potential surface is being summarised rather than listed shows its
Vulnerabilities row action in amber. Without that cue a host with a hundred unconfirmed CVEs
behind it reads exactly like a clean one from the collapsed row — which is the one thing an assessment
tool must never do.
There is a cap on how many unconfirmed CVEs a single device lists individually before it switches to a
summary — 30 by default. Version-confirmed findings are never summarised, however many there are.
The cap is sniffing.passiveVulnRowLimit in Configuration; a negative value removes
it and lists everything.
SNMP — interrogation and profiles
Open a host’s SNMP action to query it. The panel takes symbolic names as readily as numeric OIDs and
carries a Standard OIDs helper that explains the common ones in plain language, so you do not need a
MIB browser open beside you:
Results render as a table or as a tree, and the tree is the one to use after a walk. How names resolve to
numbers and back is covered in Catalogs: vulnerabilities, OIDs, MIBs and more.
Profiles instead of credentials
Rather than supplying credentials with every query, store them once as a profile and bind it to the
hosts it applies to. The console has a wizard for this, with predefined profiles to start from, reachable
from the SNMP panel’s profile selector.
Supported versions are v1, v2c and v3. For v3 the console explains the three security levels as you
choose between them — only authPriv both authenticates and encrypts, and it is the only one that
hides what is being polled rather than merely proving who is asking.
Resolution order when a scan runs: the profile named in the request, then the profile bound to that host,
then the configured default. A target that resolves to no profile is skipped, and the execution says so.
Prefer profiles over one-off credentials
Credentials passed inline with a single query are persisted with that execution record and appear in its
detail afterwards. Profiles keep them out of execution history entirely. Use inline credentials for
one-off diagnostics only.
Note
The scheduled SNMP probe runs a discovery pass first, with a fixed budget. A /24 at cautious timing will
exhaust it, so narrow the range or raise the discovery timing value in Configuration.
Passive analysis
The one probe you do not launch. It listens continuously on its capture interface and emits nothing,
building an inventory indexed by MAC address alongside the address-indexed one the active probes fill.
Passive analysis on the Network status header opens what it has established:
Three tabs: the per-device Inventory with vendor, type, role and the confidence behind each, the
LLDP neighbours it has overheard, and Findings such as the capture-point verdict, gateway
identification and address conflicts.
The type and role columns are where the industrial coverage shows. The probe recognises thirteen
industrial protocols carried over IP — Modbus, S7comm, OPC UA, DNP3, IEC-104, EtherNet/IP, BACnet,
CODESYS, MELSEC, PTP, HART-IP, KNXnet/IP and FINS — and records which side is serving and which is
asking. It also reads four protocols that travel directly over Ethernet with no IP layer at all:
IEC 61850 GOOSE and Sampled Values, PTP/IEEE 1588, and PROFINET DCP. On a substation or production
segment those are frequently the bulk of the traffic, and nothing that keys off addresses and ports can
describe them. See Passive and active
for the full picture, including which ports are vendor convention rather than registered and are
therefore reported at lower confidence.
The neighbours tab is LLDP only. The probe sees and counts Cisco’s own discovery frames, but it does
not derive neighbours from them — so a segment of Cisco equipment speaking CDP rather than LLDP produces
traffic the probe accounts for and a neighbour table that stays empty. That is a limitation, not a fault
to chase. The coverage note above the table states plainly what the figure
leaves out — passive analysis only sees what talks, so a silent device is not counted.
Everything about it is configured under Configuration → Automatic scans, in the sniffing block:
which interfaces to capture on, an optional capture filter, which observed addresses reach the host
inventory, how often what it learns is persisted, and whether it infers vulnerabilities from identity.
The interface name is the usual culprit
Capture failing silently almost always comes down to the interface name, which must be the one the
capture library uses: eth0 or enp3s0 on Linux, en0 on macOS. The friendly name from the operating
system’s own network settings does not work.
The Notices panel on Network status reports capture conditions directly — a rejected capture filter,
or analysis stopped by an error — so check there before assuming the network is quiet.
The shared execution model
Every launch is asynchronous: the request is accepted, the work continues in the background, and the
Network status header reports the state of the most recent run as it progresses. A run ends as
finished or failed, and a run interrupted by a probe restart is moved to failed on start-up
rather than being left in progress forever.
Executions also publish over MQTT
For integrations that would rather not poll, the embedded broker publishes started, finished and failed
events for every execution. See MQTT and OpenGate operations.
The merged result view
An individual execution tells you what one probe found. The Network status table tells you what is
known about a host, merged across all four probes: address and hostname, MAC address, manufacturer
and device type with their provenance, operating system, status, when it was first and last seen, then
the per-probe contributions — ports from discovery, findings from vulnerability scanning, values from
SNMP, and traffic counters from passive analysis.
The first-seen and last-updated pair is what turns the baseline into change detection: a host with a
recent first-seen is new to the network.
This same merged view is available through the API for dashboards and integrations, at
GET /security/results/last.
Feeding results into rules
Probe results reach the rules engine, so a finding can raise an alarm the same way a metric can — a new
host appearing, a critical vulnerability, a port opening that should not be open. See
Alarms and rules.
Generic vulnerability scanners are built for IT. Point one at an industrial segment and two things go
wrong: it probes for a web server that a PLC does not have and drops the host from the scan, and when
it does find something it has no idea what a coil or a Common Address is.
Axiom Border ships its own suite of 57 checks for five industrial protocols, written specifically
for this problem. They are installed with the product and made available to every scan
automatically, so they travel in every deployment role and work with no internet access and no
upstream template feed.
Industrial equipment is not a web application
A write to the wrong register on a live PLC has physical consequences. Axiom Border defaults to
read-only and requires two independent switches before it will send a single write frame. Read
the safety model before you enable anything, and never enable intrusive
mode without written authorisation for the segment you are testing.
Protocol coverage
Protocol
Port
Checks
Of which intrusive
Modbus/TCP
502/TCP
19
6
IEC 60870-5-104
2404/TCP
11
4
DNP3
20000/TCP
10
3
BACnet/IP
47808/UDP
10
1
OPC UA
4840/TCP
7
2
Total
—
57
16
Every check is labelled with the protocol it targets, and the ones in the write/control layer are
additionally labelled as intrusive. That intrusive label is what the safety model keys on.
What each layer detects
The suite is organised in four layers of increasing invasiveness:
flowchart TB
    L2["<b>Layer 2 — Detection</b><br>Is this protocol here?<br>Identify vendor and version"]
    L3["<b>Layer 3 — Exposure</b><br>Structural weaknesses reachable<br>without authentication"]
    L3B["<b>Layer 3b — Recon</b><br>Read process data and object lists<br>without writing anything"]
    L4["<b>Layer 4 — Intrusive</b><br>Write / control confirmation<br><i>gated behind two locks</i>"]
    CVE["<b>CVE checks</b><br>Vendor-specific, only where<br>fingerprinting is reliable"]

    L2 --> L3 --> L3B --> L4
    L2 --> CVE

    L4:::danger

    classDef danger fill:#fff0ed,stroke:#ff664e,color:#101010
Detection confirms the protocol is listening and extracts identity where the protocol allows it —
Modbus device identification, DNP3 Object Group 0 device attributes, BACnet vendor identifier, OPC UA
BuildInfo software version.
Exposure reports structural problems that need no credentials to observe: Modbus and DNP3
responding to unauthenticated requests, IEC-104 accepting a station interrogation, BACnet/IP being
usable as a reflection and amplification source, OPC UA offering endpoints with None security policy
or anonymous authentication.
Recon reads real process data — Modbus holding registers via FC03, Modbus diagnostics via FC08
sub-function 0, IEC-104 counter interrogation and read commands, DNP3 event classes and class-0
integrity polls, BACnet Who-Is discovery and object enumeration. These checks read; they never write.
Intrusive confirms a write is actually possible. It is described in detail below.
CVE checks exist only for the cases where the protocol itself reveals enough to be sure: Schneider
Modicon over Modbus/UMAS, Delta enteliBUS (CVE-2019-9569) and Contemporary Controls (CVE-2025-13926)
over BACnet, plus a multi-vendor Modbus fingerprint that maps identity to known advisories.
Why some known CVEs are deliberately absent
Axiom Border only reports what it can actually confirm. Three known CVEs cannot be confirmed over the
industrial protocol itself, so no check claims to detect them: DNP3 CVE-2020-6996 (the Triangle
MicroWorks stack version is not observable over DNP3), OPC UA stack versions below 1.5.374.158 (only
the Basic128Rsa15 precondition is observable, and that is already covered by an exposure check), and
the IEC-104 device CVEs (IEC-104 carries no native device identifier). For those, use
SNMP interrogation to fingerprint the device and correlate the version
externally.
Scan depth and how OT checks get selected
Depth decides which checks run. OT checks are never included by accident — you either choose a deep
scan, choose OT explicitly, or opt in for scheduled scans:
Depth in the console
Web templates
OT read-only checks
Notes
Light
Yes
No
Unless the scheduled probe has OT checks enabled
Medium
Yes
No
Unless the scheduled probe has OT checks enabled
Deep
Yes (full)
Yes
Full web scan plus a separate OT pass
OT/ICS (industrial)
No
Yes
The industrial suite only — for dedicated OT segments
In configuration.yaml the same four depths are written ligero, medio, profundo and ot. The
console labels them Light, Medium, Deep and OT/ICS. They are the same four settings — worth knowing if
you move between the two.
Scheduled scans with OT checks enabled add the read-only OT layer to whatever depth they run at.
The OT pass runs separately, on purpose
When a scan includes OT checks, that part runs as a pass of its own that does not discard hosts
without a web server. A general-purpose scan pre-filters targets by HTTP reachability, which would drop
a PLC or RTU before a single Modbus request was ever sent. Running the OT pass separately is what makes
industrial assets visible at all.
The safety model: two locks
Intrusive checks send write or control frames. Enabling them requires two independent switches that
live in different places, so neither an operator nor a configuration mistake can unlock them alone:
Per-scan opt-in — Intrusive mode (OT/ICS) in the scan dialog, off every time you open it:
Deployment kill-switch — vulnScan: authorise intrusive mode in
Configuration → Automatic scans, which is off on every installation and has to be turned on
deliberately, by someone with access to the probe’s configuration.
If the deployment lock is closed, an intrusive scan is rejected outright, not silently downgraded.
The run is accepted and then ends as failed, and no checks execute — not even the read-only ones
the same request asked for.
So an unauthorised intrusive request gives you nothing, never a partial result you might mistake for a
clean bill of health — and the Network status header names the setting that blocked it, so the
refusal is visible where you launched the scan rather than buried in a log.
Neither lock can be bypassed — the same rule applies to scans launched by the platform as to scans
launched from the console.
The scheduled sweep is never intrusive
Whatever those two switches say, the scheduled vulnerability scan does not run write or control
checks. Intrusive mode is a deliberate, manual, per-scan act — it can never become the background
behaviour of a probe someone configured months ago and forgot.
The scheduled probe never runs the intrusive layer. Automatic periodic scans are always
read-only, whatever the configuration says. Intrusive checks only ever happen because someone asked
for one, explicitly, right now.
Every intrusive execution is audited. A WARN entry goes to the log and a notice is attached to
the details field of the execution record.
Intrusive means “no net change”, not “no writes”. The approach is read-then-write-back — read
the current value, write the same value back — or SELECT-only for command protocols, issuing the
select phase without the execute phase. Genuinely destructive actuation is excluded from the suite
entirely.
What the intrusive layer actually does, per protocol
Write-back of the read value; CROB in SELECT-only form
BACnet/IP
writeproperty-noauth
Writes present-value back verbatim, preserving the original tag encoding
OPC UA
anonymous-session, node-write-back
Establishes an anonymous session; writes a read value back
Real physical risk
“No net change” is a design goal, not a law of physics. A PLC may react to the act of being written
to — some stacks latch, some log, some fault. A SELECT without an execute leaves a control point
reserved on some IEC-104 implementations. Treat intrusive mode as an operation on live plant, because
that is what it is: schedule it, get authorisation, and have someone watching the process while it
runs.
Three ways to run it
All three start the same way: open the host’s Vulnerabilities panel and use Re-scan IP address
vulnerabilities. What changes is what you set in the dialog.
A dedicated OT segment scan, read-only
The common case — assess industrial equipment without touching a single register.
Set Depth to OT/ICS (industrial) and leave Intrusive mode off. That runs the industrial suite
on its own: detection, exposure and recon layers, all read-only. Nothing else runs, so there is no web
scanning noise against equipment that has no web interface.
A deep scan covering both IT and OT
Set Depth to Deep. That is everything — technology detection, CVEs, misconfigurations, default
credentials, exposures, network services and the OT/ICS read-only suite.
Use it on a mixed segment where industrial equipment sits alongside ordinary servers. On a pure OT
segment prefer OT/ICS, which does the same industrial work without the rest.
An intrusive confirmation scan
Only once the deployment lock has been opened, and only against equipment you are authorised to write to.
Set Depth to OT/ICS, turn Intrusive mode (OT/ICS) on, and — this is the part that matters —
run it against one host, not a subnet. Open the panel for that single asset rather than sweeping a
range.
Narrow the target before you open the second lock
A read-only sweep across a /24 is routine. An intrusive sweep across a /24 sends write and control
frames to every industrial device that answers, including ones you did not have in mind.
Intrusive runs are per-asset by discipline, not because the product forces it.
Enabling OT checks on the scheduled probe
To have the periodic automatic scan include the OT read-only layer without changing its level:
securityProbes:
vulnScan:
enabled: truelevel: "medio"enableOT: true# adds the read-only OT layer to scheduled scansallowIntrusive: false# keep the master lock closed
This is the recommended steady-state configuration for a probe sitting on an industrial segment:
continuous read-only OT visibility, with the write layer bolted shut.
Reading the results
OT findings surface through the same execution model as every other probe — poll
GET /security/executions/{uuid} for status, and read the findings from the execution record once the
status reaches finished. See Security probes for the shared asynchronous execution model.
Findings identify the protocol, the affected host and port, the check that fired, and the severity. For
fingerprint checks the extracted identity (vendor, model, firmware or software version) is part of the
finding, which is what makes the CVE correlation useful downstream.
Operational guidance
Start with level: "ot" on a narrow target. A /24 sweep of an industrial segment generates
traffic that some networks are not used to. Validate against one host, confirm the findings make
sense, then widen.
Keep allowIntrusive: false as the normal state. Open it for the duration of an authorised test
window and close it again. It is a configuration change and requires a service restart, which is a
feature here rather than an inconvenience — it makes the unlock deliberate and visible.
Expect true negatives. The multi-vendor Modbus fingerprint reports nothing when no listed vendor
is present. That is correct behaviour, not a missed detection.
Segment scans do not need internet. The OT checks are installed with the product and run offline.
If your OT network is air-gapped — and it should be — nothing about this capability degrades.
Catalogs: Vulnerabilities, OIDs, MIBs and more
What the probe knows before it is plugged in
A scanner is only as good as the data behind it, and the usual arrangement is to fetch that data on
demand: a vulnerability feed pulled at scan time, a vendor lookup resolved against a web service, a MIB
downloaded when an unknown OID turns up. Every one of those assumes a route to the internet.
Axiom Border carries all of it. Nothing is downloaded at run time — not before a scan, not during
one, not to interpret a result afterwards. A probe in an air-gapped plant resolves manufacturers, names
OIDs, and matches vulnerabilities with exactly the same coverage as one sitting in an office.
The rule that decides what is updatable
Data is updatable in the field. Decisions are not.
The IEEE registry and the CVE database are facts about the world that change without anyone here
deciding anything, so they can be refreshed on a running probe. The industrial port table and the
device-typing rules are auditable decisions, each with its evidence, and they stay compiled into the
product on purpose — so that what the probe concludes about your network is reproducible, and changes
only when the product does.
What ships, and where it comes from
Catalogue
Source
What is installed
Vulnerabilities — CVE database
The NVD, the US NIST National Vulnerability Database
13,275 unique CVEs across 218,111 vendor·product·version rows, in 20 vendor feeds
Manufacturers — IEEE registry
The IEEE, published registry of MAC address blocks
39,979 assignments, laid over the built-in table
Manufacturers — built-in table
The same IEEE registry, frozen into the product at build
38,242 prefixes. The floor that can never go missing
OIDs and MIBs
Vendor-published MIB modules, gathered from public sources
12,547 modules in the format the probe reads, plus 15,869 in ASN.1 for your own tooling
Generic vulnerability checks
The upstream nuclei-templates project, pinned to a fixed release
13,279 templates
OT/ICS vulnerability checks
Written by amplía))) for this product
57 checks — 41 read-only, 16 intrusive behind two locks
Every figure above is what the probe reports about itself. None of it needs a network to be true.
Vulnerabilities — why those 20 vendors
The vendor list is not “who makes industrial equipment”. It is which vendors the probe can actually put
a name and a version to from what it observes — a neighbour announcement, a MAC address block, or a
device declaring itself. A vendor the probe cannot identify would contribute rows that could never match
anything.
The last group is there on purpose, and it is not a category error. Neither vendor makes industrial
equipment, but both turn up in plants regardless — the NAS somebody parked the historical data on, the
router somebody plugged in. The probe identifies them by MAC address block like anything else and their
firmware carries versions, which is the only criterion this list applies.
What is in there, by severity: 1,341 critical, 4,853 high, 4,316 medium, 215 low, and 2,549 not
scored, spanning disclosures from 1999 to 2026.
The database is what turns an identity into a finding without emitting a packet, and how complete the
identity is decides what the probe is allowed to say:
What was identified
What it reports
Vendor, product and exact version
Affected — a genuine “vulnerable to this CVE”
Vendor and product, version unknown
Potentially affected, verify — never presented as the same thing
Vendor only
No CVE can be pinned to the host, so it reports the vendor’s known CVE surface as a count and severity breakdown, with a recommendation to scan it actively
That last row is the one worth reading twice. A host identified only down to its manufacturer is not a
clean host — it is one the probe could not narrow far enough to name a finding. Reporting it as an
empty row would be the single most misleading thing an assessment tool can do, so it reports the size of
what it cannot yet see instead.
Two vendors that looked present and were not
Hirschmann and Phoenix Contact originally returned nothing at all, while appearing perfectly healthy in
the list: the NVD files them under Belden and phoenixcontact respectively. Both are manufacturers
the probe identifies routinely, so the empty feeds would have meant silent blind spots on common
industrial equipment — a good illustration of why the coverage figures above are verified against the
source rather than assumed.
Manufacturers — the registry and the floor beneath it
The installed IEEE registry turns a MAC address into a vendor name. It wins for the prefixes it
carries; everything else keeps resolving against the table built into the product. See
Passive and active for how that claim is presented with its
evidence and its caveats.
Only the built-in table is mandatory
Remove the installed registry and nobody loses their manufacturer — resolution simply falls back to the
table inside the product. That is deliberate: making the overlay compulsory would turn an offline-first
probe into one that needs an external file to do its job.
Only full-length assignments are used
The IEEE publishes three sizes of address block. Axiom Border uses only the full-length (MA-L)
assignments, because the two smaller kinds divide a single 24-bit prefix between several companies —
including them would confidently attribute one company’s block to a different company. A wrong
manufacturer is worse than no manufacturer.
Against the registry documented here, the installed file adds 1,737 prefixes the built-in table
cannot resolve at all and changes the name on 270 more. Most of that second number is the registry
tidying its own punctuation and character encoding rather than a company changing hands, but the ones
that matter are in there: Phoenix Contact and ABB, now Hitachi Energy, are the renamings you are most
likely to notice on a real inventory.
Take those three numbers as a snapshot, not a specification. They are a comparison between two things
that both move on their own — the registry the IEEE republishes every few days, and the table compiled
into whichever build you are running. The probe works the current figures out for itself and reports them;
see checking what a probe actually has.
OIDs and MIBs — the SNMP catalogue
An OID like .1.3.6.1.4.1.6574.2.1.1.5 means nothing on its own. Turning it into diskTemperature
requires a MIB, and on an air-gapped probe you cannot look one up — so the catalogue ships with the
product.
Contents
Used by
JSON catalogue
12,547 modules across 2,762 vendors
The probe. This is the catalogue it reads
ASN.1 catalogue
15,869 modules
Not the probe — supplied for the host’s own SNMP tooling
The modules are vendor-published MIBs, gathered from the manufacturers’ own documentation and public MIB
collections, and installed as a single catalogue. It is treated as an external source of truth: it is not
hand-edited, and it is refreshed as a whole rather than patched.
The ASN.1 tree is a convenience, not a spare copy
The probe never reads it. It is there so that snmpwalk and similar tools on the same host can resolve
names too — copy it to /usr/share/snmp/mibs if you want that. Pointing the probe at it does not work.
Vulnerability check templates
Two origins, and the pin is what holds the offline model together.
The generic templates come from the upstream project, pinned to a fixed release, and the engine’s
own self-update is switched off. Both are load-bearing: an engine allowed to chase “latest” would try to
download templates the first time it ran a scan, and a probe with no route out would simply fail there.
The OT/ICS suite is written in-house and lives inside the probe itself rather than in the
templates directory. It is written out to disk each time a vulnerability scan runs, and anything left
over from a previous version is removed at the same time.
That mirroring is a safety property, not housekeeping
Because the suite on disk is rebuilt from the copy inside the product at every scan, a check withdrawn in
an upgrade stops firing everywhere. That matters most for the intrusive ones: a write-capable check
removed on purpose cannot survive on disk and keep running.
All three locations are set from Configuration → Automatic scans, and the defaults are correct for a
standard installation — you only touch these to point the probe at data you placed somewhere else.
Setting
What it points at
Sniffing: CVE feed directory
Where the CVE database is seeded from at start-up
Sniffing: IEEE OUI registry
The registry file laid over the built-in manufacturer table
SNMP: MIB directory
The MIB catalogue, in the format the probe reads
Sniffing: passive vulnerabilities, on the same screen, is the switch that turns identity into findings
after each observation window. With it on and no CVE database seeded, you still get identity — you just
get no CVEs from it.
Working with OIDs from the console
Network status → the SNMP action on a host row opens the query panel. This is the normal way to
interrogate a device, and it needs no knowledge of OID numbering at all:
Version and Port set how to talk to the device.
Add OID takes a symbolic name or a numeric OID. You can paste several at once, separated by
commas, spaces or line breaks.
Standard OIDs expands into the common ones grouped by purpose — System, Interfaces, Host
resources — each explained in plain language rather than by number. sysDescr is described as
vendor, model and firmware, all in one string; sysObjectID as the vendor’s identifier for the
model — the usual fingerprint. Click one to add it.
Manual OID / Retrieve OID switches between naming OIDs yourself and reading back what the probe
already holds for that host.
Results render as a Table or a Tree, and the tree is the one to use after a walk.
Credentials do not belong in this panel. Store them once as an SNMP profile — the console has a
wizard for it, with predefined profiles to start from — and bind the profile to the host. See
Security assessment.
How resolution works
Two directions matter, and they behave differently: symbols become OIDs before the request goes out, and
OIDs get names again on the way back.
Inbound, when a query contains symbolic names, they are resolved before anything is sent on the
wire: first a small built-in table of the universal system OIDs, then anything already numeric passes
through untouched, then everything else is looked up in the vendor’s modules.
flowchart TB
    S["Requested name<br>sysDescr"] --> C1{"Built-in<br>system OID?"}
    C1 -->|"no"| C2{"Already<br>numeric?"}
    C2 -->|"no"| C3{"In the vendor's<br>modules?"}
    C3 -->|"no"| FAIL["Query fails<br>unresolved oids"]:::danger
    C1 -->|"yes"| OK["Numeric OID<br>sent on the wire"]
    C2 -->|"yes"| OK
    C3 -->|"yes"| OK
    classDef danger fill:#fff0ed,stroke:#ff664e,color:#101010
An unresolved symbol fails the whole query
If any requested symbol cannot be resolved, the run ends as failed — it does not silently skip the
unknown ones and query the rest. The failure names the symbols it could not resolve, so the fix is
usually obvious: correct the spelling, pick the name from Standard OIDs, or use the numeric OID.
Outbound, every OID that comes back is put through four steps, first match winning: the built-in
system OIDs; the vendor’s modules, trimming up to two trailing segments — which is how indexed OIDs
such as ifDescr.3 resolve to ifDescr; the SNMPv2 module; and a set of generic modules by exact match.
If nothing matches, the name comes back as unknown. The value is still returned — only the label is
missing.
Ambiguity yields no name rather than a wrong one
When trimming produces more than one candidate match, resolution stops and returns no name. This is
deliberate, and it is the same principle the probe applies to manufacturer identity: a value labelled
with a plausible-but-wrong symbol is worse than an unlabelled one, because it silently misleads whoever
reads the report.
The vendor hint
Symbol resolution needs to know which vendor’s modules to search. Axiom Border works it out in order:
The MIB named in the query itself.
The default MIB from Configuration → Automatic scans → SNMP: default MIB.
Inferred from the host’s manufacturer, as already recorded in the inventory.
The third is the useful one, and it is why running discovery before SNMP pays off: the manufacturer
already established for that host becomes the vendor hint automatically. Explicit rules exist for common
vendors — Synology, Cisco, HP, Huawei, Juniper, D-Link — falling back to the first word of the
manufacturer name.
The hint is only consulted when a query actually contains non-numeric symbols. All-numeric queries need
no vendor at all.
Values in results
Each result entry carries the numeric OID, the resolved name (or unknown), the formatted value and a
status. Values are formatted by type: numbers as numbers, IP addresses in dotted form, and byte strings
as text when they are printable, otherwise as hexadecimal — so binary values are legible rather than
mangled.
Walks mark disappearances, single queries do not
A walk covers a whole subtree, so an OID that was previously known and is now absent is genuinely
gone, and gets marked as down. A single-OID query only asks about what you listed, so absence proves
nothing and nothing is marked. This is why change detection over SNMP inventory should use walks.
Browsing the MIB catalogue
Listing vendors, searching for a symbol and inspecting a module are not in the console — the
catalogue browser is available through the API only. Day-to-day this rarely matters, because the
Standard OIDs helper covers the common cases and the vendor hint resolves the rest automatically.
Reach for these when you are working out what a specific vendor exposes.
# Vendors and their modules — inexpensive regardless of catalogue sizecurl -sk https://192.168.1.10:8083/security/mibs \
-H "Authorization: Bearer <jwt-token>"# Search for a symbol. Always pass vendor when you cancurl -sk 'https://192.168.1.10:8083/security/mibs/search?q=diskTemp&vendor=synology&limit=50'\
-H "Authorization: Bearer <jwt-token>"# Inspect one module. Names are exact and case-sensitivecurl -sk https://192.168.1.10:8083/security/mibs/SYNOLOGY-DISK-MIB \
-H "Authorization: Bearer <jwt-token>"
q is matched as a case-insensitive substring against object names. Always pass vendor when you
can: with it the search covers one vendor’s modules, without it the whole catalogue, and that is the
one operation whose cost grows with catalogue size. Everything else here is fast.
How a module ends up under a vendor
Vendor is derived from the module name: everything before the first hyphen, lowercased. So
SYNOLOGY-DISK-MIB belongs to vendor synology, and A3COM-HUAWEI-DEVICE-MIB to a3com. A module name
with no hyphen becomes its own vendor.
This is a heuristic rather than metadata read from the file. It works because MIB naming conventions are
near-universal, but do not expect it to be perfect on unusual modules — which is the other reason to
search by symbol rather than by browsing vendors.
Extending the MIB catalogue
To add a vendor’s MIB, place its JSON module in the configured catalogue directory. New modules are
picked up automatically, and changing the directory reloads the catalogue from the new location.
A missing catalogue does not stop the probe
If the catalogue cannot be loaded — wrong path, unreadable files — the probe logs a warning and carries
on with an empty catalogue rather than refusing to start.
The signature of that particular mistake is distinctive and worth recognising: numeric OIDs work,
sysDescr works, and everything else fails to resolve. Check SNMP: MIB directory in
Configuration → Automatic scans before looking anywhere else.
Keeping the catalogues current
Three of them can be replaced on a running probe, with no restart and no internet: the CVE feeds, the
IEEE registry, and the vulnerability check template bundle. You bring the file to the probe by whatever
means your site allows, and the probe takes it from there.
This is not in the console yet
Updating these catalogues is currently an API operation — the web console reads and edits where they
live, but does not yet offer uploading a new one. The calls below are the supported path today.
Accepts a single feed file or the whole bundle. Ingestion is idempotent per feed: re-ingesting a feed
deletes its previous rows before writing the new ones, so a CVE withdrawn upstream disappears here too
rather than lingering as a stale finding. Add ?replace=true to empty the directory first instead of
merging into it.
Takes the IEEE file exactly as published. The next observed frame already resolves against it — there is
no reload step.
It is validated on a copy before anything is replaced. A file that fails to yield a single usable
assignment is rejected and the running registry is left untouched, so a truncated download cannot take
your manufacturer resolution down with it.
The same shape exists for /security/oui-overlay and /security/vulnscan/templates.
Files on disk and rows ingested are two different numbers
Reading both at once is deliberate, because their disagreement is the exact signature of the most common
failure: the feeds are on the probe and nothing seeded them. A feed listed with a real size but
entries: 0 is a file sitting in the directory that is not a feed the probe can read.
The OT check count reads zero until the first scan
Because the industrial suite lives inside the probe and is written out at scan time, a probe that has not
run a vulnerability scan yet reports 0 OT checks. The suite is present and will be used; it simply
has not been laid down on disk yet.
Do not read that zero as a missing installation.
Why this is worth the disk it takes
Every catalogue here could have been a web service call. Making them local costs a few hundred megabytes
and buys four things that matter in an industrial network:
The probe works where it is most needed. Isolated segments are isolated deliberately. A tool that
phones out to stay useful is either useless there or a hole in the isolation.
Results are reproducible. The same probe, the same version, the same data, gives the same answer
next month. A feed that silently moved underneath you does not.
Nothing about your network leaves it to be analysed. Resolving a vulnerability against a hosted
service means telling that service what you have.
A scan cannot fail because something upstream was unreachable, renamed, or rate-limited.
And where the world genuinely does move — new CVEs, reassigned address blocks — you refresh it
deliberately, on your own schedule, with a file you can inspect before you install it.
AI Capabilities
AI capabilities
Axiom Border can run machine-learning models on the probe, in containers, to detect anomalies in the
metrics it ingests. A model trains locally on local data, exposes an inference endpoint on loopback, and
rules call it to decide whether an event is worth an alarm.
The point is the same as everywhere else in the product: no cloud round trip, no data leaving the site.
Linux and the central role are required
This feature requires Linux and the container engine that the central role installs, so deploy
AI capabilities on that role.
Anywhere else the rest of the probe runs normally — every other subsystem is unaffected — but the
AI capability does not start, and the controls that deploy or train a model have nothing behind them.
Anomaly detection covers system metrics
Deploy the capability with agent type metrics, which detects anomalies in the system metrics the
probe ingests. The other agent types — ssh, iface, usb — appear in the API but are not supported
yet.
Where you manage it
AI capabilities in the console lists the models configured on the probe. On a fresh installation it is
empty, because model images are supplied separately from the product:
From here you create a capability, follow its training state, force or cancel a training run, edit the
rule that calls the model, and read the quality metrics the model reports about itself. Everything on
this page is done from that view — the sections below follow it in order.
The lifecycle
flowchart TB
    TAR["Model image tarball<br>supplied separately"]:::ext -->|"stage on disk"| IMG["Image imported<br>for one agent type"]
    IMG -->|"deploy"| EXPORT["Training data<br>exported"]
    EXPORT --> DEPLOY["Container deployed"]
    DEPLOY --> HEALTH{"Model<br>healthy?"}
    HEALTH -->|"not yet"| HEALTH
    HEALTH -->|"responds"| READY["READY"]
    READY -->|"retrain due"| TRAIN["TRAINING"]
    TRAIN --> READY
    READY -->|"predict"| INFER["Inference<br>from rules"]
    classDef ext fill:#e9edfa,stroke:#486ac9,color:#101010
Each agent type has a fixed loopback port, which is how a rule reaches the right model:
Agent
Port
Container name
iface
5555
<trainerContainerName>-iface
ssh
5556
<trainerContainerName>-ssh
usb
5557
<trainerContainerName>-usb
metrics
5558
<trainerContainerName>-metrics
Each model listens on the host’s loopback address, so rules reach it at 127.0.0.1:<port>.
Loading a model image
Model images are not part of the installation bundle — they are supplied separately, because which
model you run is a decision about your data rather than about the product.
Create new AI trainer collects everything needed in one step: the model package, and the agent type
it applies to. You can upload the package from your machine, or tick Use file on disk and pick one
already staged on the probe — the wizard lists what is there, with the directory it is reading.
Loading an image replaces the others
Importing a model keeps the image for the agent you named and removes the images loaded for other
agent types. If you intend to run capabilities for more than one agent, importing them one after
another will not accumulate them.
Deploying a capability
The same wizard deploys it. Two settings decide how it behaves afterwards:
Setting
What it does
Retraining period
How often the model retrains. Ten minutes is the minimum — shorter is rejected. Leave it at zero and the model never retrains
Script enabled
Whether the rule for this agent runs. It can be set to enable itself as soon as data arrives from that agent
Deployment then does four things in order: exports the training data the probe already holds, starts the
model with that data available to it, waits for the model to report itself healthy, and marks the
capability ready — at which point it collects the model’s own quality metrics and enables the rule.
The health wait is bounded, roughly a minute and a half by default. A model that is slow to start needs
that raised in Configuration; it is not a failure of the model.
Only one capability per agent type can exist at a time. Deploying over an existing one is refused —
remove it first.
Following it from the console
The table on AI capabilities is the whole operational picture: trainer and model name, type, the
retraining period, when it last ran and when it runs next, whether the script is enabled, the data source
and inferencer, the model version, and the status.
Status
Meaning
READY
Trained and serving inference
TRAINING
A training run is in progress
READY, LAST TRAINING FAIL
Serving, but the most recent training run failed
CANCEL, WAITING TO RESUME
A run was cancelled; the schedule decides what happens next
ERROR
Something failed, with the detail alongside
Each row carries its actions:
Action
What it does
Train now
Forces a training run outside the schedule
Cancel training
Stops a run in progress
Edit retraining
Changes the retraining period
Edit script
Opens the rule that calls this model, with a template if it has none yet
Show metrics
The model’s own quality metrics from its last training
Audit log
Every execution recorded for this capability
Delete
Removes the capability
Forcing a run does not move the schedule
Train now updates the last-executed time but leaves the next scheduled run exactly where it was. It
is also refused while a run is already going, and it waits for a scheduled run rather than colliding
with it.
Cancel training stops the probe waiting for the model to come back rather than killing a computation
mid-flight, which is why the capability lands in a waiting state rather than simply stopping.
Training makes inference briefly unavailable
Every training run re-exports the data, restarts the model and waits for health again — so there is a
window during which inference does not answer. A rule that asks the model during that window gets an
error, and it should handle that as “no answer” rather than treating it as an anomaly. A model
restarting is not a security event.
Deleting is best-effort, and says so
Removing a capability cleans up the container, the image, the rule script, the exported data and the
stored record, and stops the retraining schedule. It reports success even when part of that cleanup
failed, with the details alongside — so read what it reports rather than assuming a silent success.
Calling inference from rules
This is where the capability earns its place. A rule script fetches recent metrics, builds a feature
vector, asks the model to score it, and raises an alarm when the model says anomaly:
Two globals are available to scripts for this: newPredict(payloadJSON, agentType) calls the model’s
inference endpoint, and newGetMetrics(agentType) fetches the model’s own metrics. Both target the
loopback port for that agent, and both are configured under trainerDetails.
Keep the script time limit above the predict timeout
The predict call has its own timeout (default 10 s), but the entire script invocation is bounded by
gojaTimeout (default 8 s). With those two defaults, a slow inference call cannot complete — the script
is stopped first.
If your rules call inference, set gojaTimeout comfortably above trainerDetails.predict.timeout, or
lower the predict timeout. Always define gojaTimeout: without a time limit, scripts do not run at all.
The rule script for an agent is enabled through ruleEnabled when deploying the capability, and can be
managed directly through the /scripts endpoints. See Alarms and rules.
Surviving a restart
Capabilities are part of the probe’s local state, and startup restores them: containers are resumed,
model metrics are re-fetched, and retraining schedules resume from their stored next-run time.
One case is treated deliberately: a capability that was training when the process stopped is
considered cancelled rather than resumed, because the training run did not finish. It moves to the
appropriate cancelled state and waits for its next scheduled run.
Failures during this restoration are logged and do not prevent startup.
Configuration reference
The relevant block is trainerDetails — container name, TLS material, and the three endpoint
definitions for health, metrics and inference. See
Configuration.
The health, metrics and inference endpoints are meant to be reached over loopback only. Keep them bound
to 127.0.0.1 and do not expose those ports beyond the host.
MQTT and OpenGate Operations
MQTT and OpenGate operations
Axiom Border carries its own MQTT broker, so a probe is a message bus as well as a monitoring probe. Three
independent pieces make up the messaging layer:
Piece
Role
Embedded broker
The MQTT broker running on the probe, on loopback. Optional TLS listener for remote clients
The broker listens on loopback only, on TCP port 1883. It is not reachable from the network, and that
is the shipped posture rather than a suggestion.
The console does not connect to it directly. It reaches the bus through a bridge inside the API’s own
encrypted connection: the console asks for a single-use ticket that expires in seconds, and exchanges it
when the connection is upgraded. So the live notifications you see in the console travel over the same
authenticated, encrypted channel as everything else, and no separate port is opened for them.
A TLS listener on 8883 exists for the case where you genuinely need remote clients, including mutual TLS
with client certificate verification. It is off by default.
This bus is the one inbound path that does not check a session
Operations arriving on the broker launch scans on the probe, and they are not authenticated by the
API’s session mechanism — that is what makes the loopback default load-bearing rather than merely tidy.
If you point the operations client at a remote broker, the probe requires an encrypted connection and
refuses a plaintext one unless you explicitly override it. Whoever can reach that broker can make the
probe scan.
Before exposing the broker on any network you do not fully control: restrict the port at the network
level, set broker credentials — with both empty it accepts anonymous connections — and enable TLS. After
changing TLS settings, confirm the broker came back up: if the certificates cannot be read it does not
start, and the log says so.
Execution lifecycle events
Every security scan publishes its lifecycle to a single topic, mqtt.client.topic, which defaults to
axiom-border/executions. This is the alternative to polling the executions API.
Note that type here is networkscan, while the REST API reports the same scan as nmap. Map the two
values if you correlate the event stream with the executions API.
Events are published on scan start, on completion, and on startup recovery for executions interrupted by
a restart.
Events are dropped, not queued, when disconnected
While the connection to the broker is down, or when the topic is left empty, lifecycle events are not
buffered for later delivery — they are simply not published. Do not treat this topic as an audit trail.
The authoritative record is the execution history, readable through GET /security/executions; the MQTT
stream is a convenience for live UIs.
Events are published with the configured QoS (default 1) and retain flag (default true), and the client
reconnects every 5 seconds while the broker is unreachable.
OpenGate operations over MQTT
The operations client lets the OpenGate platform trigger scans on the probe remotely. It subscribes to
mqtt.ops.topicSubscribe (default odm/operation) and replies on mqtt.ops.topicPublish (default
odm/response/{device-id}, with the device ID substituted at runtime).
name, id and deviceId are all mandatory. A request missing any of them, or one that does not parse,
is logged and silently ignored — no response is published. An unknown operation name does get a
response, with ERROR_PROCESSING and Unsupported operation.
There are exactly two result codes: SUCCESSFUL and ERROR_PROCESSING.
SUCCESSFUL means accepted, not completed
The operation response is published as soon as the scan is launched, not when it finishes — and it
does not carry the execution UUID. There is no field for it in the envelope.
To follow a scan triggered over MQTT, subscribe to the execution events topic or poll
GET /security/executions. In particular, an intrusive OT scan that the configuration lock rejects is
still answered with SUCCESSFUL; the rejection shows up afterwards as a failed execution.
The four operations
Operation
REST equivalent
hostNetworkScan
POST /security/scan/network
hostVulnScan
POST /security/scan/vulns
hostSnmpScan
POST /security/scan/snmp
hostSnmpWalkScan
POST /security/scan/snmp/walk
Both surfaces drive the same scan engine, so they share the same locking, history and safety gates. The
differences are in what each surface exposes.
hostVulnScan takes targets, timeout, level, severity and intrusive — all optional. It does
not expose templatesDir, so the configured resolution cascade always applies. The intrusive flag is
gated by securityProbes.vulnScan.allowIntrusive exactly as over REST.
hostNetworkScan takes targets, timeout, timing and portFilter. Four options are fixed for
MQTT-launched scans: port scanning is always on, OS detection is always on (which requires
privileges), service detection is always off, and UDP is always off. There is no force equivalent
either, so a scan launched while another manual network scan is running is rejected with
ERROR_PROCESSING and manual network scan already running.
hostSnmpScan and hostSnmpWalkScan take targets, port, timeout, credentials in an snmp
object, and either oids (mandatory for the GET) or walkRoot (defaulting to the enterprises subtree
.1.3.6.1.4.1).
The MQTT snmp object uses different names than the REST customParams: user rather than username,
authType rather than authProtocol, privKey rather than privPass, and privType rather than
privProtocol. The version field is snmpVersion.
Also: only the first entry of targets is used, and these credentials form an ephemeral profile that
ignores stored profiles and associations entirely. mib and profileName are not exposed over MQTT.
Request payloads are not logged
Because operation parameters can carry SNMP community strings and v3 passphrases, request payloads are
deliberately not written to the log — only the operation name, ID and device ID. Responses, which
carry no credentials, are logged in full.
OpenGate provision and collect
Separate from operations, the integration reports upward on a schedule — and it is inert until you
enable it. Everything it needs is on one screen, Configuration → OpenGate:
Setting
What it decides
OpenGate integration
The master switch. With it off, neither collect nor provision runs
API key
Authorises the probe to the platform. Also serves as the MQTT password when collect runs over MQTT and no separate password is set
Schedule
When provision and collect run, as a cron expression — unlike the scan periods, which are durations
Minimum period
A floor that protects the platform from a too-frequent schedule
Below it, HTTPS transport security governs how the probe talks to the platform: whether a private
certificate authority is needed, and whether the probe presents a client certificate of its own for
mutual TLS.
An unencrypted platform URL stops the integration
Allow unencrypted HTTP is off, and leaving it off is the right choice. What travels on this link is
the full inventory of your network together with the API key that authorises it — in the clear, over
plain HTTP.
With the escape hatch off, a plaintext platform URL does not start the integration: it disables it and
records why. It exists only for an installation that genuinely cannot move to HTTPS yet.
Scheduling and throttling
A five-field cron expression (default */30 * * * *) drives both, with descriptors such as @hourly
accepted. An empty or invalid expression means the integration does not run at all — check the log for a
warning if nothing is happening.
minPeriod (default 30 minutes) is a floor: if the cron expression would fire more often than that, the
schedule falls back to a fixed interval of minPeriod and logs a warning. Cycles never overlap — a cycle
due while the previous one is still running is skipped and logged.
Provision
Provisioning registers discovered hosts with the platform. It builds an Excel workbook — one row per host,
with device ID, addressing, state and the location metadata from opengate.collect.address — and uploads
it to the bulk endpoint.
The upload requires exactly 201 Created; anything else aborts the provision. The result is then polled
up to pollMaxAttempts times (default 10, every 5 seconds), and only counts as success when the platform
reports every submitted host as successful.
Provision is HTTP only — there is no MQTT variant.
Collect
Collect sends the accumulated per-host inventory: identity, ports, vulnerabilities and SNMP entries, with
timestamps.
Transport is chosen by collect.mode: mqtt, or http for anything else including an empty value. Over
HTTP the payload is posted with the X-ApiKey header; over MQTT it is published to collect.mqtt.topic,
falling back to opengate.apiKey as the password when no MQTT password is set.
Chunking. With collect.sendByParts: true, each host is split into several messages: a header with the
scalar fields plus one chunked block at a time — ports, then SNMP, then vulnerabilities — sized by
collect.partSize.* (default 100 each). This matters on metered or constrained links where a host with
hundreds of findings would otherwise produce one oversized message. With chunking off, each host is a
single message.
A failed chunk is logged and the cycle continues with the next one, so one bad message does not abort the
whole report.
Device identity
The device ID is derived per host as <ip>-<MAC with dots>, for example
192.168.1.50-00.11.22.33.44.55. Hosts without a discoverable MAC get the placeholder
AA.BB.CC.DD.EE.FF. This is the same format accepted by
GET /security/results/last?deviceId=, so an ID seen in the platform can be looked up on the probe
directly.
Before each cycle, hosts missing a MAC or hostname get a quick nmap ping scan to fill the gaps, bounded by
macDiscoveryTimeout (default 10 s).
A fixed collect.deviceId behaves differently per transport
Setting collect.deviceId forces one identifier for all hosts over HTTP, but the MQTT path always uses
the per-host derived ID. If you rely on this override, use HTTP transport — or better, leave it empty and
let each host keep its own identity, which is almost always what you want.
Configuration reference
Everything here is configured under the mqtt and opengate blocks. See
Configuration for the field-by-field tables, including the TLS options and the
retry parameters for both provision and collect.
Operation and Maintenance
Operation and maintenance
Service commands
Each role installs a different set of units. The standard systemd verbs apply to all of them:
Startup, crashes and early warnings only — 3 to 5 lines in normal operation
/var/log/oda-lite/oda-lite.log — plugin activity, HTTP errors towards central, emitted metrics
Automatic: every 24 h or at 100 MB, 7 archives kept
Lifecycle scripts
—
/var/log/axiom-border-install.log — install, upgrade and uninstall appended together
Not rotated; clear it by hand if it grows
The rule of thumb
To diagnose application logic, read the file. To diagnose a crash or a failure to start, read
the journal. Looking for probe results in journalctl is the most common wasted hour.
Axiom Border — the logger block of configuration.yaml. Set logLevel to DEBUG, INFO, WARN
or ERROR, then restart the service. See Configuration.
oda-lite agent — /etc/oda-lite/oda-lite.conf, [agent] section: log_level and debug. Restart
the service afterwards.
InfluxDB and containerd — the level comes from binary flags in the unit file. Changing it means
editing the unit, and is not recommended.
Turn DEBUG back off
DEBUG on a busy probe generates enough volume to fill a disk. Raise it to reproduce a problem, then
put it back to INFO. Do not leave it on “just in case”.
Rotation and disk usage
Axiom Border’s own log rotates through the logger settings: maxSize (MB per file, default 20),
maxBackups (default 20) and compress (gzip the rotated files).
The journald drop-in installed by the bundle is global — SystemMaxUse=500M and MaxFileSec=1day
apply to the entire host journal, not only to Axiom Border. On a host sharing other workloads, adjust it
or replace it with per-unit drop-ins.
Three things the probe reads off disk are facts about the world that change on their own: the
vulnerability templates, the local CVE database, and the IEEE OUI registry. All three ship with the
bundle, so a freshly installed probe already works. All three can be refreshed through the API,
without restarting the service and without an SSH session — which is the point, because the probe is
designed for a network with no route to the internet.
Data is updatable, decisions are not
The OUI registry and the CVE base change without anyone on this team deciding anything, so they can be
replaced in the field. The OT port table and the device-type rules are auditable decisions with their
evidence, and stay compiled into the product on purpose.
Vulnerability templates
# What is installed right nowcurl -sk https://<probe>:8083/security/vulnscan/templates -H "Authorization: Bearer $JWT"# Offline refresh — the mode that matters on an air-gapped probecurl -sk -X POST https://<probe>:8083/security/vulnscan/templates/bundle \
-H "Authorization: Bearer $JWT" -F "file=@vulnscan-templates.tar.gz"
The archive is expanded and validated in full in a separate directory, the product’s own OT/ICS
templates are re-mirrored on top of it, and only then is it swapped in atomically. A corrupt, empty or
traversal-carrying archive is rejected with 400 and the previous templates still serving. The
response reports what ended up active; a non-zero otTemplates is the check that the OT set survived
the replacement.
The upstream mode (POST /security/vulnscan/templates/update) needs connectivity andallowTemplateUpdates: true. On a standard deployment it answers 409 and points at the bundle route.
Both modes are serialised against a running scan, and the exclusion waits before giving up: the
request blocks for up to 20 s and only then returns 409.
otTemplates: 0 on a freshly installed probe is normal — the OT templates live inside the binary and
are written to the directory on the first scan. A zero after an update is not.
Local CVE database
curl -sk https://<probe>:8083/security/passive/cve-feeds -H "Authorization: Bearer $JWT"# One vendor, merged into what is already therecurl -sk -X POST https://<probe>:8083/security/passive/cve-feeds \
-H "Authorization: Bearer $JWT" -F "file=@nvd-siemens.json"# The whole base, guaranteeing nothing older survivescurl -sk -X POST 'https://<probe>:8083/security/passive/cve-feeds?replace=true'\
-H "Authorization: Bearer $JWT" -F "file=@cve-feeds.tar.gz"
Ingested immediately, no restart. The status reports both the files on disk and the rows in the
database: the two disagreeing is exactly the symptom of “the feeds are there but nothing seeded them”.
If a single file in the upload does not parse as a feed the whole upload is rejected — half a CVE
base is worse than none, because the probe then reports fewer vulnerabilities than there are and looks
like it worked.
OUI registry (manufacturer by MAC)
The table compiled into the binary freezes at each release while the IEEE republishes every few days.
The registry on disk is laid on top of it: it wins for the prefixes it carries, everything else
keeps resolving from the built-in table. Removing it leaves nobody without a manufacturer.
curl -fLO https://standards-oui.ieee.org/oui/oui.csv # on a machine with internetcurl -sk -X POST https://<probe>:8083/security/oui-overlay \
-H "Authorization: Bearer $JWT" -F "file=@oui.csv"
The file is accepted exactly as the IEEE publishes it, so what you installed can be diffed against
the source. It takes effect on the next frame. The response counts what it contributes:
newPrefixes (hardware currently reported with no manufacturer at all), overrides, and renames —
the last being the number that matters, since it is how many devices are about to be reported under a
different manufacturer. Hosts resolved this way publish manufacturerSource: "oui-overlay".
Only MA-L assignments are read. MA-M and MA-S share a 24-bit prefix between several companies, so
including them would credit one company’s block to another.
A version update restores the bundled copy
All three directories are re-staged from the bundle on every install: they are bundle content, not
operator state. An upload through the API is an update between versions. To make new data the
baseline for the fleet, publish its asset pack and let the next bundle carry it.
Loading AI images
AI images are not part of the bundle — they are distributed separately as OCI tarballs, and
resources/iaimages/ ships empty as a placeholder.
Extract the new bundle of the same role on the target and run upgrade.sh. It aborts if the bundle
role does not match the installed role — changing role requires uninstall followed by install.
sudo ./upgrade.sh
Flag
Meaning
--force-conf-regen
Regenerate the oda-lite configuration from the new template, saving the current one as .bak-<timestamp>
-h, --help
Print help and exit
Variable
Default
Meaning
HEALTHCHECK_RETRIES
12
Attempts before declaring failure
HEALTHCHECK_INTERVAL
5
Seconds between attempts — 12 × 5 s gives a 60 s window
AXIOM_API_PORT
8083
API port used for the health check
What it does: verifies the previous installation and role match, stops the role’s services (leaving
InfluxDB and containerd running, so data in flight is not disturbed), takes timestamped backups of the
binary and db.dat, replaces the binary and updatable assets, starts the service, and health-checks it.
Preserved across upgrade:config/, db.dat, .influx-creds, parquet/, logs/,
/var/lib/influxdb2/, resources/iaimages/ and the oda-lite configuration.
Replaced: the binary, MIBS/, resources/gojascripts/, vulnscan-templates/, the documentation
and the lifecycle scripts.
Failed upgrades roll back automatically
If the health check fails all 12 attempts, upgrade.shrestores the previous binary, confirms the
old version answers with HTTP 200, and exits with code 2. The probe is left operational on the old
version and the backup is kept at /opt/axiom-border/axiom-border.bak-<timestamp>. An upgrade that
reports a rollback has not broken anything — diagnose, then retry with a corrected bundle.
Back up db.dat before upgrading
The local state file db.dat is not migrated automatically. If a new version changes its format, the
file may have to be regenerated, and that loses local state — rules, aliases and execution history.
Always take a copy before upgrading, and if the new version will not start cleanly, restore the copy and
revert the binary.
Uninstalling
sudo /opt/axiom-border/uninstall.sh
It stops and disables the role’s services, removes only the units it created, removes the journald
and sshd drop-ins, and asks whether to keep the data — InfluxDB data, db.dat, logs and
configuration.yaml. Answer non-interactively with AXIOM_KEEP_DATA=true|false.
It removes shared binaries only where the manifest marks them as installed by this deployment. It does
not remove nmap, rsyslog or network-manager even if it installed them — those are host
infrastructure and are left to the operator. It does not revert the netplan switch by default.
Variable
Effect
AXIOM_KEEP_DATA=true|false
Answers the data-retention question without prompting
AXIOM_RESTORE_NETPLAN=1
Restores /etc/netplan/ from the backup, re-applies it, and switches back to systemd-networkd
AXIOM_FORCE_CLEAN=1
Destructive. Without a manifest, claims every detected artefact as its own — including global binaries that may belong to other software such as Docker or Kubernetes
Running it on a clean system is safe and idempotent: it reports there is nothing to uninstall and exits 0.
AXIOM_FORCE_CLEAN can remove another product’s binaries
Use it only after confirming nothing else on the host depends on containerd, runc, nerdctl or the CNI
plugins. Without the flag, a manifest-less uninstall stays conservative and touches only artefacts that
are unmistakably Axiom Border’s.
AXIOM_RESTORE_NETPLAN=1 warns about possible connectivity loss. In practice an established SSH session
usually survives, since the TCP connection is not torn down and the IP is retained — but do not count on
it over a link you cannot recover from out-of-band.
journalctl -u <service> --since "5 min ago", looking for start-limit
Install or upgrade behaved oddly
tail -200 /var/log/axiom-border-install.log
Disk filling up
du -sh /var/log/oda-lite /opt/axiom-border/logs /var/log/journal/
Detailed cases
The service will not start. Three usual causes: the binary lost its execute bit
(chmod +x /opt/axiom-border/axiom-border), a required port is occupied, or the YAML is invalid.
Validate the configuration directly:
A port is in use. Identify the holder, then either stop it or move the Axiom Border port:
sudo ss -tlnp | grep -E ':(8083|1883|1888|8086|9090|9091) '
Ports 8083, 1883 and 1888 move via apiPort, mqtt.broker.port and mqtt.broker.ws.port. Ports 9090
and 9091 move in /etc/oda-lite/oda-lite.conf.
Vulnerability scans return zero findings, suspiciously. The web template directory is probably
empty or incomplete:
ls /opt/axiom-border/vulnscan-templates/ | head
It should list per-protocol directories such as http/, network/ and ssl/. CVE templates live under
http/cves/, not at the root. Refresh them as described above. OT/ICS findings are unaffected, because
that suite ships with the product.
Sniffing captures nothing. Check the interface exists (ip -o link show), that the service runs as
root (systemctl show axiom-border -p User), and that there is actually traffic
(sudo tcpdump -i <iface> -c 10).
The UI loads but every API call returns 401. The JWT is missing or expired. Clear the browser’s
localStorage and log in again.
nmap probes hang or take very long. A large target range with poor reachability, a high timeout,
or udp: true with many ports. Narrow the range, lower the timeout, disable UDP.
High memory usage. Check for an AI capability working a large dataset, an Influx bucket with no
retention policy, or logLevel: DEBUG left on.
“Orphaned installation detected.” Bundle artefacts exist without an .install-manifest. Three ways
out: AXIOM_CLEAN_RESIDUALS=1 sudo bash install.sh moves the leftovers aside, sudo bash upgrade.sh
preserves data, sudo bash uninstall.sh cleans best-effort.
upgrade.sh exits with code 2 reporting a rollback. The new binary failed its health check and the
old one is back in service. Diagnose with the journal, the application log and the install log, then
retry with a corrected bundle.
The monitoring node floods the journal with “connection refused” to port 9090. The central node is
not up, a firewall blocks it, or the URL is wrong. The agent keeps retrying and buffers metrics while it
waits, so a short outage loses nothing — a long one eventually will.
Error executing 'netstat': exit status 1. Minimal Ubuntu Server images lack net-tools. Not
blocking — the other plugins continue:
NetworkManager is active but interfaces show as unmanaged. The netplan renderer was not switched
over. Re-run install.sh --switch-to-network-manager; it detects the current state and completes the
switch without reinstalling NetworkManager.
/etc/oda-lite/oda-lite.conf.new contains literal ${VARIABLE} placeholders. The file is an
unexpanded template. Do not copy it over the live configuration — the agent would not start. Delete
it and re-run the upgrade with the current bundle.
scp or tar -xzf fail with Permission denied in /tmp. Some base images ship /tmp with wrong
permissions. It should be drwxrwxrwt: