Welcome to the How-Tos section—your hands-on guide to using OpenGate effectively. Whether you’re starting from scratch or building advanced workflows, these tutorials walk you through every step with clear instructions, screenshots, and best practices.
🏗️ Learning by Doing: A Real-World Scenario
To make this tutorial series more approachable and hands-on, we’ll follow a practical story that evolves across the different chapters. Instead of isolated examples, each tutorial will contribute to building a complete and functional solution using OpenGate.
Our story follows an IT team tasked with monitoring a warehouse facility with an adjoining parking area. Their mission is to deploy sensors, collect data, and generate visualizations and alerts to ensure operational efficiency.
Throughout the series, we’ll walk step-by-step through their journey using the OpenGate IoT Platform to implement:
🅿️ Presence sensors for parking slots These will help detect occupancy status in real time for internal logistics or client access.
🌡️💧 Temperature and humidity sensors for the indoor areas Useful for monitoring environmental conditions in storage zones, employee workspaces, or sensitive equipment rooms.
Each one of the next chapters will build on the previous one — creating users, modeling data, provisioning entities, and building dashboards that reflect the real-world scenario of this IT team. By the end, we’ll have a fully functioning digital twin of their facility.
Let’s get started!
🔐 Pre-requisites
To follow these guides, make sure you have:
An active OpenGate account with access to a sandbox or production instance
Reviewed the Introduction, so you’re familiar with key concepts like Entities, DataStreams, Rules, Operations, and the platform architecture
Basic familiarity with REST APIs, JavaScript (for advanced tutorials), and Python (for Data Py integrations)
📚 How-Tos Overview
Each How-To guide is designed as a standalone tutorial but builds on the previous ones. You’ll find clear objectives, prerequisites, step-by-step instructions, and links to deeper documentation.
Users and Roles:
Set up users, define roles, and assign permissions for secure and organized access control.
Data Modelling:
Create Entities and DataStreams to structure your IoT data model.
Entity Provisioning:
Onboard devices one by one or in bulk using wizards or Provision Functions.
Data Collection:
Send entities registered data via the Device Emulator and view data in entity panels.
Connector Functions:
Learn how to transform, enrich, and forward data to external systems.
Workspaces & Dashboards:
Build custom dashboards using widgets like LastValue, Entity Details, DataStream History, and Maps.
Operations:
Execute predefined tasks and operations on your entities from the catalog.
Easy Mode Rules:
Set up alerting and automation rules using the low-code GUI.
Analytics and Datalab:
Explore and work with your data using the OpenGate Data Lab superpowers with Jupyter Notebooks and python.
Advanced tutorials
Extend your OpenGate skills with Dashboard templates, Advanced rules configuration, and more.
🚧 This “Advanced tutorials” section is currently under development 🚧
🤿 Deep diving
Here are a few key links to deepen your understanding:
REST APIs – Southbound & Northbound: Explore endpoints for device/data management and external system integration.
OpenGate Data Py: Pull data into Python notebooks—perfect for analytics and experimentation.
Analytics & AI Module: Learn how to leverage model training, inference pipelines, and integrated Jupyter notebooks.
✅ Next Step
Choose the first tutorial to begin your journey:
New to OpenGate? Start with “1. Accessing OpenGate & Navigating the Console”
Want to start building dashboards or automations? Jump to section 7 or 8
Let’s turn your IoT vision into reality—step by step with OpenGate!
Subsections of How to
1. Accessing OpenGate
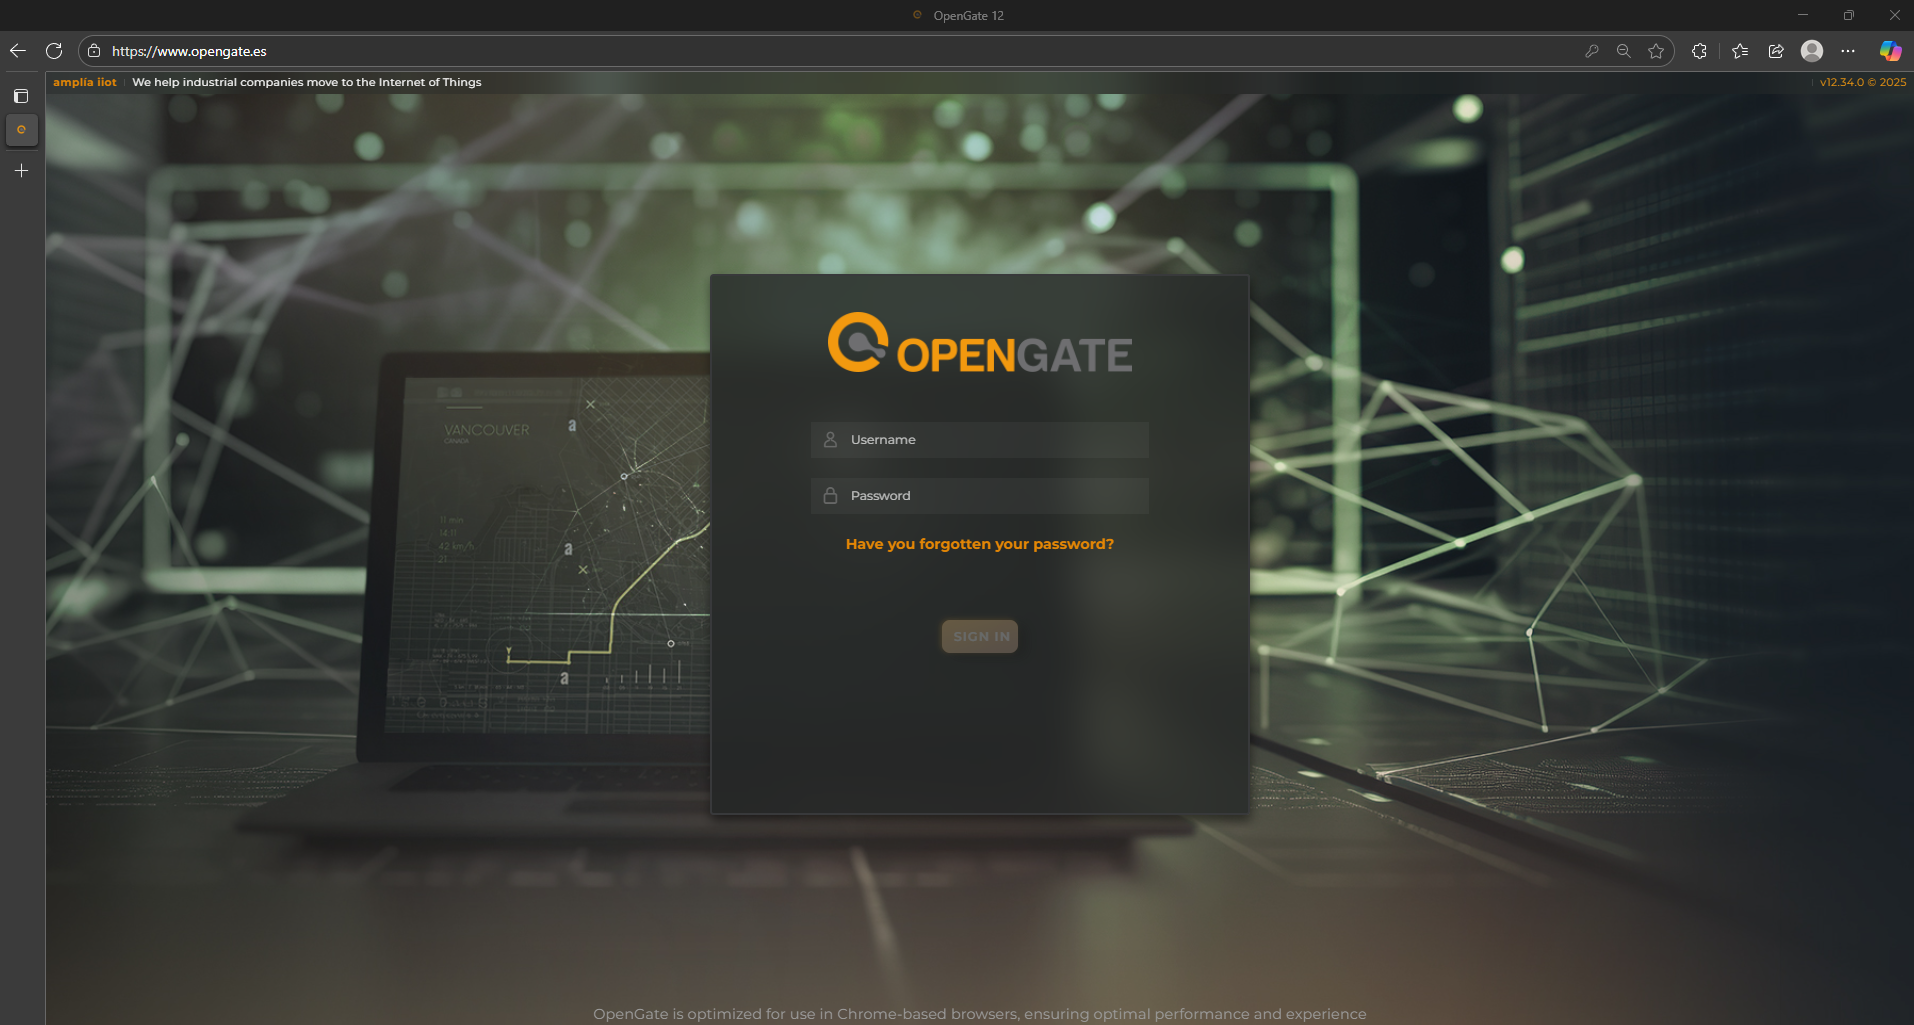
🔐 OpenGate login page
To begin using OpenGate IoT Platform, the first essential step is accessing its Web Console. This interface serves as the GUI control center where users manage devices, define rules, monitor telemetry, and configure their IoT ecosystem.
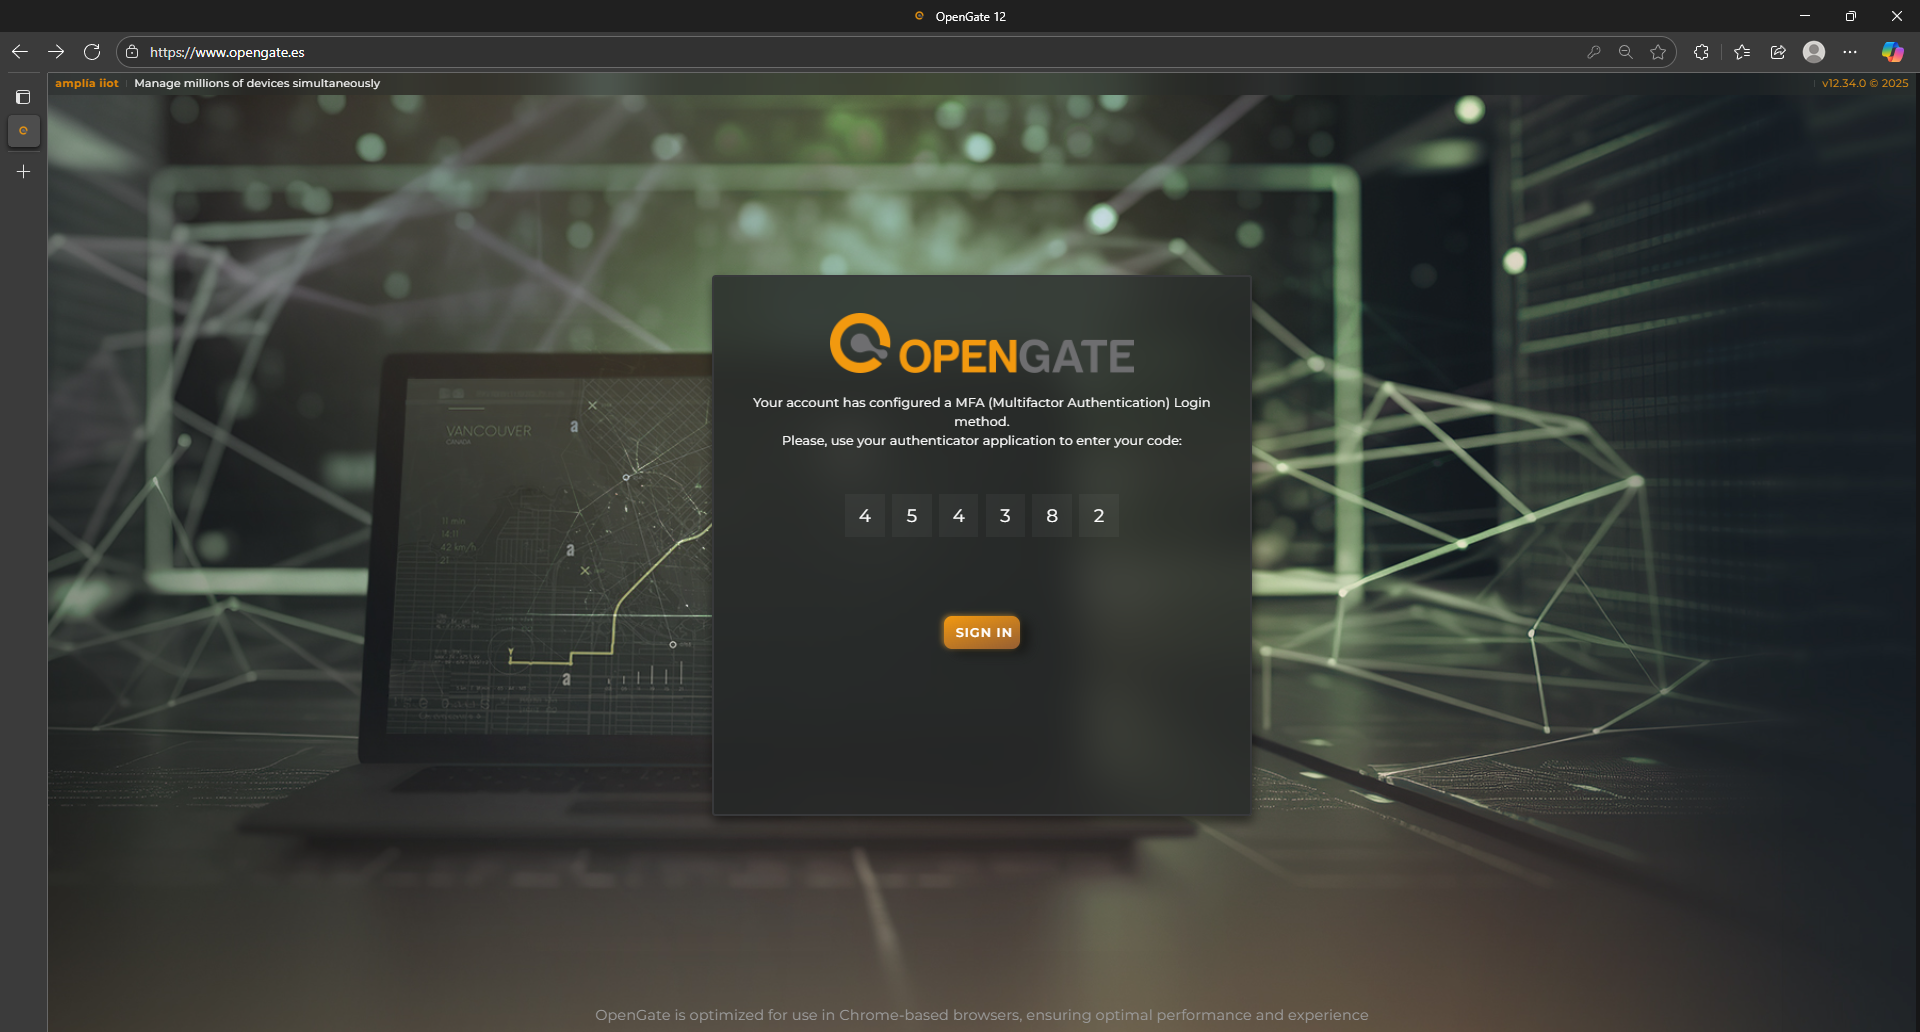
Users must begin by navigating to the OpenGate Console URL. Upon reaching the login page, access is granted via credentials and TOTP (serving as Two Factor authentication method), depending on the authentication method configured for your organization.
🛡️ TOTP Login
TOTP (Time-based One-Time Password) is a security protocol used in two-factor authentication (2FA) systems. It generates a temporary, one-time code that changes every 30 or 60 seconds, based on the current time and a secret key shared between the user and the service. This ensures that each code is unique and valid only for a short duration, adding an extra layer of protection to user accounts.
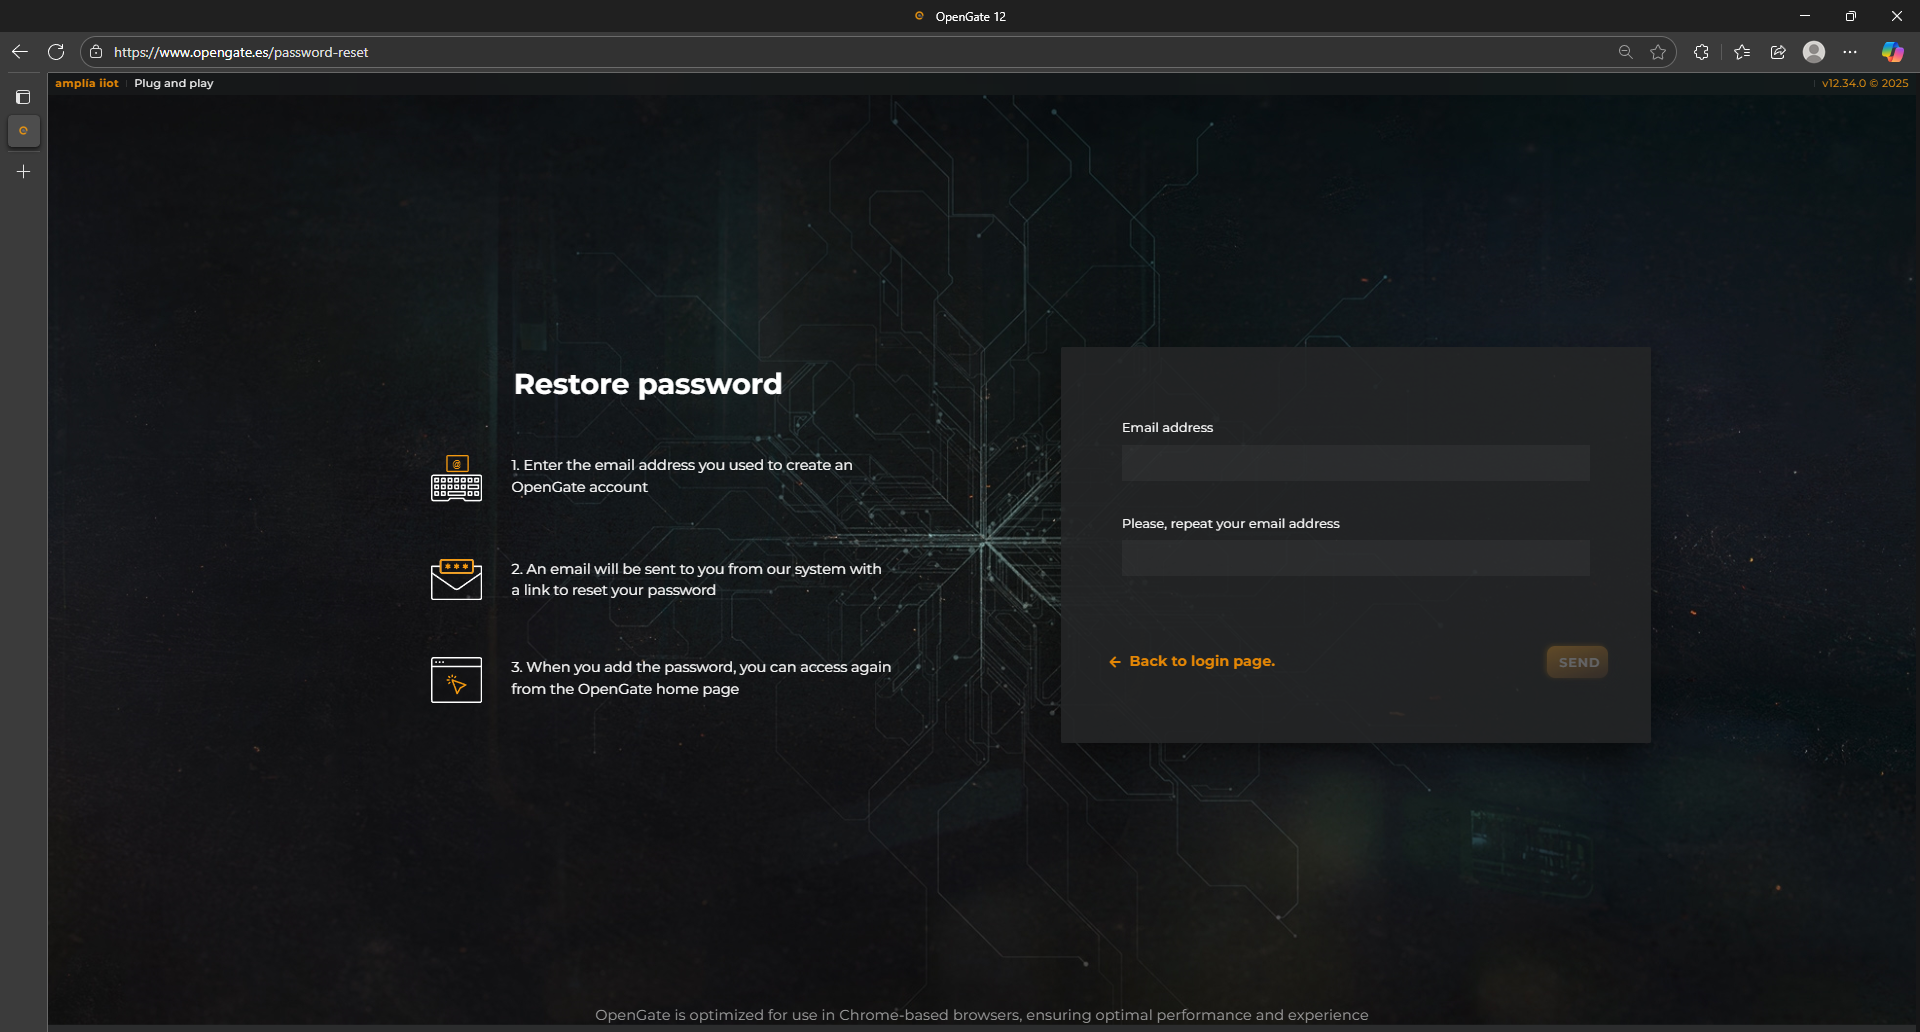
⚠️ Lost Password?
It is possible to regain access to an account when standard authentication fails, such as forgetting your password or losing access to a two-factor authentication app (TOTP). Just click on the link below the login form and then you can retrieve your password
🏰 OpenGate home page
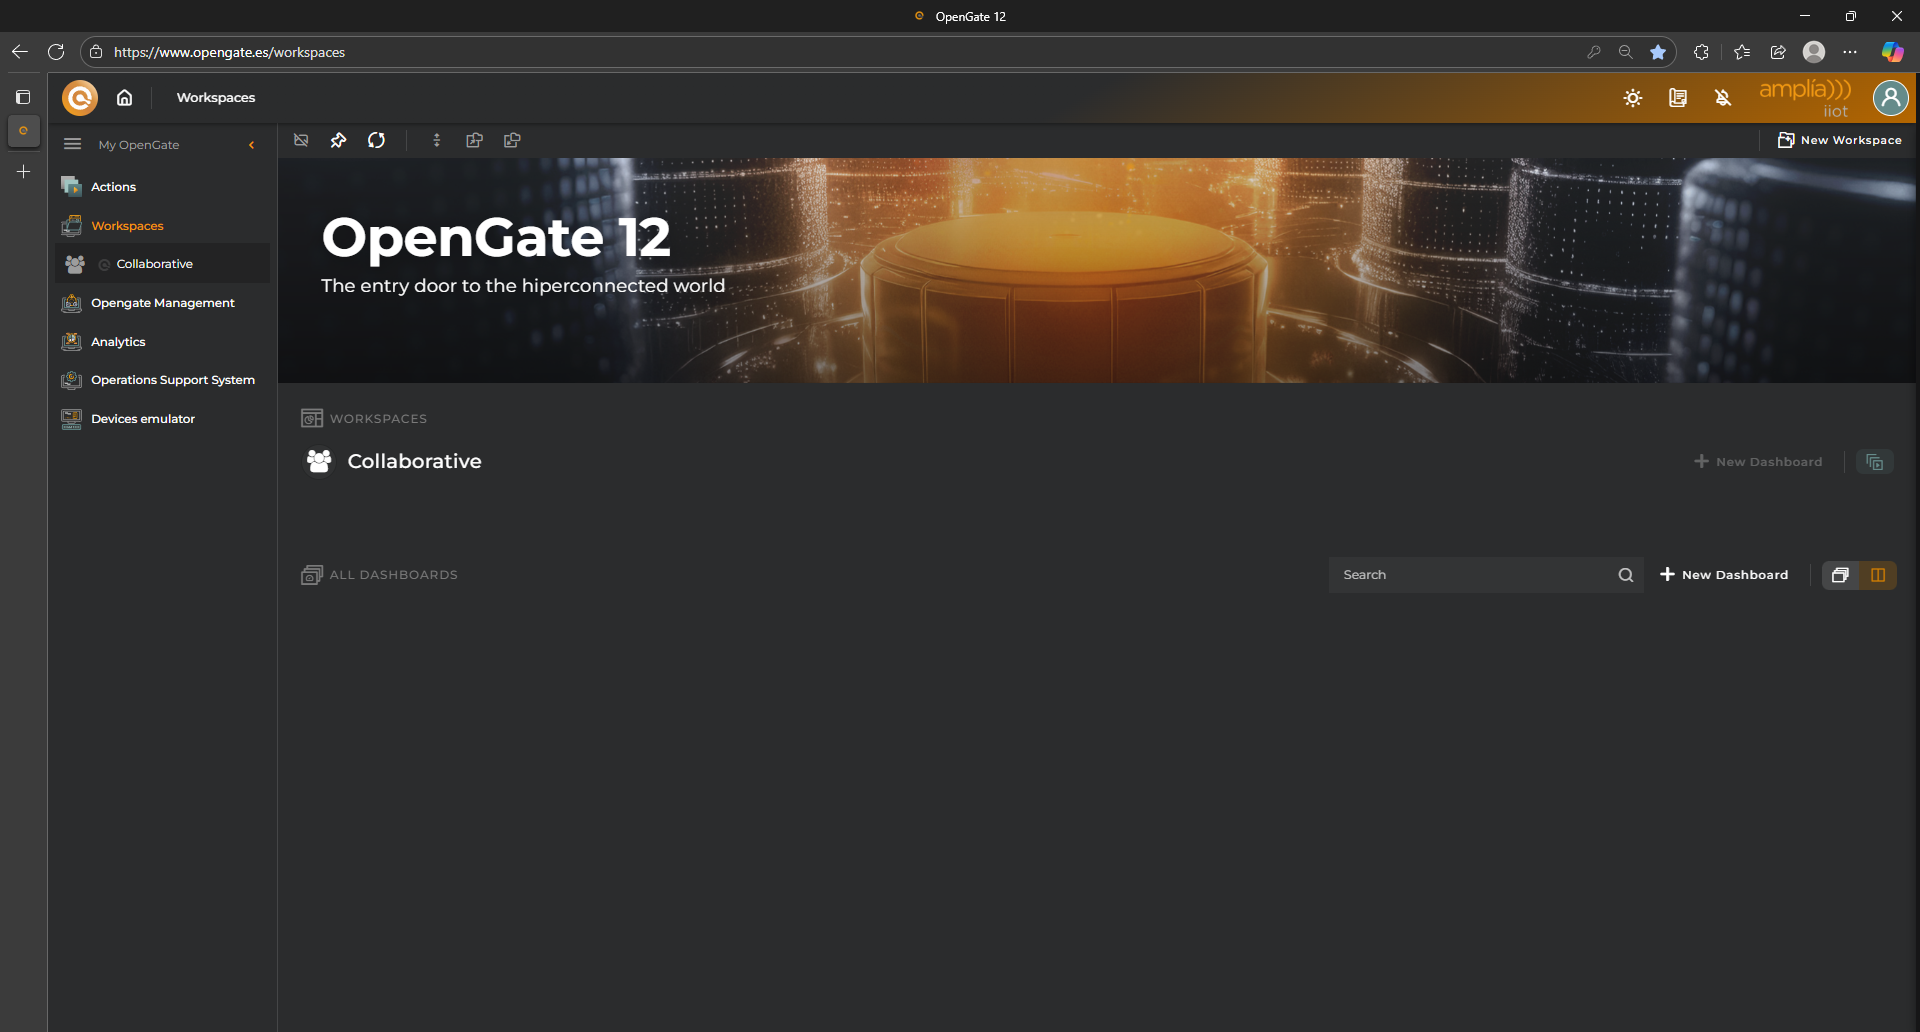
Once authenticated, users arrive at the Home page. This landing view presents the workspaces and dashboards that you have configured or the ones your administrator or some partner share with you.
The primary navigation menu is positioned on the left side of the screen. From here, users can enter dedicated sections such as Entities, DataStreams, Provisioning, Functions, Rules, Catalog, and Dashboards. Each section is structured to guide users through specific configuration workflows, offering both summary views and in-depth drilldowns.
The top bar of the console includes access to user settings, notifications, language preferences, and a global search tool. This enables quick access to specific entities, rules, or logs without needing to navigate the interface manually.
📚 OpenGate Sections
Once logged into the OpenGate IoT Platform, you can choose between some different tools among the following:
1. Workspaces and Dashboards
An intuitive, visual interface that centralizes OpenGate operations. Workspaces allow you to organize custom views tailored to their roles or operational needs, while Dashboards provide dynamic panels with charts, key metrics, and real-time KPIs. Perfect for quick monitoring and status analysis of devices and services.
The core administrative console of OpenGate. Through this web interface, you can manage all the functionalities of your OpenGate IoT Platform account like provisioning and managing entities and digital assets, creating users and configure different access roles, build connector functions, data models, rules, operations, and so on.
It’s the main hub for fine-grained platform customization and we will use it several times during this tutorials.
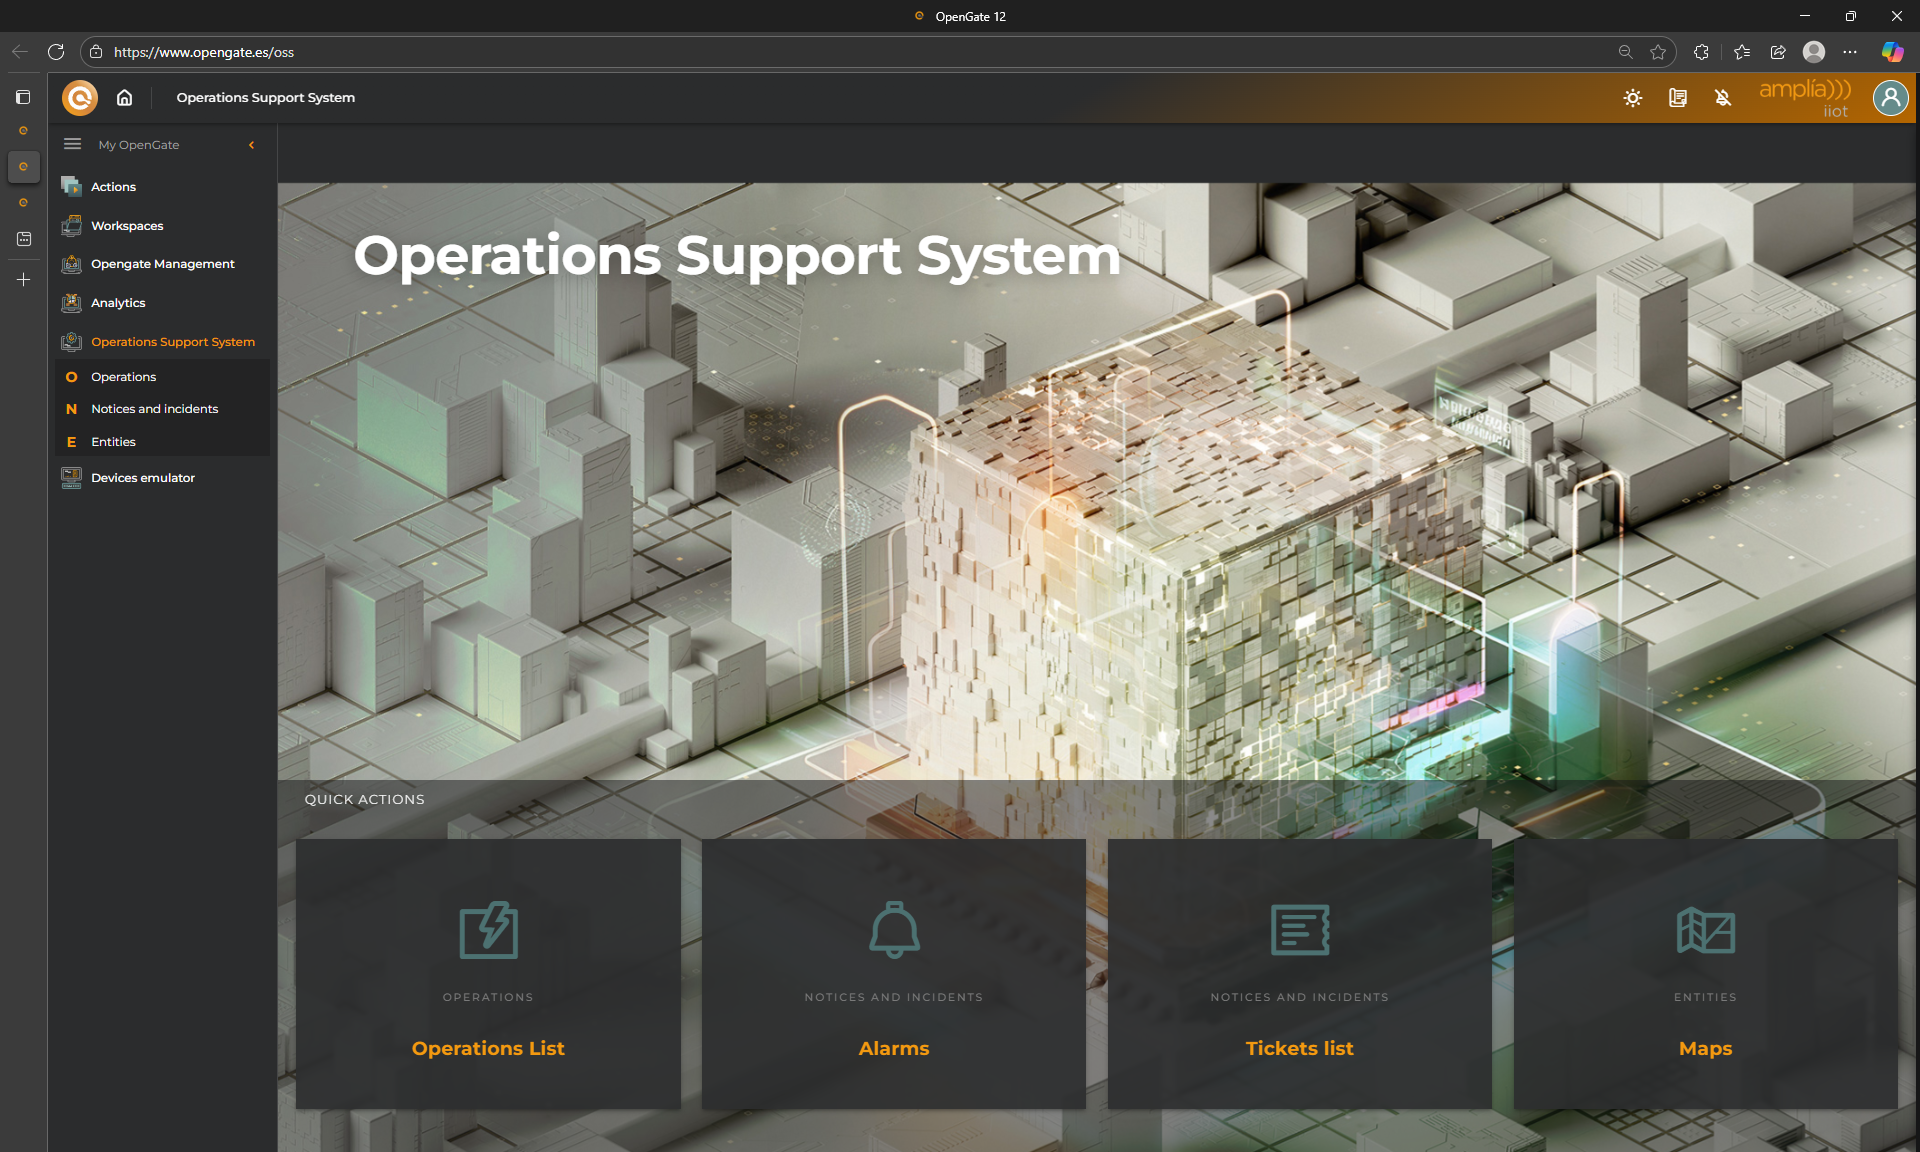
3. Operations Support System
You can configure your own dashboards in the Workspaces and Dashboards OpenGate area, but we think that this area facilitates the management of the OpenGate IoT Platform Operations, directly out of the box. It allows you to monitor all the scheduled operations, its executions and details, so it’s a powerful tool for large-scale, real-time operations control.
This tool also offers you the possibility to launch and configure new Operations from wizards that allow you to configure operations for one, tens or millions of devices based on filters.
4. OpenGate Device Emulator
A test environment designed for developers and integrators. It simulates complete device behavior without requiring physical hardware, making it ideal for validating configurations.
You can use the Device Emulator to collect specific data as the same way that the device does, testing through all the workflow of the OpenGate IoT Platform and so, ensure that connector functions, rules and operations perform as expected before deployment.
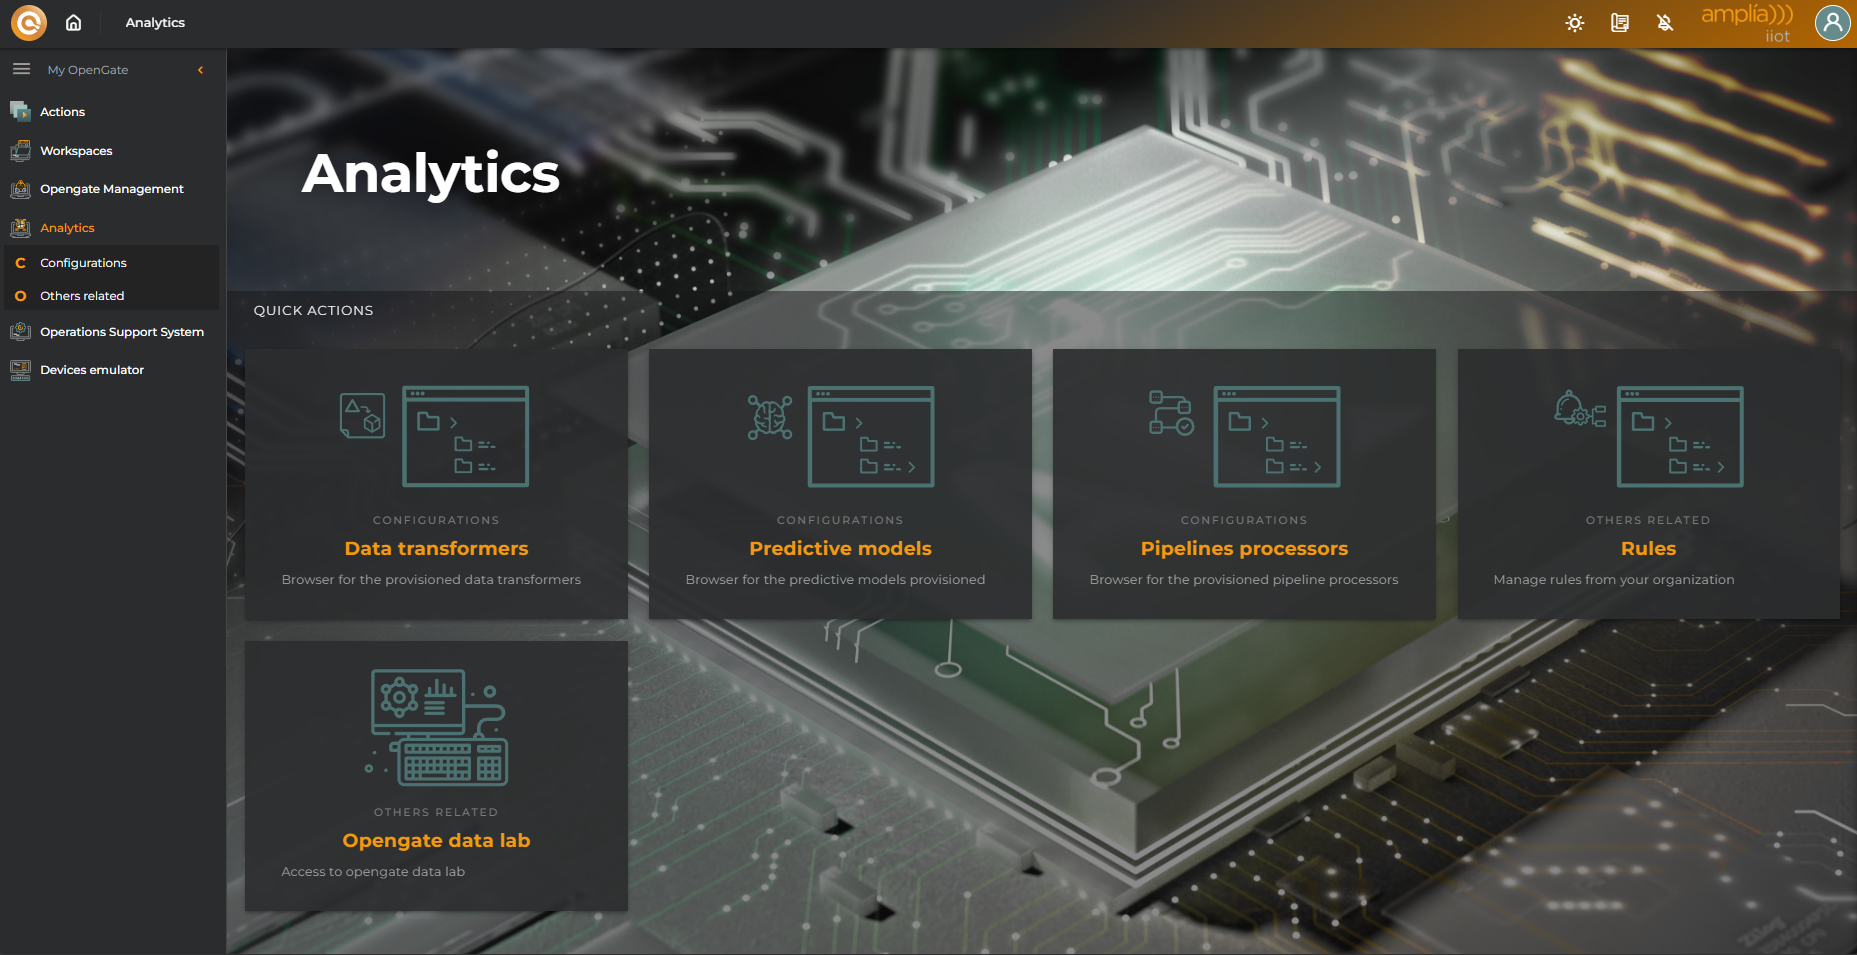
5. Analytics (OpenGate Data Lab)
The analytical layer of OpenGate IoT Platform. It offers the possibility to work with your datalake, time series and data sets, by using our OpenGate Data Lab. This tool gives you all the powers of Jupyter Notebooks and python to work with your data: create analytics tasks to find patterns, build KPIs, build automated custom reports or periodic custom calculations over your data.
In the near future, we will expand this tool by adding an AI module to work with, directly from OpenGate.
2. Users and Roles
OpenGate Users and roles
OpenGate offers a flexible system for user and role management. The platform primarily distinguishes between administrators and regular users.
🛠️ Administrators: Users with the highest level of access and permissions. They can manage key account settings, such as organization structure, user provisioning, datamodel and datastream configuration, and the creation of time series and datasets. Administrators are typically responsible for modeling the collected data, defining a structured environment through workspaces and dashboards, and sharing them with other users.
👥 Platform Users: Users with more limited roles, focusing on solution operations. They interact with entities and digital assets, oversee values, manage rules, alarms, tickets, and more. Administrators may create specific dashboards and workspaces for these users, or they can build their own based on their access level.
Additionally, all roles are fully customizable, allowing fine-grained control over access and actions across the platform. While the deeper logic and configuration of roles is explored in the complete OpenGate API documentation, this guide focuses on user creation and role assignment via the built-in wizard.
👤 Creating a new user
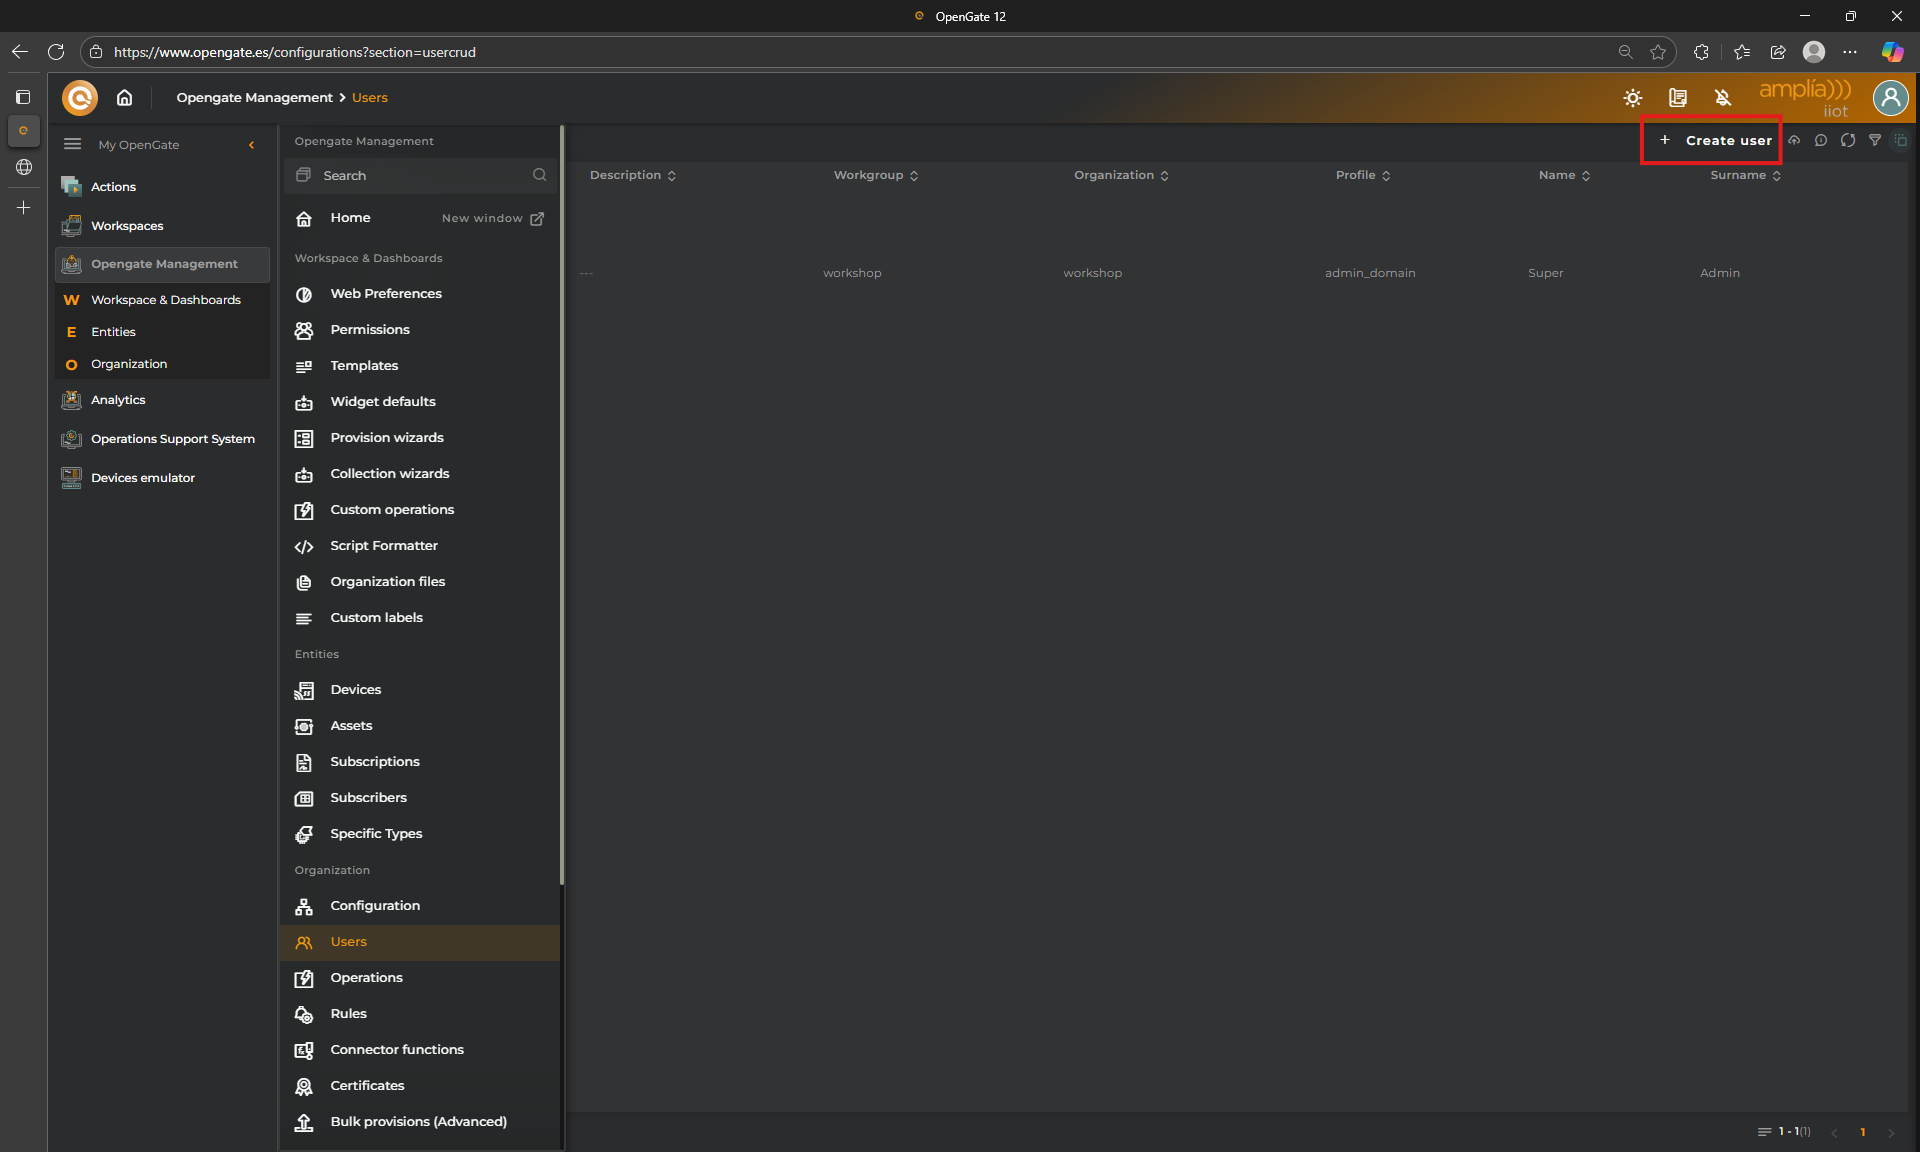
Administrators can onboard users using a step-by-step wizard located in the “Users” section of the “Opengate Management” web console.
Click on “+ Create user” within the users table to begin.
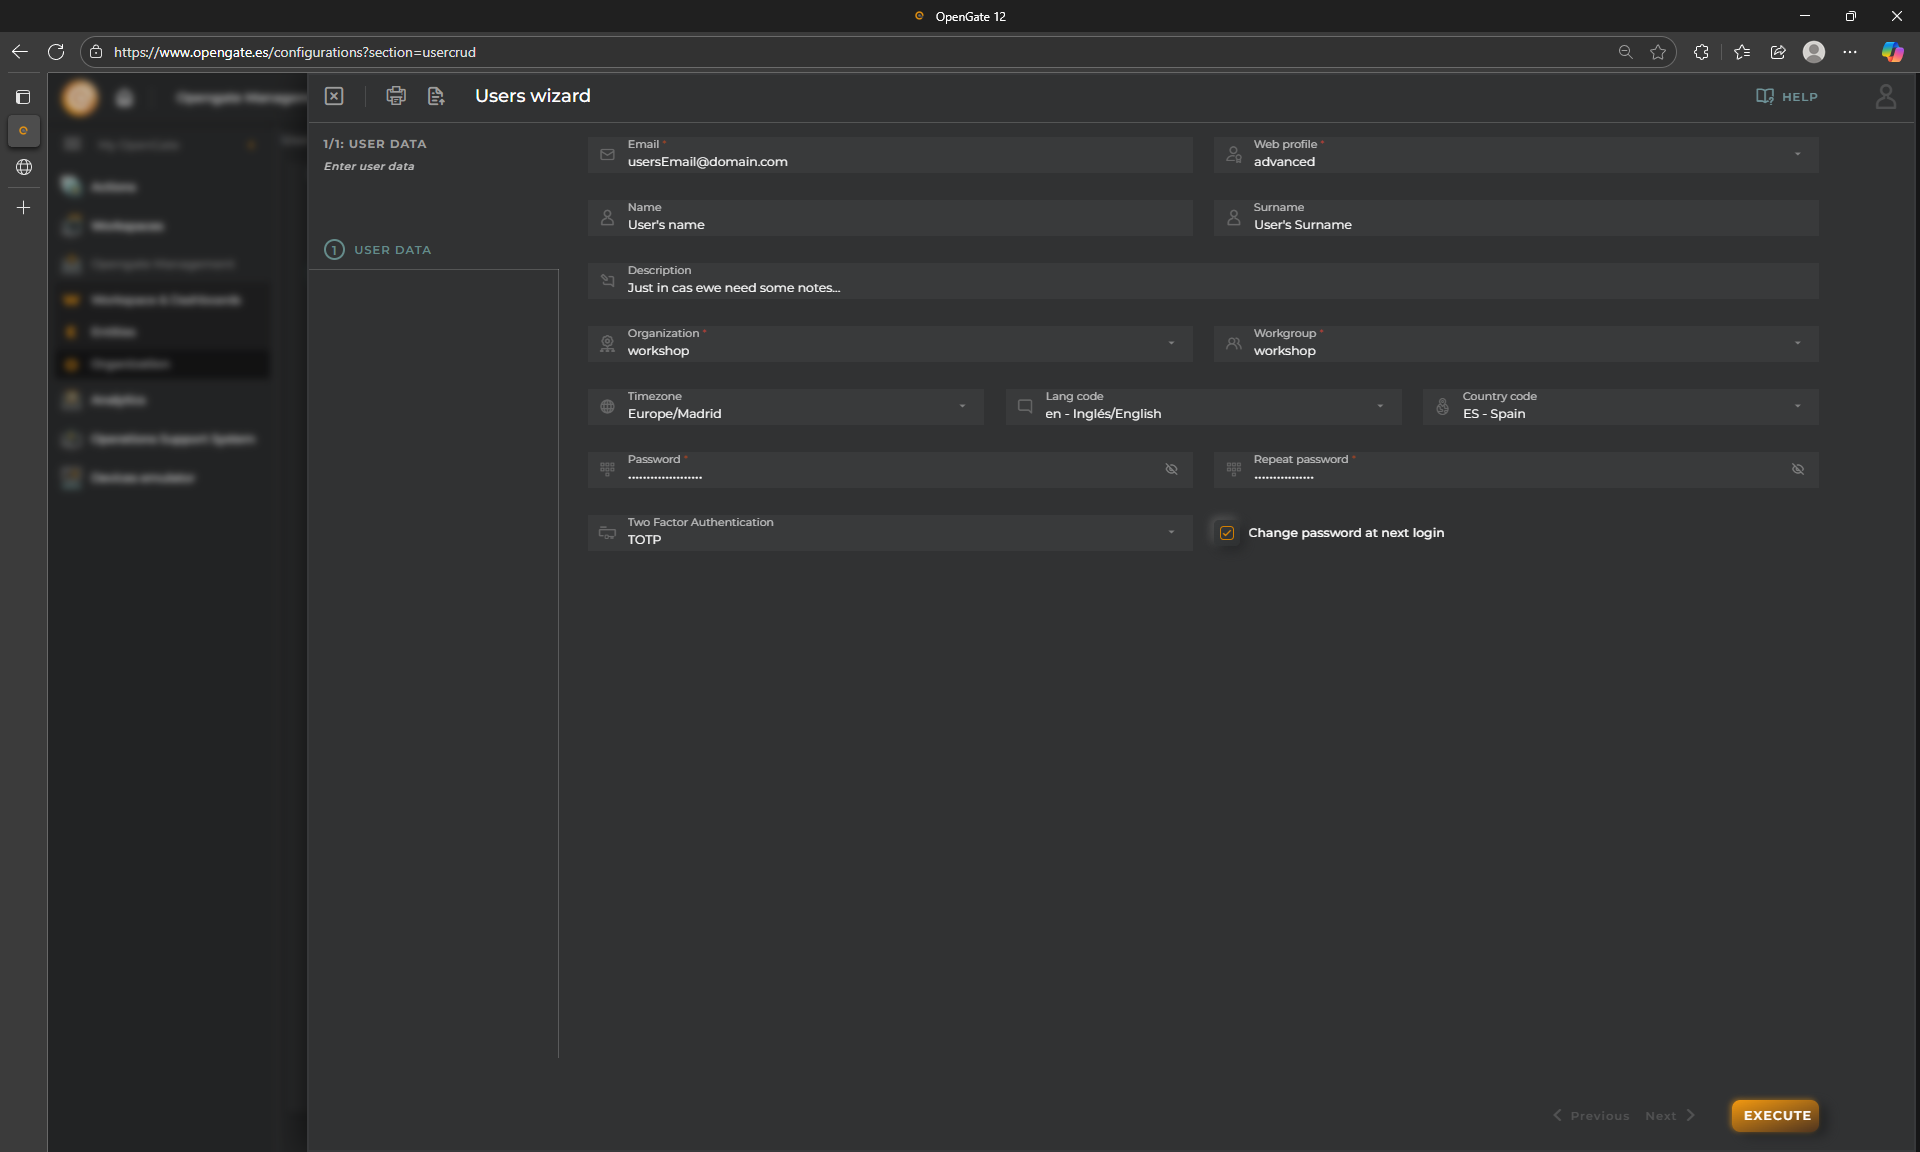
Once selected, the wizard guides you through the essential onboarding fields:
User’s full name and email address: The email address will serve as the username and is required for password recovery.
Organization: Indicates where the user belongs. This could be a suborganization if multiple levels exist within your OpenGate account.
Role selection: Choose from predefined or custom roles.
Password setup: You can define an initial password, enforce a password change on first login, and configure TOTP (Time-Based One-Time Password).
⚠️ IMPORTANT: Passwords must contain at least 12 characters, including uppercase letters, lowercase letters, numbers, and symbols.
After completing the form, the user is registered immediately and can log in with the provided credentials. Permissions are granted based on the assigned role, determining their access scope and allowed actions.
🎭 Creating a custom role
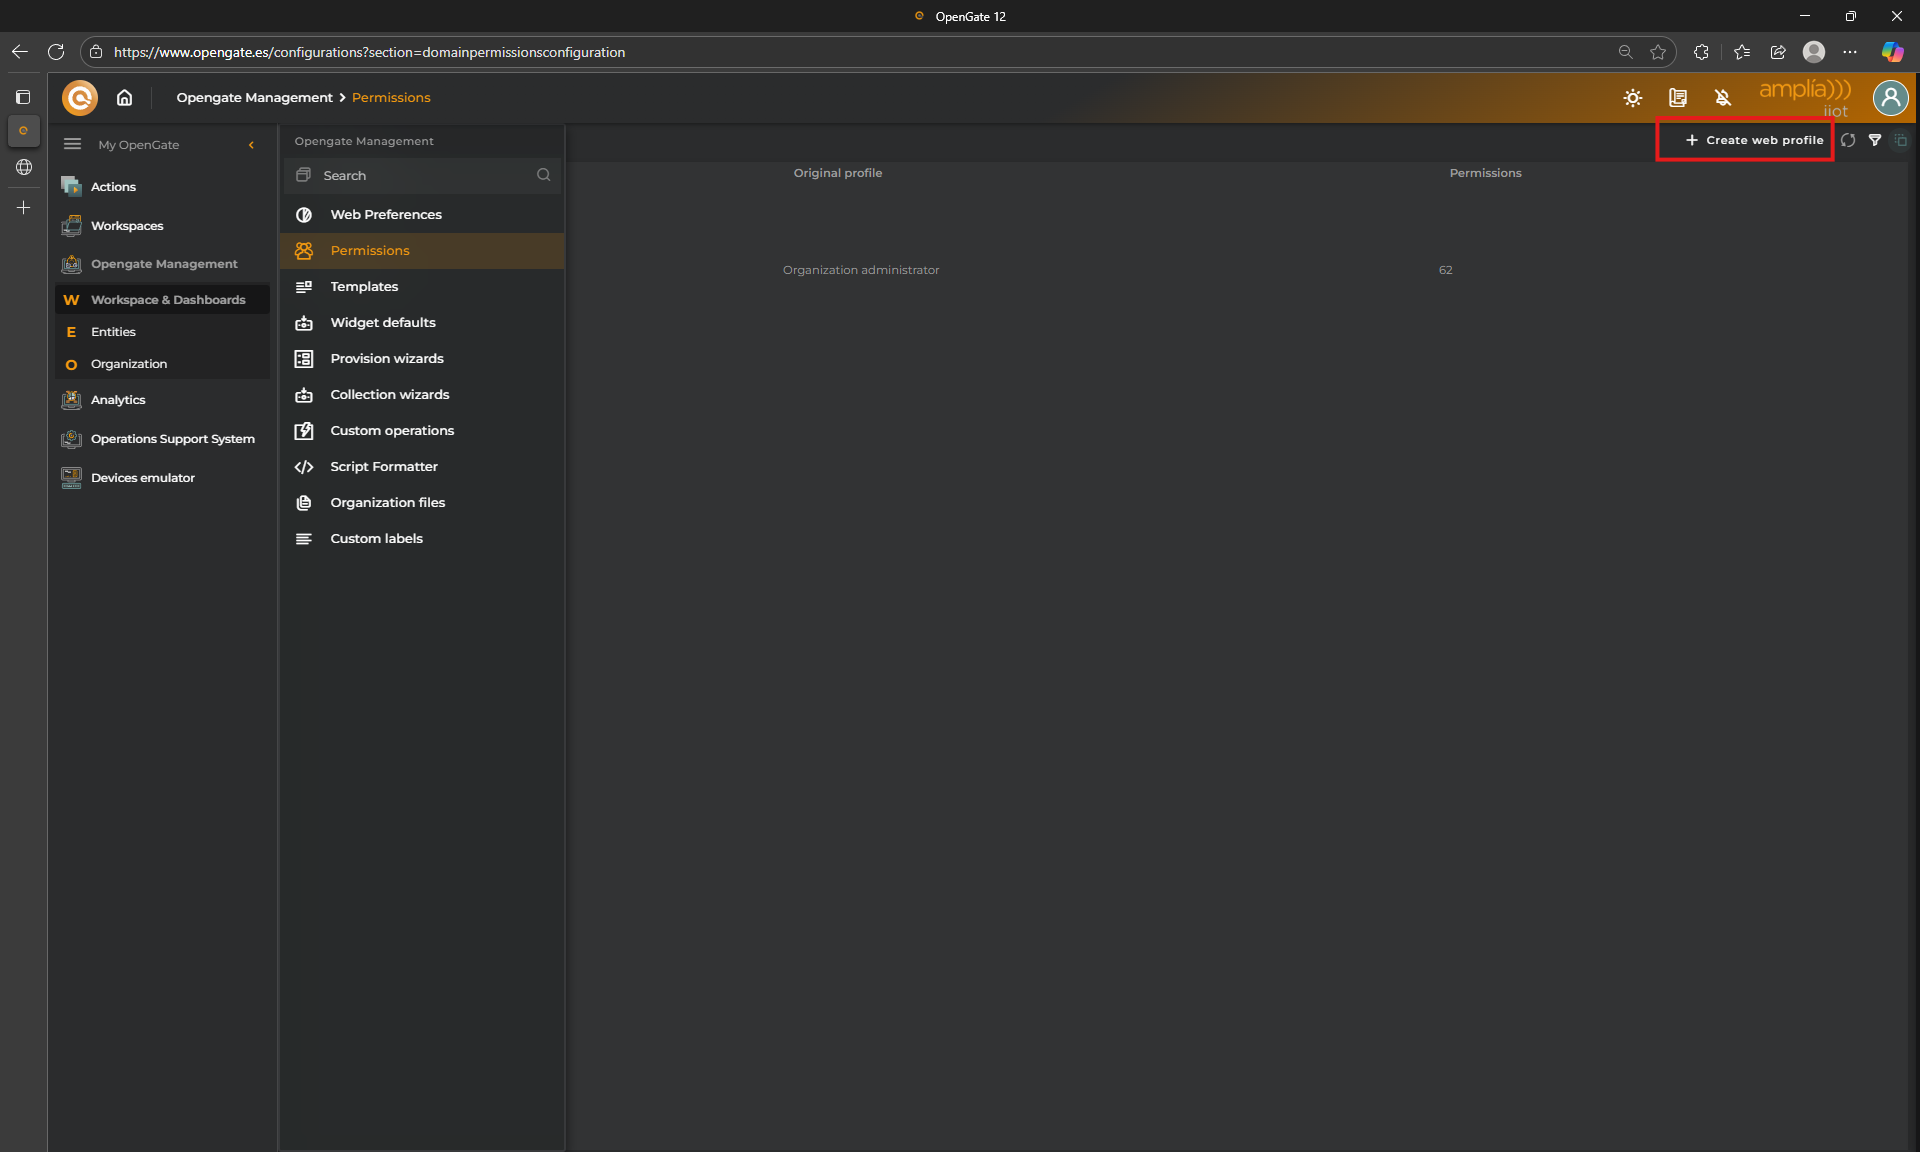
Let’s take a quick view of this functionality. It is possible to create custom roles if you login as an Administrator user and go to “Opengate Management > Permissions”, then click on “+ Create web profile”.
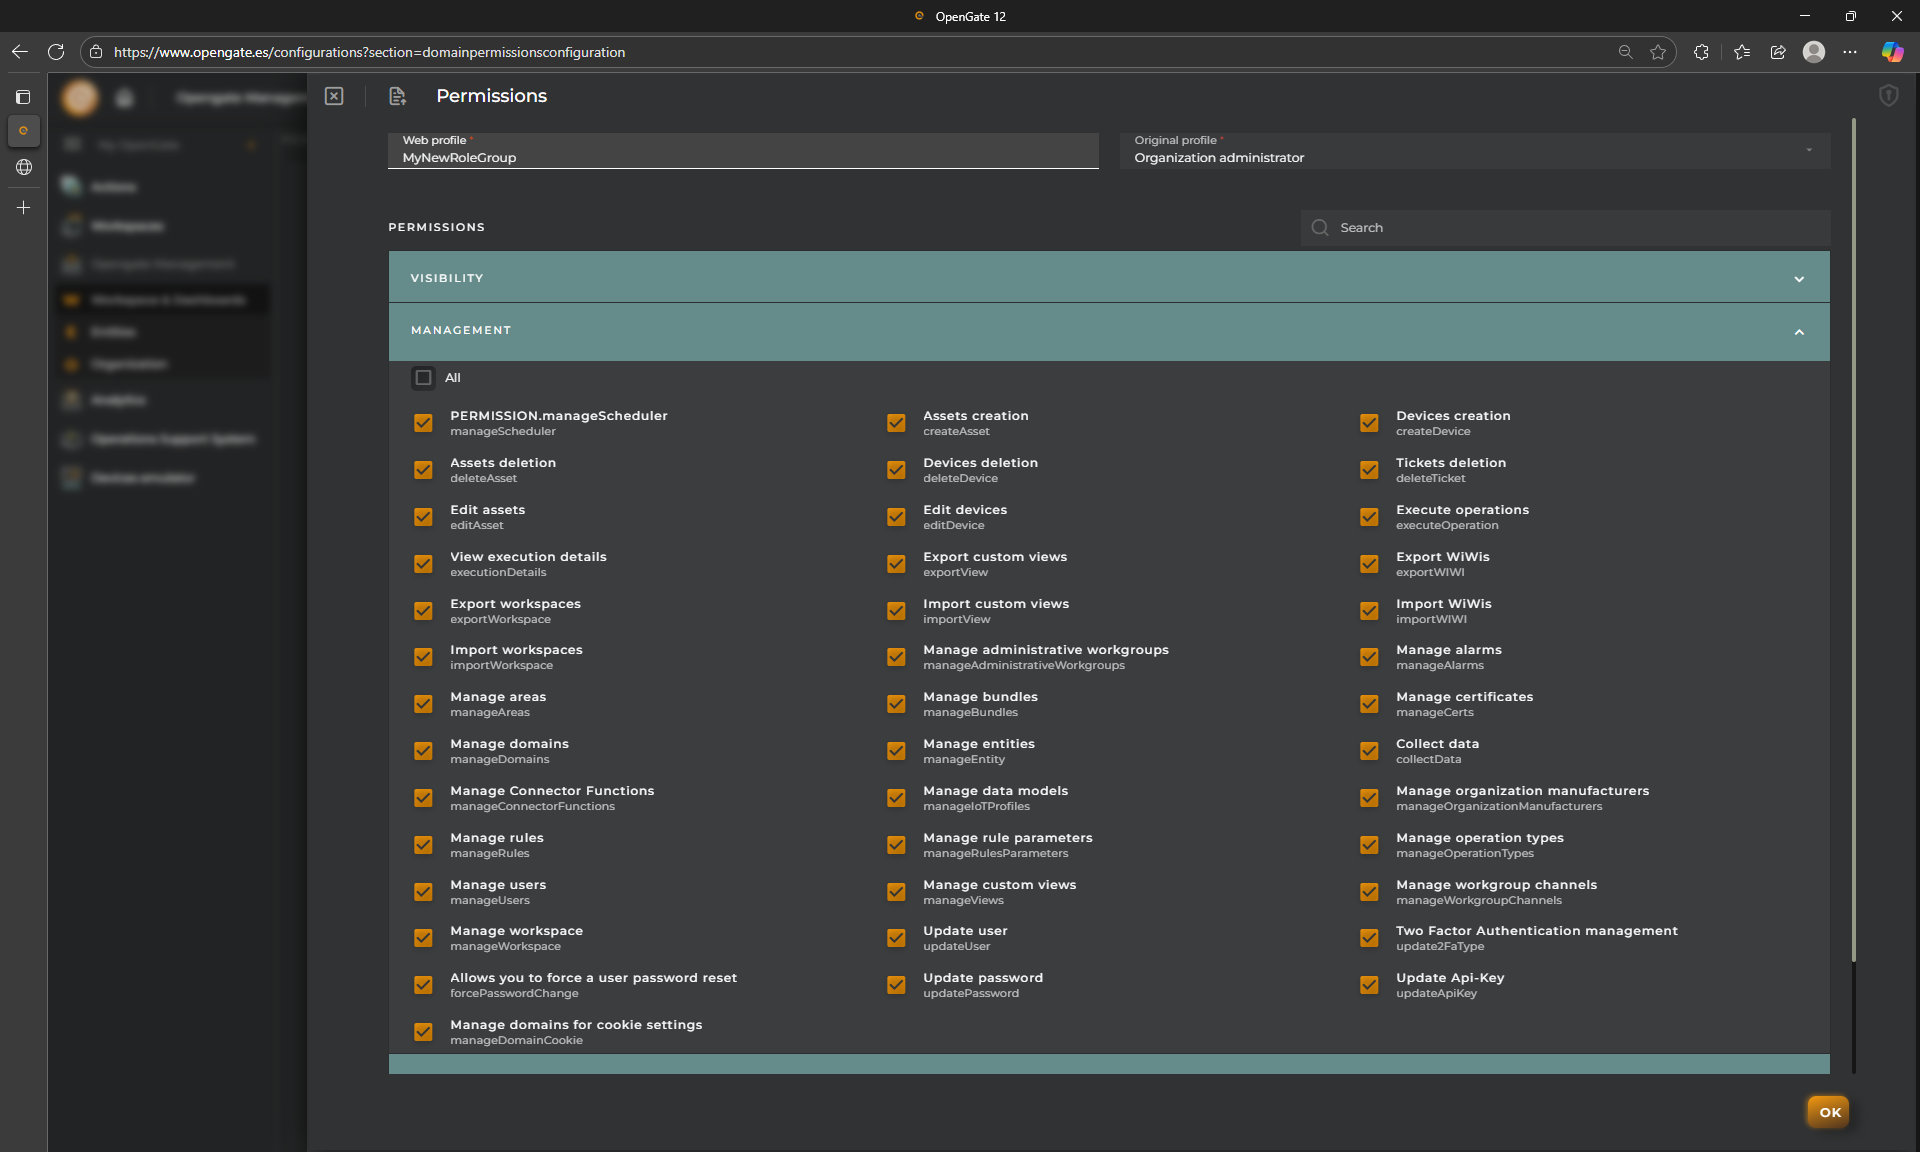
This opens a wizard to help you define a new role with tailored permissions:
📌 IMPORTANT: Custom roles apply only to the OpenGate GUI. If your users need API access, remember that only the predefined OpenGate roles are supported at the API level.
3. Data Modeling
📦 Data Modelling in OpenGate
OpenGate provides you powerful tools to create and manage data models that define how information flows through the platform. This includes setting up entities, digital assets, and the structure used to monitor, analyze, and act upon collected data.
A well-defined data model allows you to:
Represent real-world objects (devices, vehicles, installations, etc.) as entities or digital assets
Define its properties, attributes or collected data as datastreams to capture metrics, behaviors, and status information
Enable visualizations creating dashboards and templates for your entities
Create rules that respond to data values or changes over time
Manage the entities creating operations
Data models, are organized into groups or Categories and, each category contains one or more datastreams, that are the representation of each entity data or property. The platform enables administrators to build these structures manually using the OpenGate web interface (or programmatically via the API).
For a hands-on guide to building your data model and so, your data structure, let’s continue with the Datamodel configuration.
🏗️ Create your first Datamodel
We are going to create our first Datamodel in our OpenGate IoT Platform account (We assume that you have an OpenGate user with “admin” role).
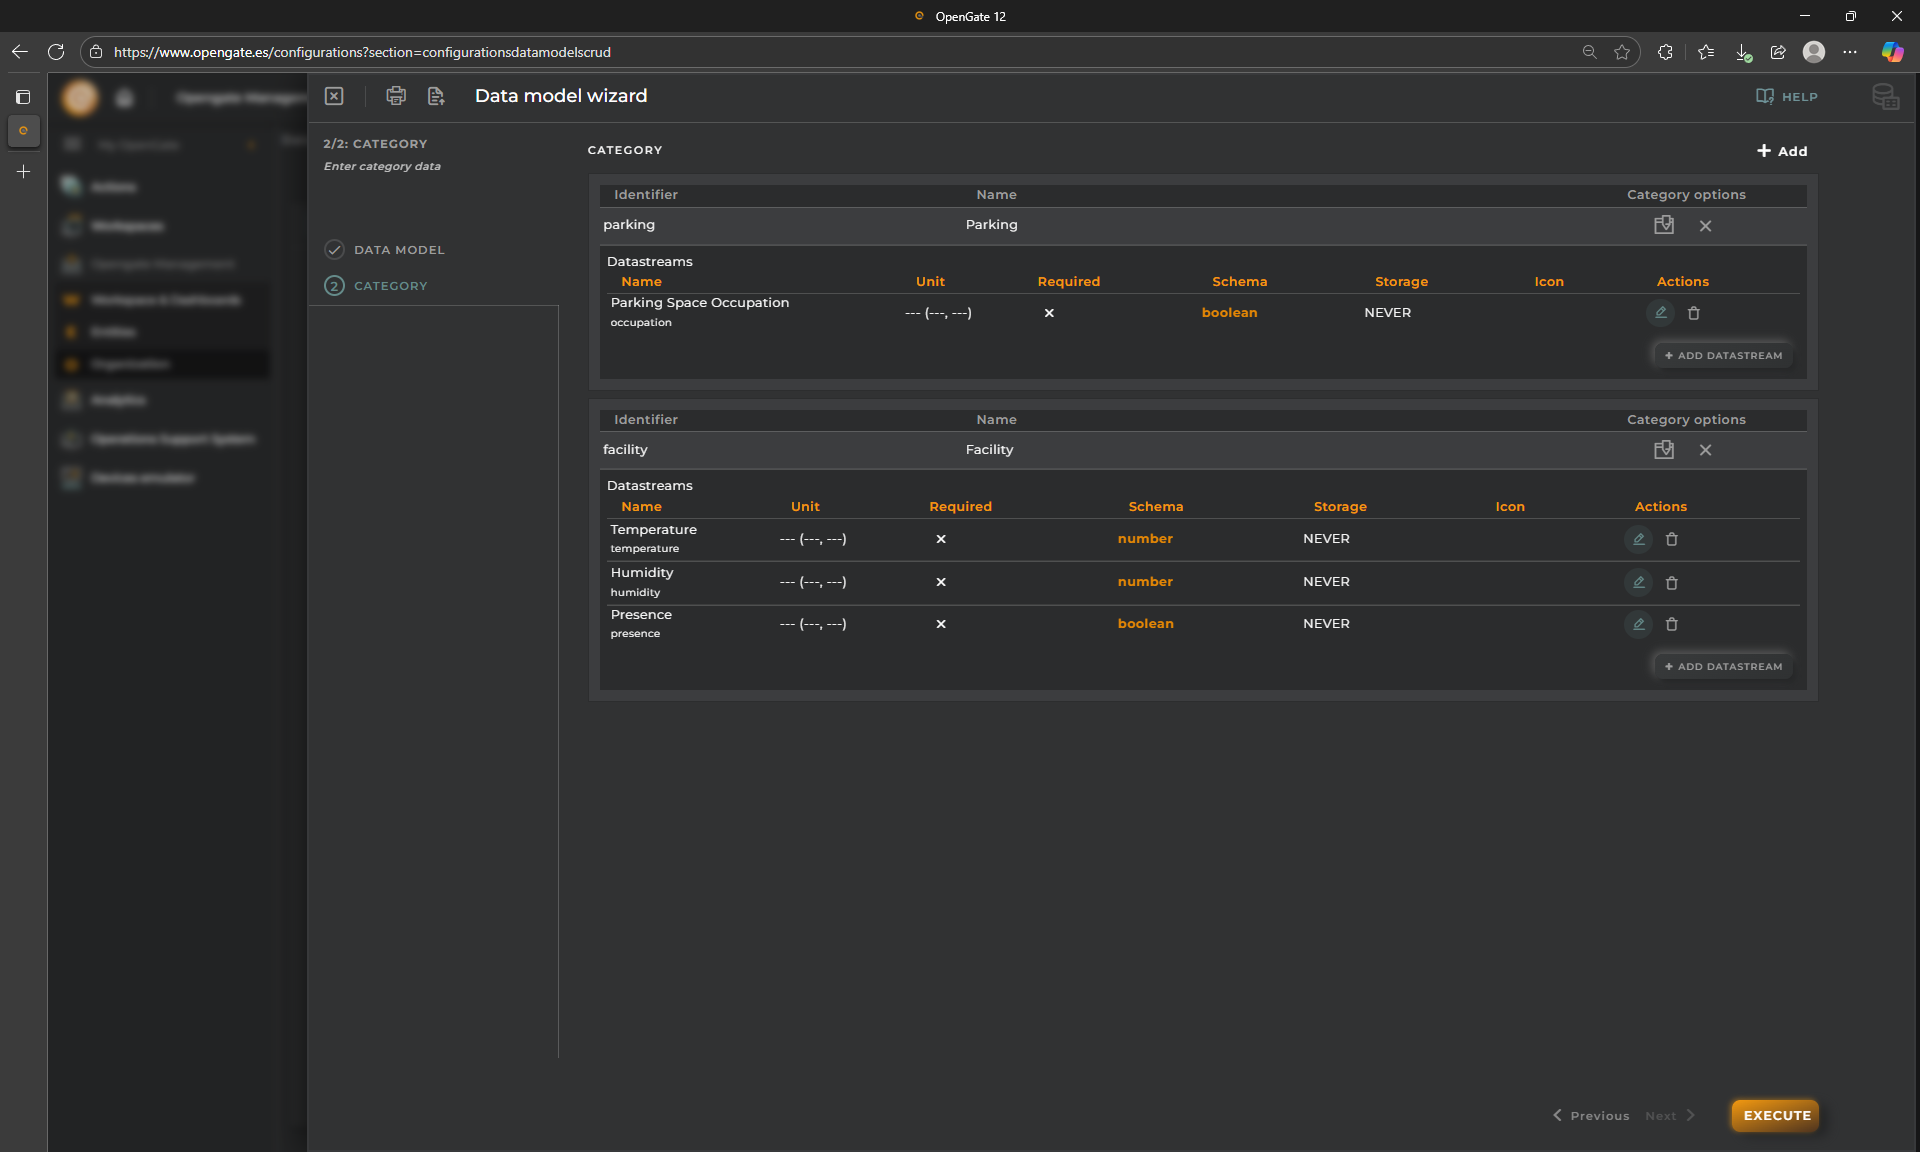
Following our story regarding the warehouse facility, we are going to create this structure where the intention is to represent parking slots and its status (the parking slot occupation) and facility rooms and its status (temperature, humidity and presence):
Data Model
ID: warehouse
Name: Warehouse
Description: Warehouse datamodel for parking and facilities
Category 1
ID: parking
Name: ParkingData Stream 1
Data Stream ID: occupation
Data Stream Name: Parking Space Occupation
Data Stream Description: Parking space occupation detected
JSON schema: boolean
Category 2
ID: facility
Name: Facility
Data Stream 1
Data Stream ID: temperature
Data Stream Name: Temperature
Data Stream Description: Ambient temperature registered
JSON schema: number
Data Stream 2
Data Stream ID: humidity
Data Stream Name: Humidity
Data Stream Description: Humidity registered
JSON schema: number
Data Stream 3
Data Stream ID: presence
Data Stream Name: Presence
Data Stream Description: Presence detected
JSON schema: boolean
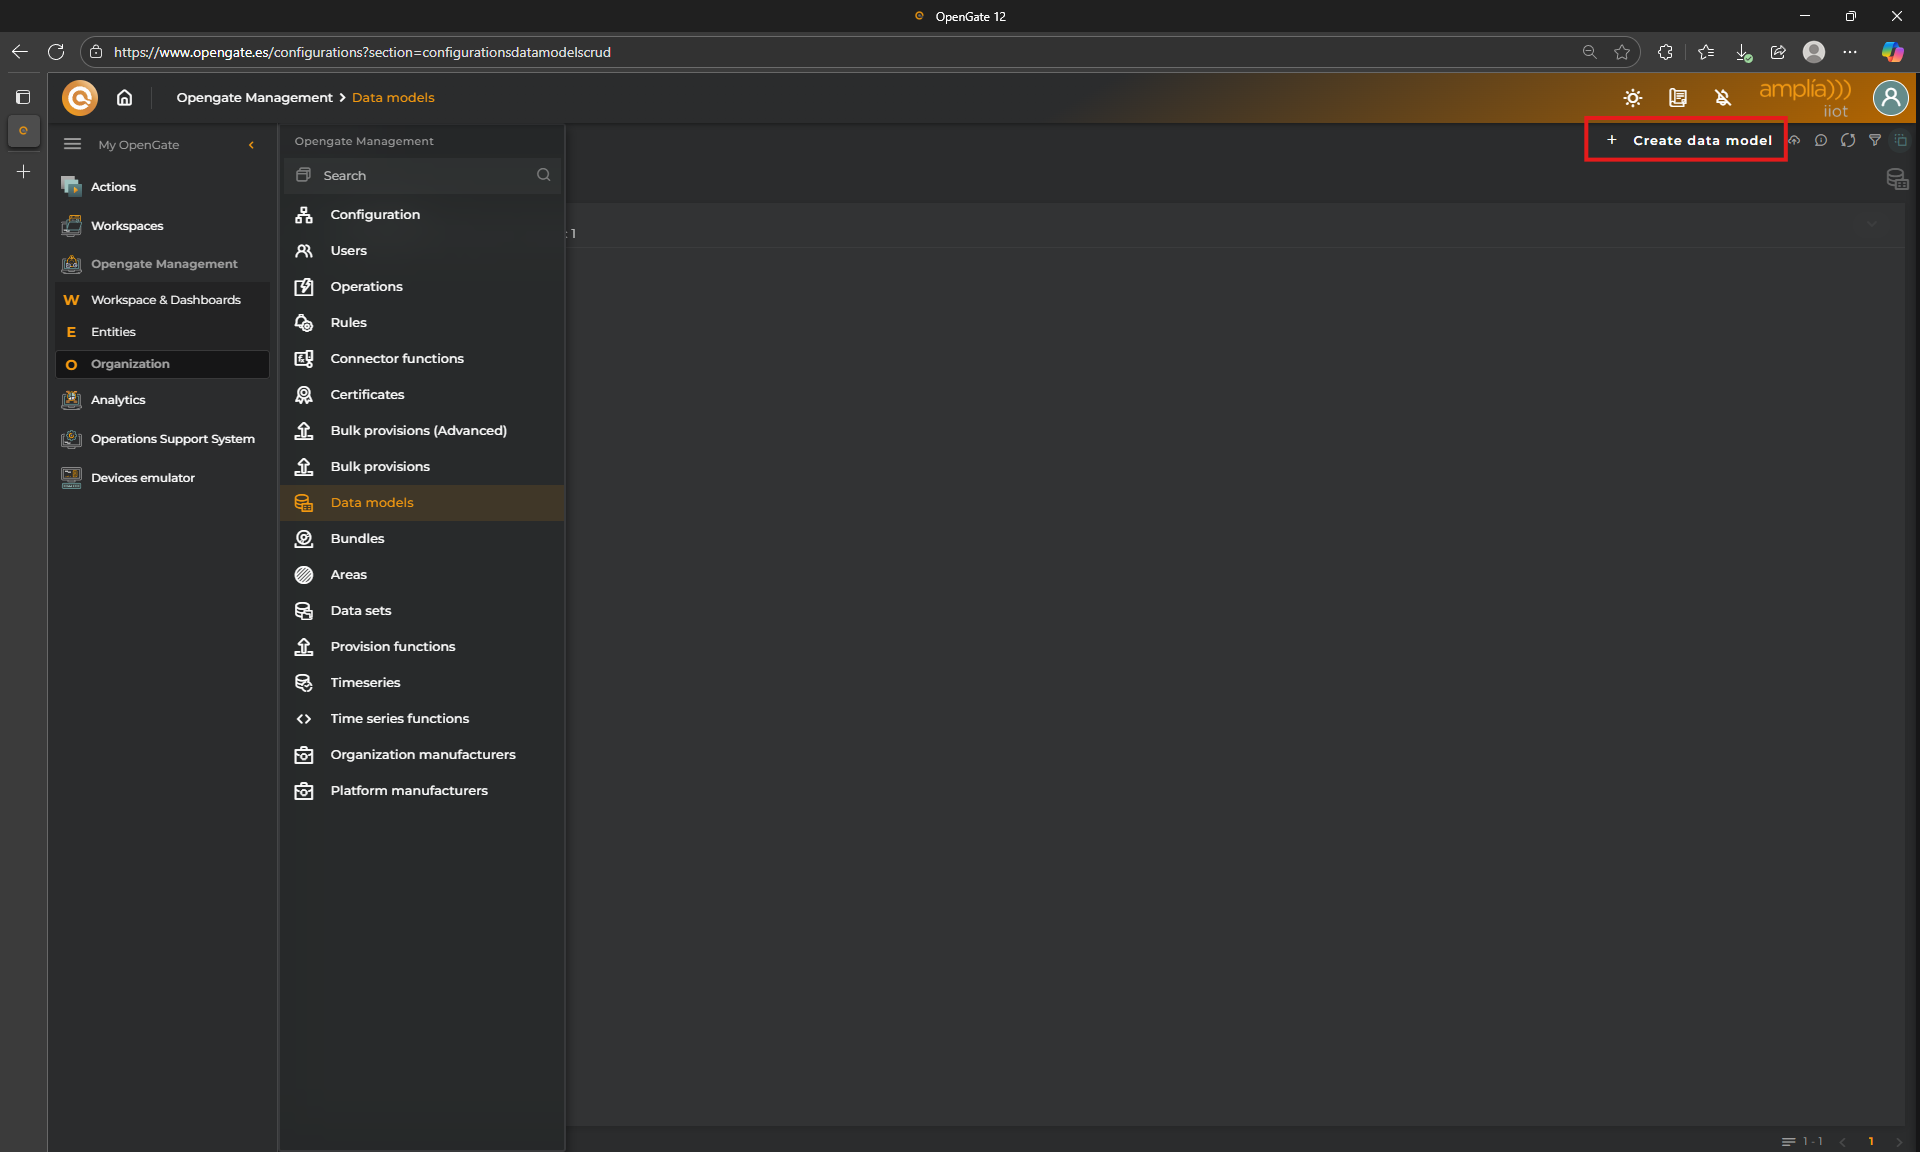
1. Open the Data model wizard
To do that, go to “OpenGate Management > Data Models” and click on “+ Create Datamodel”. This opens the wizard to create your new datamodel.
2. Create the new Data Model
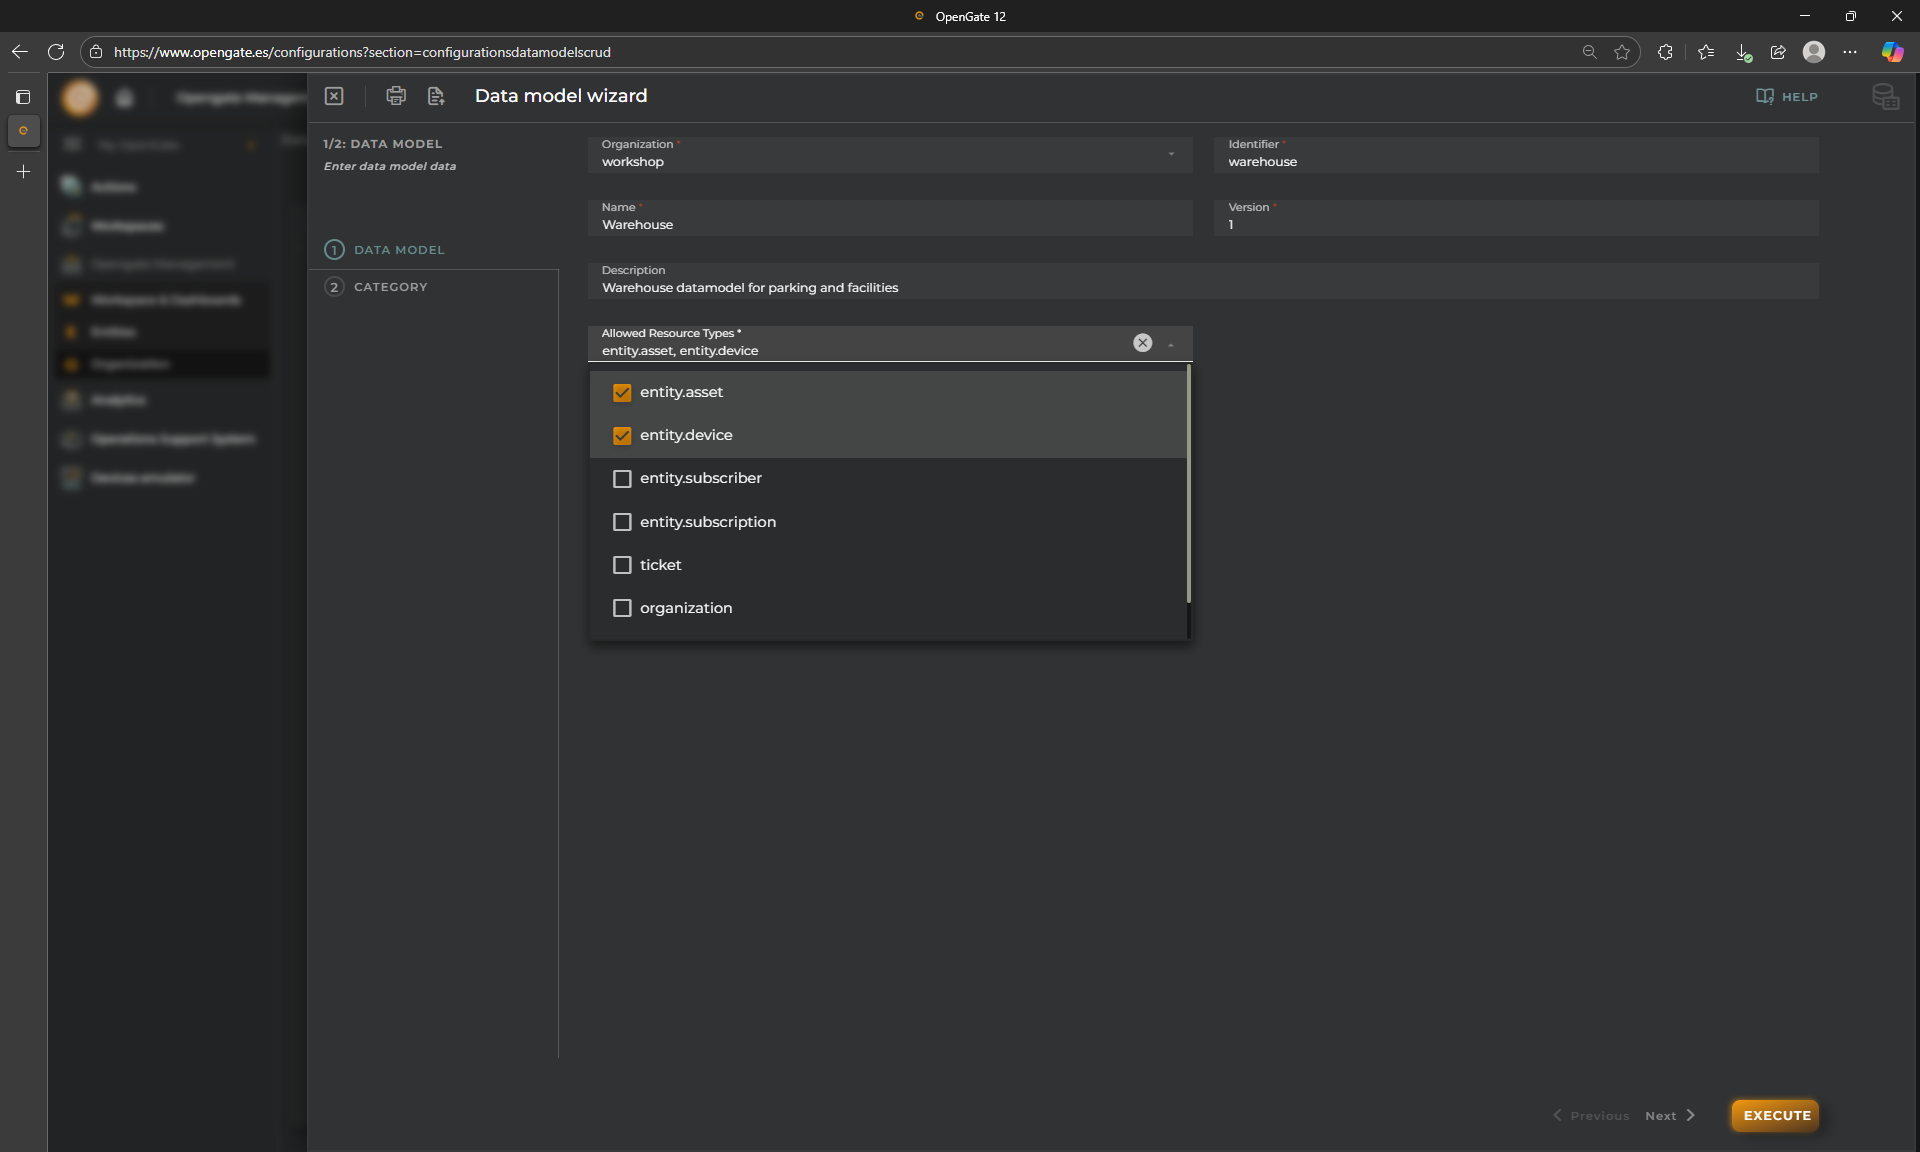
It is possible to import a JSON file to fill the form (this will be provided bellow), or to follow the wizard to fill the data model information. Because is your first datamodel, we recommend you to fill it manually to fully understand each step, so let’s create the data model “warehouse”:
Allowed Resource Types: This field indicates to what type of entities this datamodel applies. For this demo, we will choose device and asset (We detailed the different entity types in the next section: 4-Entity Provisioning).
For this tutorial, we will create later the assets to represent parking slots and facility rooms and some devices for the different sensors that each asset has.
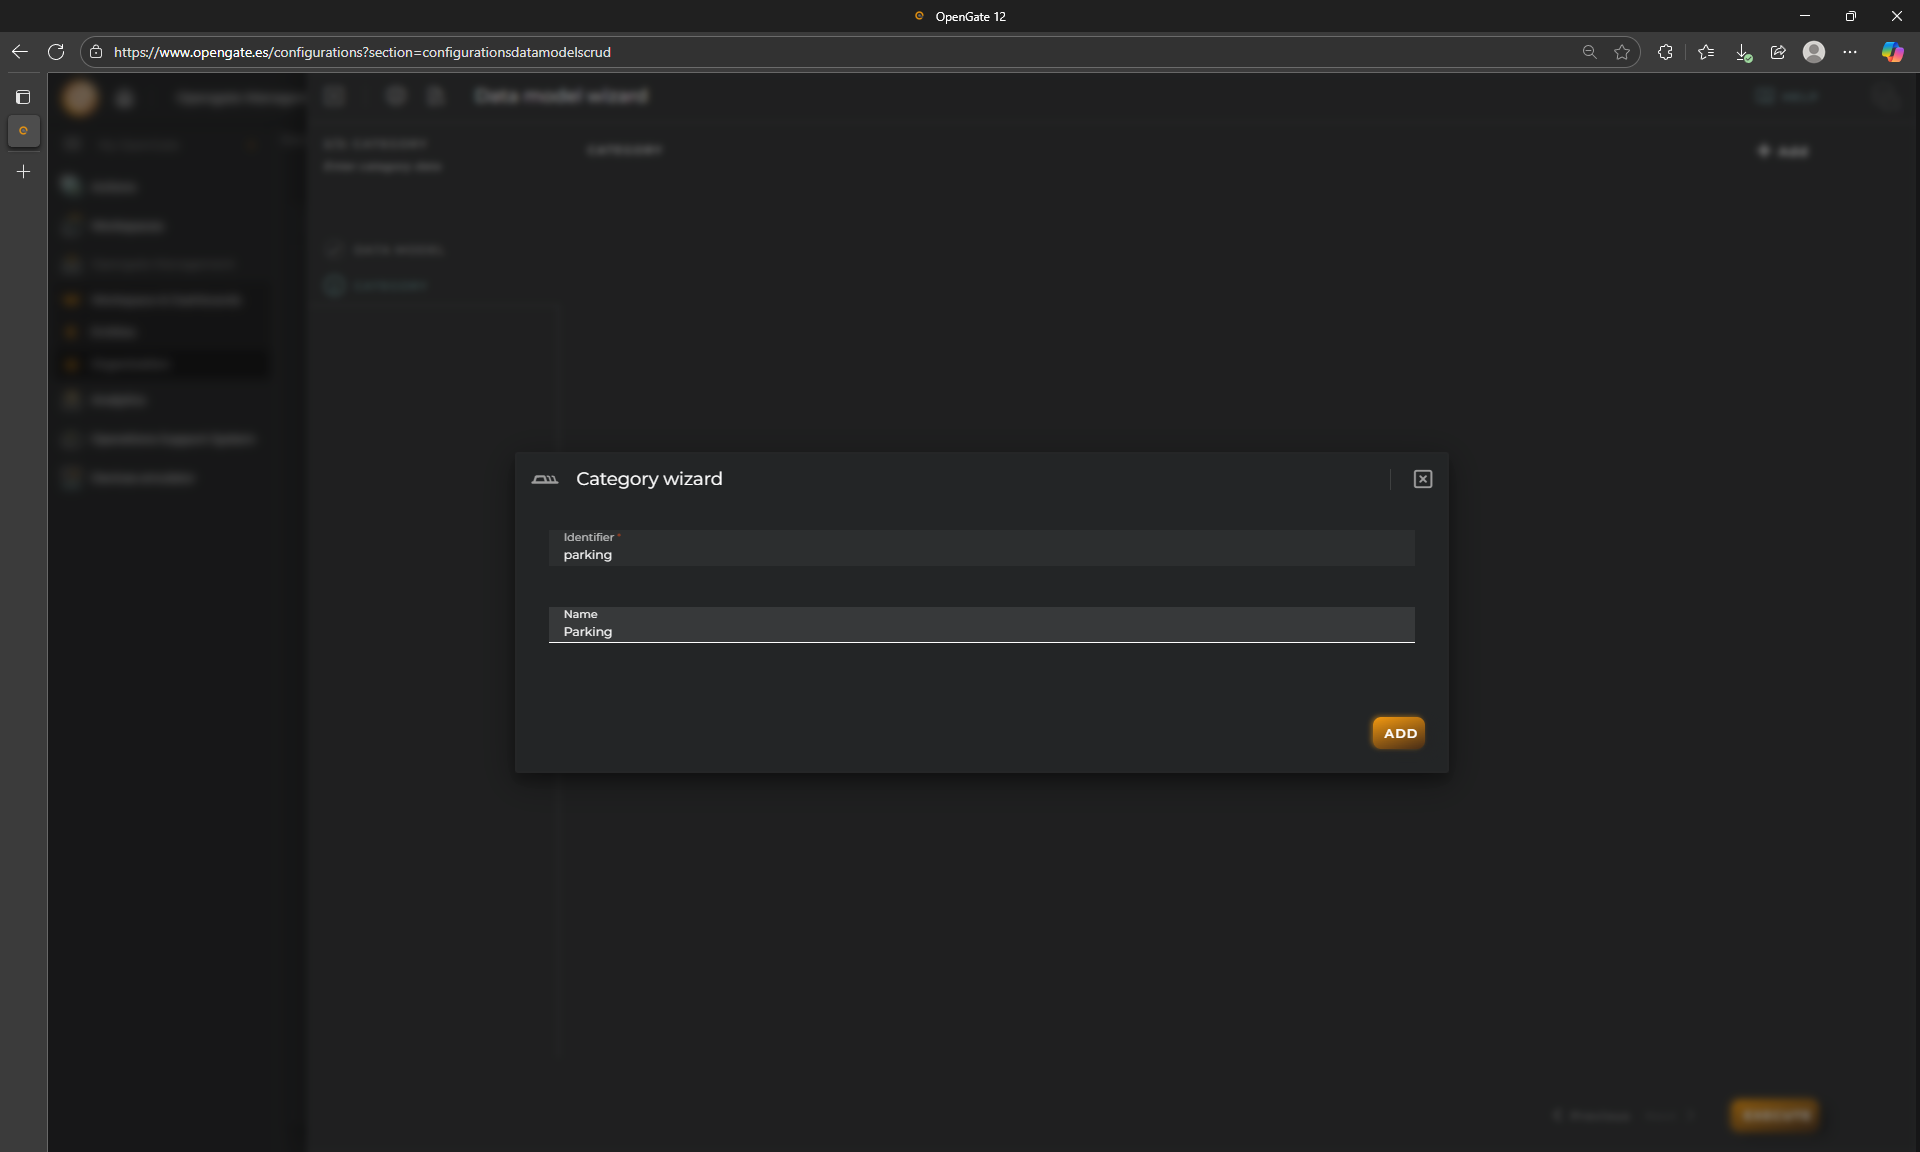
3. Create the first category
So, next step, we are going to create the category “parking”:
4. Create the first data stream
And then, create the datastreams from “+ ADD DATASTREAMS” button
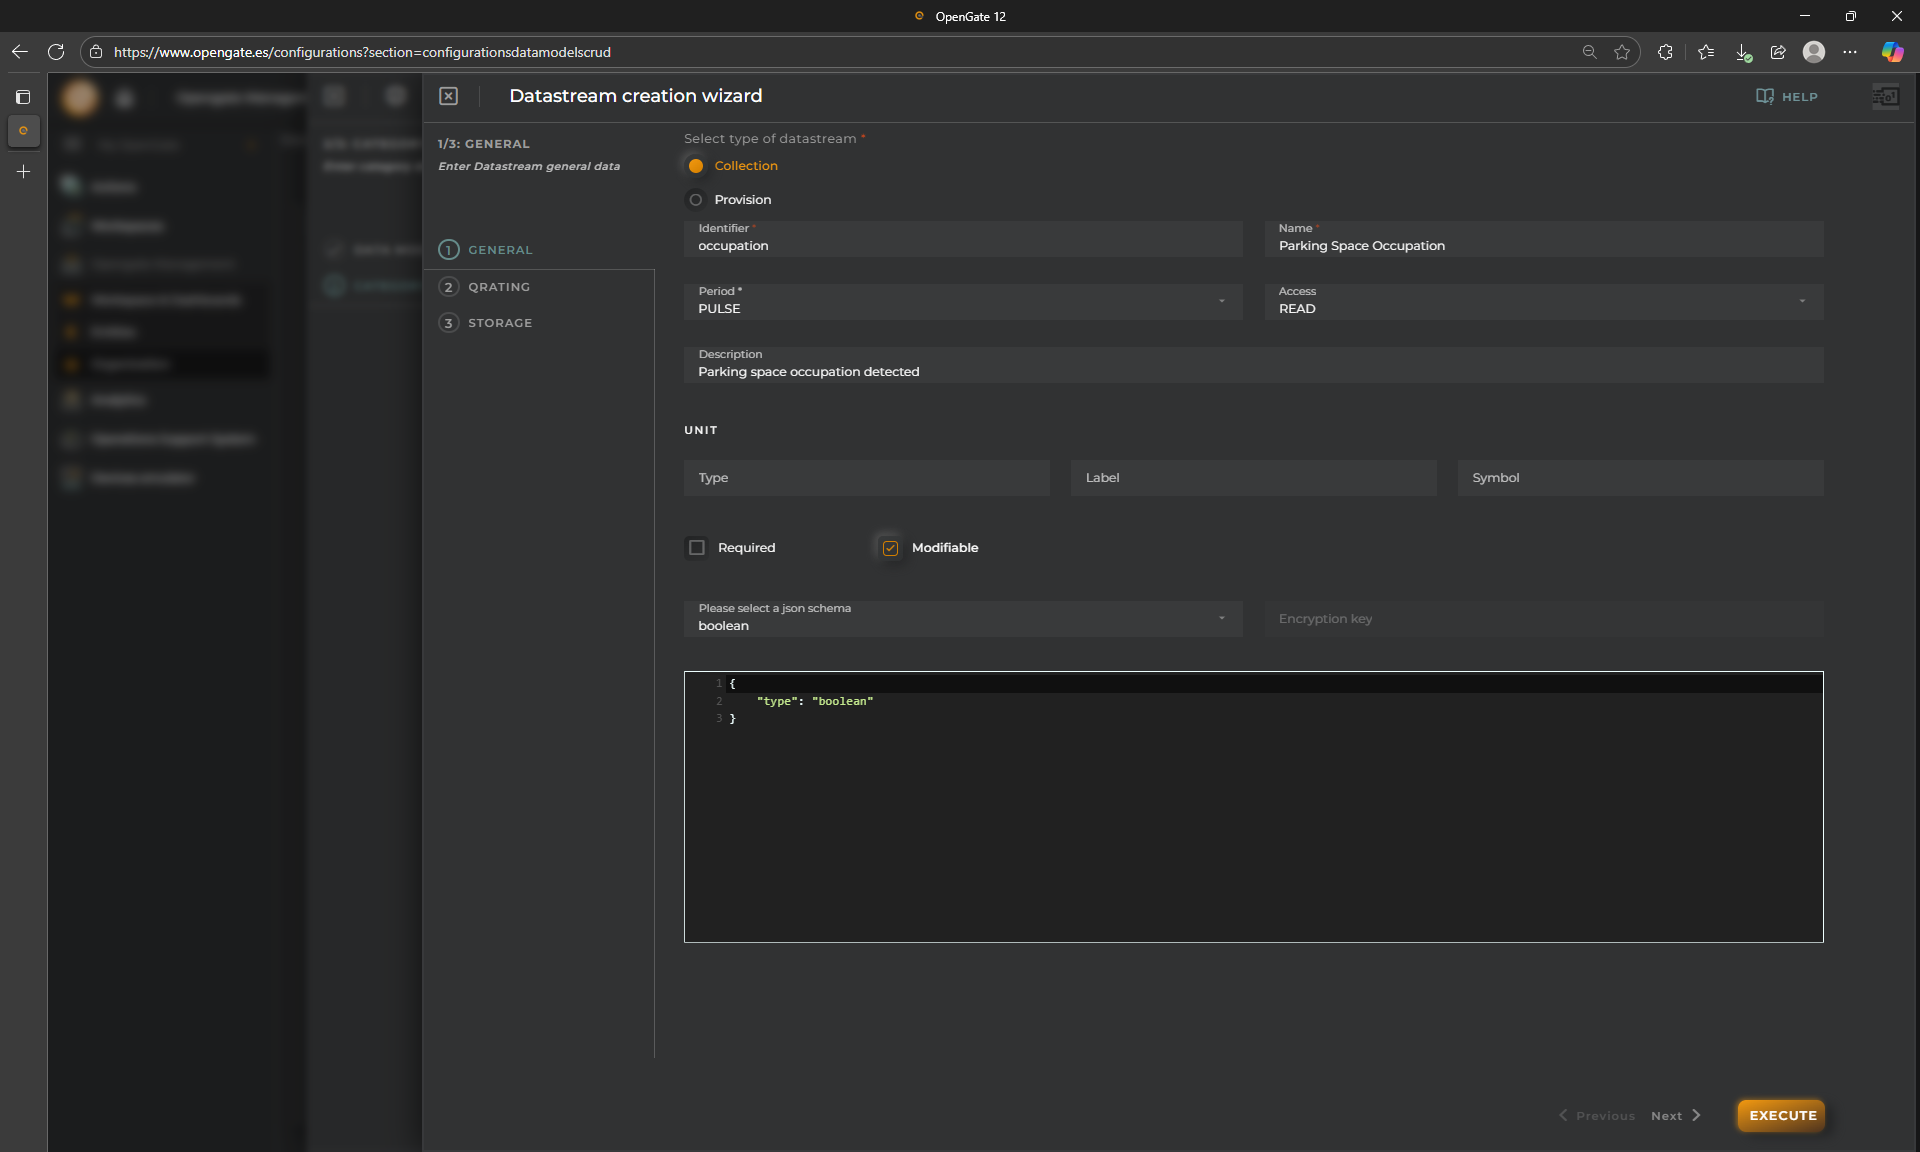
Lets start with the first datastream “occupation”:
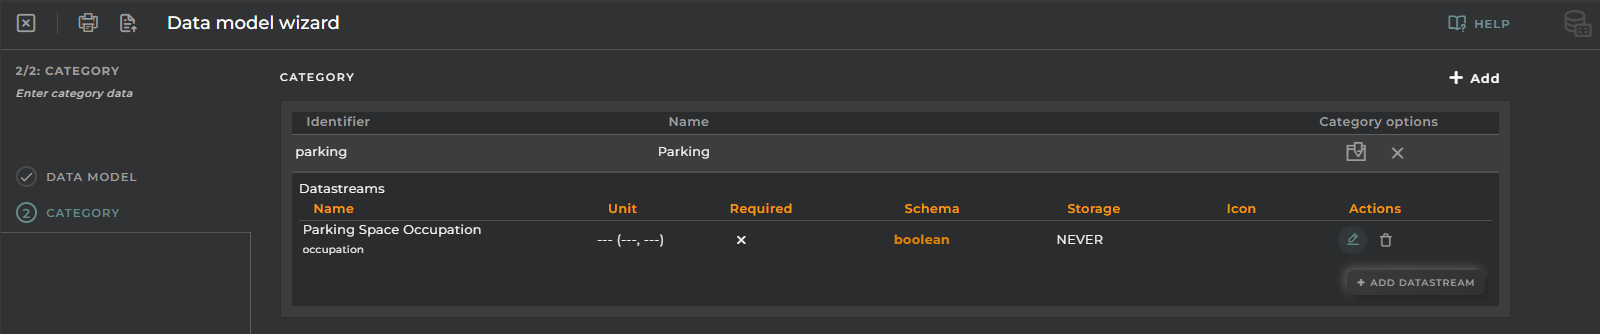
For this demo, just fill the first step and click on “EXECUTE”. Then our new datastream occupation is added to the parking category:
5. Finish your work:
Continue at your own and add the other category and its datastreams. At the end, you should have the following:
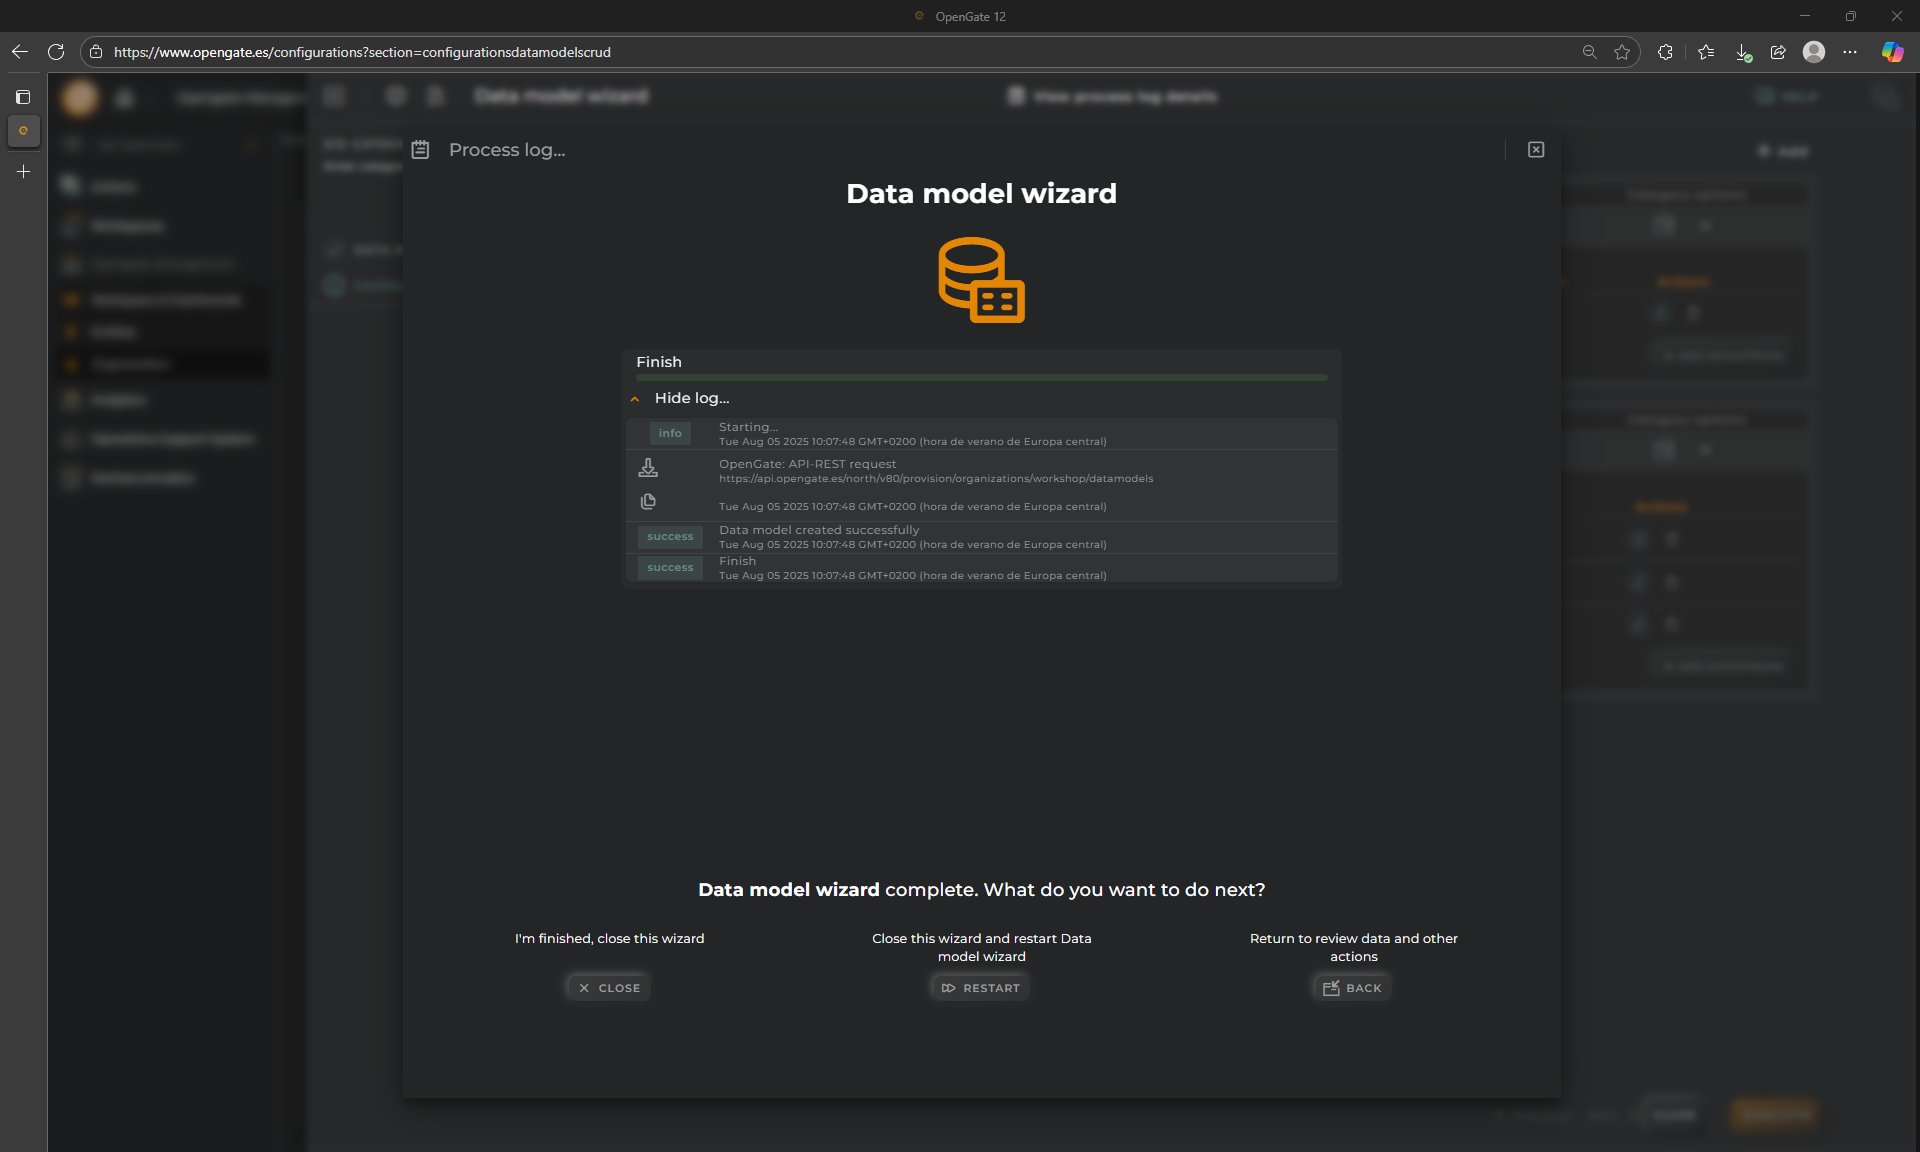
If all the information is correct, click on “EXECUTE” to create the datamodel, you will receive the following message:
🎉 Congratulations you create your first datamodel successfully.
🗒️ Advanced tips
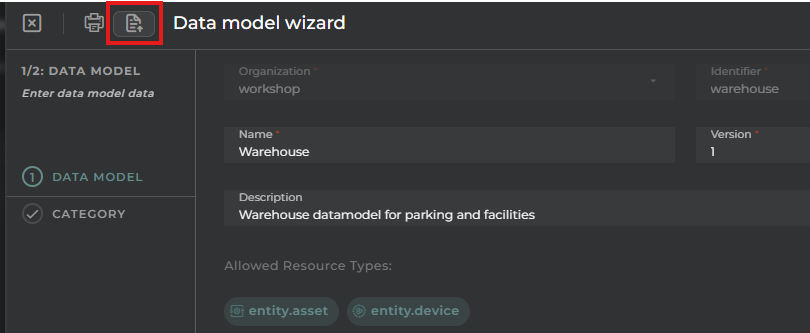
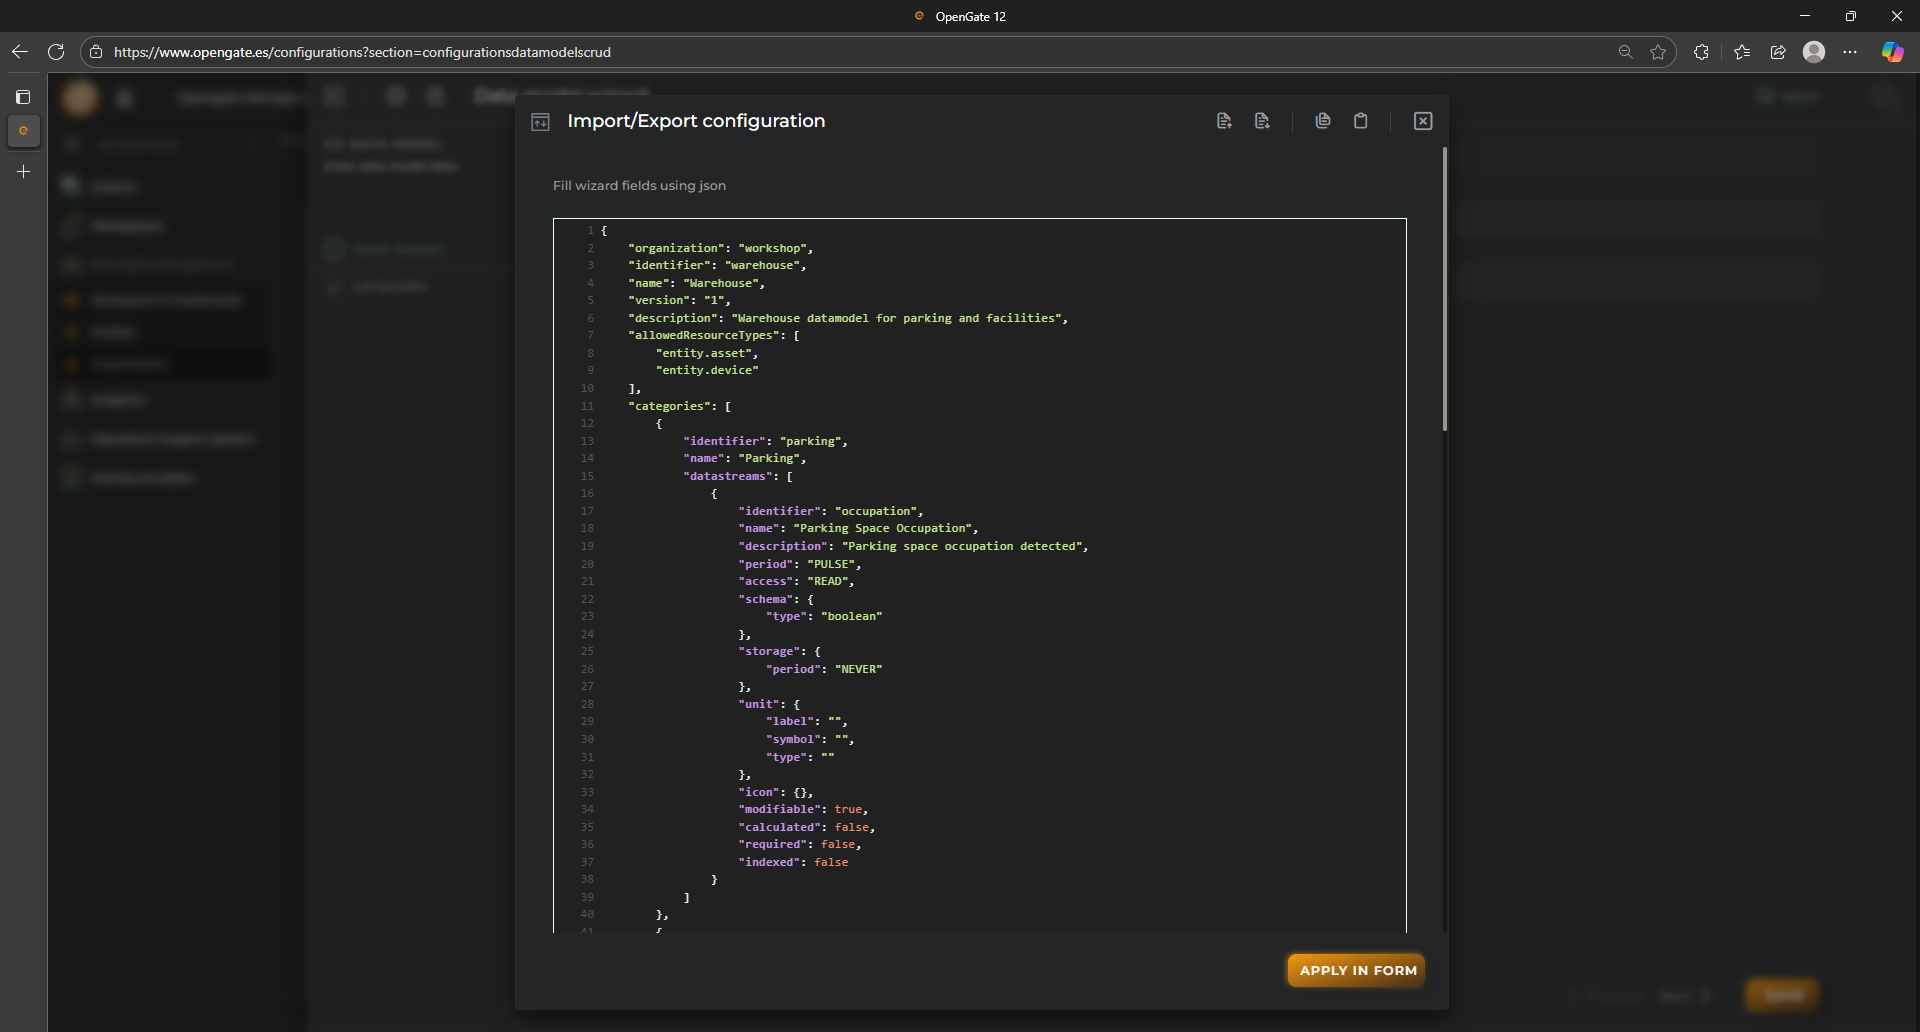
Here you can download the JSON to be imported in the wizard using the top option “Import/Export configuration”
Copy the following JSON and paste into the code box:
This apply the JSON in the wizard that can be used if desired, directly using the API.
4. Entity Provisioning
🌐 The OpenGate Entity Types
OpenGate models several types of entities to structure and manage your IoT ecosystem. These entities are:
Asset: A digital representation of something that may have one or more related devices. For example: a parking slot, a warehouse room, a patient, a wind turbine, or a solar plant.
Device: Typically a physical component such as a sensor or machine. Examples include temperature or motion sensors, industrial PLCs, water/gas meters, or generators.
Subscription: The communication contract associated with a device. This could be a 5G or NB-IoT mobile data plan.
Subscriber: The identifier that enables communication, usually a SIM or eSIM number.
Ticket: A special entity used to log work within the platform, such as on-site deployments or repair processes.
Organization: Represents a company or its sub-organizations.
Channel: A logical grouping of devices, often organized by location, function, or asset group.
⚙️ Provision new Entities
To begin collecting data from your ecosystem, you’ll need to provision entities in OpenGate. There are three ways to do this:
🎯 IMPORTANT CONCERN ABOUT ENTITY IDs
IMPORTANT: In case you are using OpenGate Cloud, take into account that the IDs for the entities are unique for all the OpenGate instance. OpenGate cloud is an unique instance for all our public cloud customers, and because of the behaviour of some manufacturers and protocols, the device ID must be as is without modifications (MAC address, UUID for people, and so on). We need this ID to identify the device correlation to your OpenGate account so it may occur that if you use custom identifiers, those identifiers already exist on OpenGate Cloud.
We always recommend that you should define a prefix to create virtual or simulated entities.
For this tutorial, define a [YourPrefix] to replace later the JSON provided with the examples.
🧙♂️ Using the Wizard
OpenGate includes a guided wizard to help you create new entities easily, step by step. Although the wizard is customizable, for this tutorial we’ll use the default version.
1. Open the wizard from the UI.
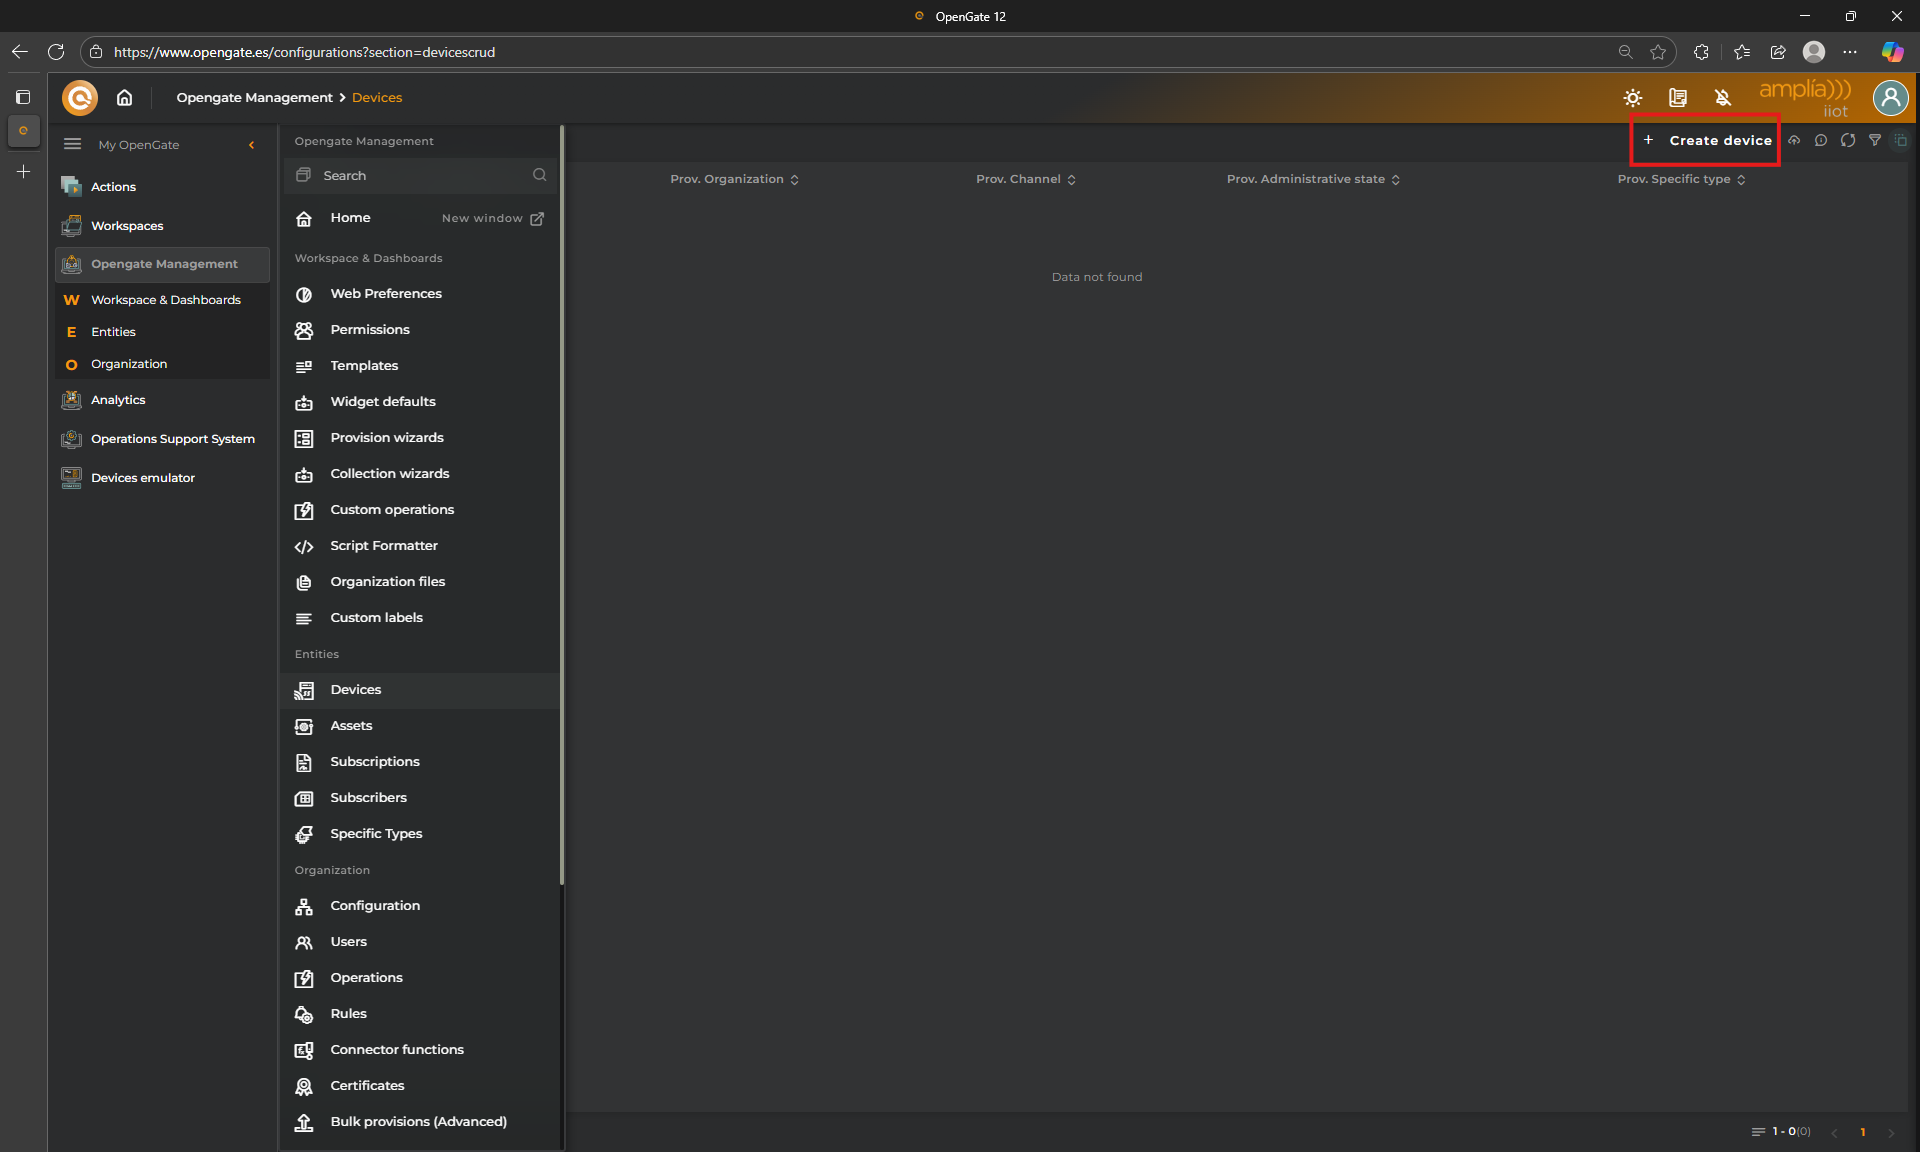
Go to “Opengate Management > Devices”, then click on “+ Create Device” and the wizard start
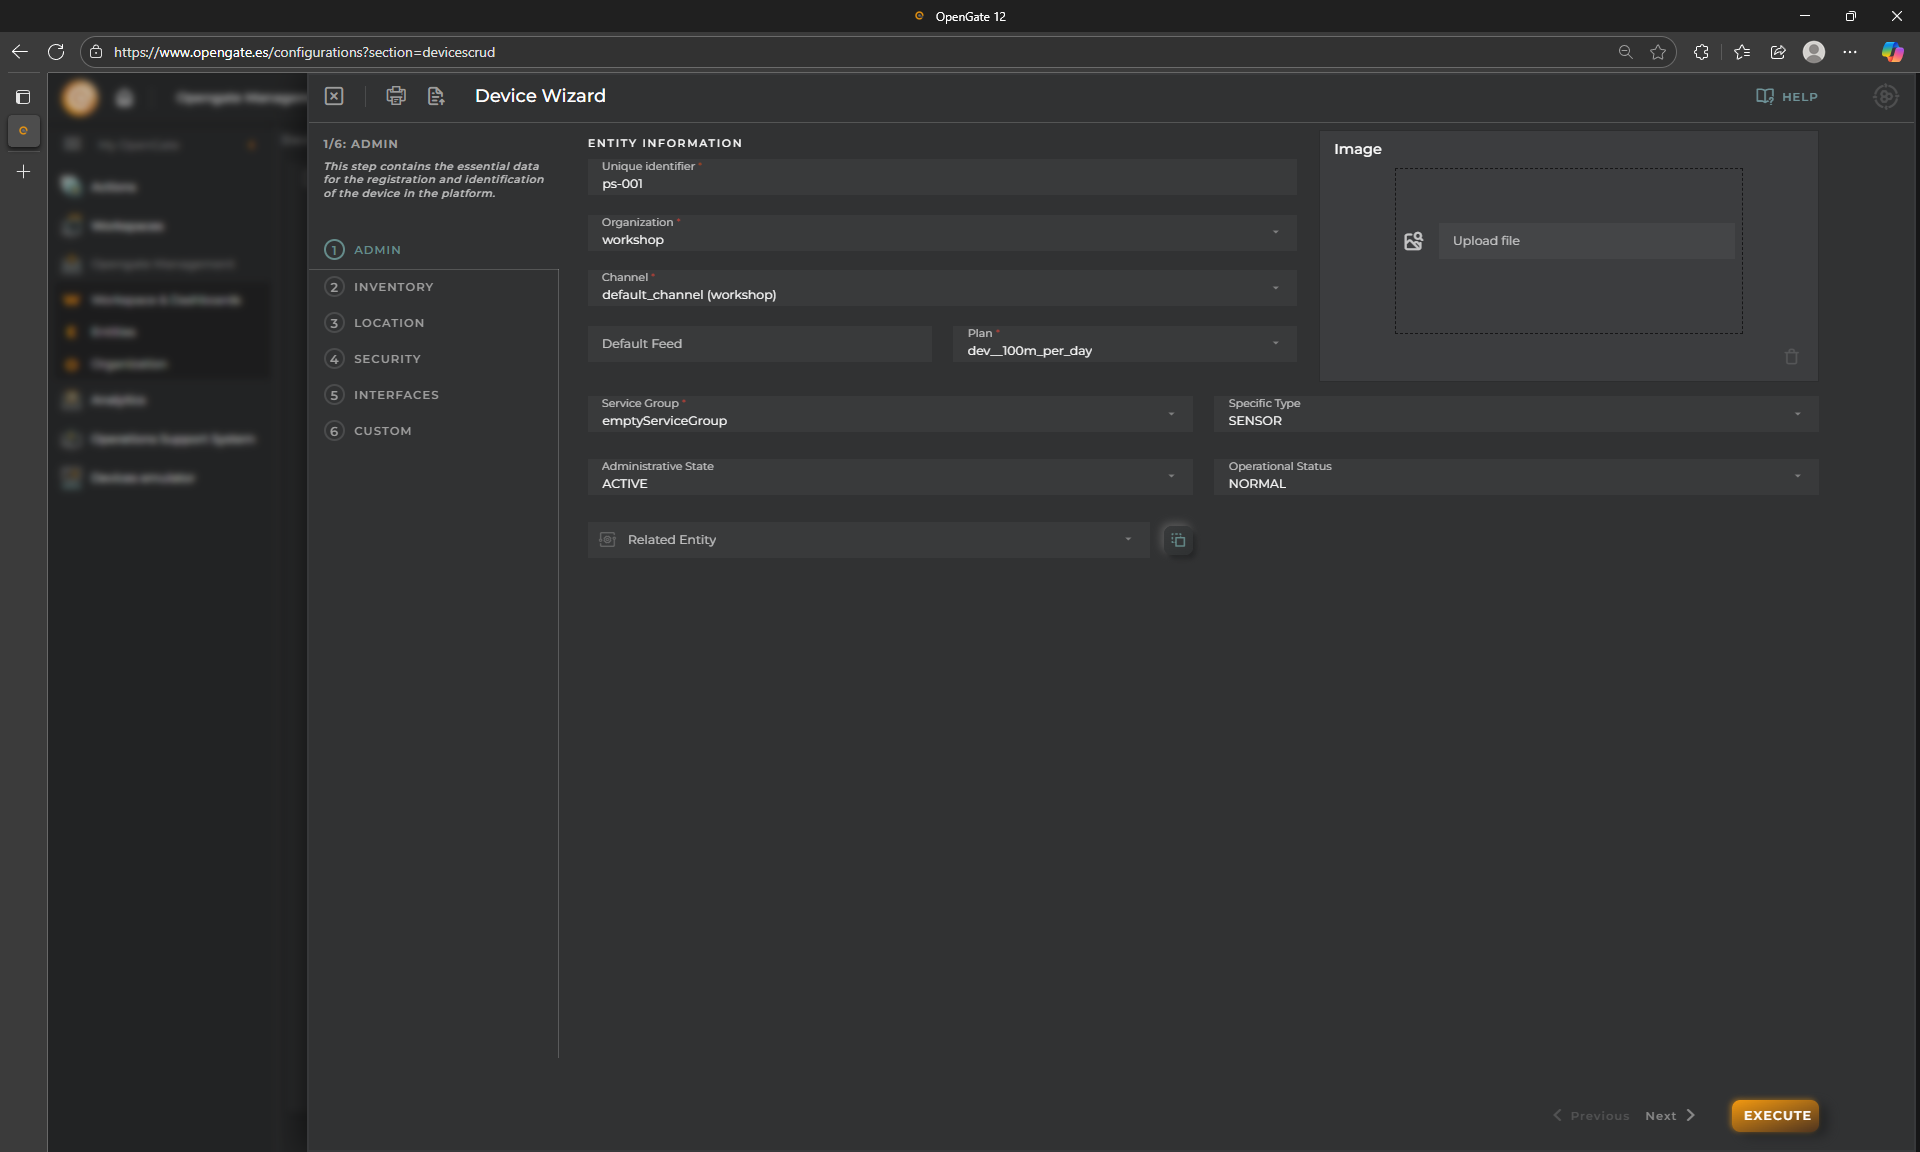
2. Fill the first step: Enter administrative information (name, type, organization, etc.).
As this tutorial’s purpose, we will fill the most commonly used fields, that are:
Unique Identifier: This is the unique ID of the device on the platform, use [YourPrefix]-ps-001
Organization: To what organization this entity belongs. We have not more in this tutorial, use workshop
Channel: Group of devices, in this tutorial we just have default_channel (workshop)
Plan and Service Group: We don’t go deeper in this tutorial for these fields but Plan indicates the traffic and data policy for this devices, and ServiceGroup, indicates the operations group of the entity. Use defaults
Specific Type: As the name indicates, this allows you to set the specific type of device. This works like a label, and later we will see how to create filters based on this field. The options here are predefined but an Administrator user can customize them. Use SENSOR
Administrative Status: This is the Administrative Status of the entity, use ACTIVE
Operational Status: This is the operational Status of this entity, use NORMAL
🎯NOTE: The next steps are optional, but for this tutorial we will show you the most relevant standard fields
3. Step 2: Inventory
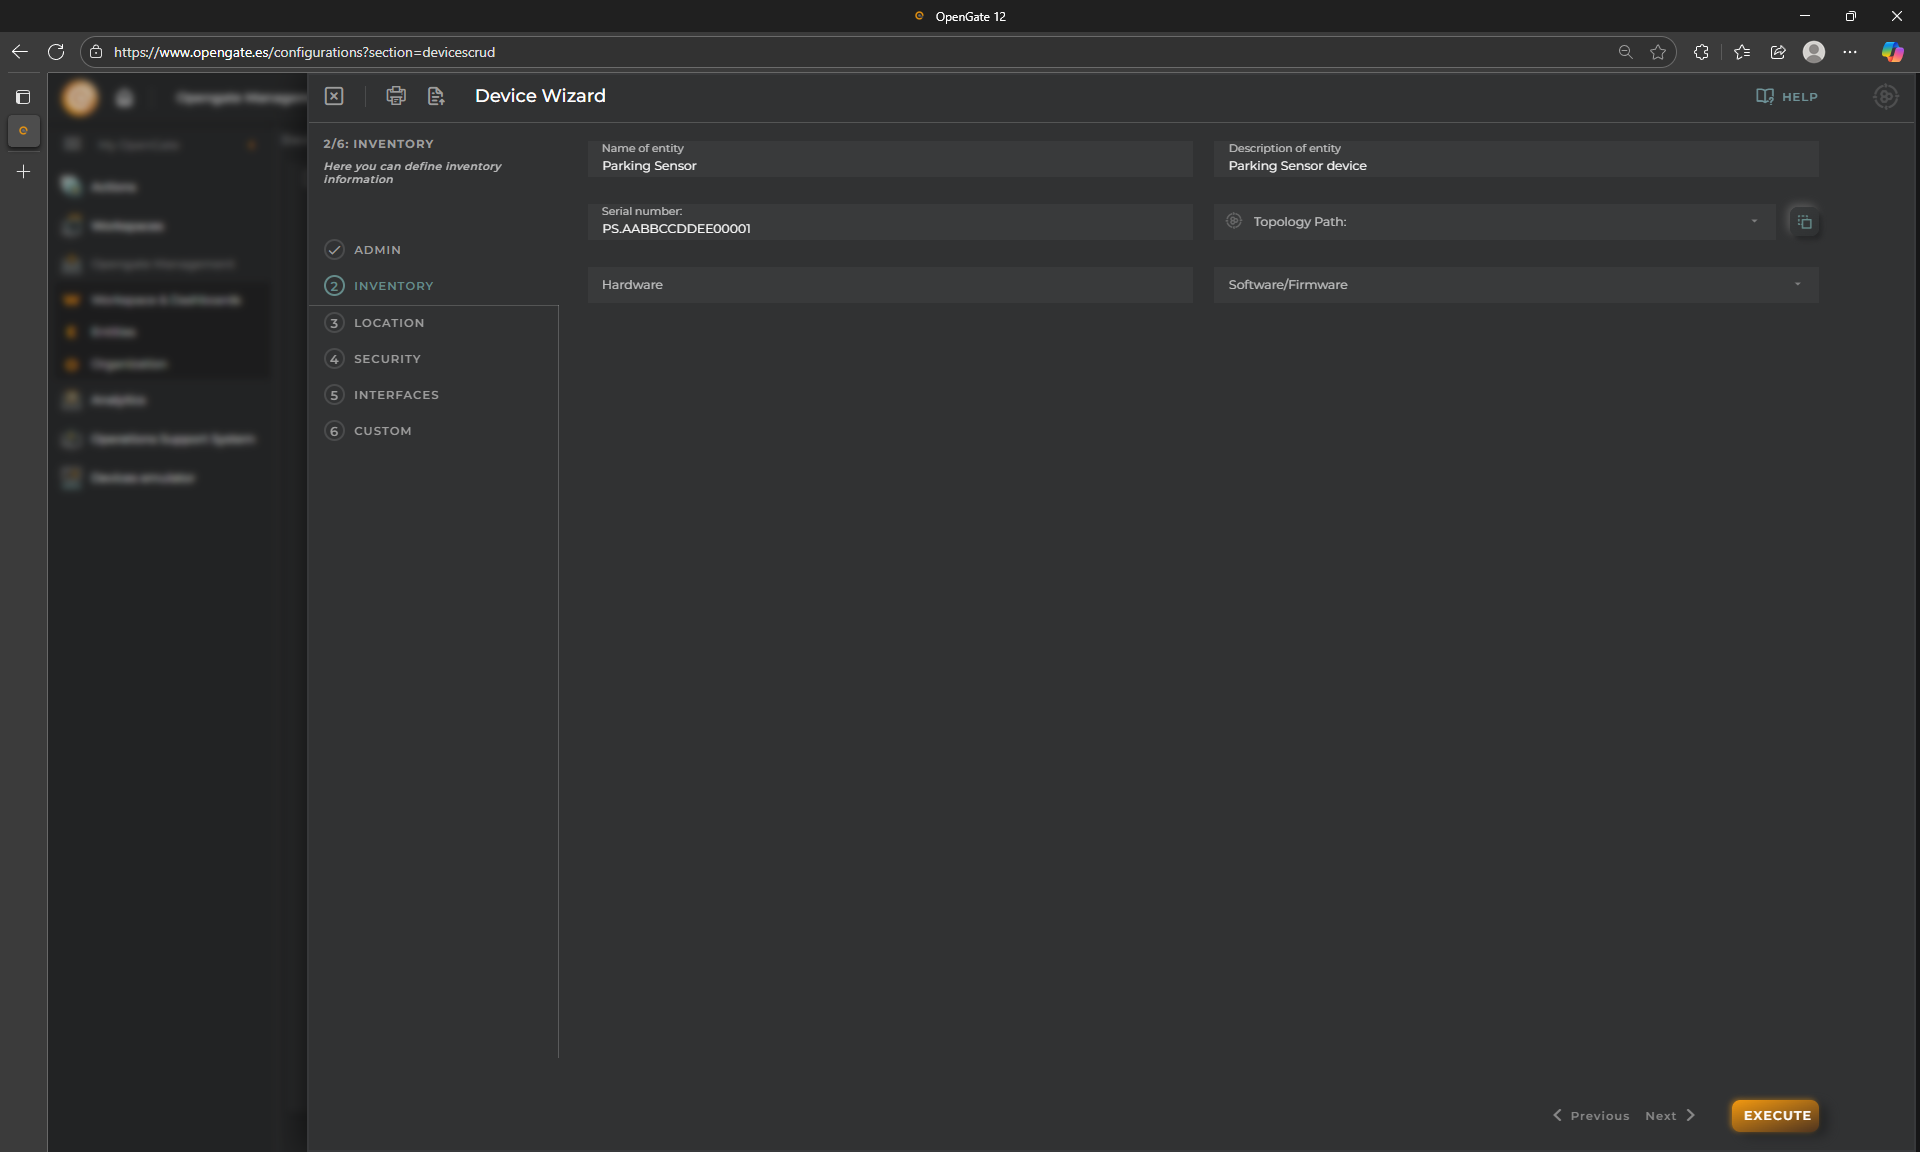
This step allows you to define other device info, lets fill the following:
Name: This is the name of the entity, ussually this is a commonly used name in your solution. Use: Parking Sensor 001
Serial Number: This is the serial number, usually a device serial number is an unique number for the hardware itself. Use: PS.AABBCCDDEE00001
This group of fields are not mandatory and we will not fill in this tutorial, but just for clarification the others fields are:
Description: Obvious, a free text description for the entity just in case we need some notes.
Topology Path: Some times there are devices that have not communication capabilities by themselves or that require another entity to play as gateway to send the information depending on the architecture requirements. This field allows you to provision the device that play this role for this entity. It is possible to choose one or create a new one from this same screen.
Hardware and Software/Firmware: Are used to indicate the inventory information for the hardware and software/firmware version of the device. This information is provisioned by a user, and may differ from the information collected from the device.
After fill the fields that we need, you should see this:
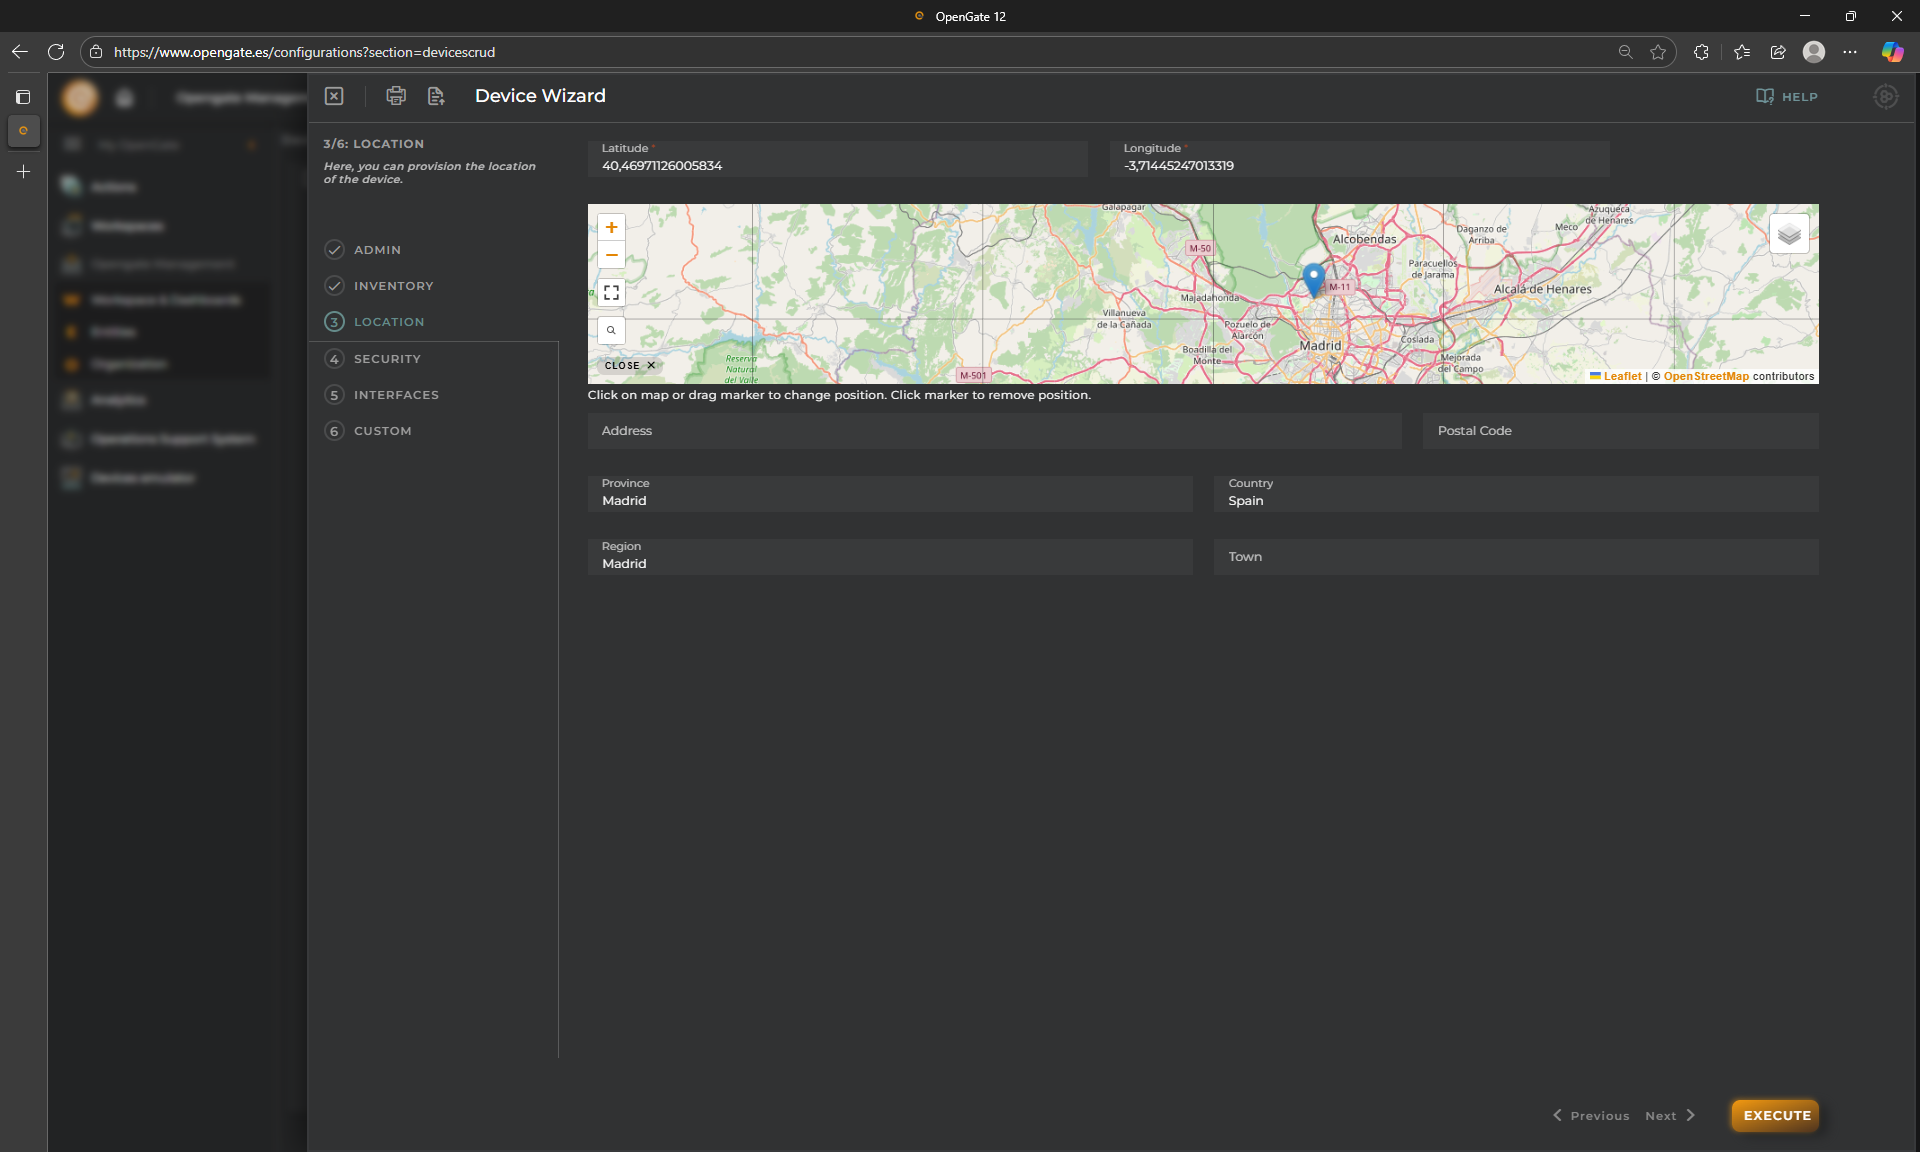
4. Step 3: Location
It is possible to define the location of the devices. For that this wizard step allows you to use directly the map to click on the entity location. Additionally, you can fill the information manually.
For this demo purposes use the location that you want.
Try to click in the map, you use the map left bar to show it in full screen
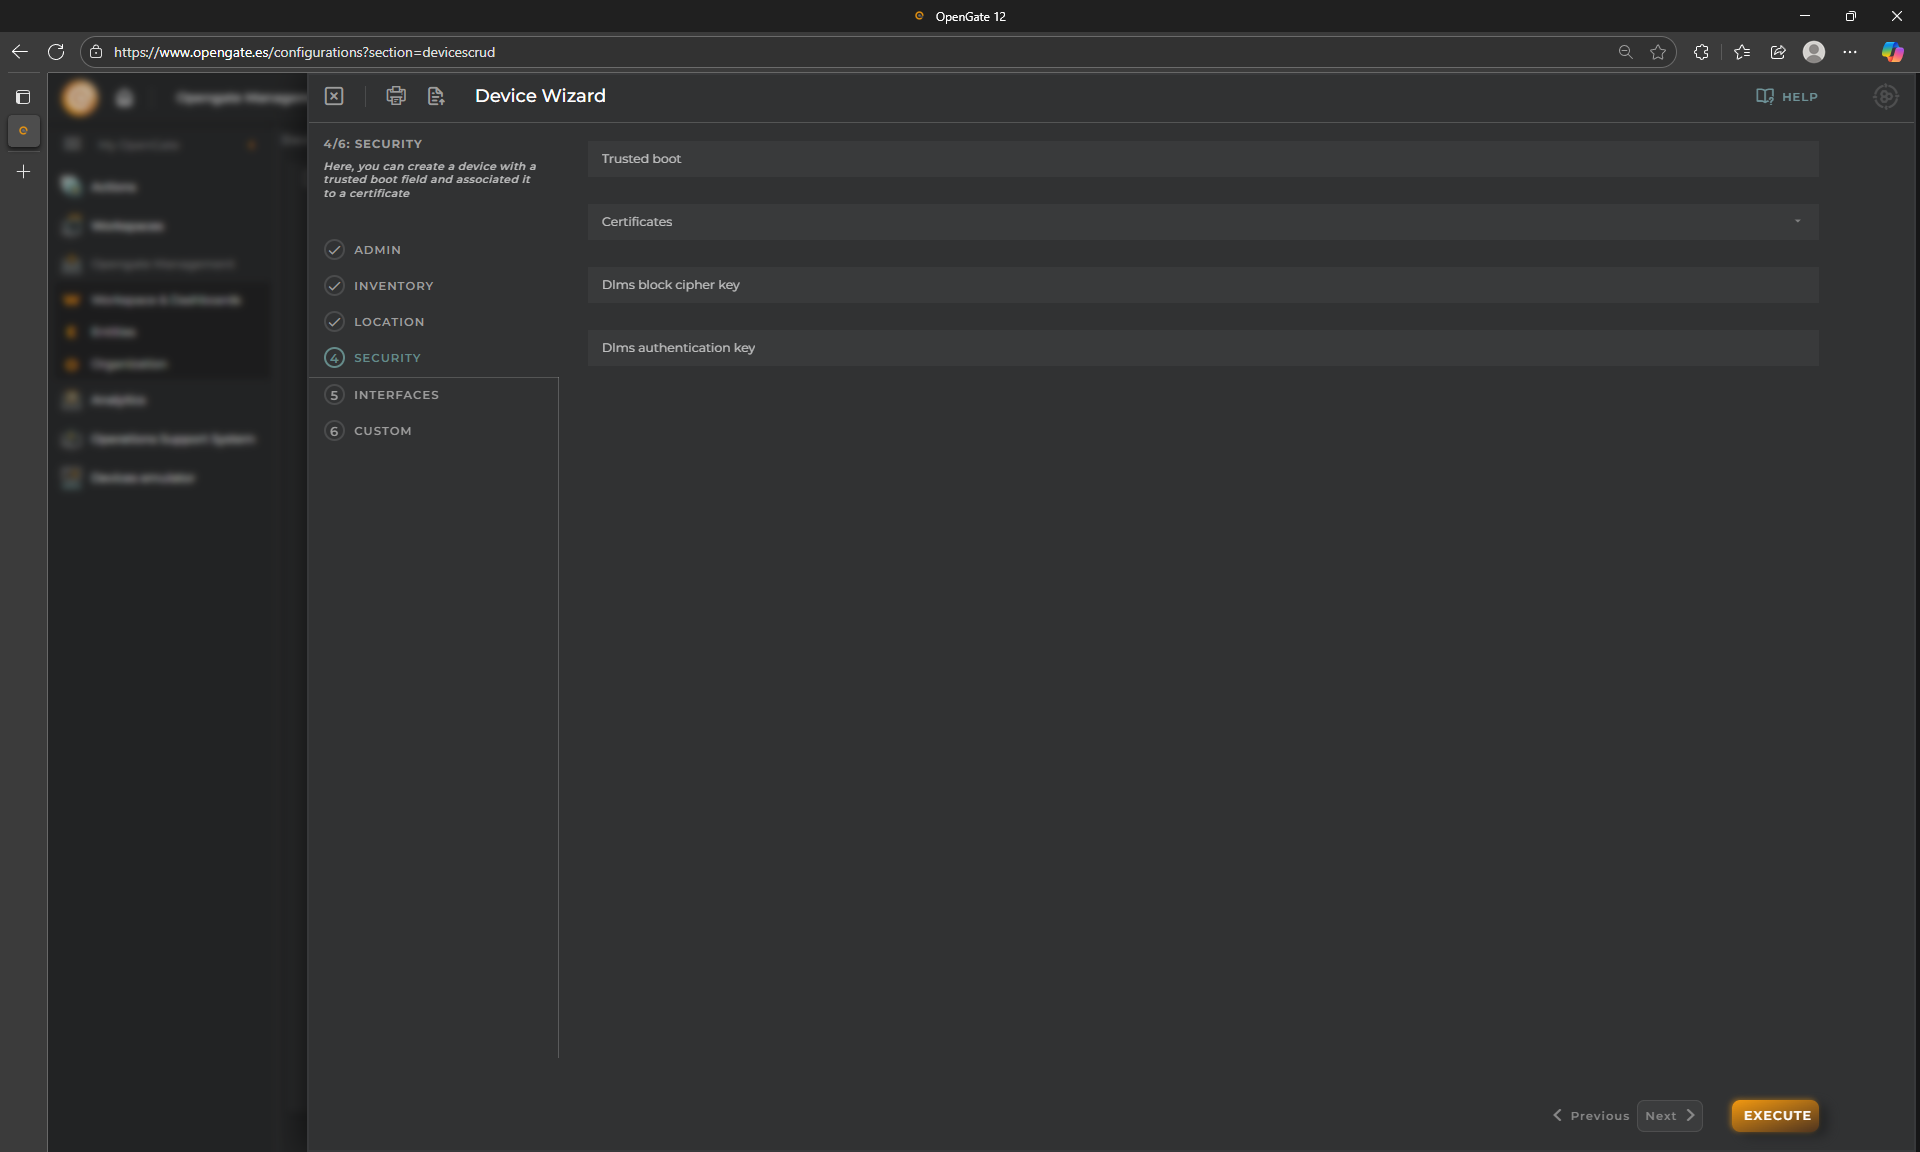
5. Step 4: Security
This step allows you to provision the standard OpenGate security options. We will not use it in this demo to easy accomplish the tutorial but you can provide here:
Trusted Boot: If configured a device must present this value on each collection event
Certificates: An administrator can add and manage certificates for your OpenGate organization
DLMS security params: DLMS devices are supported by OpenGate for different protocols and so, you should provide its security information to use them.
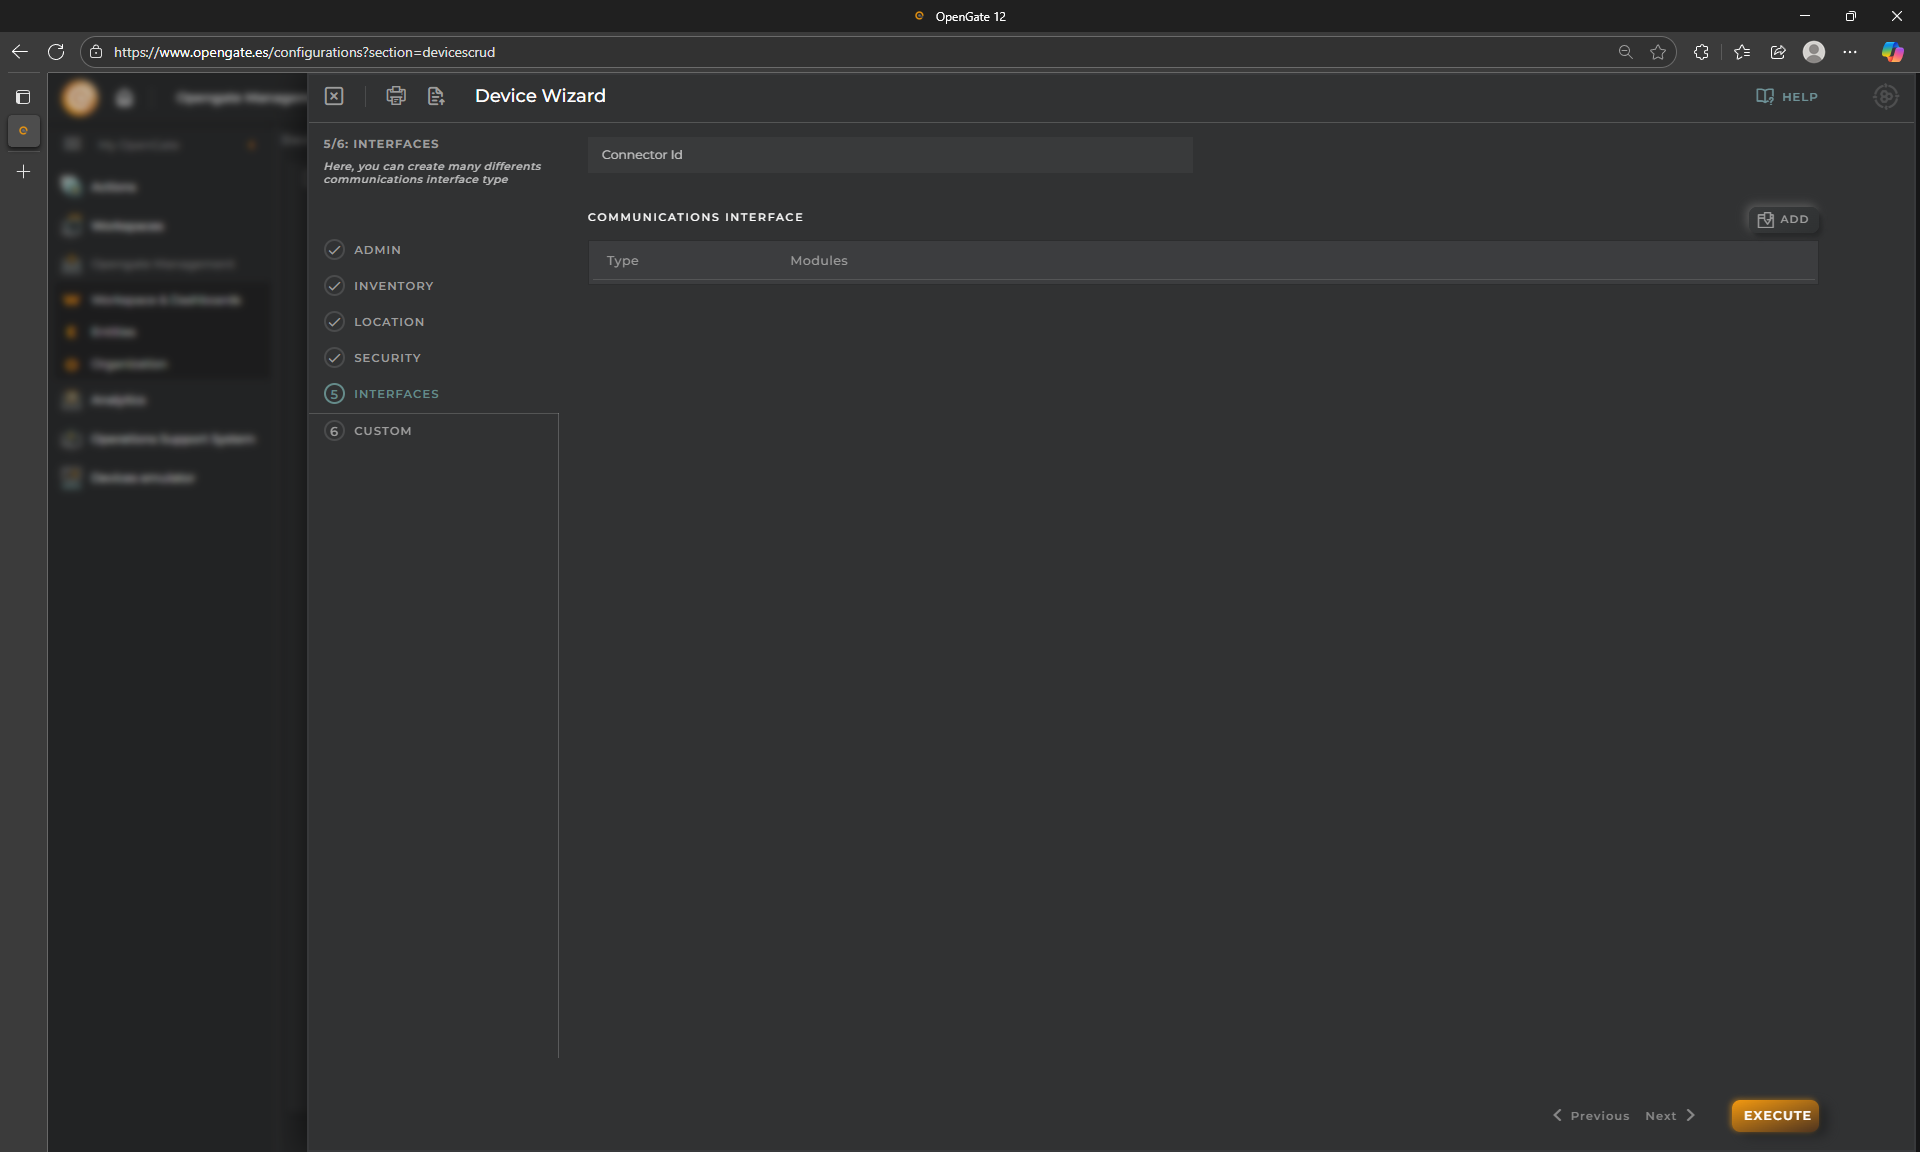
6. Step 5: Interfaces
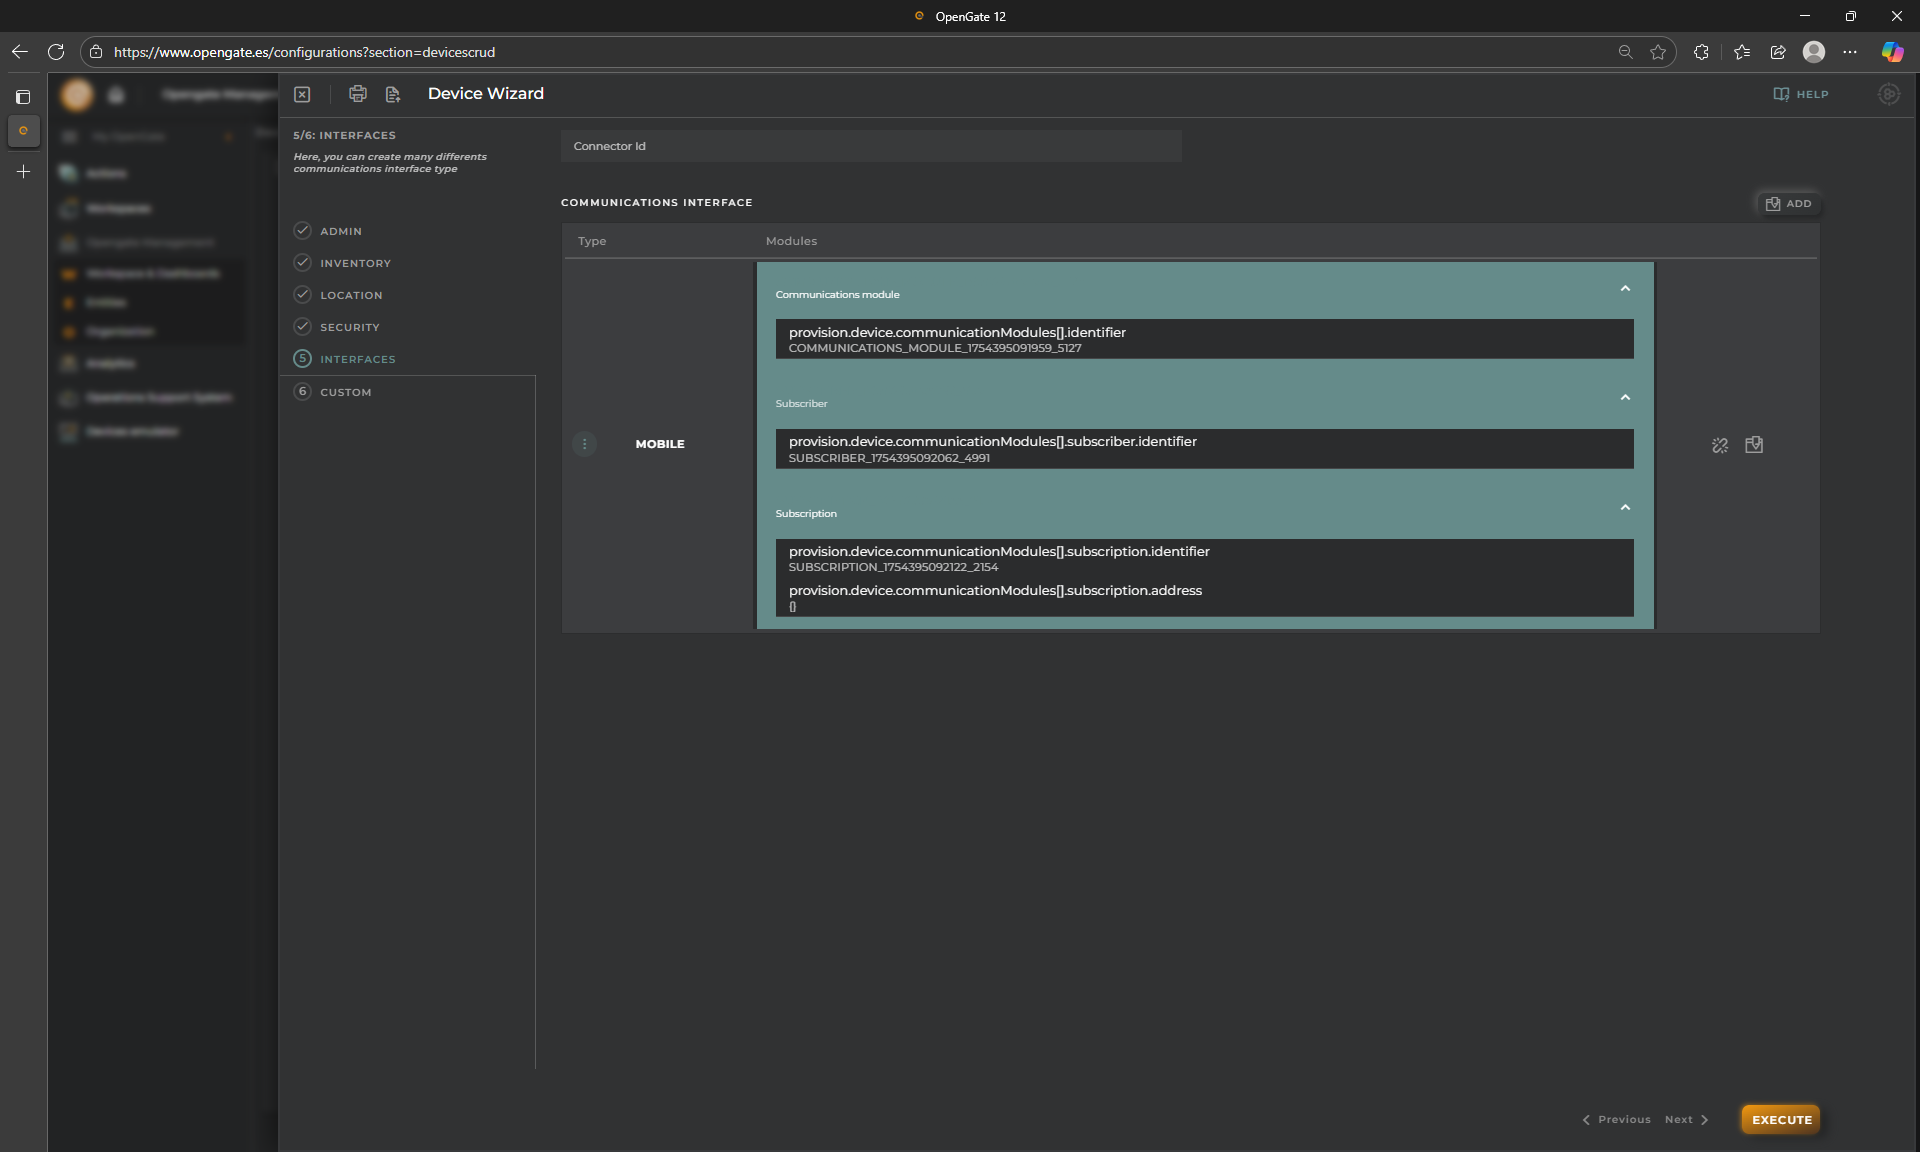
As we mention before in this HowTo’s serie, OpenGate can work with several parts of the IoT Value Chain and so, our platform allows you to manage and monitor even the communications layer, assotiated with your entities. This includes its communication modules, so from here you can provision the communications modules that the device has
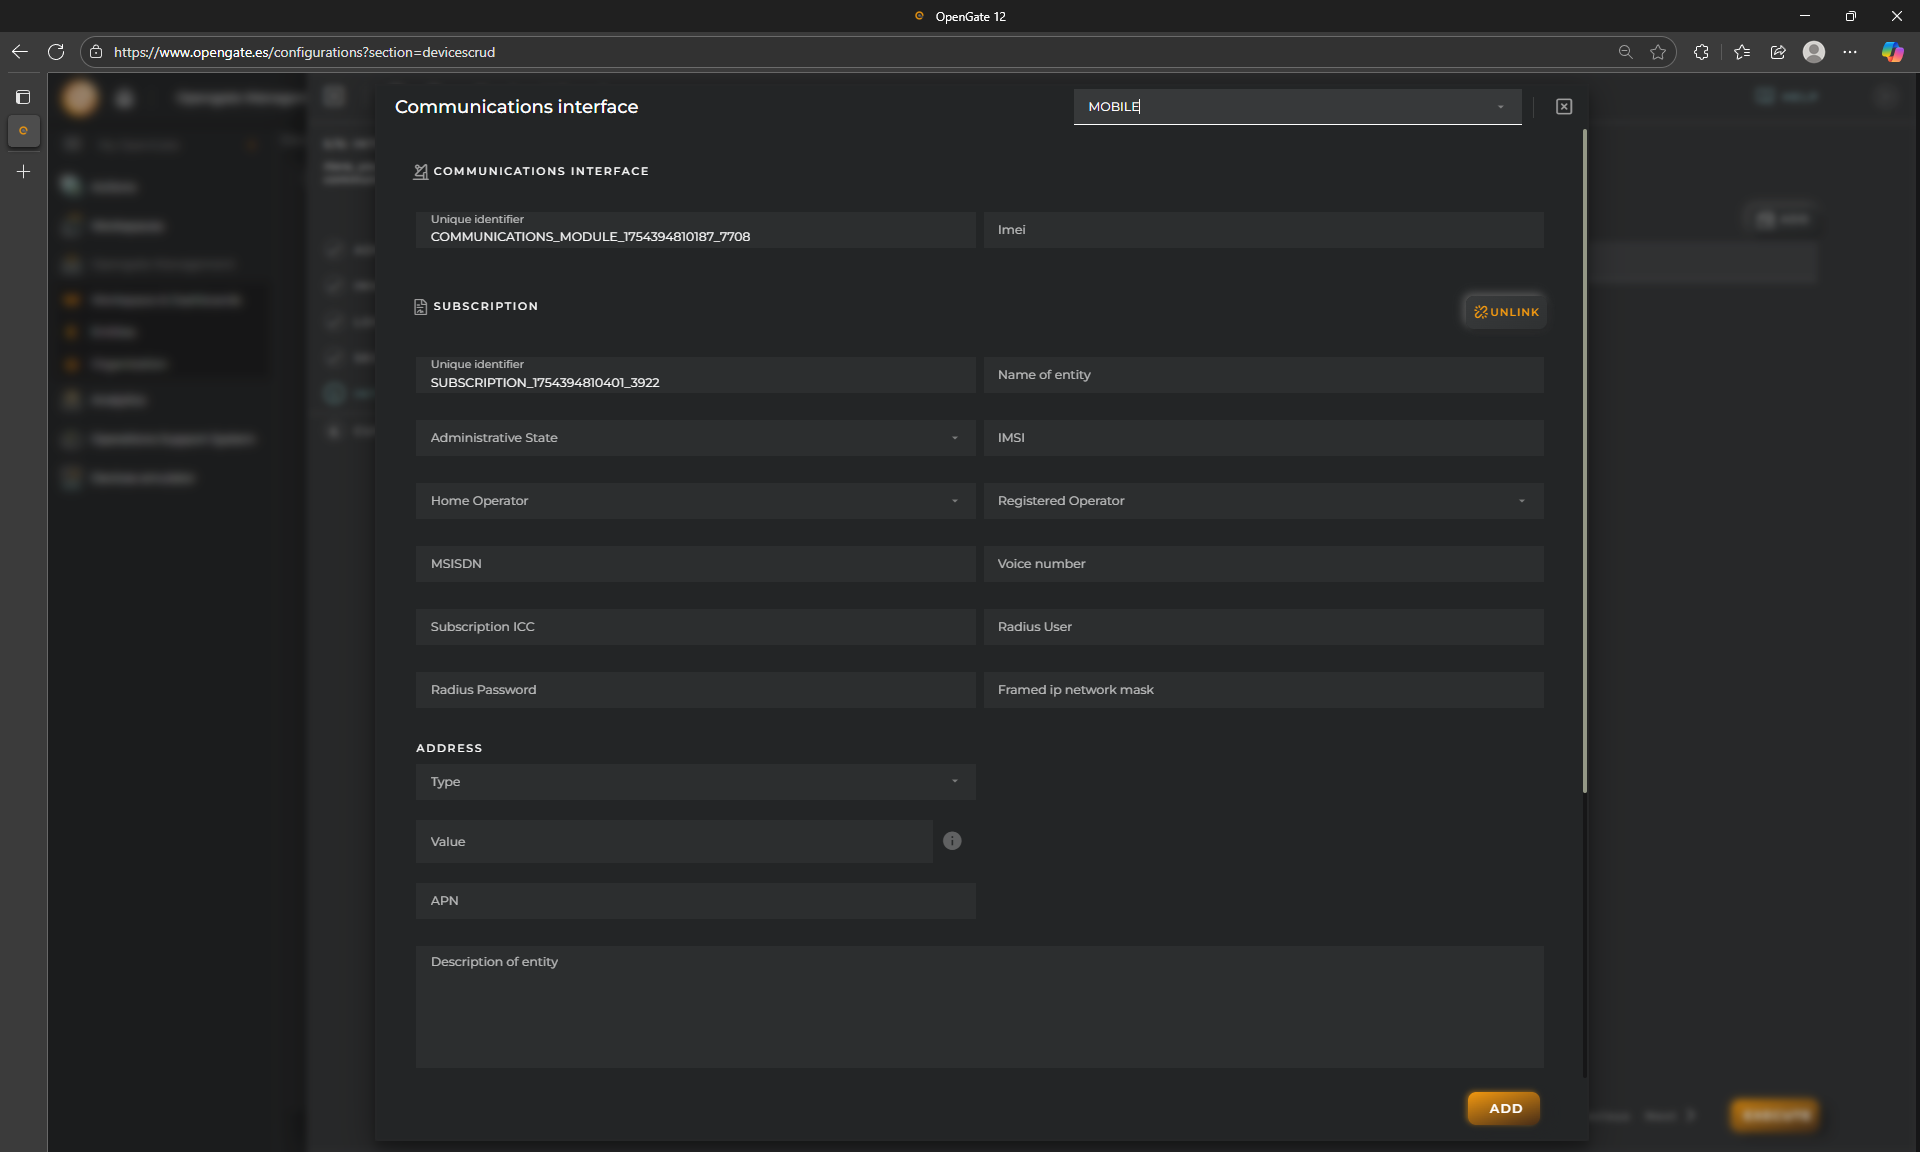
For this demo, we will add one communication module (a device can have many) and we will add a Mobile communications module.
Click on “ADD” button and the platform will fill default values for the Subscription and the Subscriber. In case you have a real device with this capabilities, and so your own communications layer, you can fill this step form with your real values. In any case, you should see something like this:
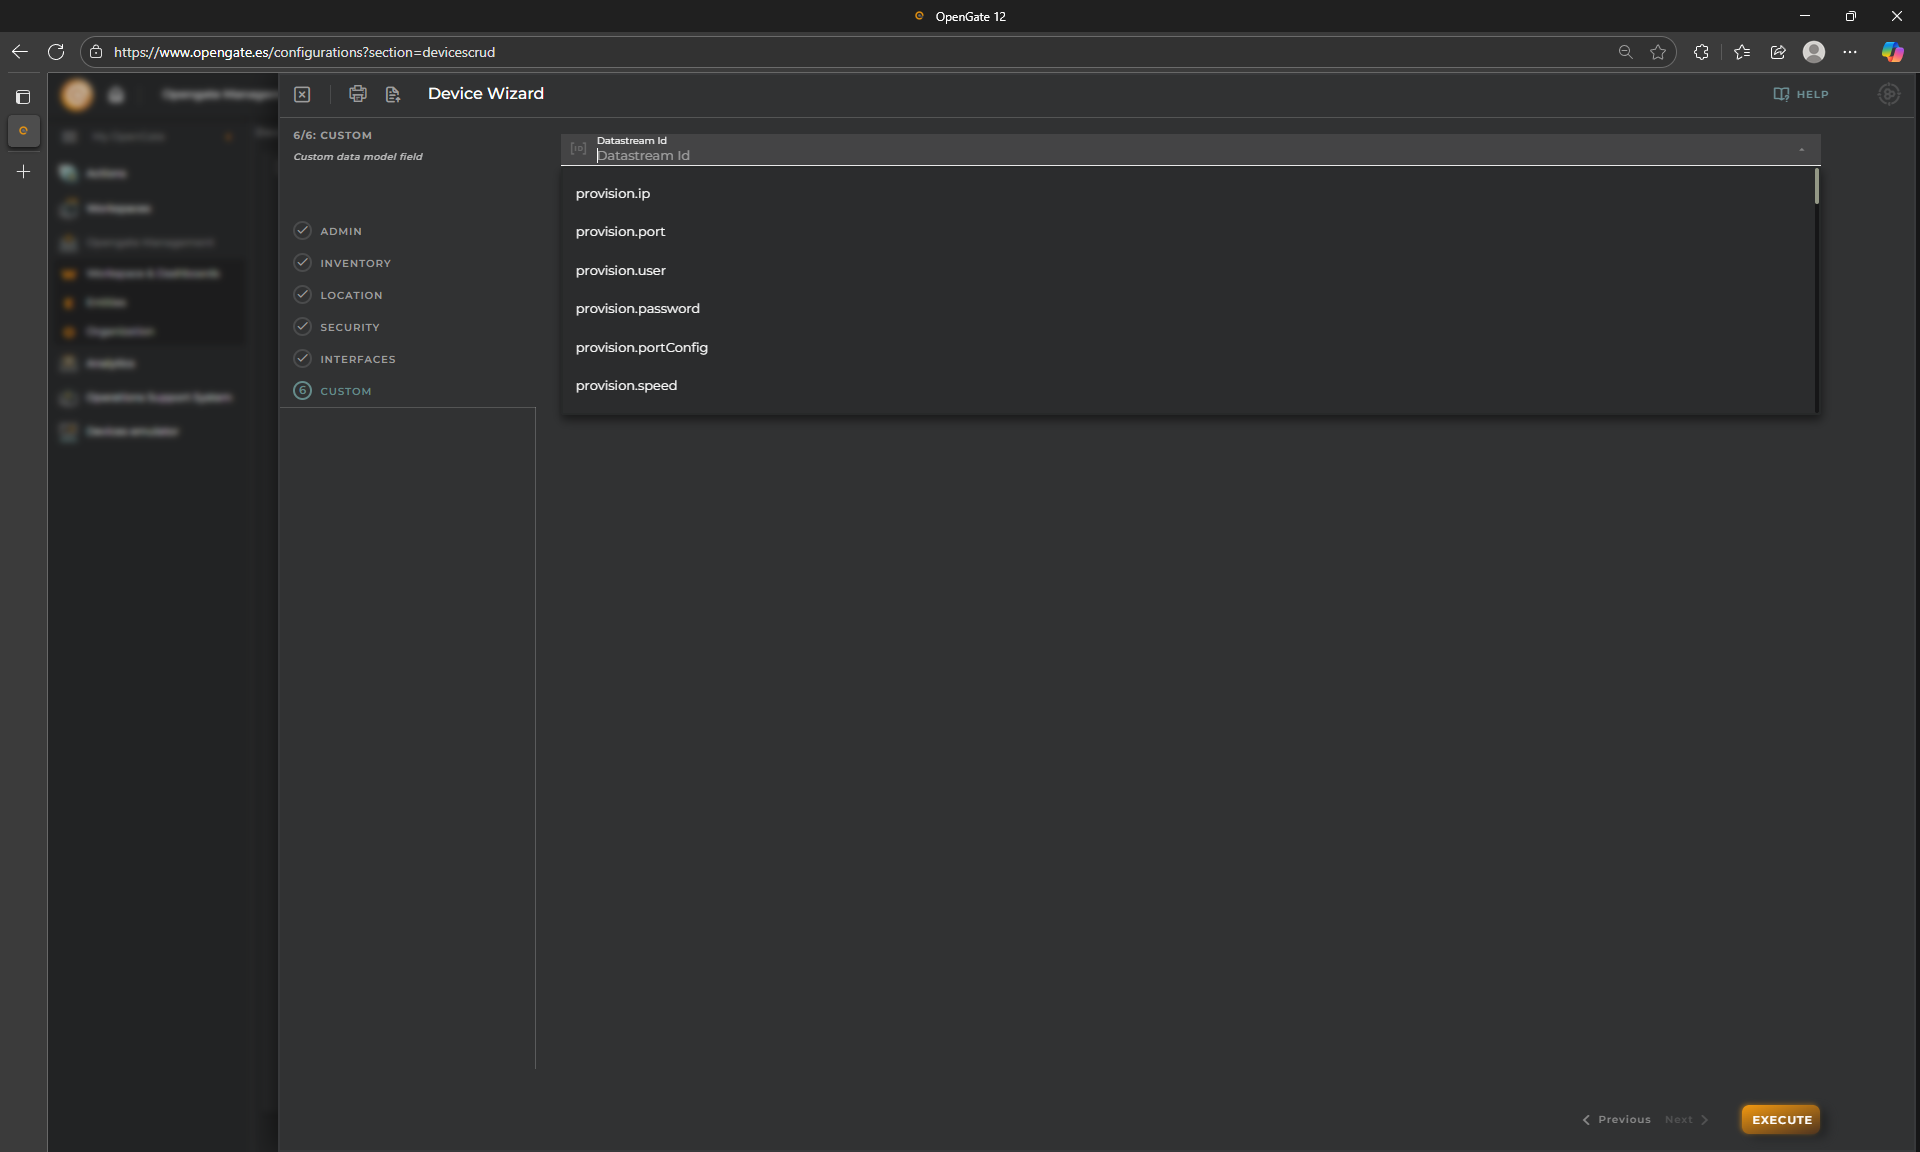
7. Step 6: Custom
This field allows you to fill any other “provision datastream” from the OpenGate standard catalog, or another one that you create in your own datamodel by searching it from the input field
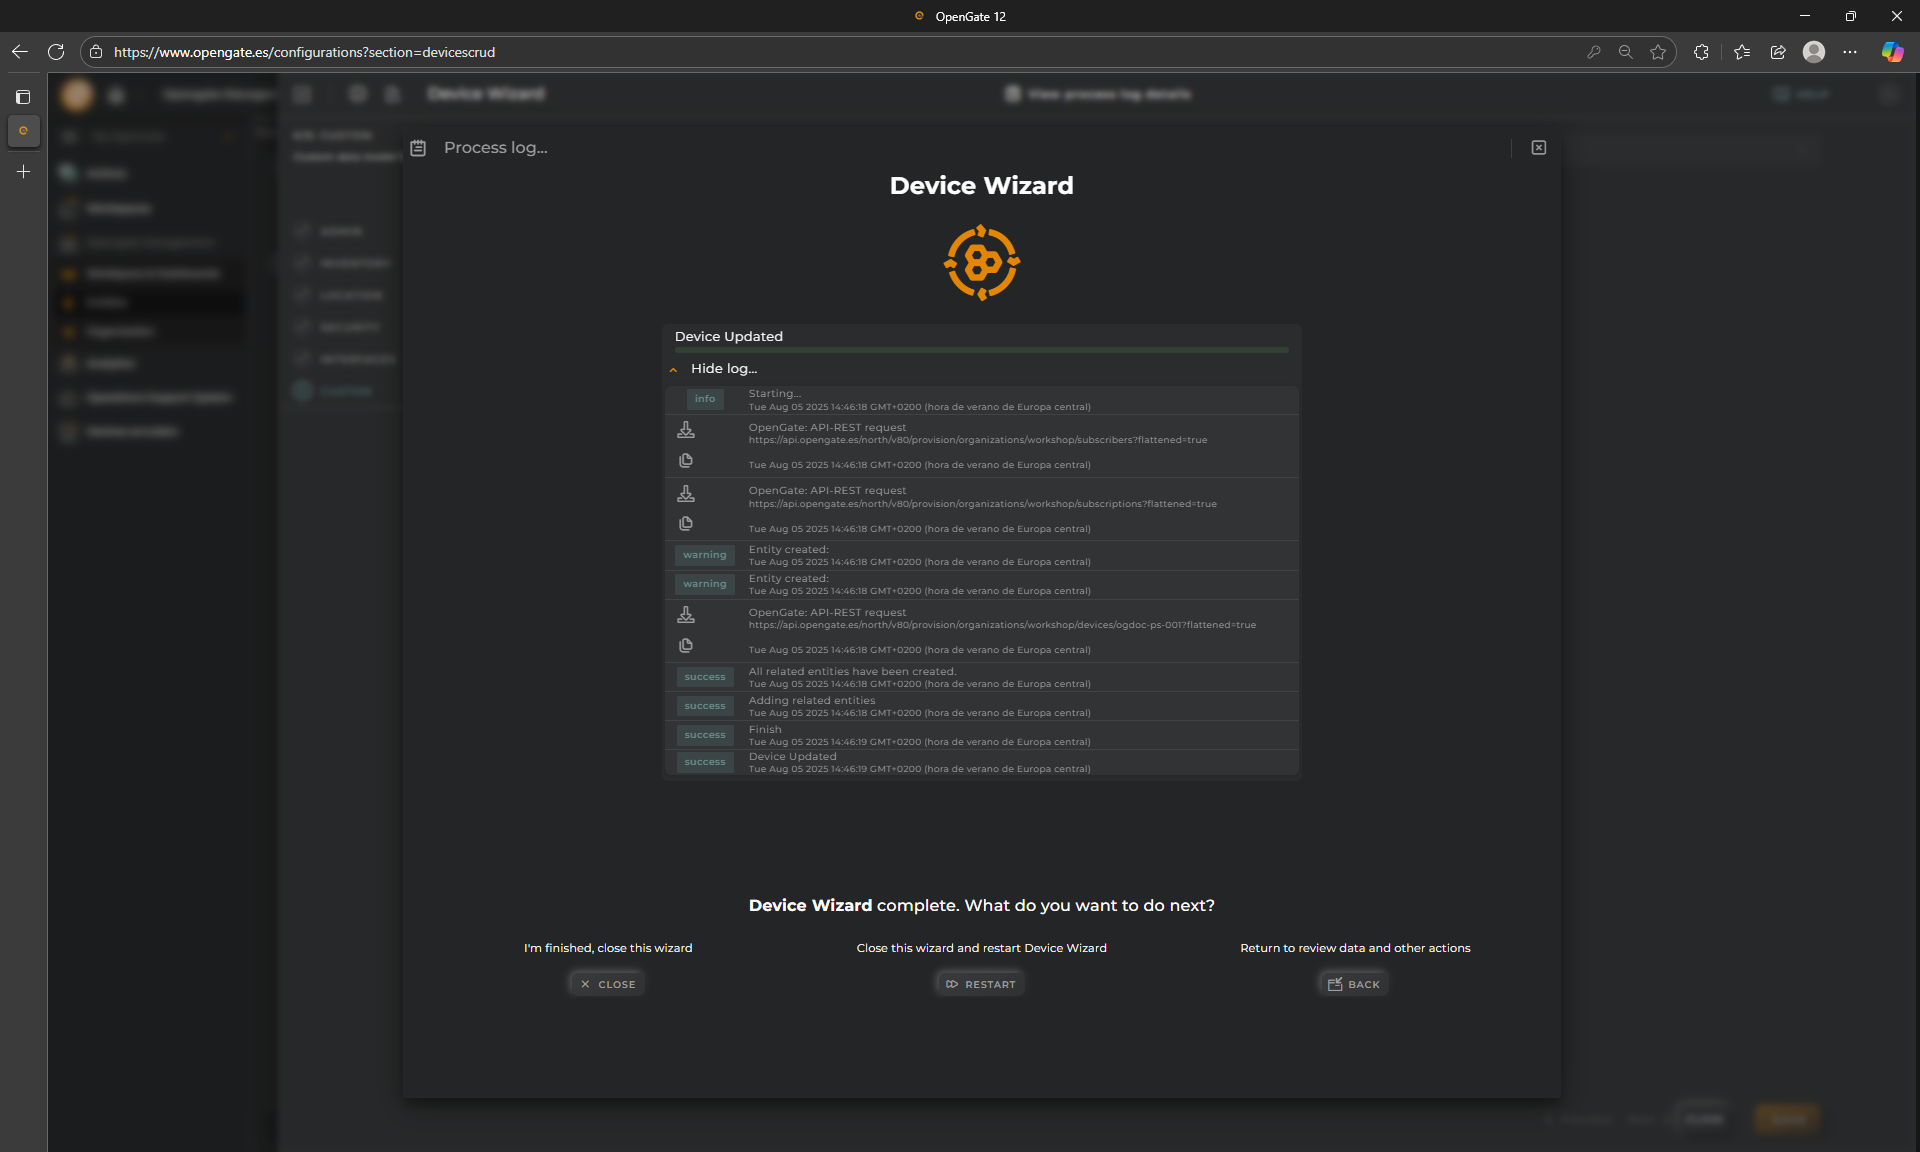
8. Confirm your settings
Click on “Execute” and check the confirmation message
🎉 Your new Entity is created!
Finish your work
Now, to continue this tutorial, you can go to the bottom of this chapter and create all the needed entities contained in the excel files using the wizard, or give a try to the provision functions on the section bellow “Bulk Provisioning”
🚀 When to use this method:
Best for onboarding a small number of entities manually or quick add unitary devices. It is especially useful during prototyping, demos, or for users unfamiliar with API or scripting tools.
📦 Bulk Provisioning
Bulk provisioning enables you to register multiple entities at once via uploaded templates and custom logic. This method uses Provision Functions, which allow you to apply JavaScript logic to Excel files to create, modify, or remove entities in bulk.
The configured JavaScript logic will be applied to each row and the result will be noted in an additional column.
A great feature is that, after the provision function execution, you can download the result file to check what happened with every row, so you can fix the rows with problems if exists and execute again the provision function with this file so only the pending rows will be executed (what a powerful tool! right?)
Let’s use this method to provision some sample entities
1. Open the wizard
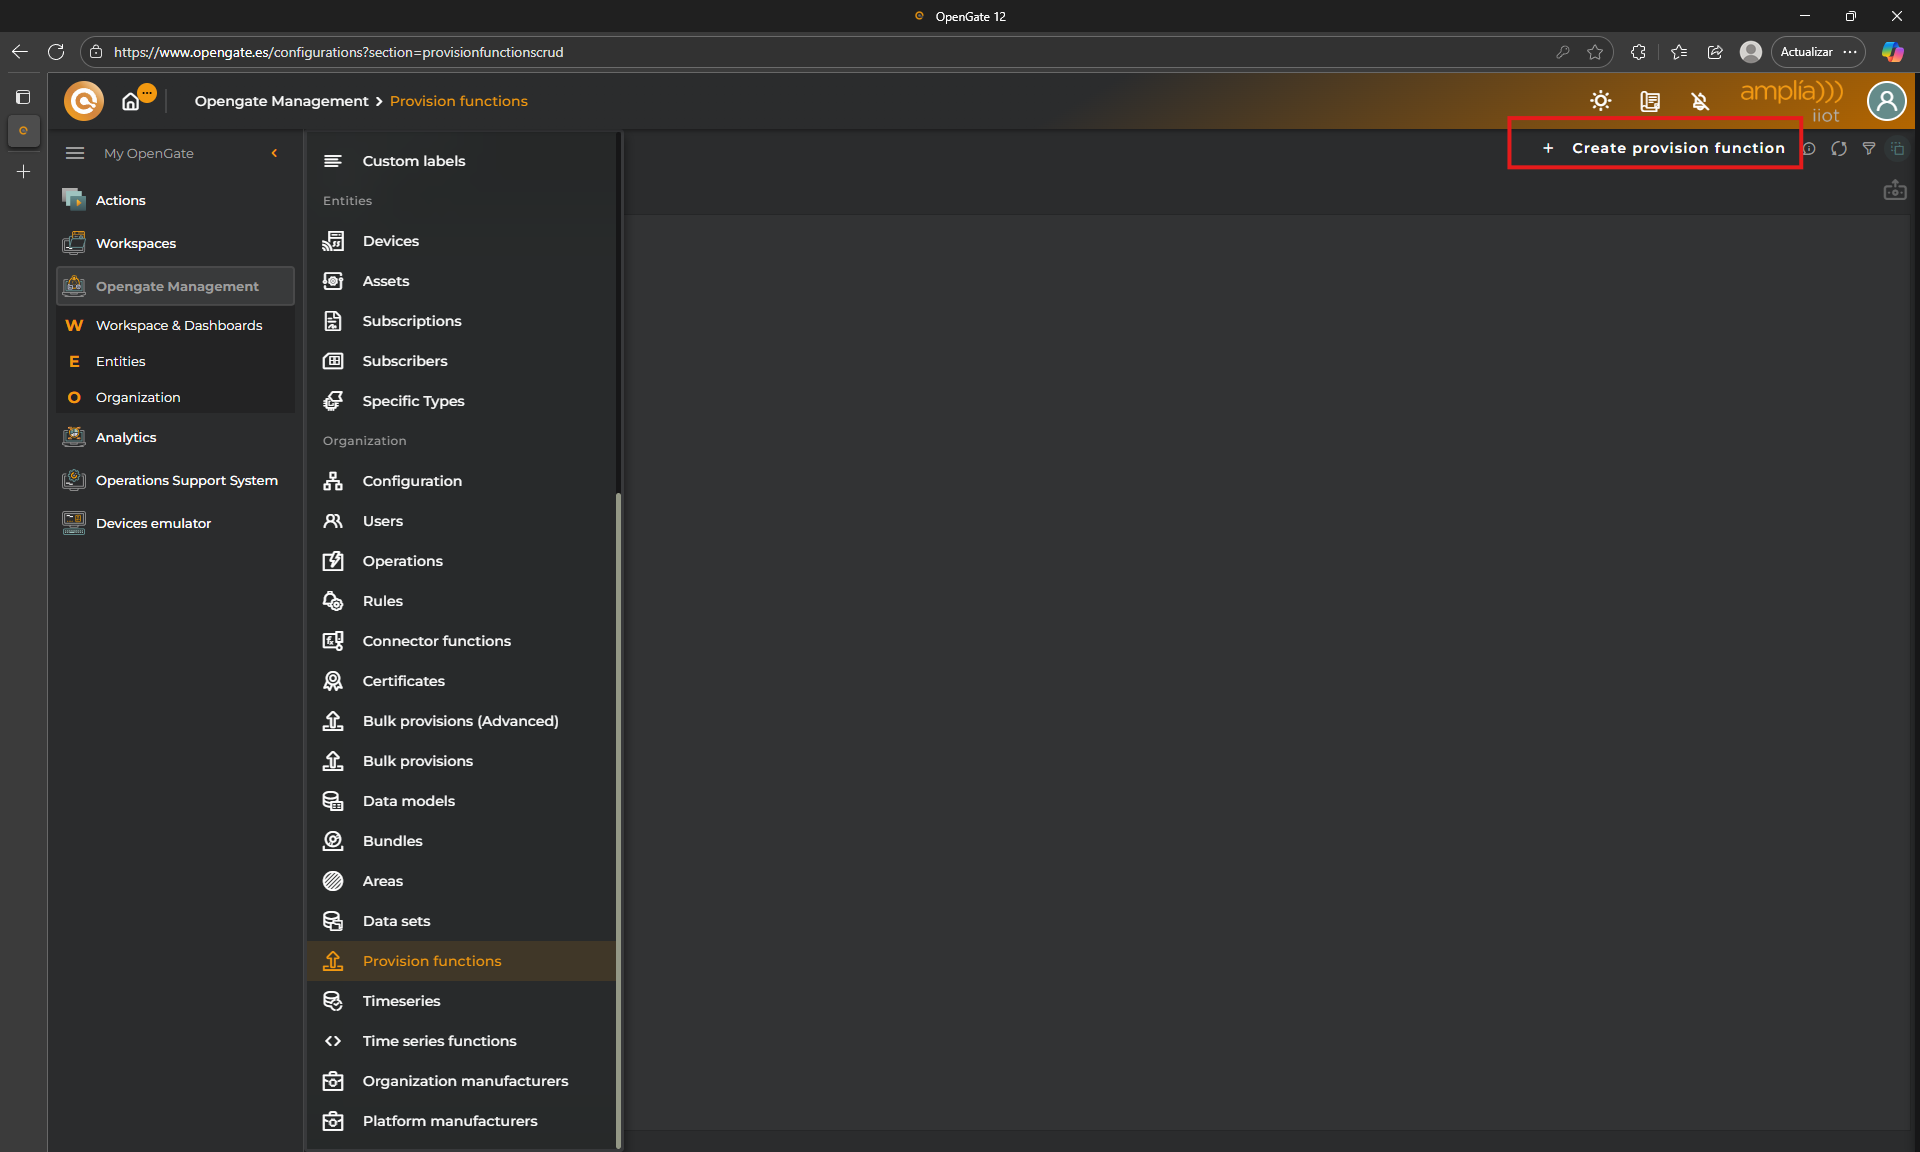
Go to “Opengate Management > Provision functions”, then click on “+ Create Provision Function” and the wizard start
2. Step 1: Administration info
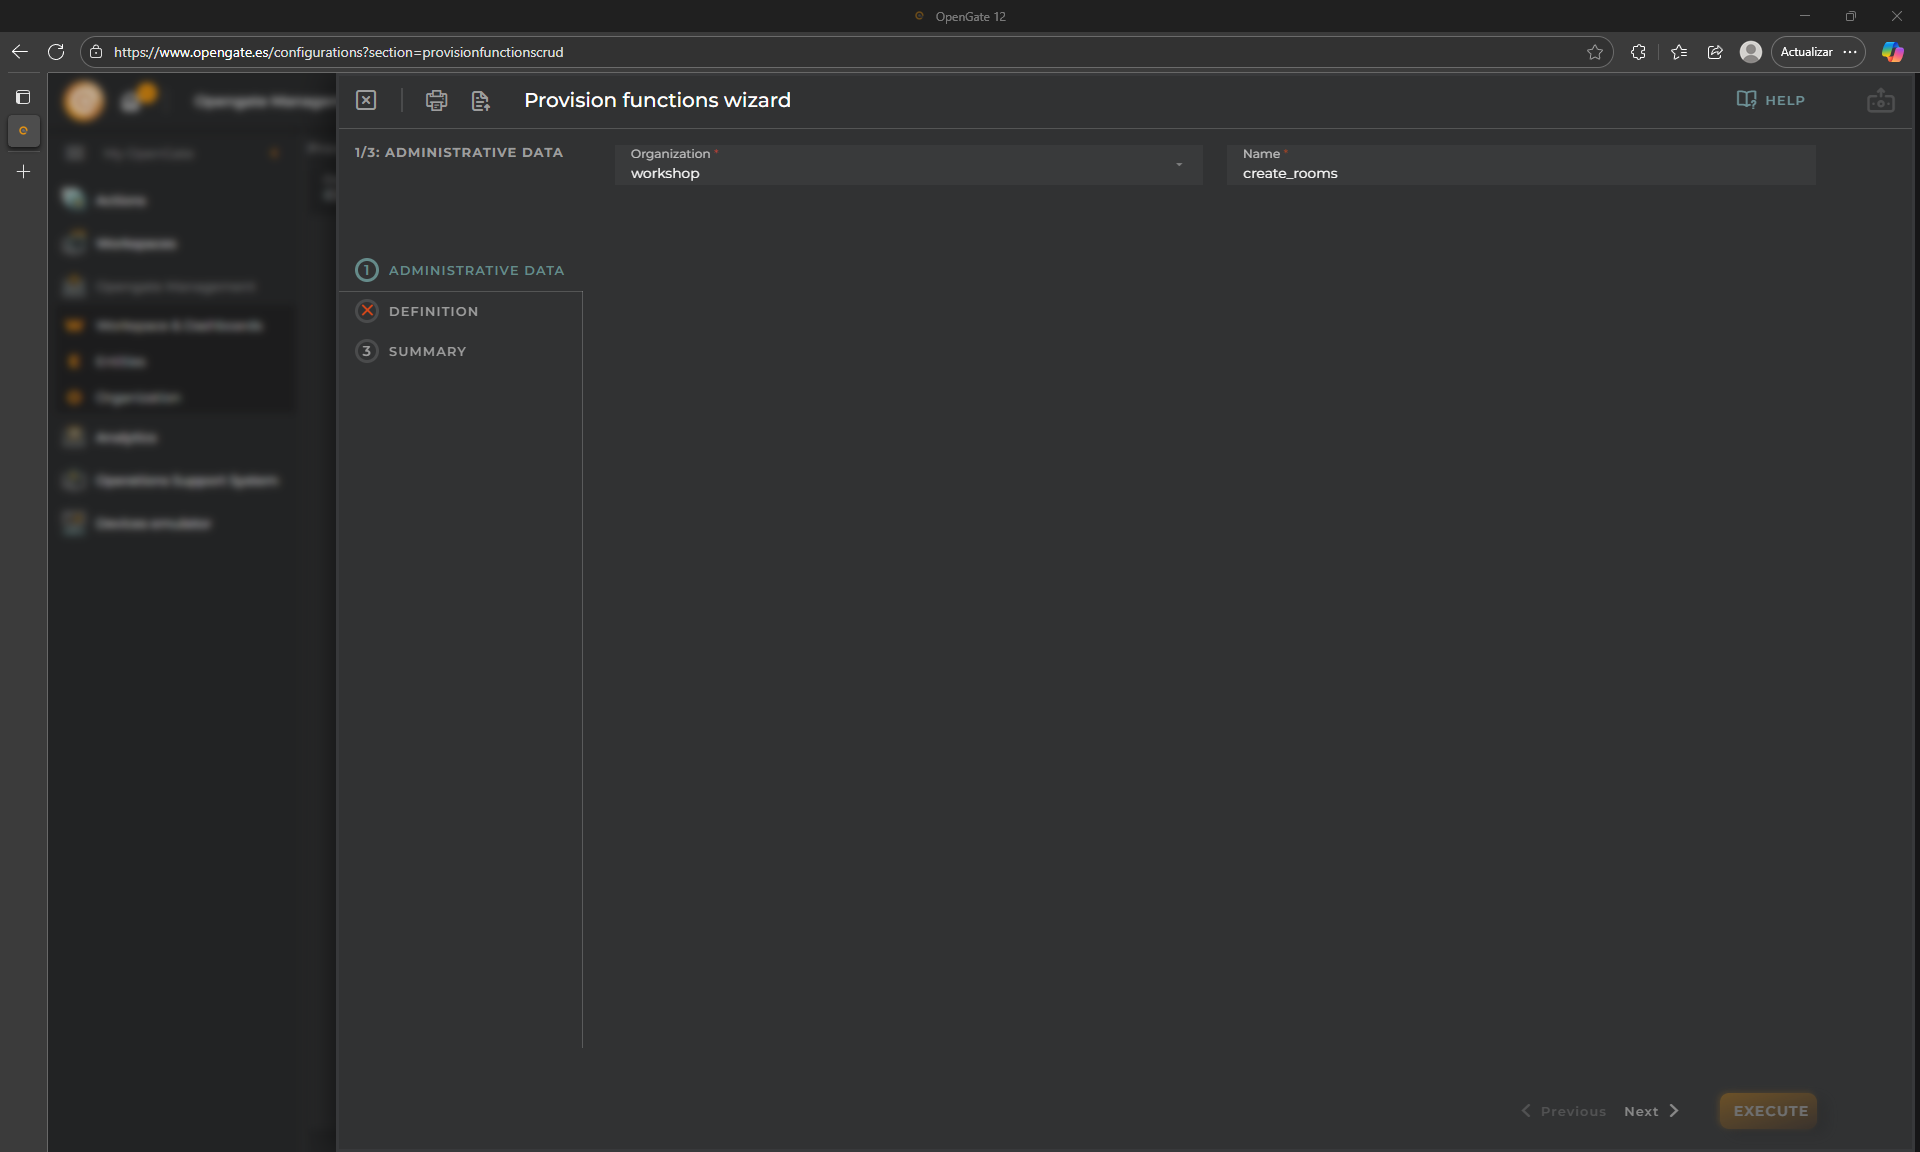
Fill the Name of the Provision Function. For this tutorial, we are going to configure our provision function to create rooms as assets for our warehouse from an excel file, so we call it CreateRooms. This will create as many assets as rows contained in the Excel file during the provision function execution.
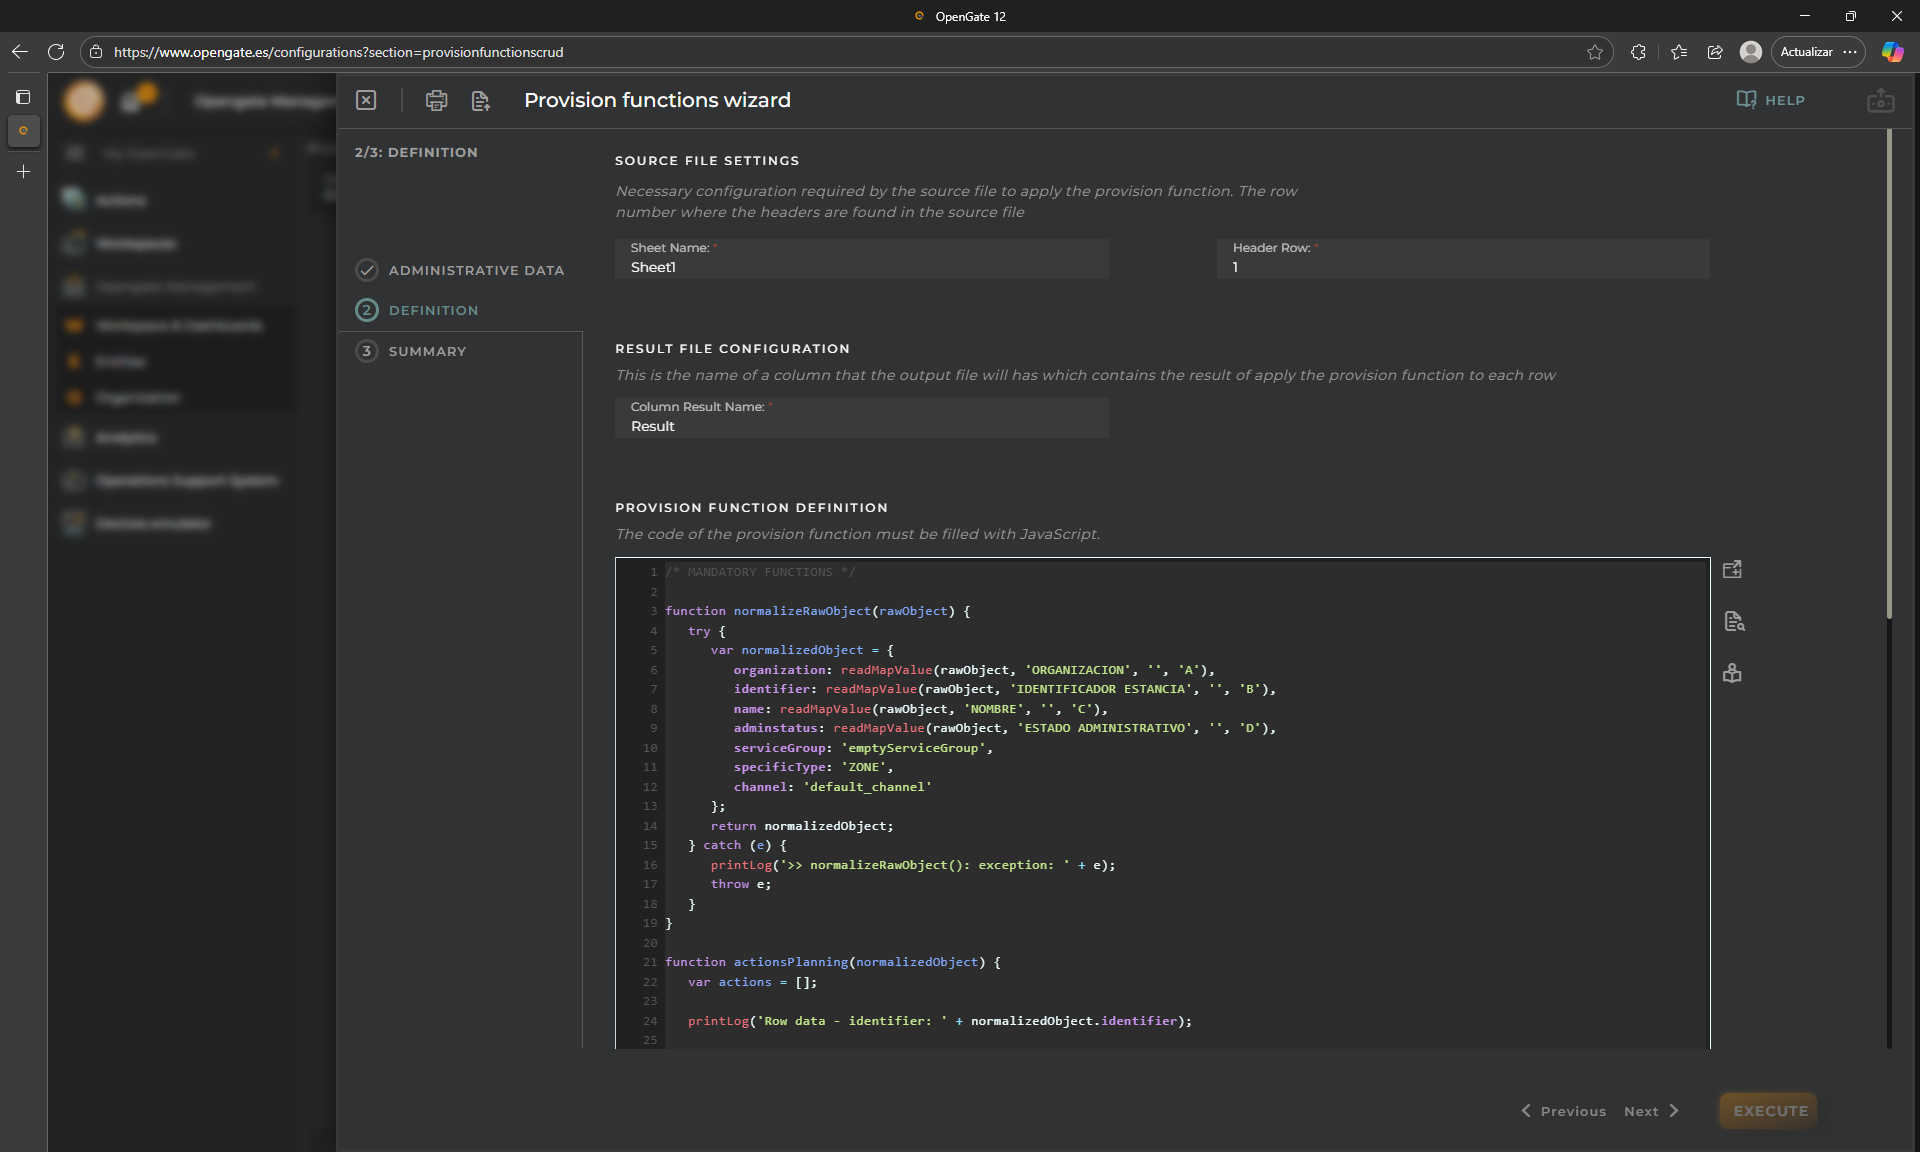
3. Step 2: configure your provision function
Now we are going to create our provision function to create assets…
The OpenGate Provision Functions allows you to use javascript to manipulate the excel file and to do whatever you need during the provision function execution.
The parameters you need to indicate are:
Source file settings: “Sheet Name” of the file, and “Header row” number fo find the data to be used during the provision proccess. Use: Sheet1 and 1
Result file configuration: This is the name of the column where the result of each row will be shown.
Provision function definition: The javascript code to execute within the provision funtion.
To this tutorial, we prepare the code for this provision function that creates rooms as assets, so you can download it and test this functionality:
Copy the following JavaScript and paste into the code box:
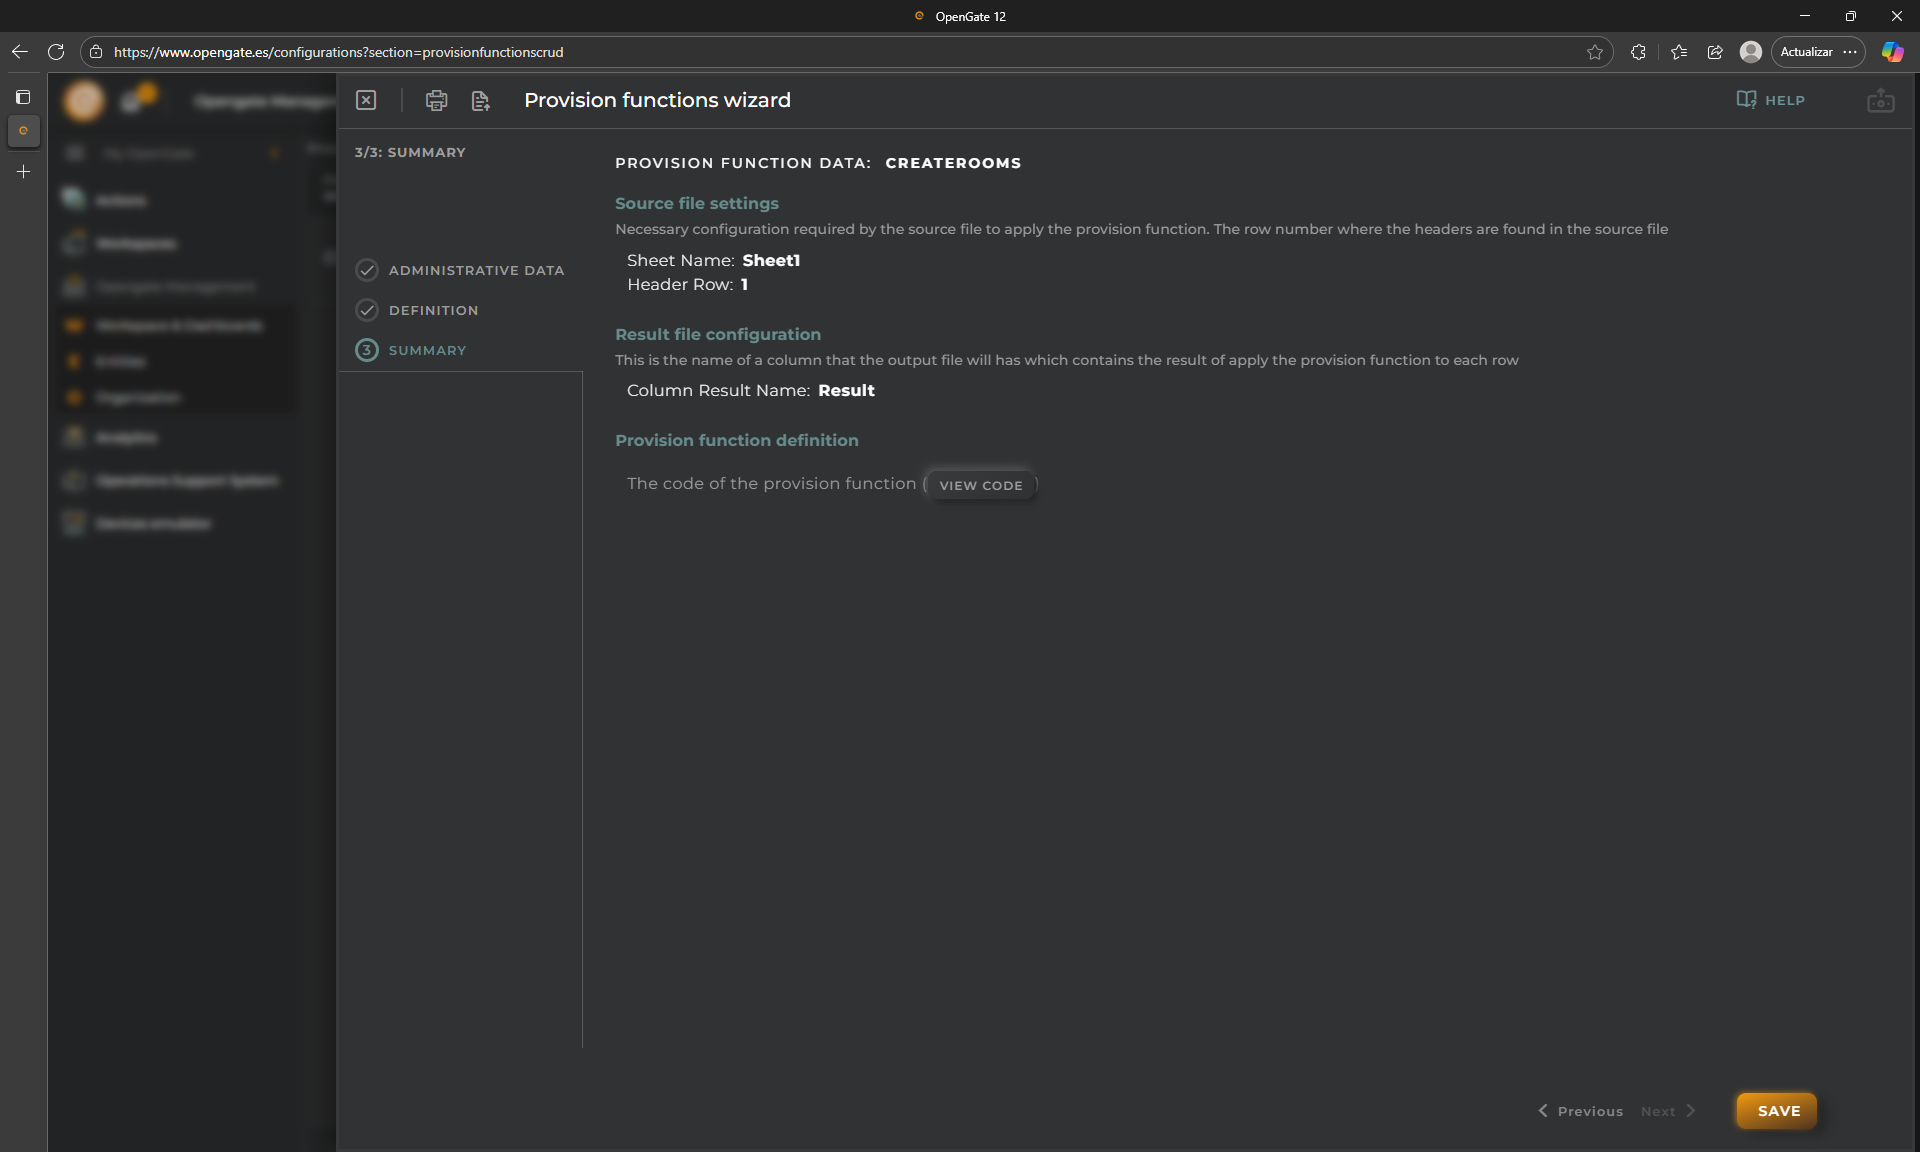
As with the other OpenGate wizards, the final step always shows you the summary of what you configured to confirm and the “EXECUTE” option.
👏 You created your first provision function!
5. Using the provision function:
Now that we have our provision function, let’s use it to create our assets that represents the rooms of our warehouse:
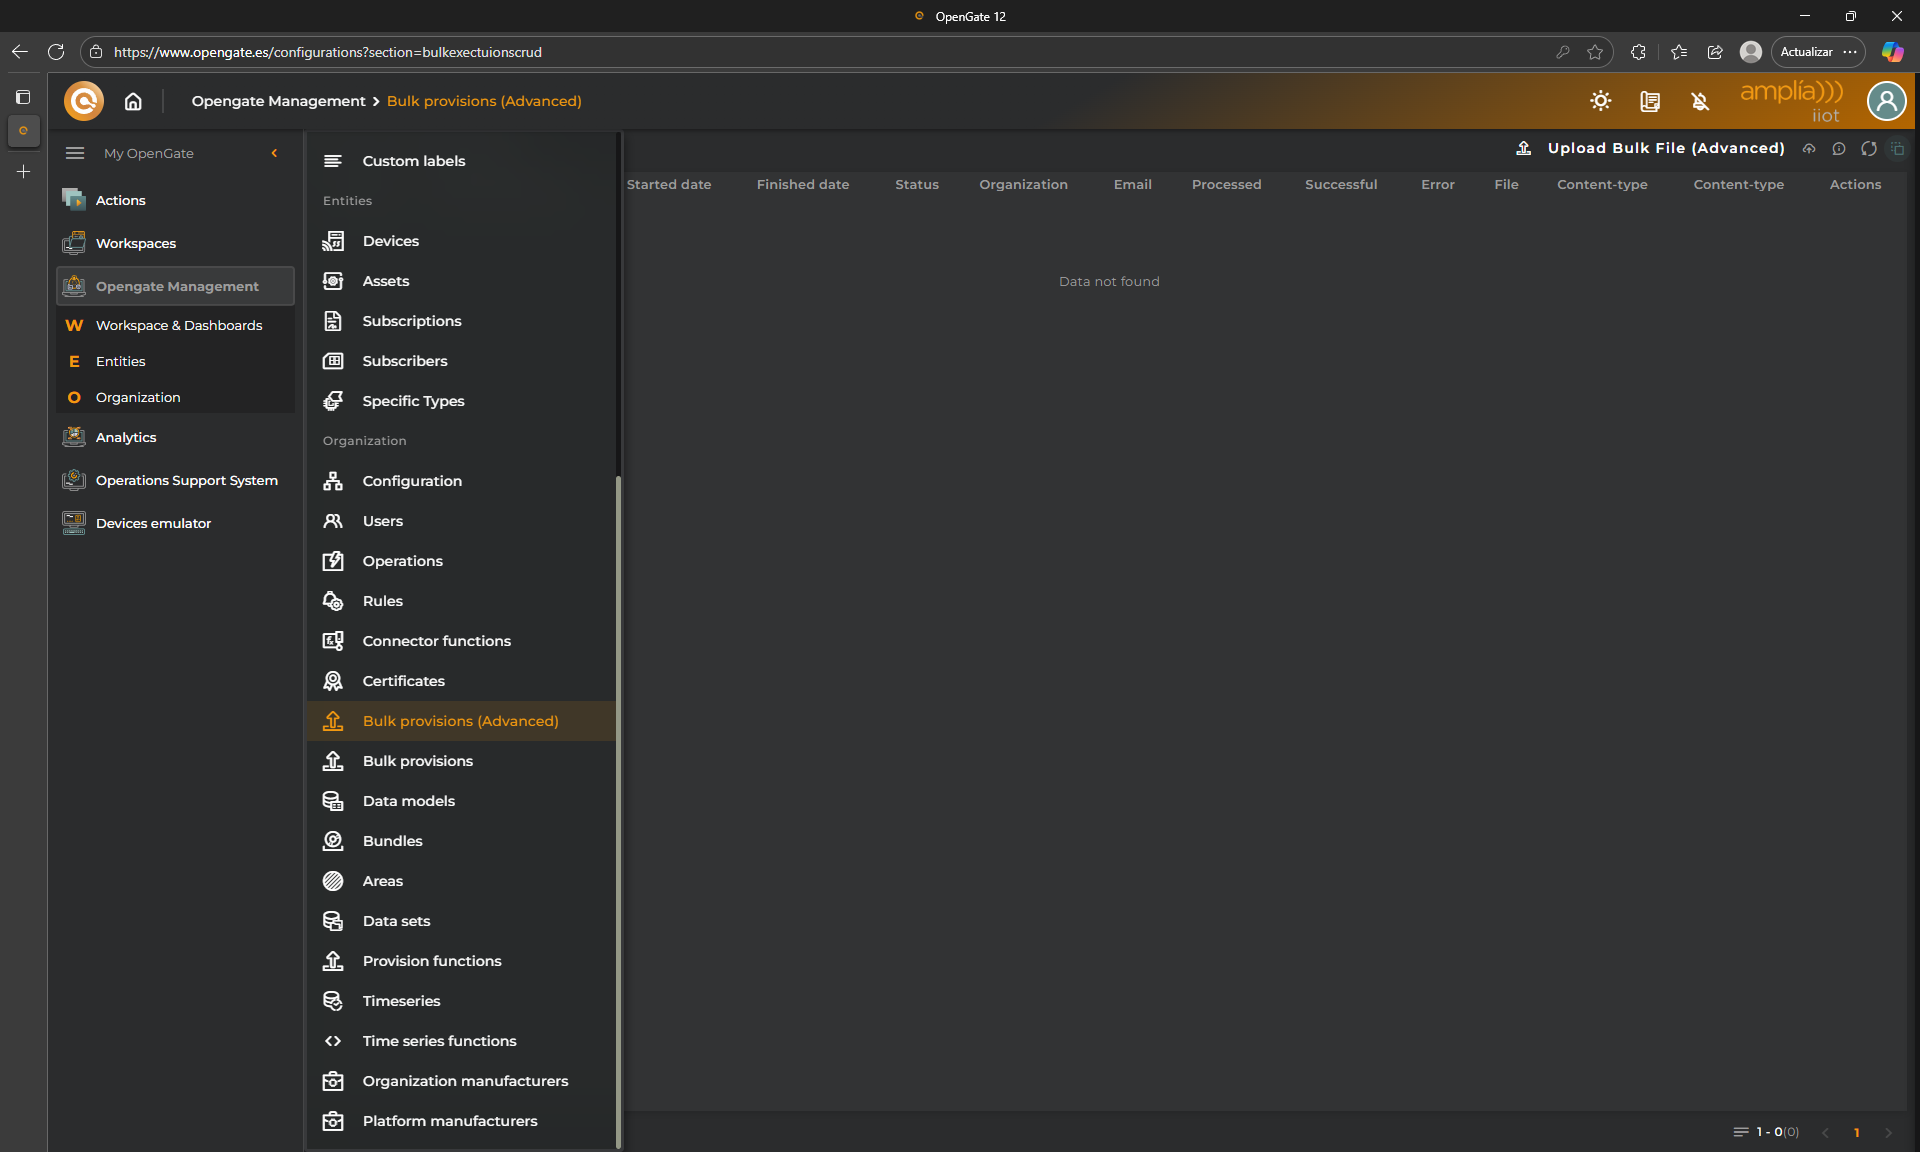
5.1 Go to “OpenGate Management > Bulk provisions (Advanced)” and click on “Upload Bulk File (Advanced)”
This opens the wizard to execute a provision function process
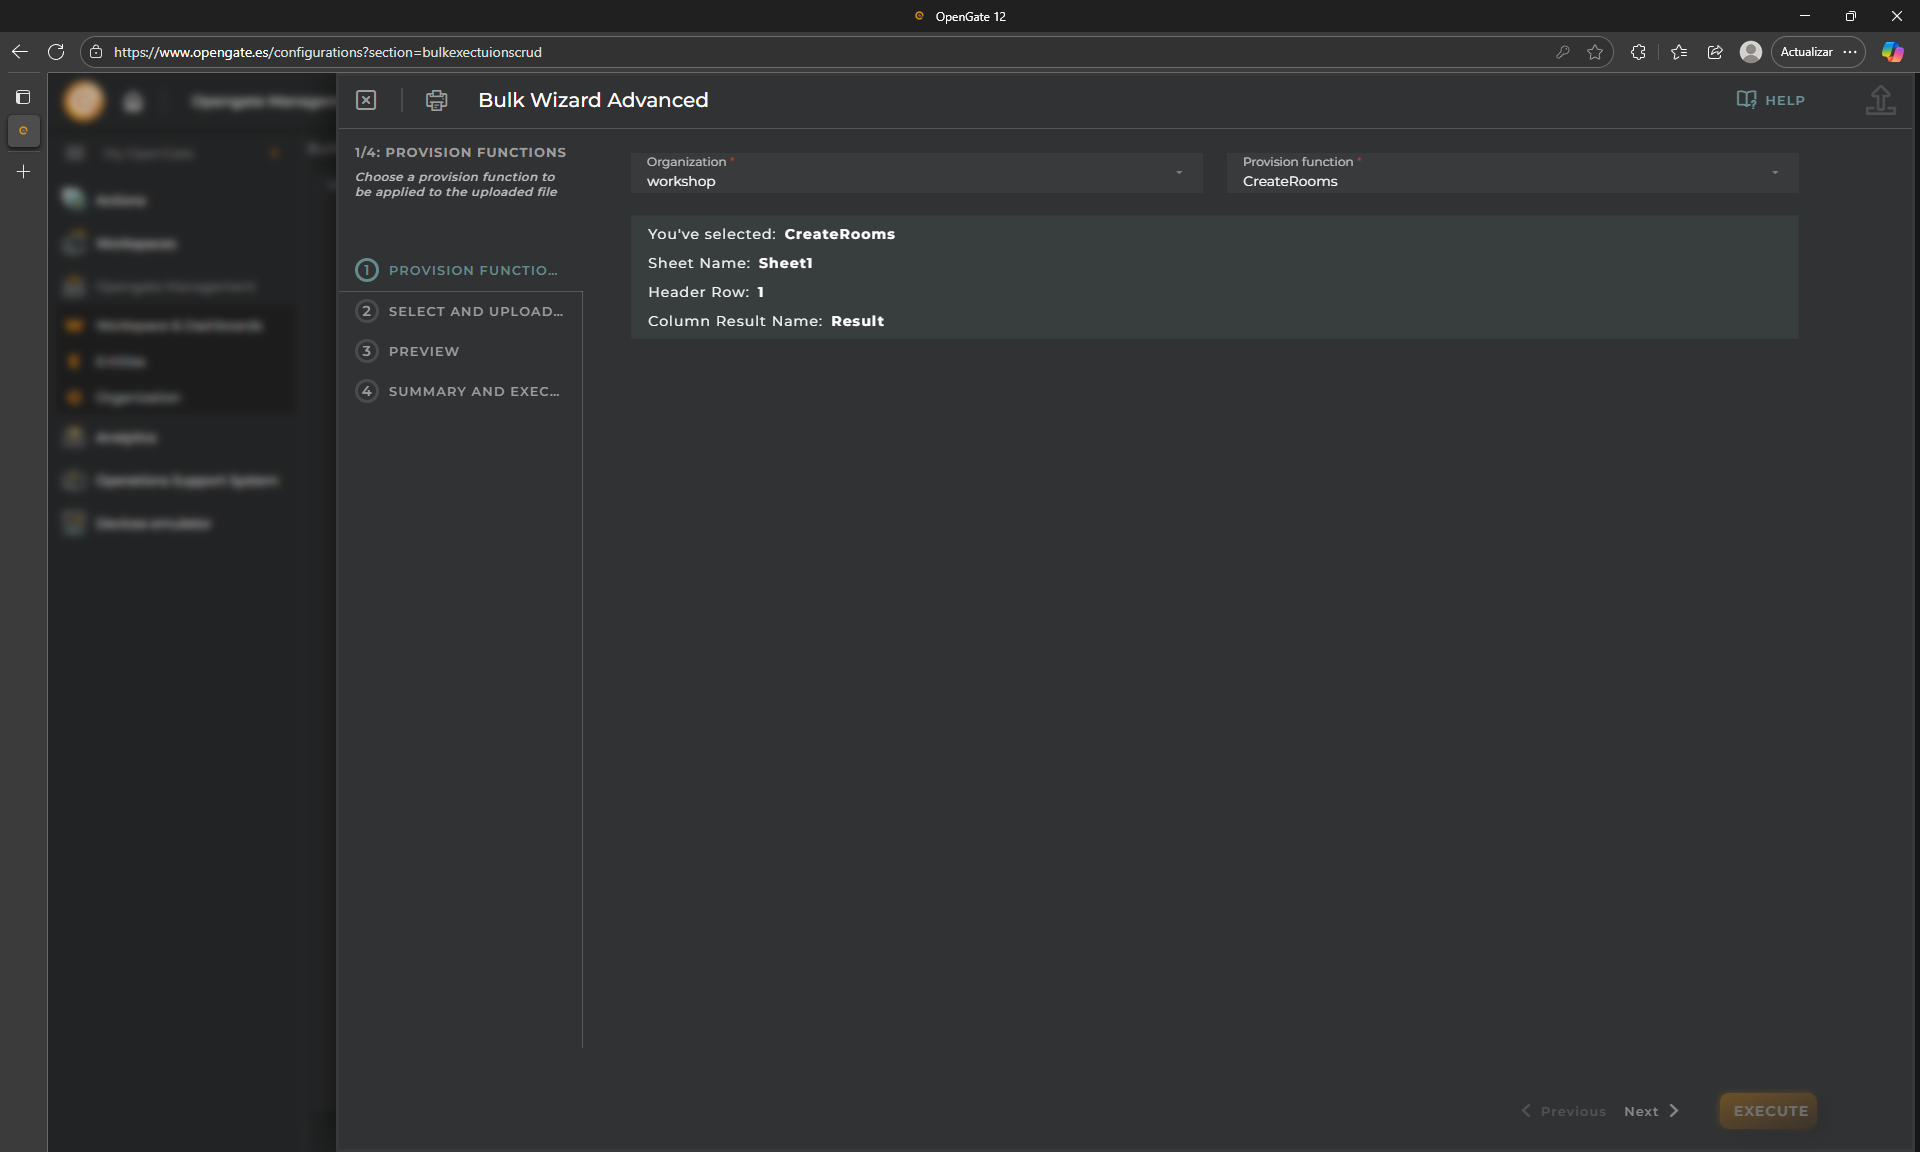
5.2 Step 1: Choose our Provision Function
Choose our new provision function “CreateRooms”
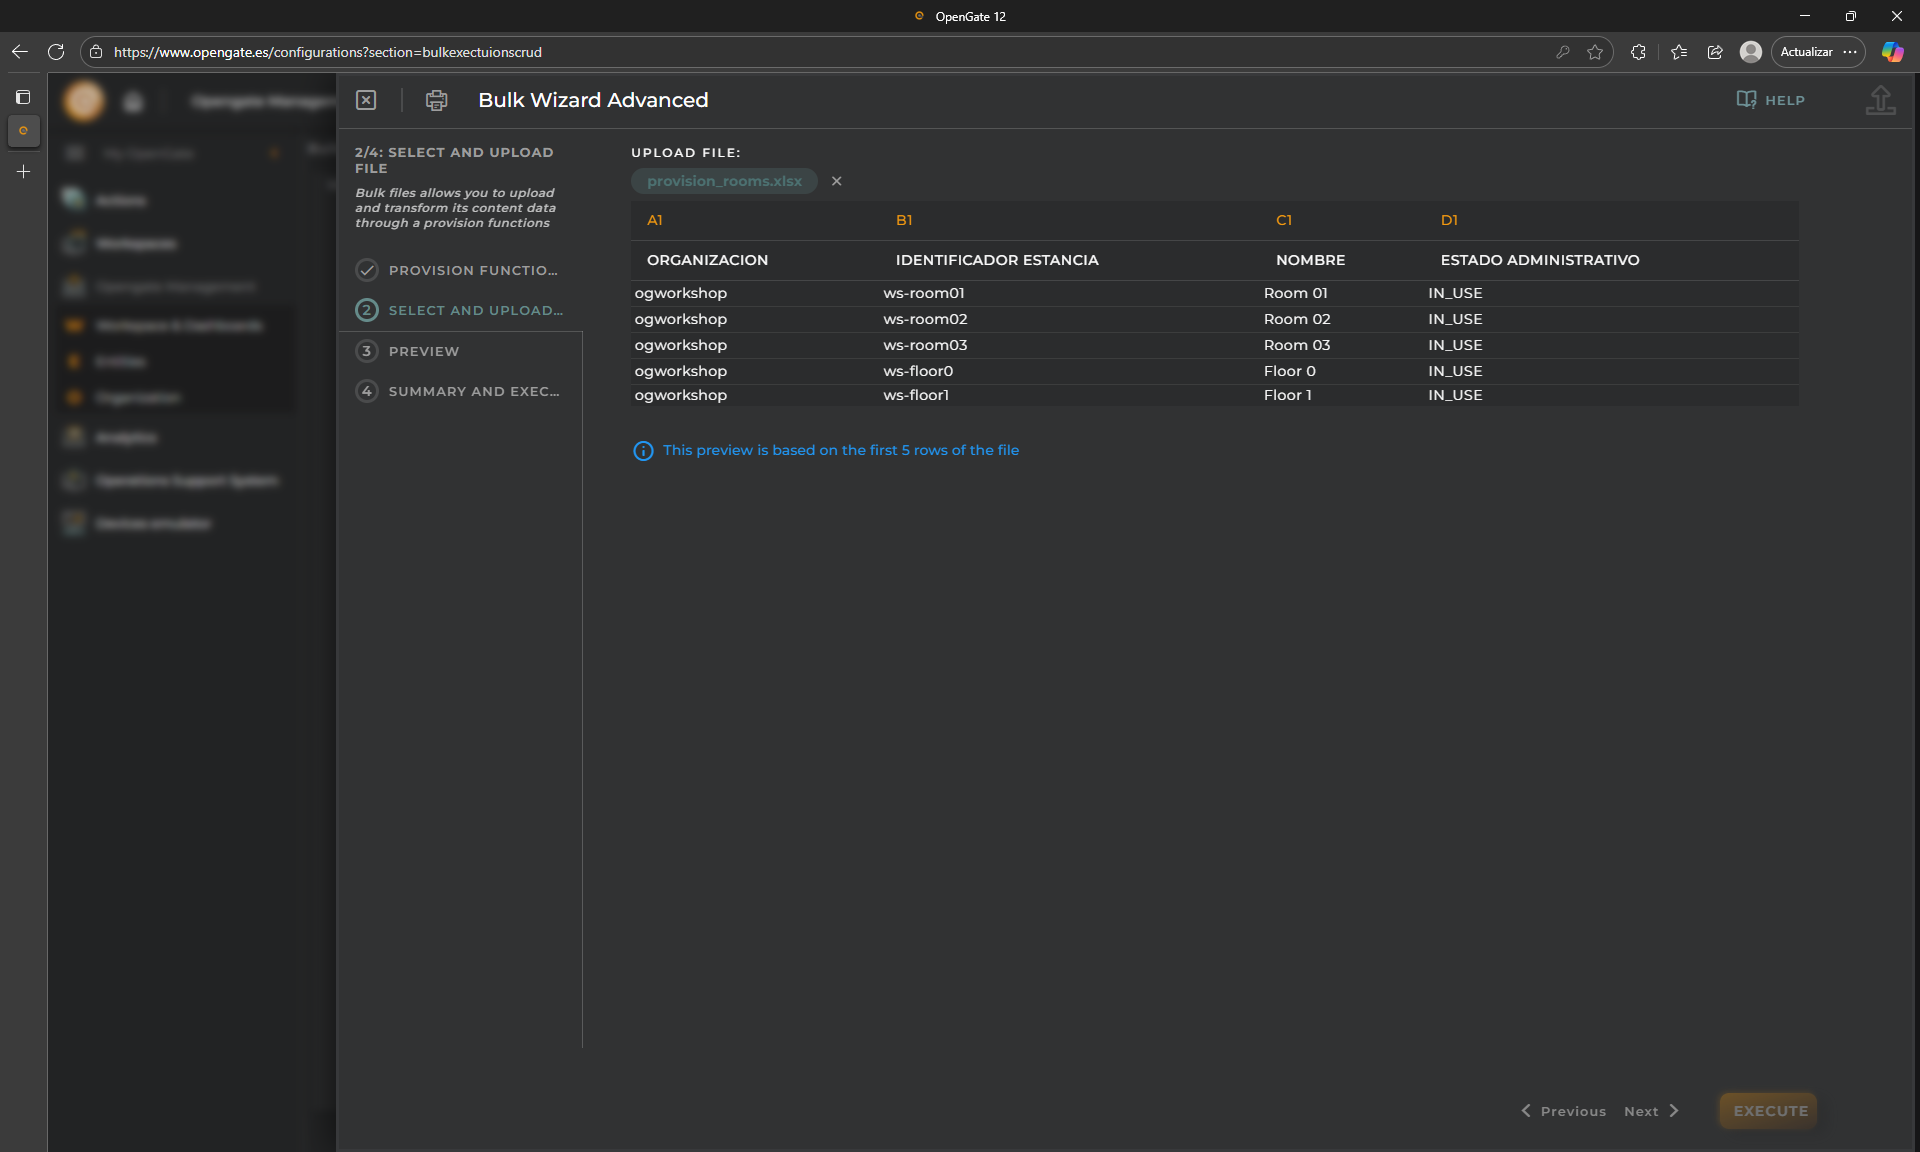
5.3 Step 2: Upload your file
Use the file 🗒️provision_rooms.xlsx. This file contains some rooms to be populated into our OpenGate.
⚠️IMPORTANT: Please edit them and change [YourPrefix] and [YourOrganization] with your values
After upload the file, you will see the first rows as preview
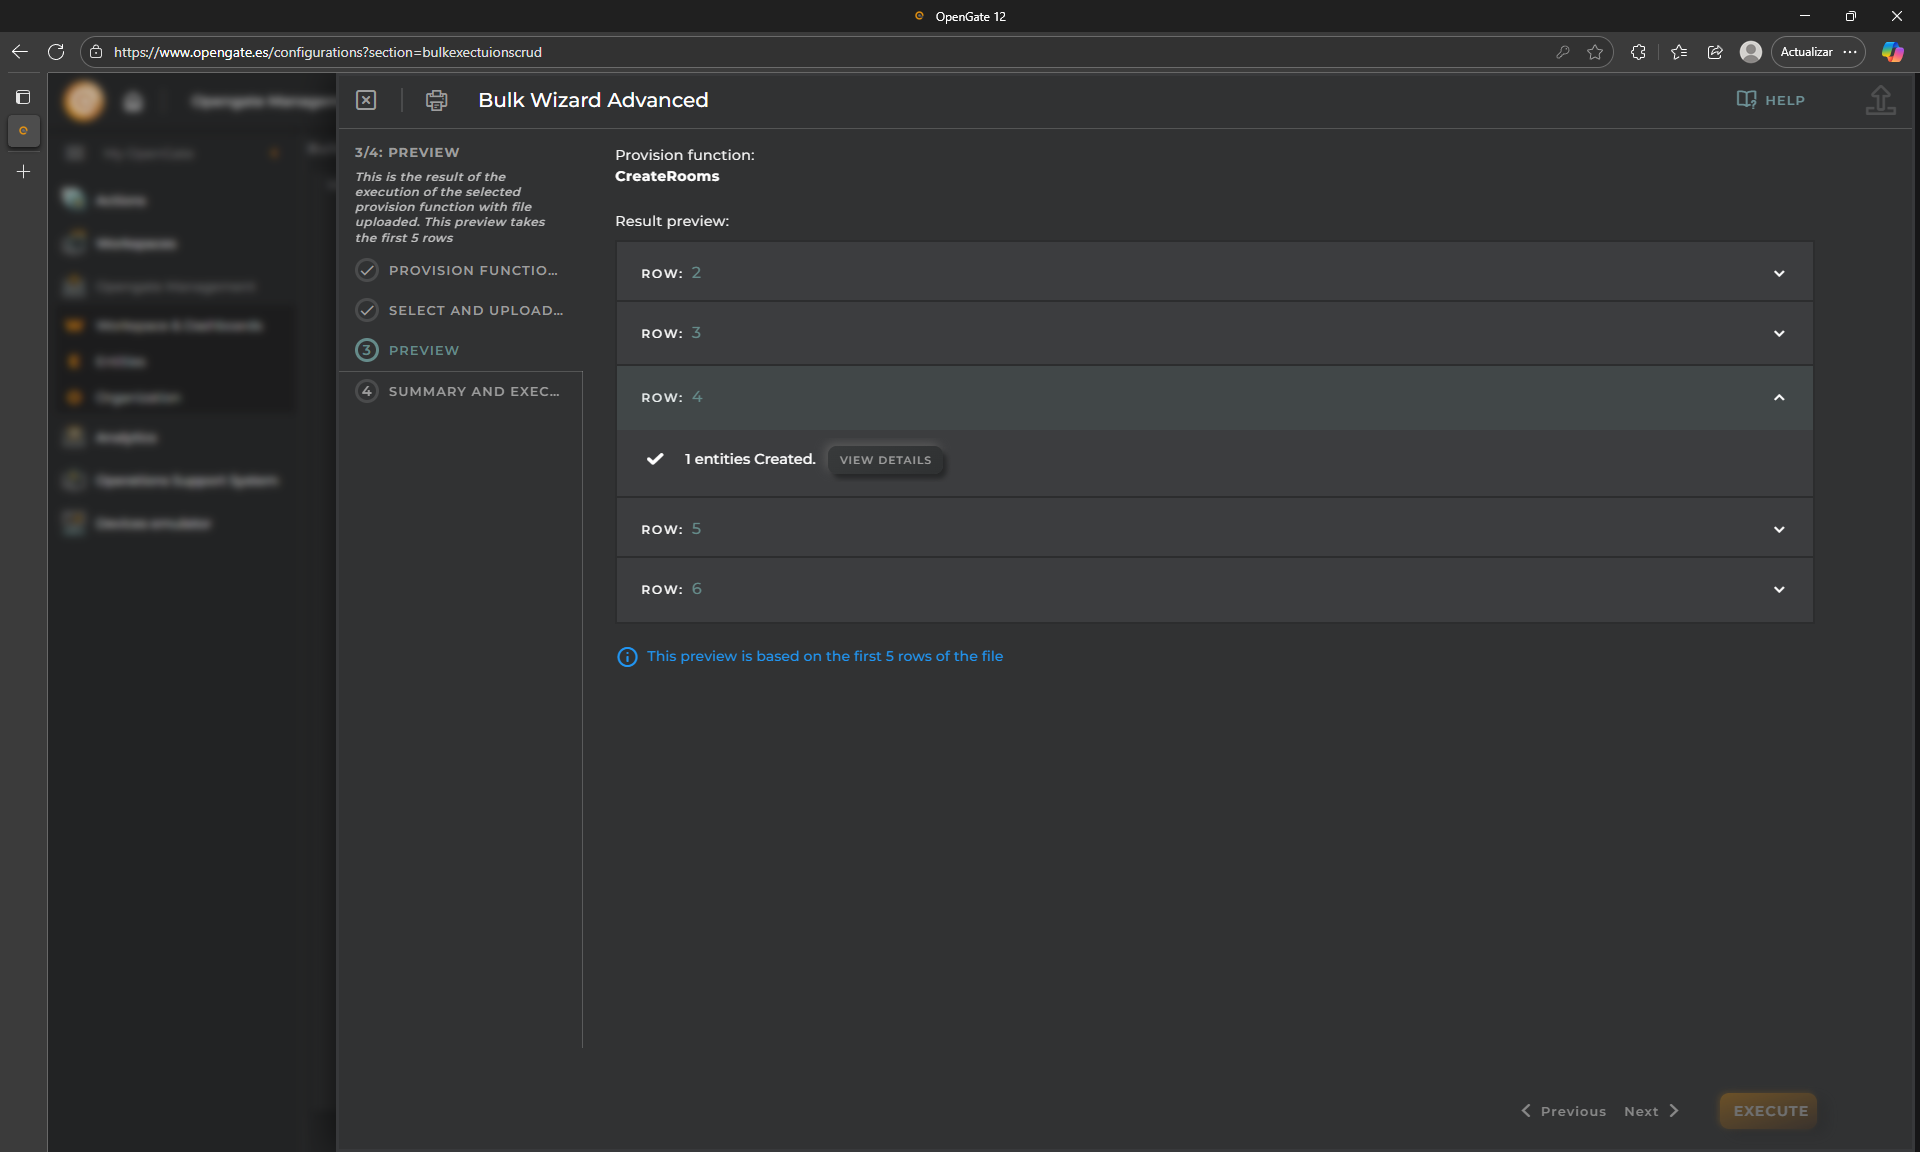
5.4 Step 3: Preview results
Because this is a critical functionality, this step allows you to check as preview what the provision function selected will do with the first rows.
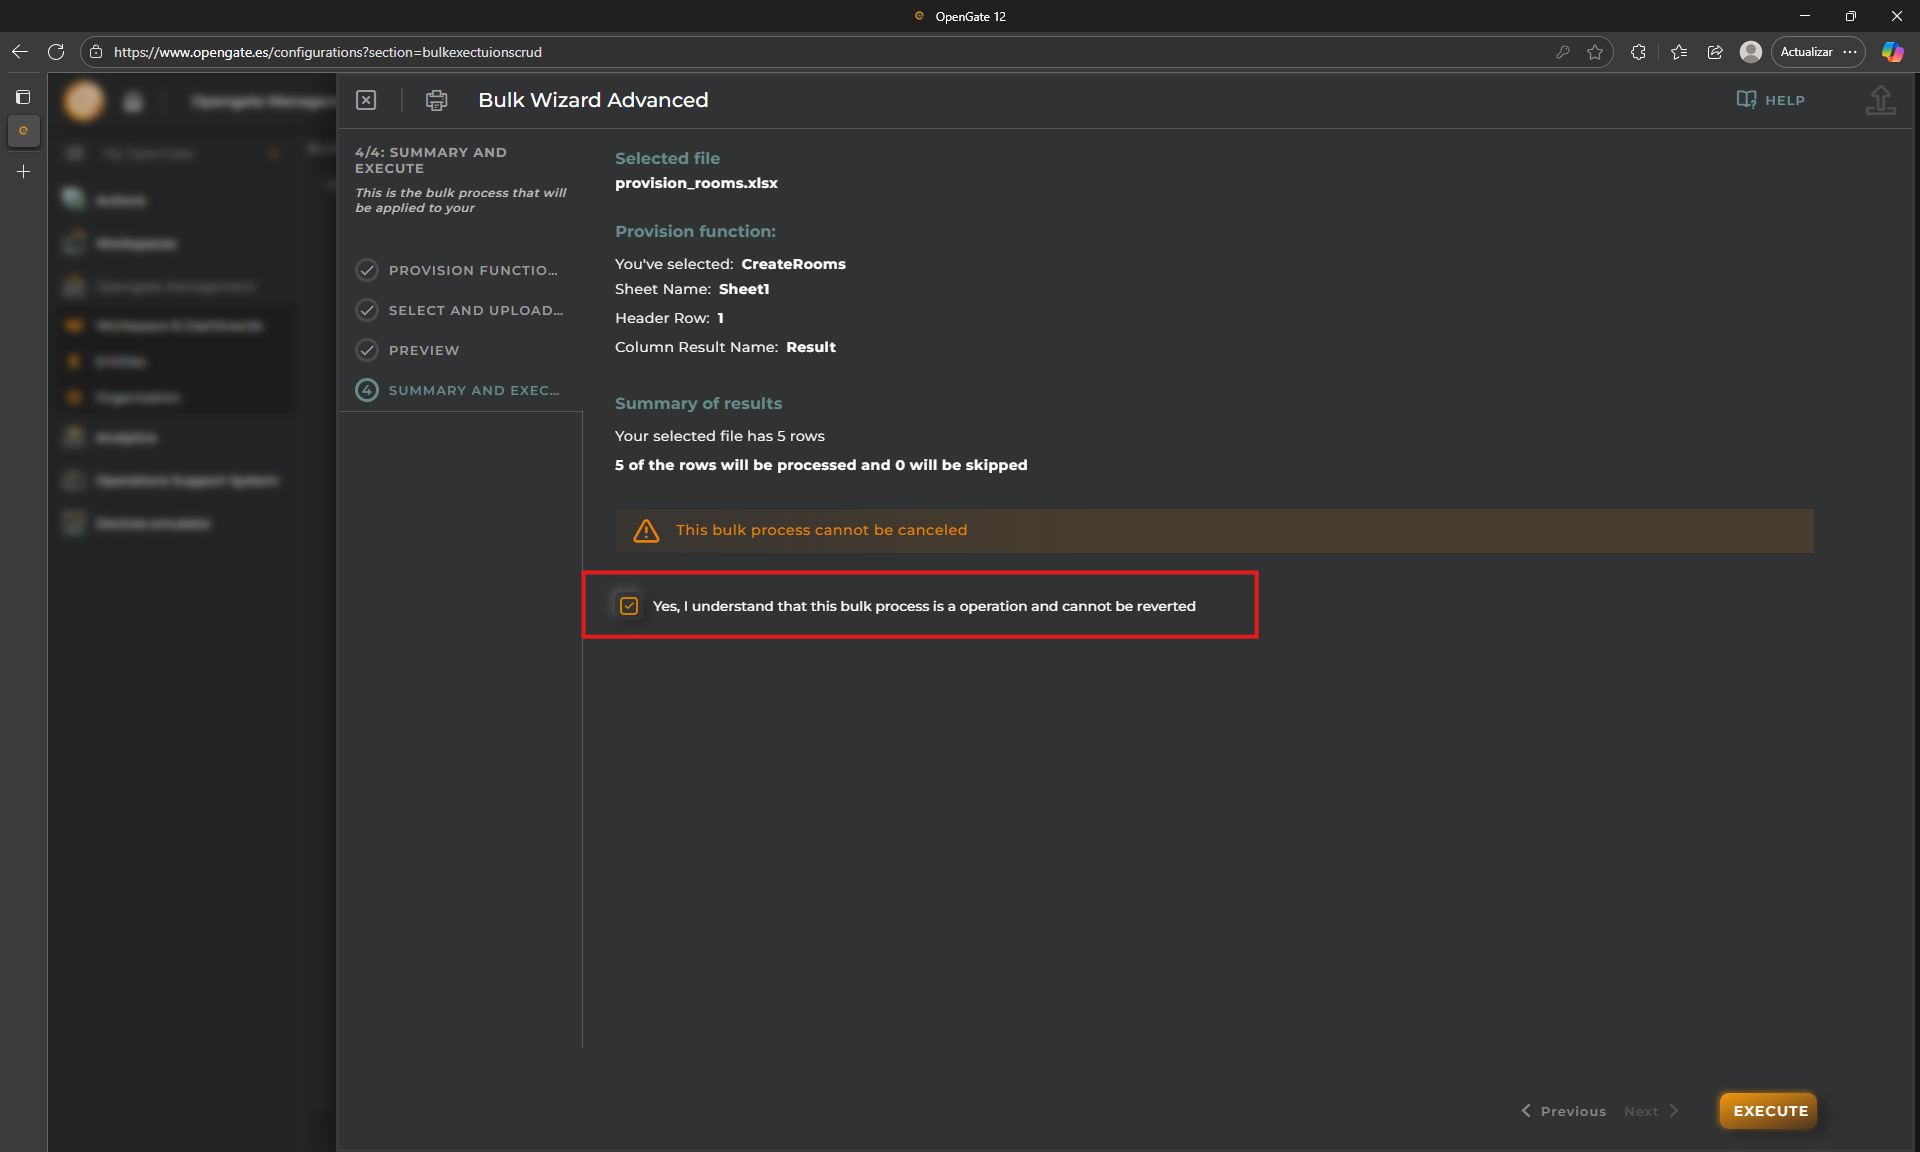
5.5 Step 4: confirmation
We want to repeat this… Because this is a critical functionality, you must check the doble confirmation before click on “EXECUTE”
6. Check the process result
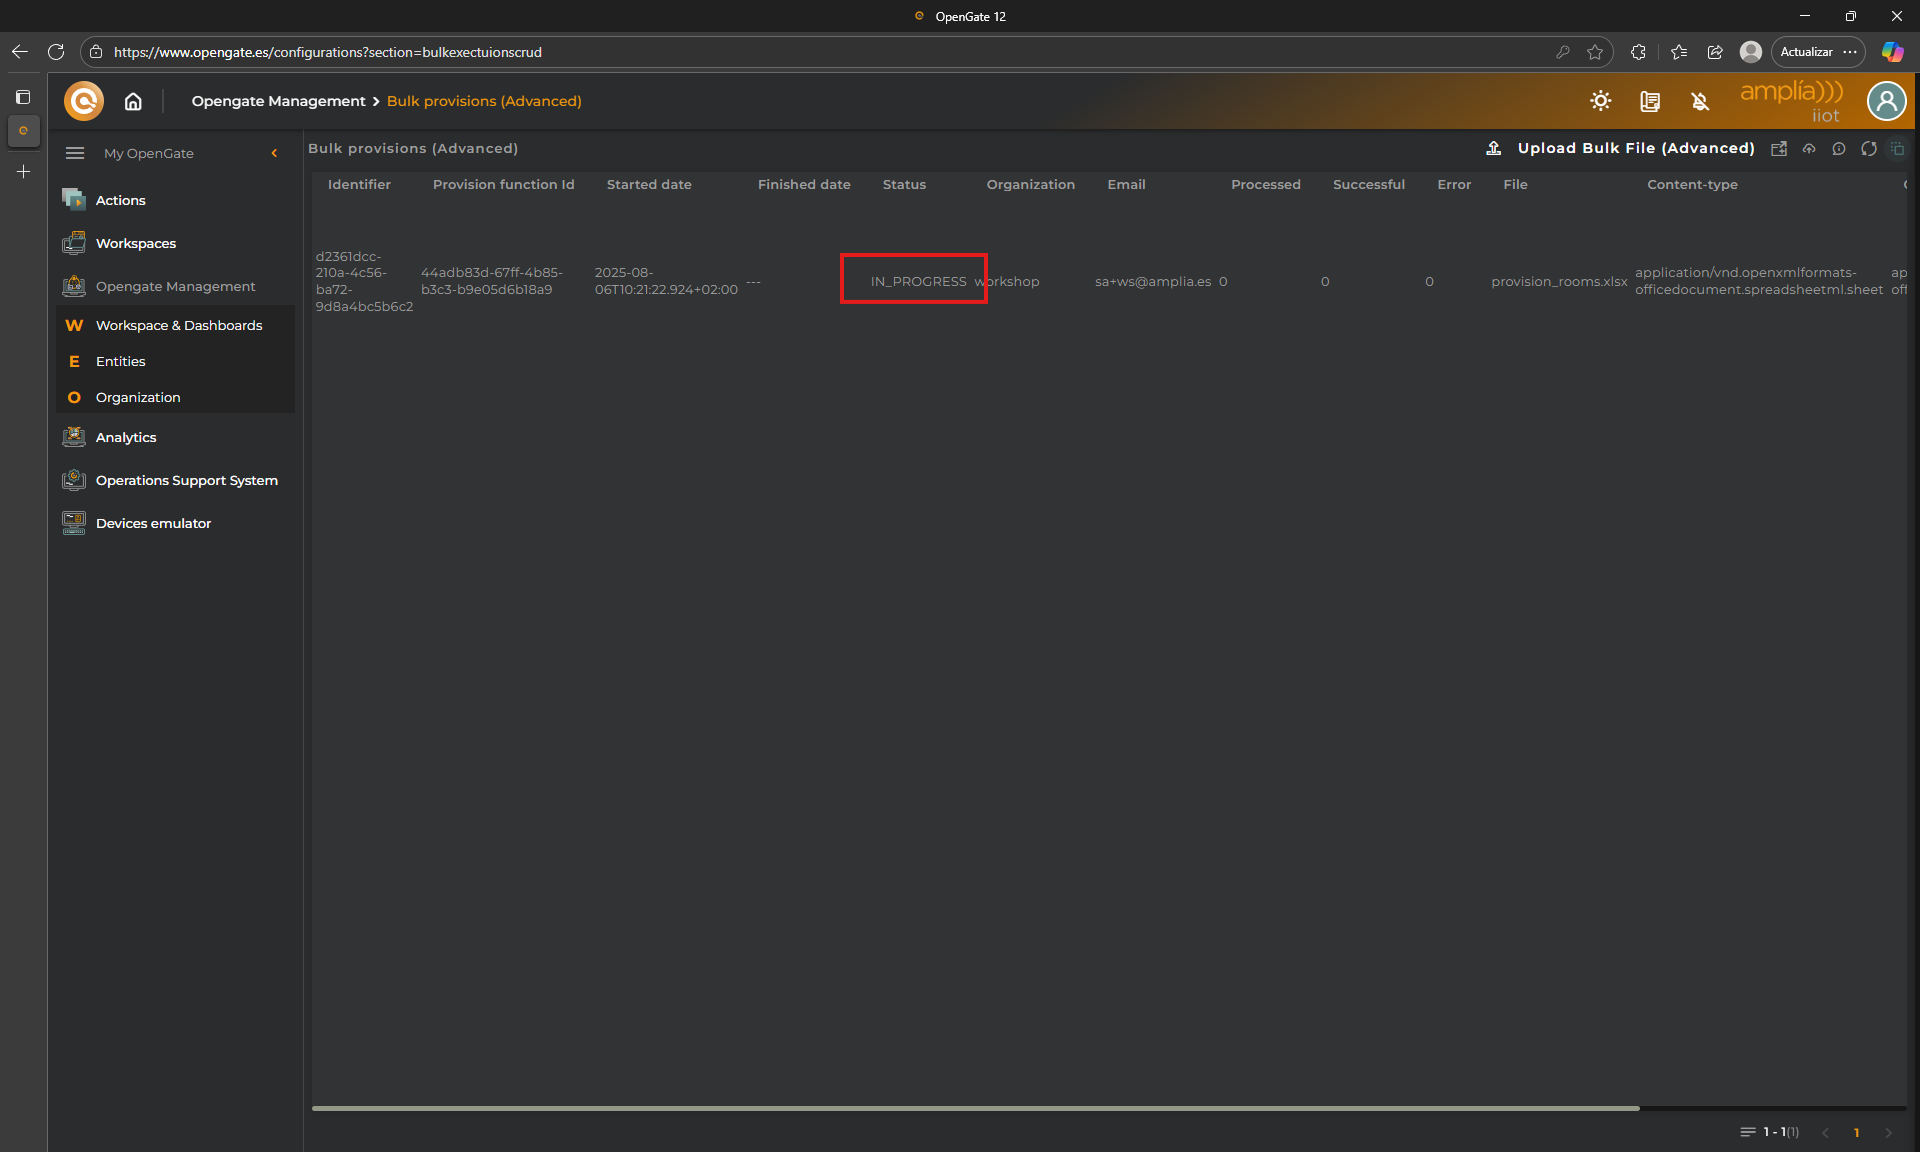
The execution of a Provision function may take some minutes depending on the actions, rows and so on. For that, the process will execute in background and the execution is shown on the screen, Check that the status is “IN_PROGRESS”
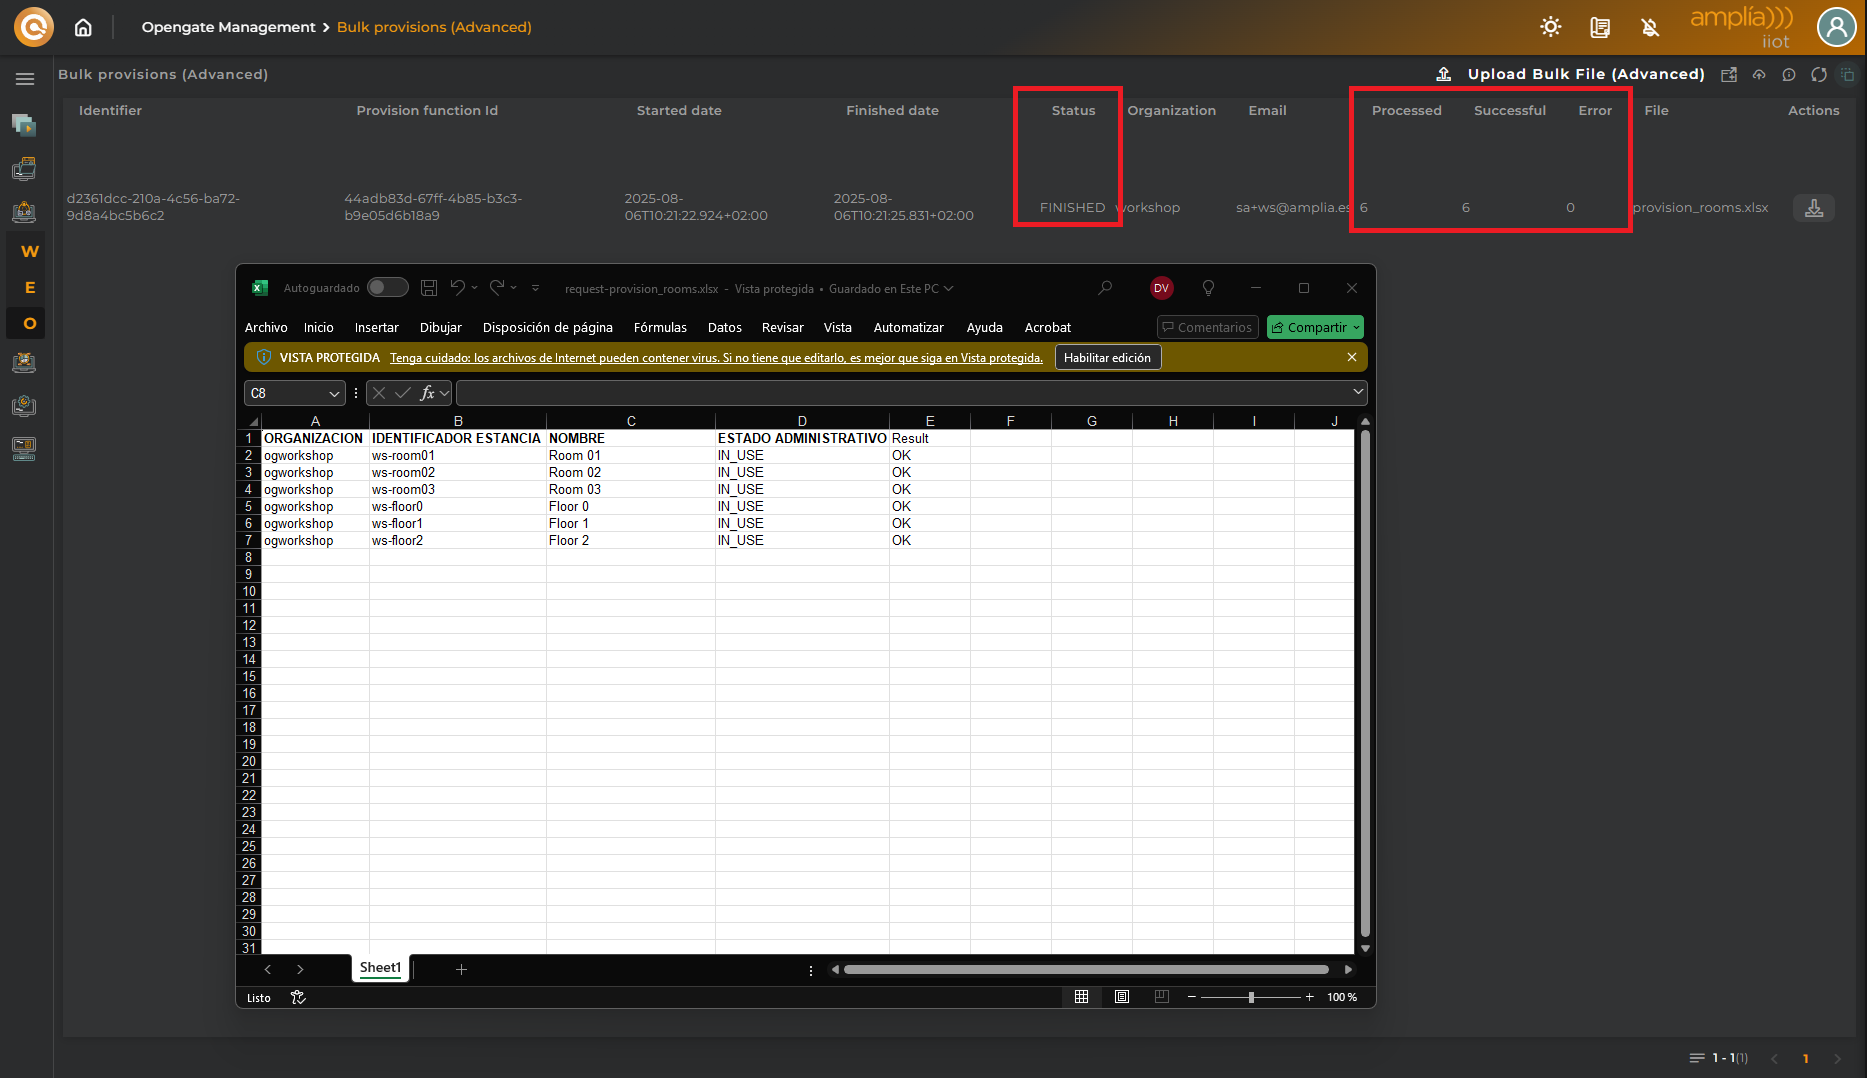
Click on refresh to check if the process is “FINISHED” and check the results on columns “Processed”, “Successfull” and “Error”.
Remember, you can download the result file to check the process row by row. You will se something like this:
🚀 When to use this method:
Perfect for mass onboarding, data migrations, or applying business logic during entity creation and modification, o even to delete groups of entities.
🏗️ Continue the tutorial
To finish the tutorial properly, use the method you prefer, wizard or bulk creating another provision function, to create the entities containted in this files:
🗒️prov_function_sensors.js: This contains the javascript code of the provision function to populate sensors and link them (as related entity) to the assets created previously.
🗒️provision_rooms.xlsx: This file contains some rooms for our warehouse that will represent our facilities for the tutorial.
🗒️provision_sensors.xlsx : Here you can find the devices that will be assigned to the different rooms
Check our new entities
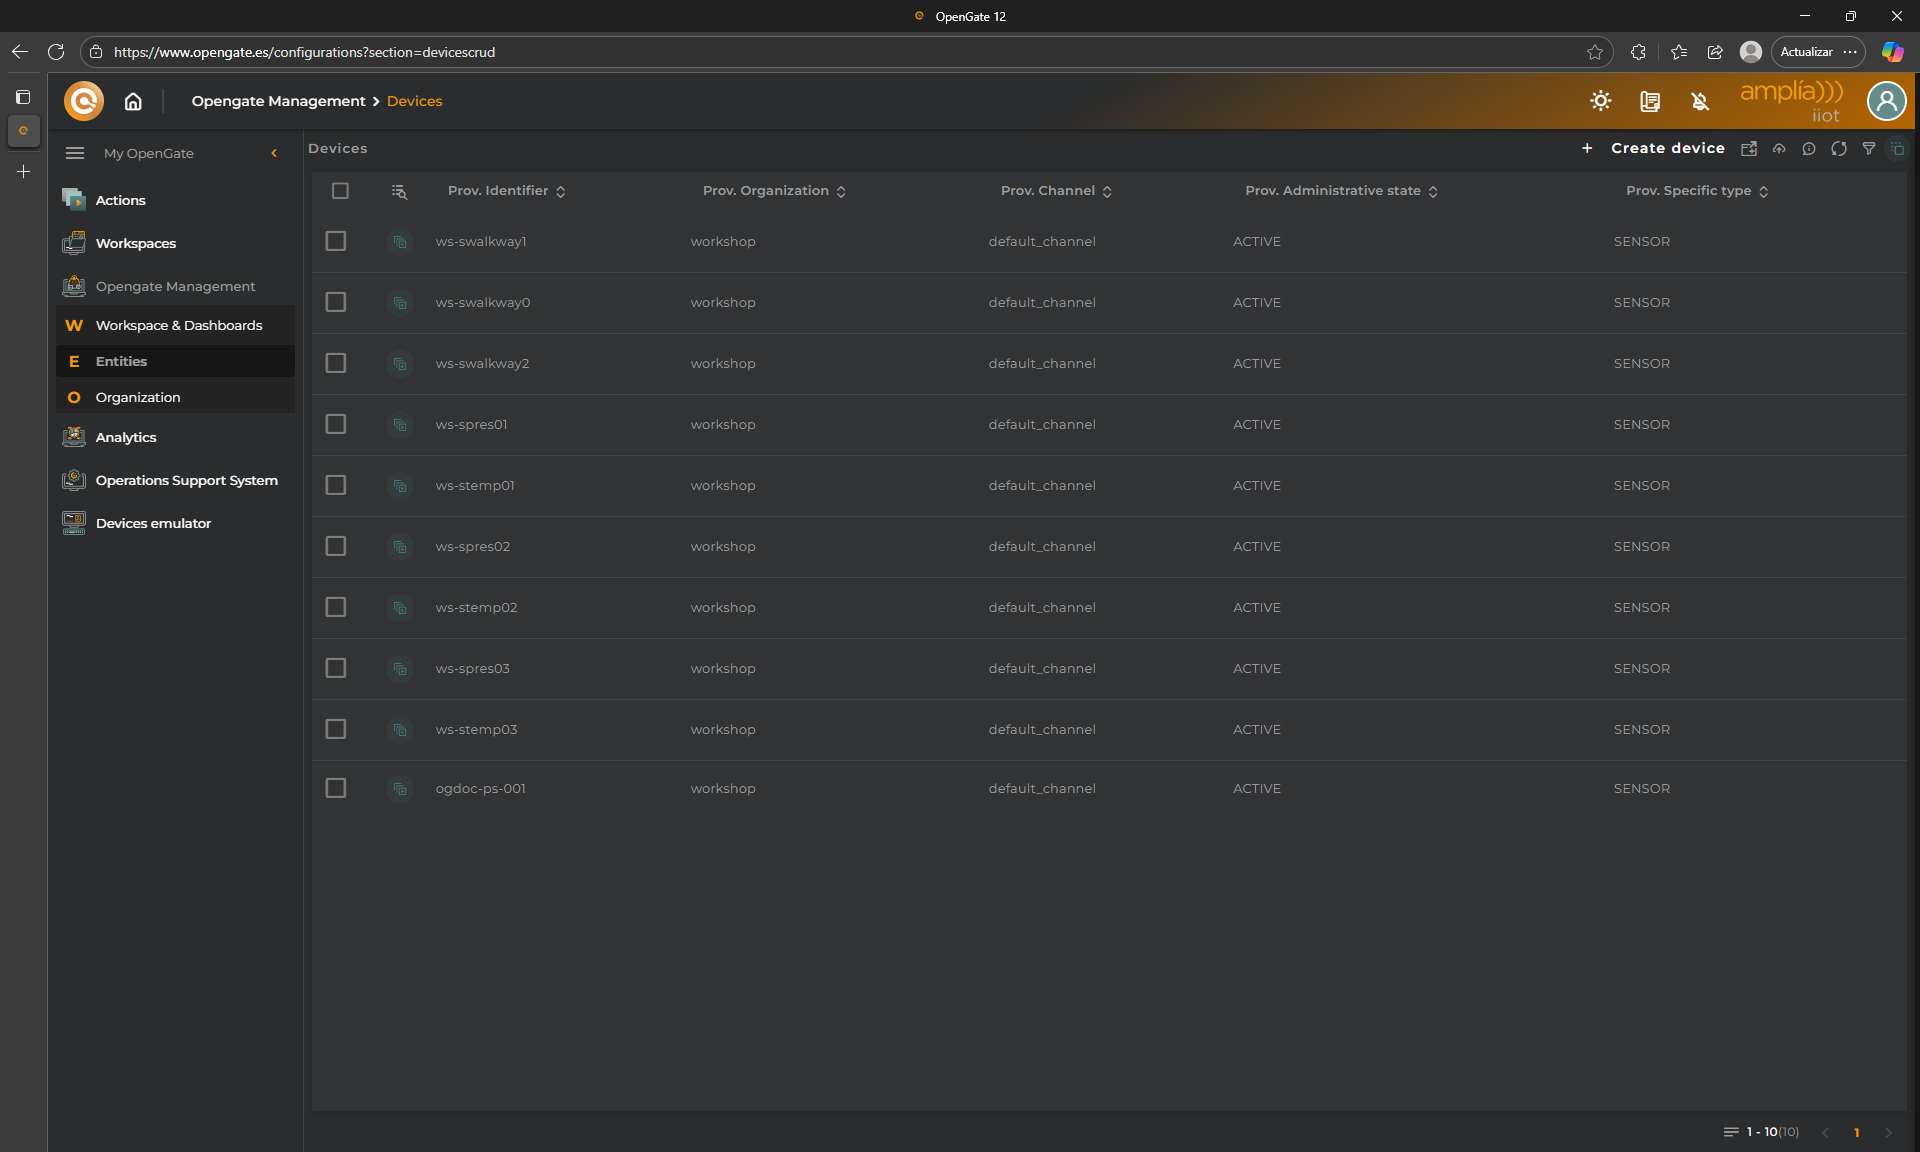
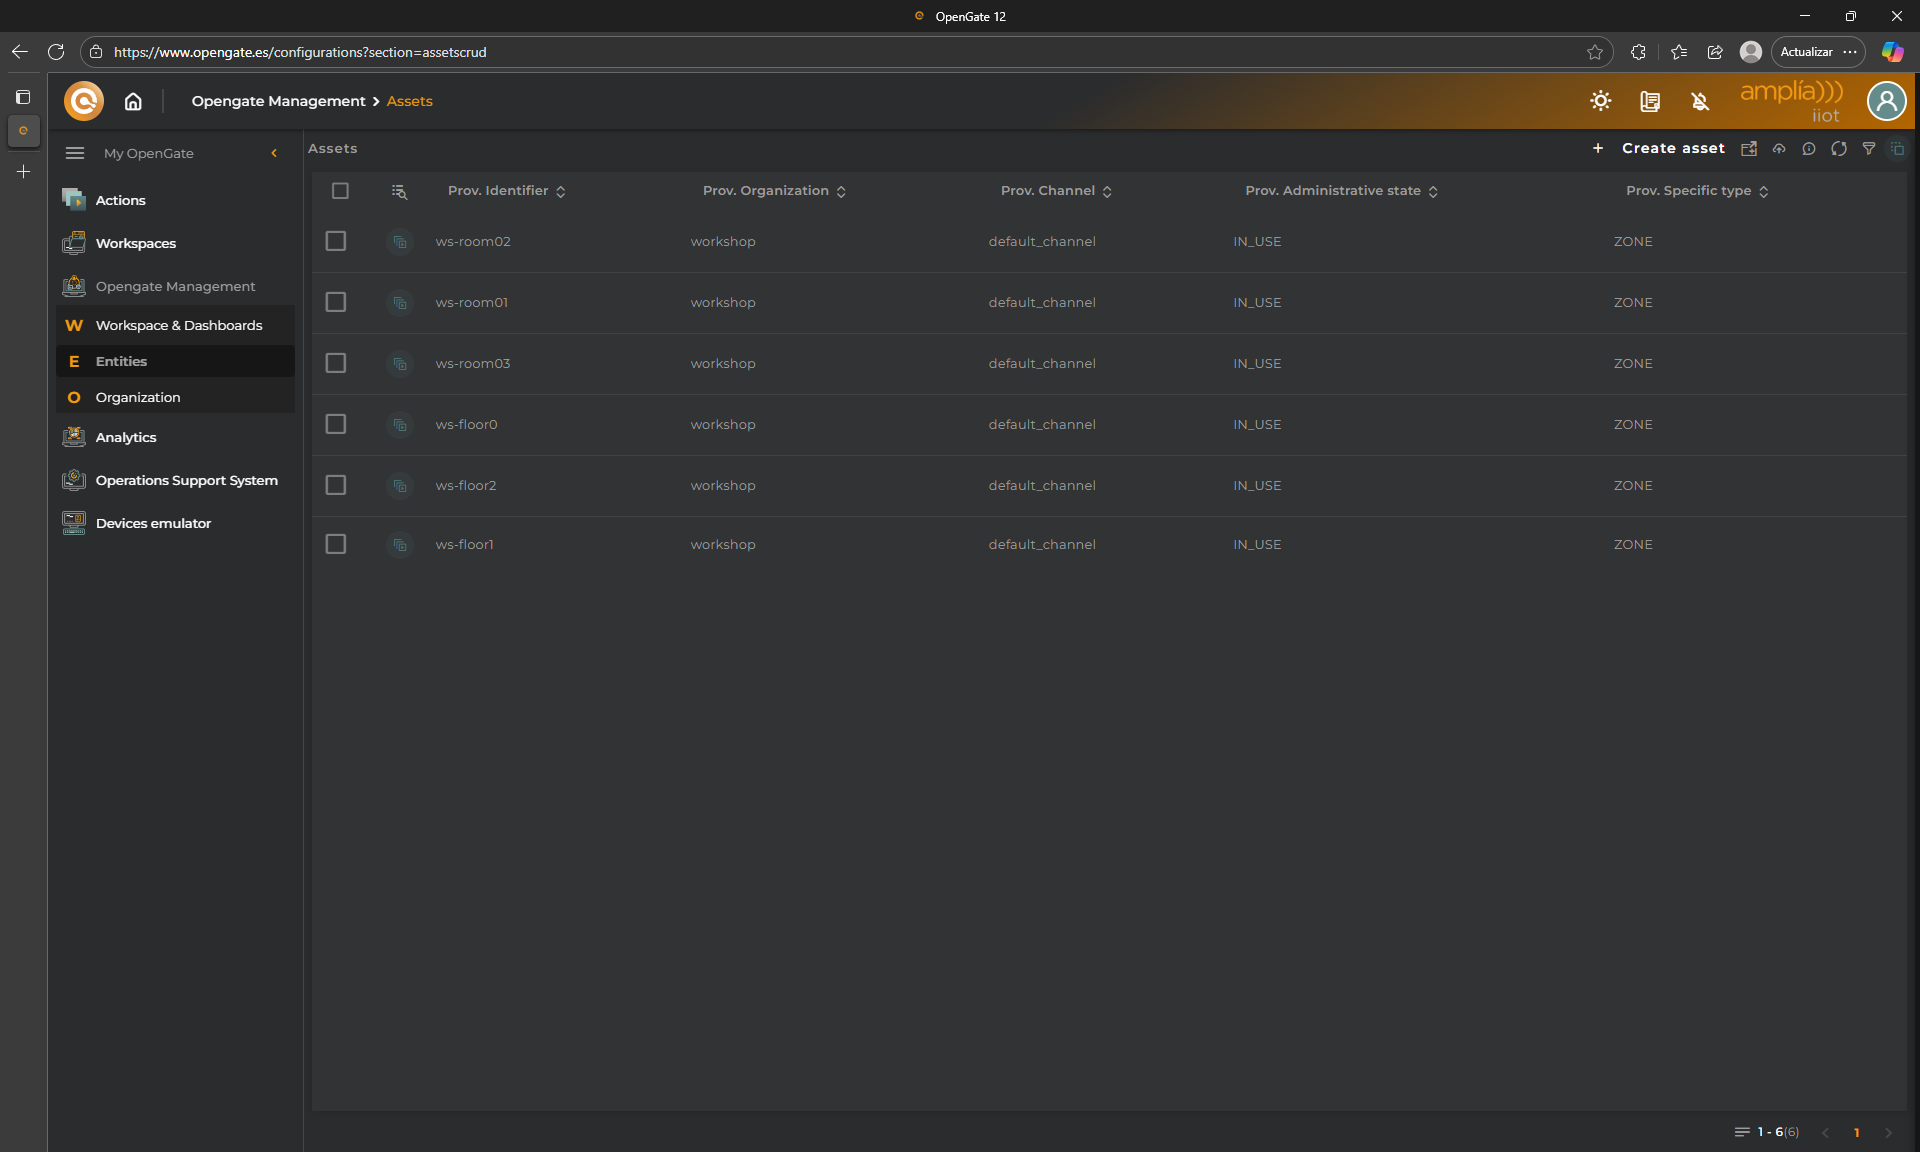
When you finish this chapter, you should see the following entities:
Devices:
Go to “OpenGate Management > Devices” and you should see your devices
Assets:
Go to “OpenGate Management > Assets” and you should see your assets
🚨 Important notes
🆚 Provision vs Collection
The data or information that we entered during this chapter is recorded in OpenGate as Provision Information in Provision Data Streams (OpenGate standard or custom data streams from your datamodels). This means that this information is entered by someone and is not collected from the device.
The data collected directly from the device through the south API, passing through all the workflow that we discussed in the OpenGate Introduction (Connector functions, Rules, and so on) is recorded in the platform as Collection data streams datapoints.
IMPORTANT: This functionality allows you to distinc the information provided vs the information collected, and is a powerful tool, because cometimes the inventory information differs from the collected information and you may detect missmatchs between the information of your entities what you think you have and the information that the entities realy have.
⚠️ Using bulk for delete
Is posible to use the provision functions to delete entities but remember… some actions that you perform on OpenGate sometimes can not be undone…
We provide you this two examples for provision functions to delete entities to clean your workshop entities if needed.
You can download the javascript files and create new provision functions with the code provided:
Remember that OpenGate’s REST API offers all the functionality managed from the GUI so, for more control and automation, OpenGate’s REST API lets you create entities programmatically that is so powerful in serveral ways.
1. Prepare your provisioning JSON object according to the OpenGate schema.
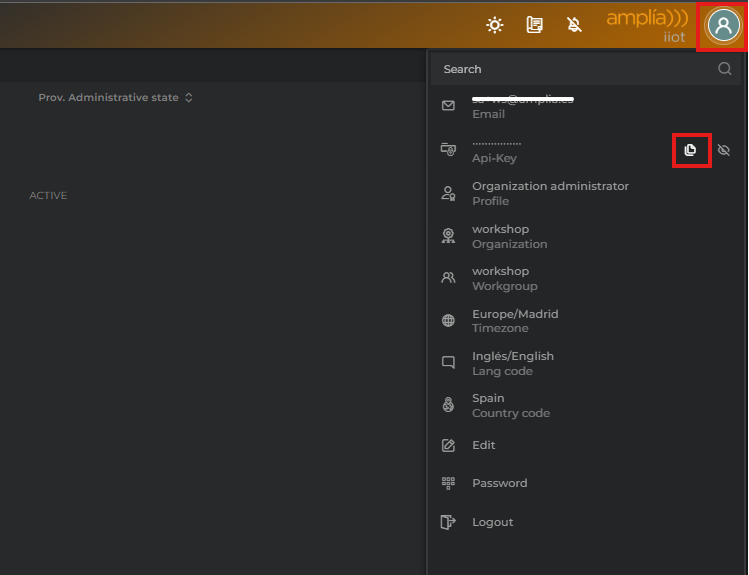
For security concers, each OpenGate user, has its own API KEY. Your can obtain your API KEY directly from the OpenGate GUI.
Just go to the OpenGate web console and click on the top right user icon button, then click on copy next to APY KEY
Annotate this API KEY and… of course, do not share it with anyone…
3. Send the request to OpenGate.
Send the request to the provision endpoint: https://api.opengate.es/north/v80/provision/organizations/[YourOrganization]/devices/[YourEntityID]?flattened=true
4. 🎉 Entity created!
If you receive a 200 as response, all is fine, if not, fix the errors and repeat the process
🚀 When to use this method:
Ideal for backend integrations, automated deployments, or provisioning at scale when combined with external systems.
5. Data Collection
📡 Data Collection in OpenGate
Once entities and devices are provisioned, the next step is to start collecting data. OpenGate offers the OpenGate Device Emulator to simulate, ingest, and so check your OpenGate workflows in real time. This chapter focuses on how to send data to the platform, monitor its flow, and validate that everything is working as expected.
In our ongoing scenario, the IT team has already provisioned ambient and presence sensors across the warehouse and parking area. Now, they want to verify that these sensors are sending data correctly and that the platform is capturing it.
IMPORTANT: All the data collected using the OpenGate Device Emulator will be recorded as collection datapoints for the data streams that you use.
🧪 Simulating with the Device Emulator
OpenGate includes a built-in Device Emulator that allows users to simulate telemetry from virtual devices. This is especially useful during testing phases or when physical devices are not yet deployed.
For this tutorial we are going to:
Navigate to the Device Emulator section in the console.
Select one of our warehouse sensors.
Send test data for that sensor.
Repeat the process with a second device to simulate multiple inputs.
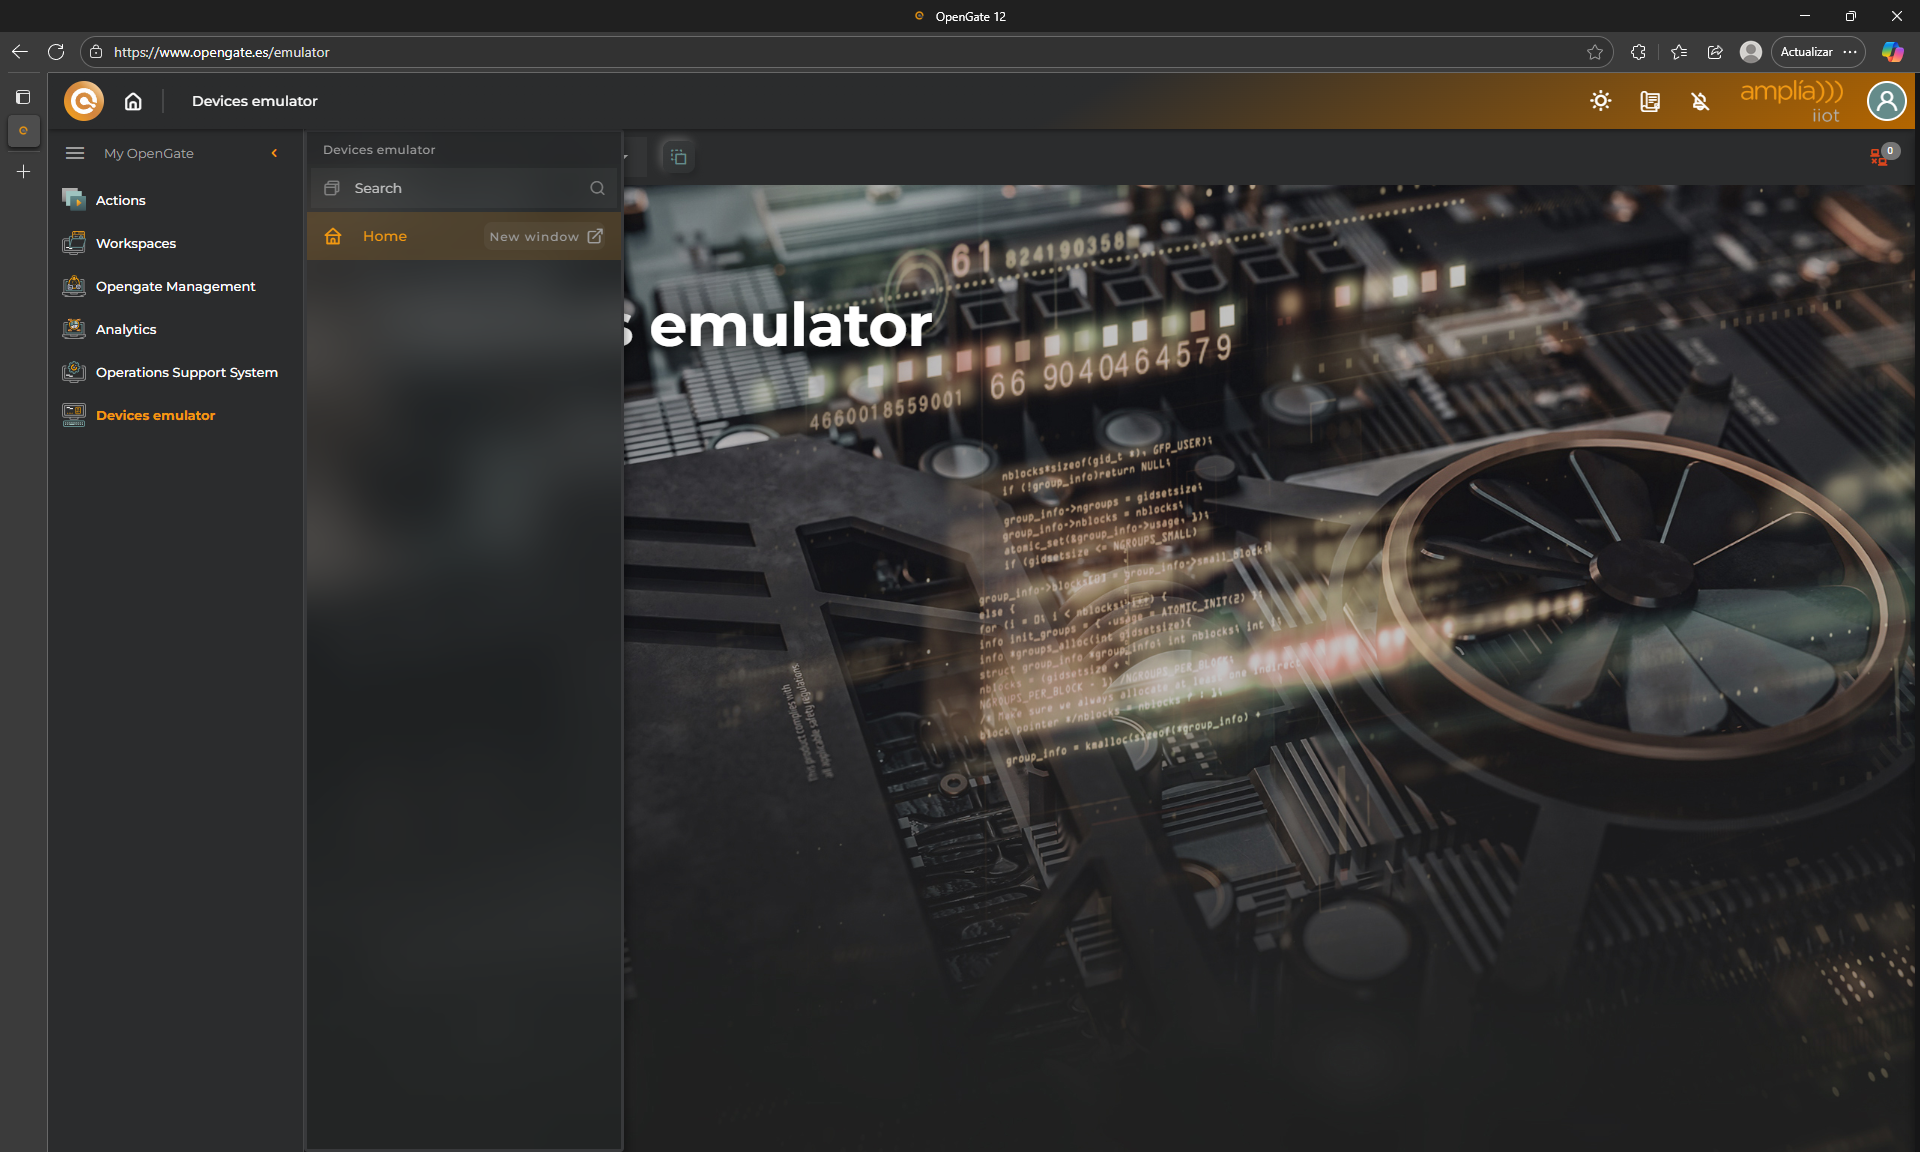
1. Navigate to the Device Emulator section in the console.
Go to the OpenGate web console and click on the left menu on “OpenGate Device Emulator”. We recommend you to choose a new tab using the nested button “NEW WINDOW”
2. Collect data
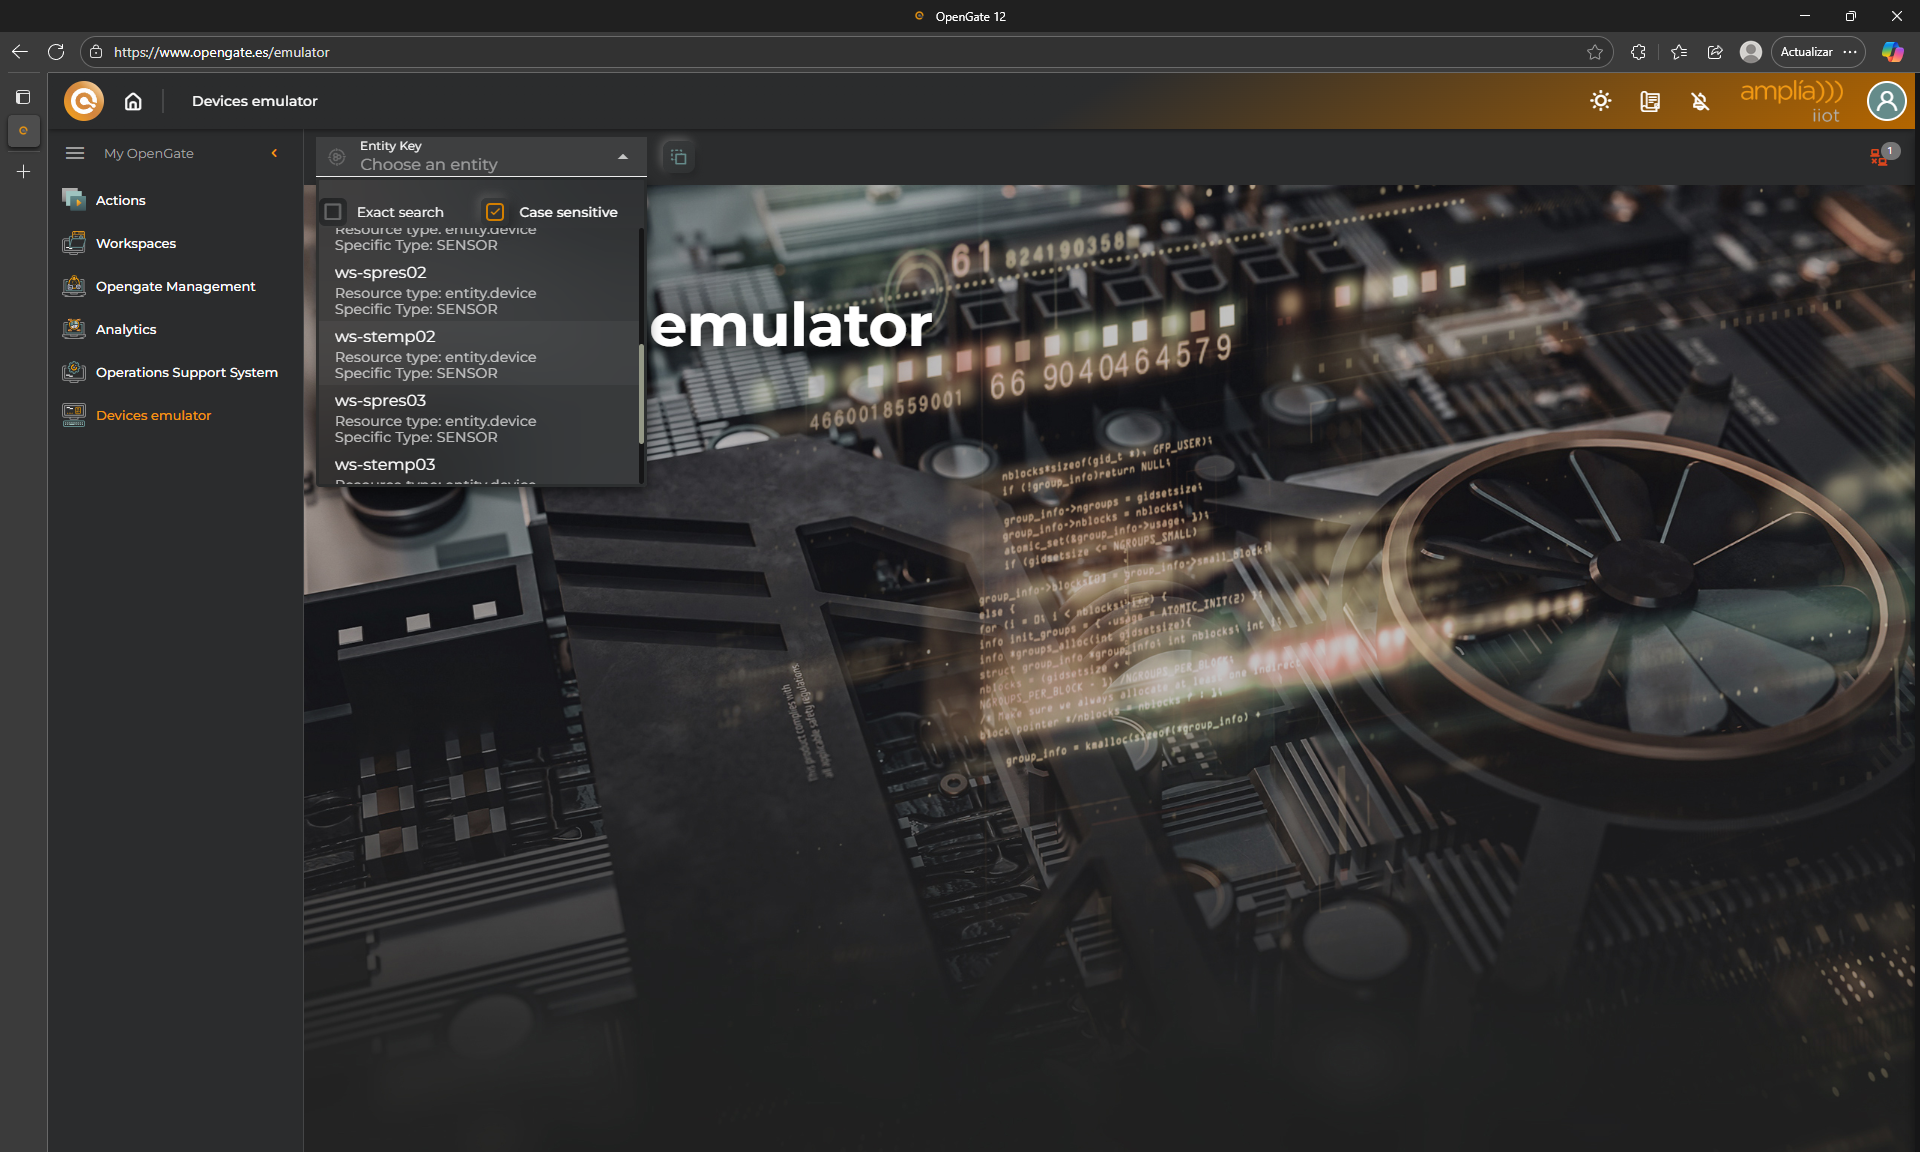
Choose the entitiy to emulate. We will use [YourPrefix]-ws-stemp02 from our tutorial.
In this tutorial, this device represents a device with has temperature and humidity sensors
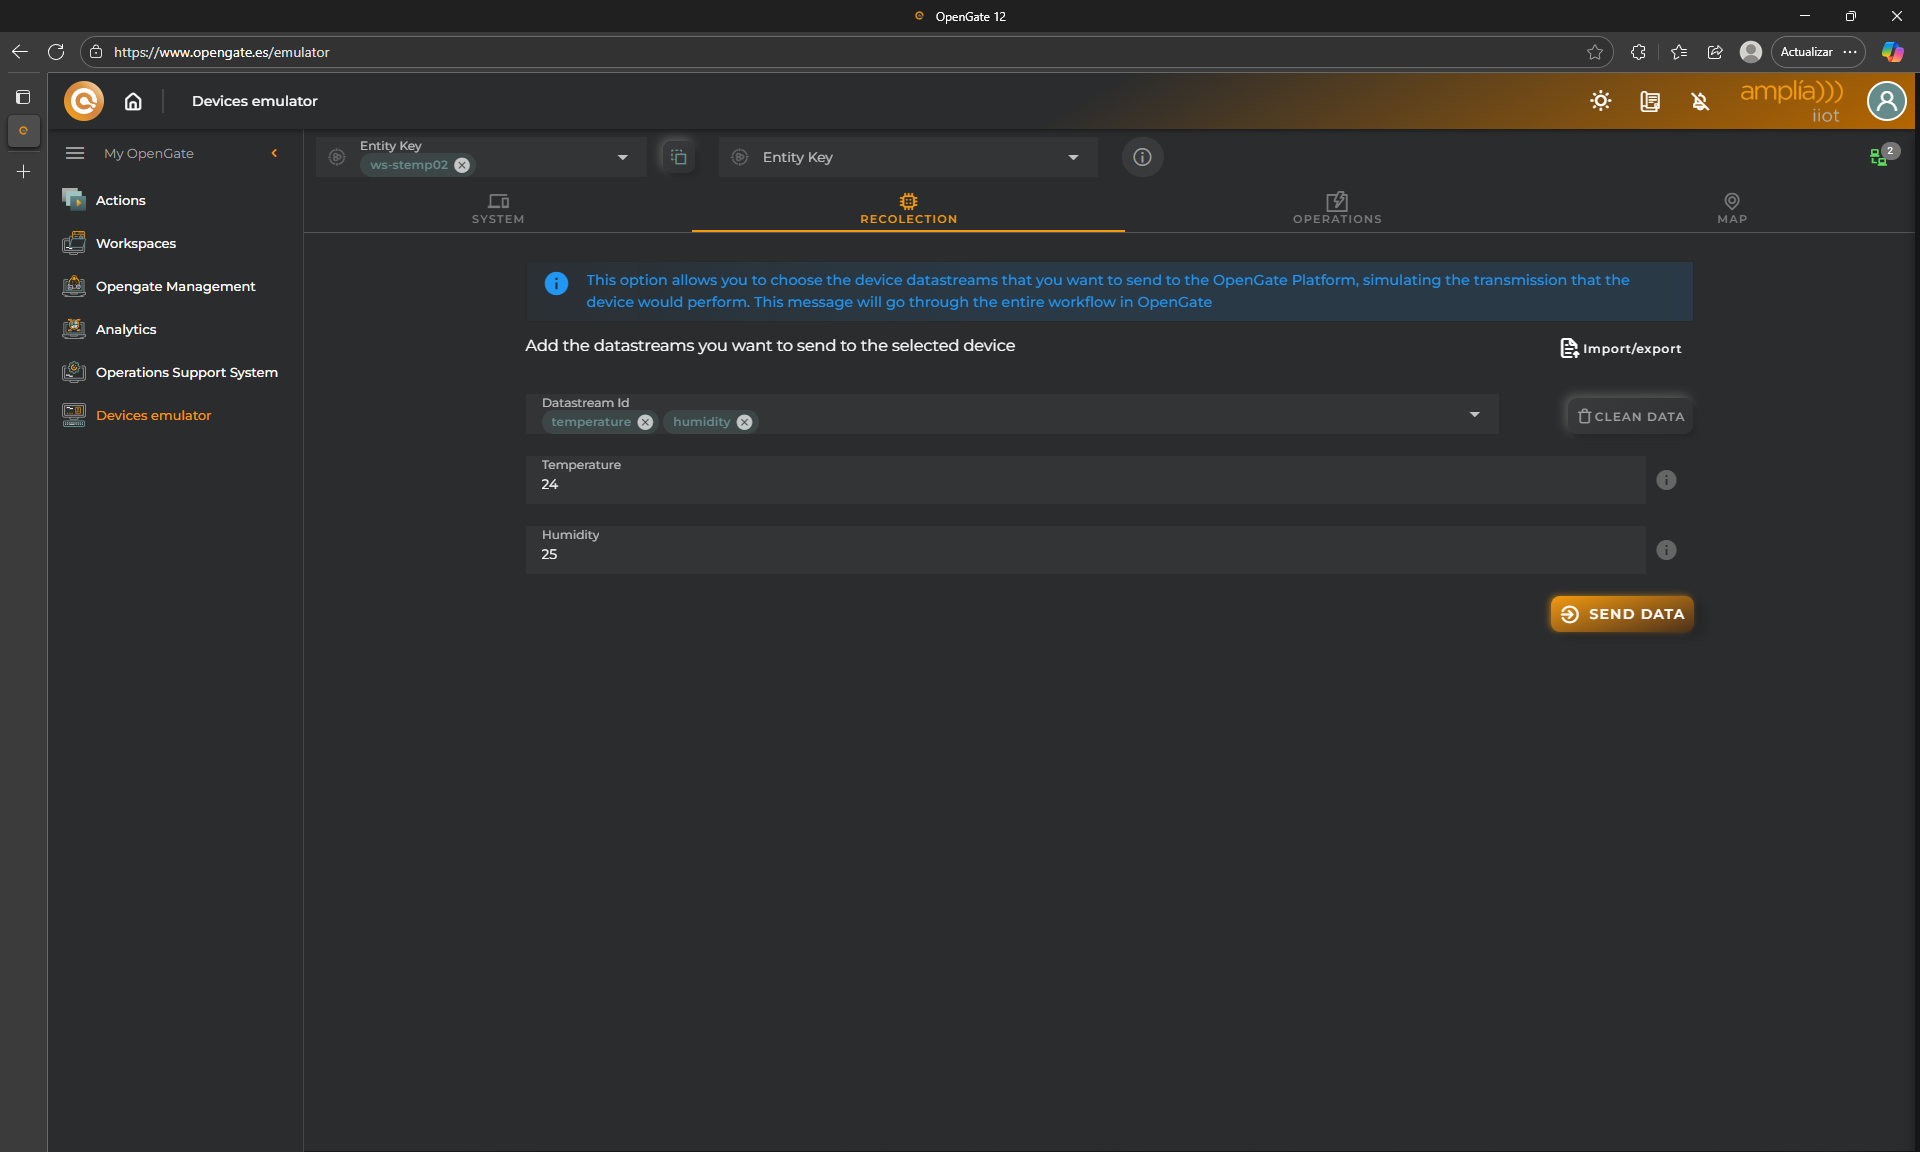
As you can see, there are some tabs to gives you access to powerful tools to emulate the device:
SYSTEM: This allows you to collect the OpenGate standard inventory data streams emulating the device
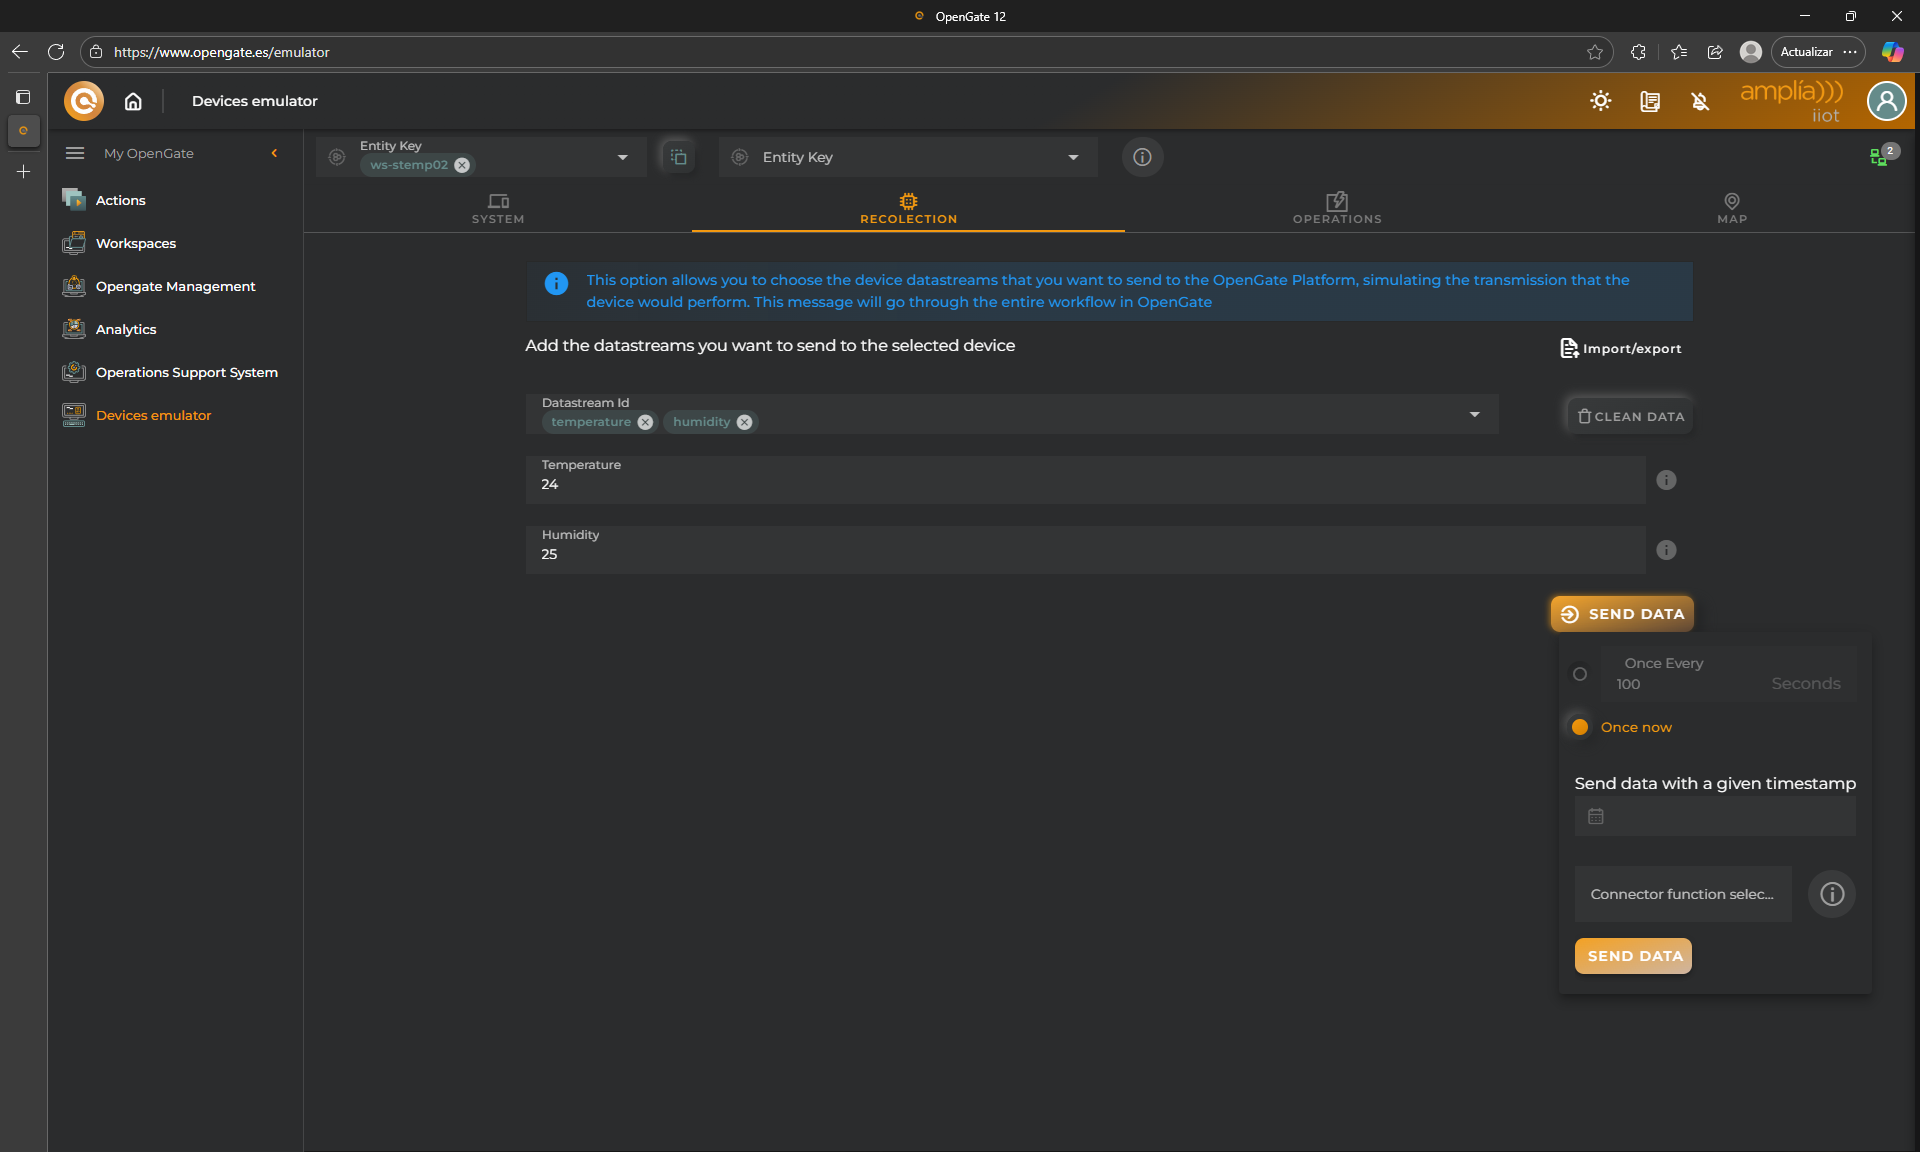
RECOLECTION: From here you can emulate the data streams collection that you want. We will use this in the tutorial.
OPERATIONS: Here you can emulate the Operation Response from the device to check operations workflows.
MAP: This allows you to collect a location event directly from a map.
For this tutorial, we will use the “RECOLECTION” tab to send some basic data collection for our data streams.
click on “RECOLECTION” tab, then enter temperature and humidity in the “Datastream id” box.
This add to the collection data form, the datastreams selected so you can enter some value
click on “SEND DATA and choose “Once Now” to send one collection event. You may use the emulator as periodic event generator using “Once Every” option, but for this tutorial, we just need to send one value.
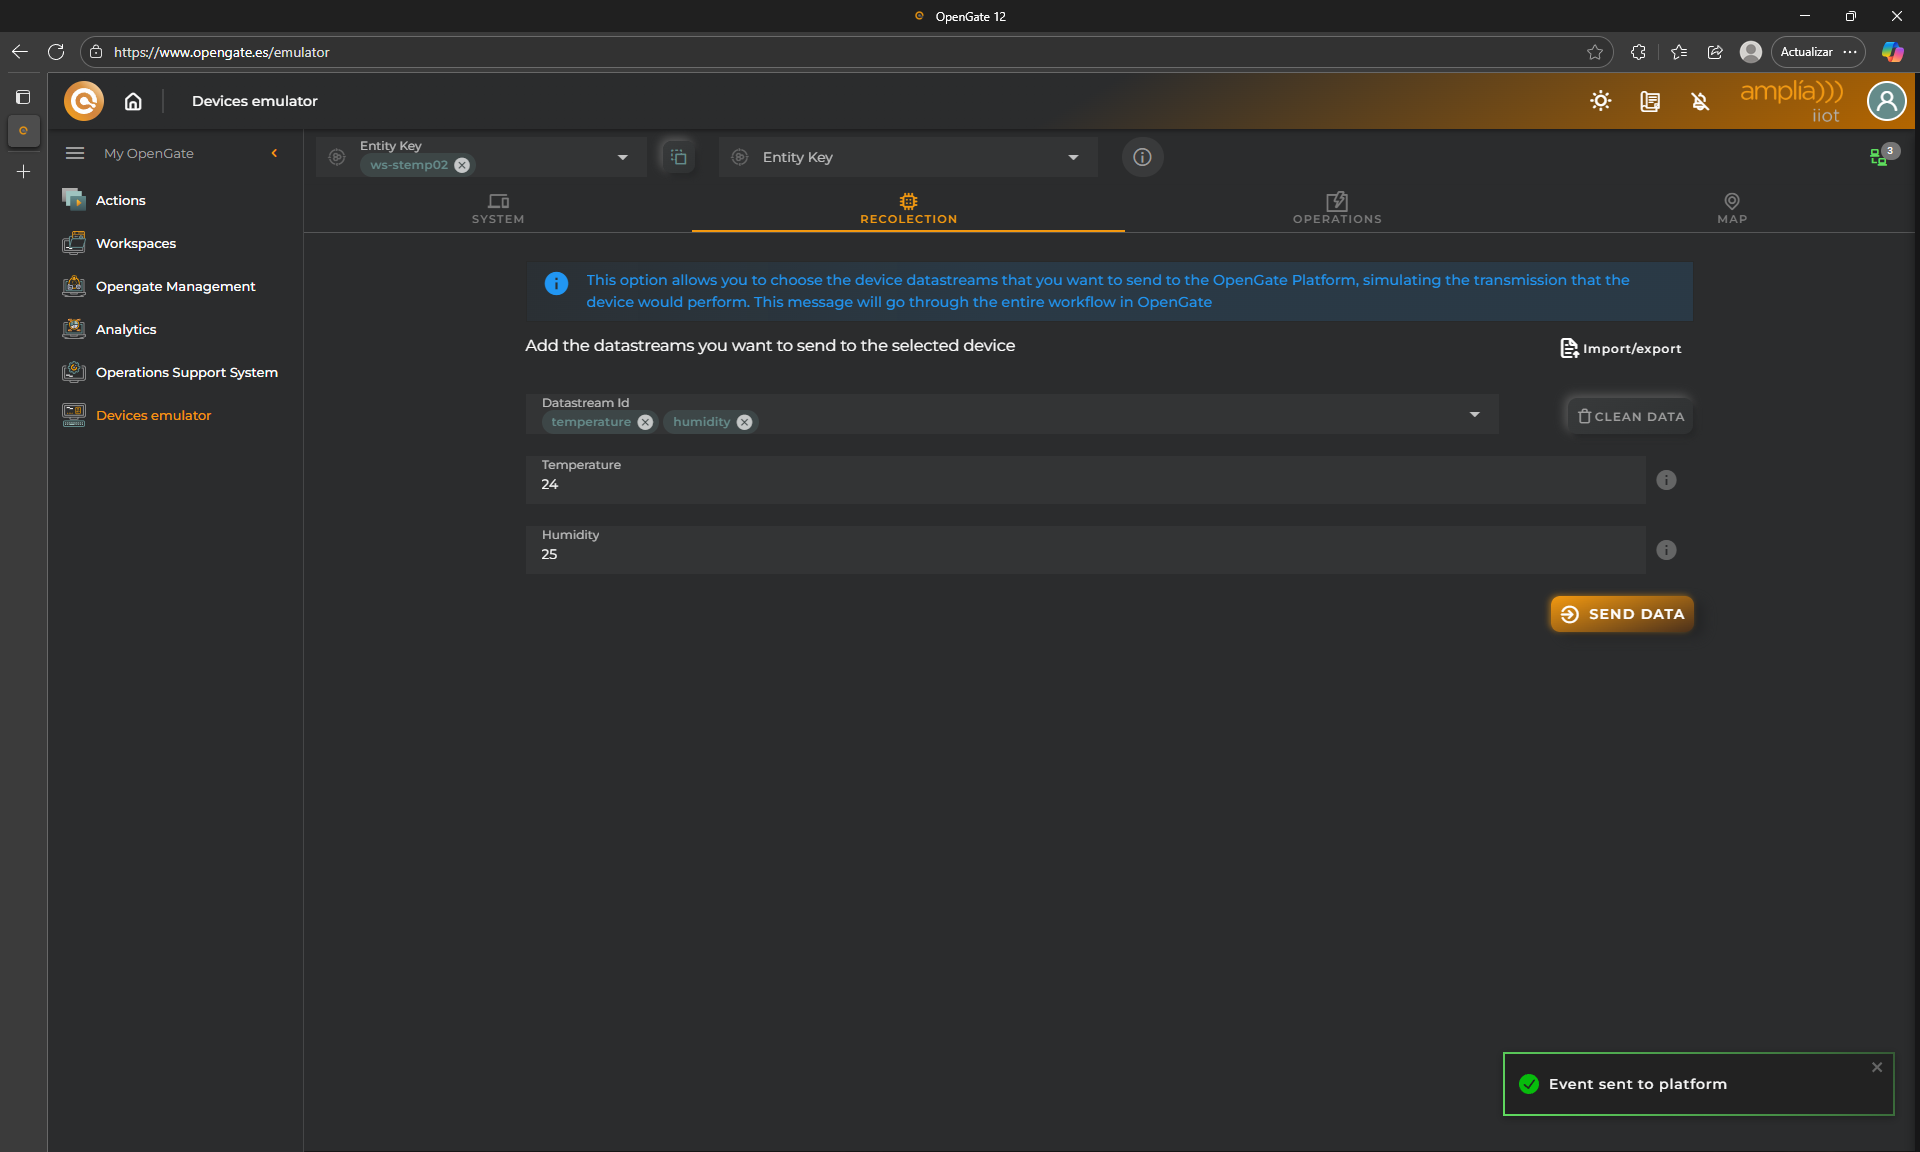
Click on “SEND DATA” and a confirmation message appears:
3. Send more data!
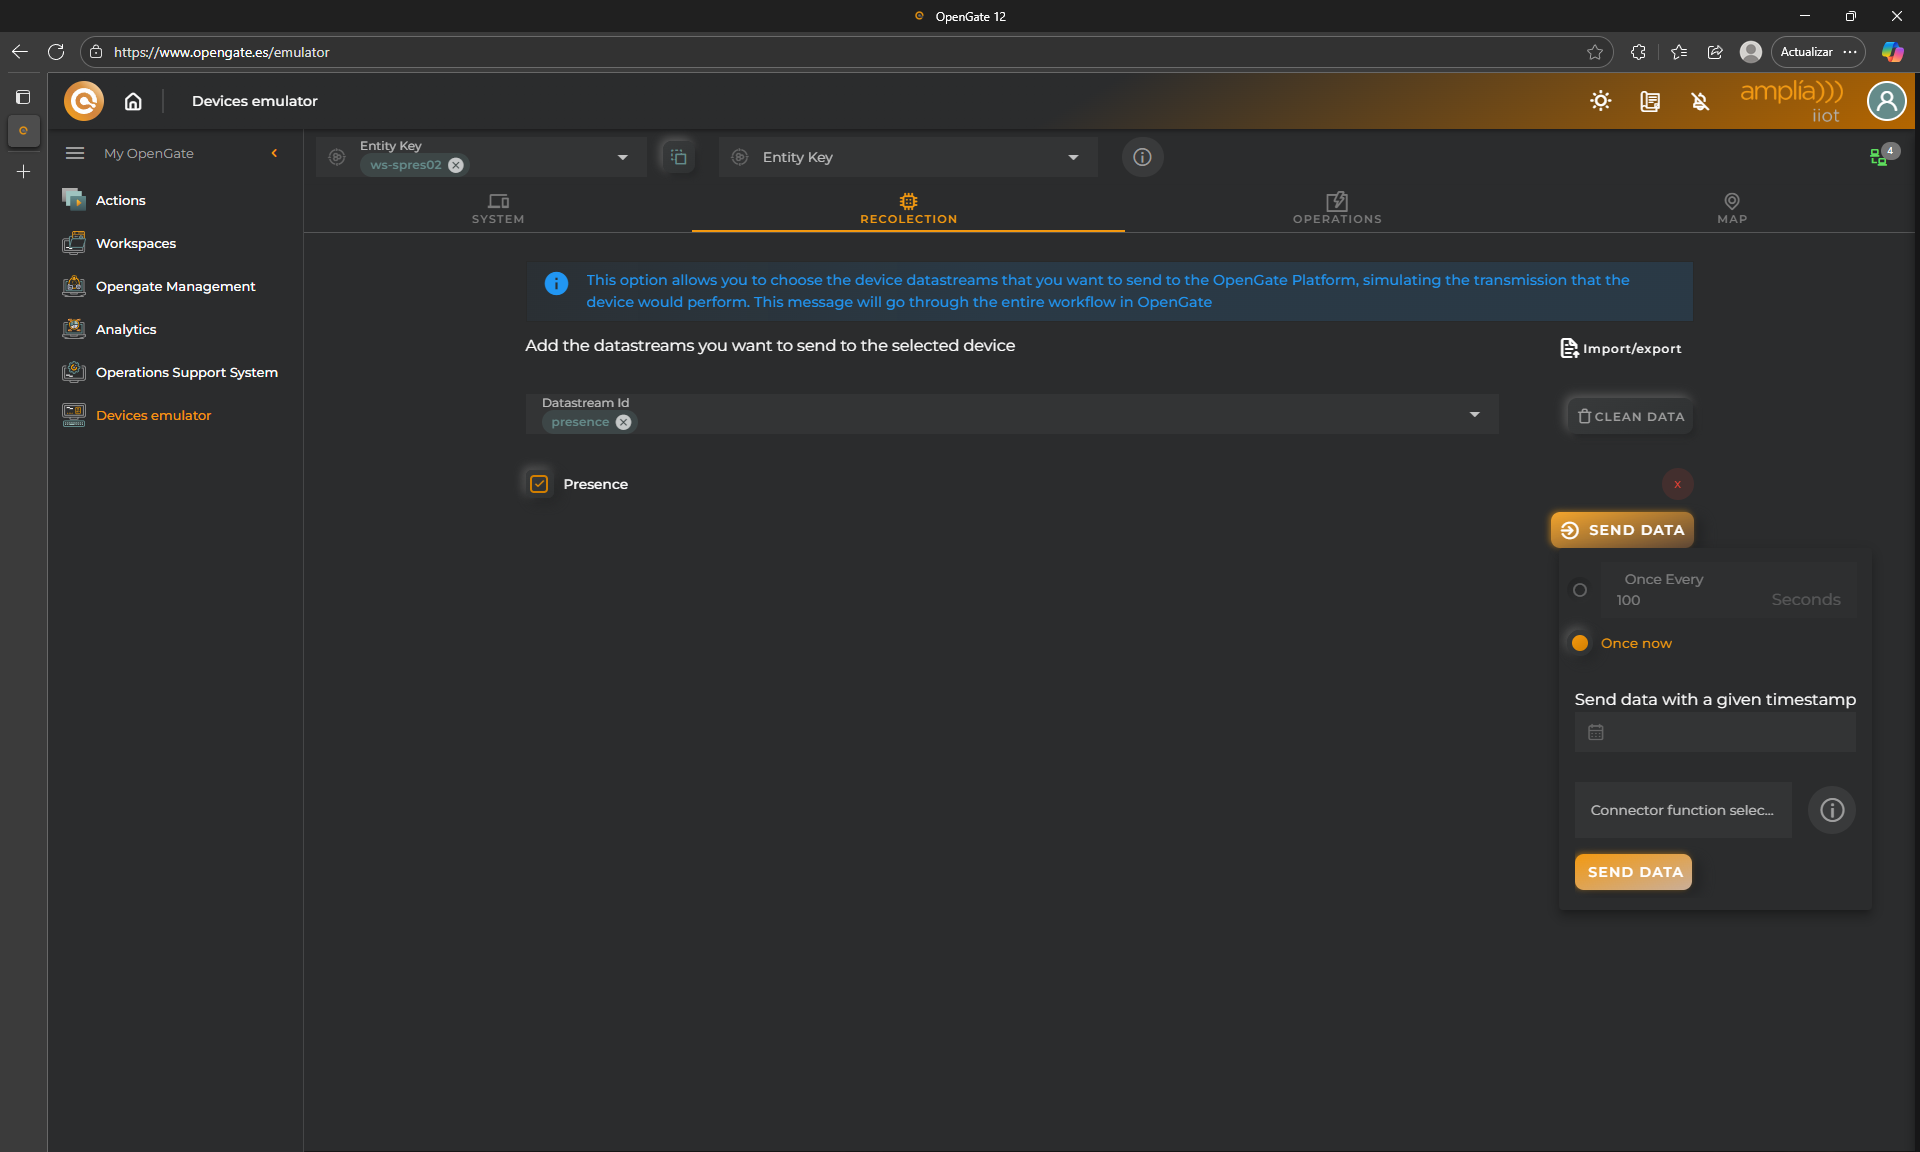
Now choose the entitiy [YourPrefix]-ws-spres02 from our tutorial, this represents a presence sensor.
Just choose presence datastream and check the box to record a “true” value for presence detected.
Click on “SEND”, and “SEND ONCE” as the last time.
📊 Viewing Data in Entity Panels
Once data is received, it can be visualized directly in the Entity Details Panel. Let’s view the data and relationship between entities and assets
1. Checking data is received in devices
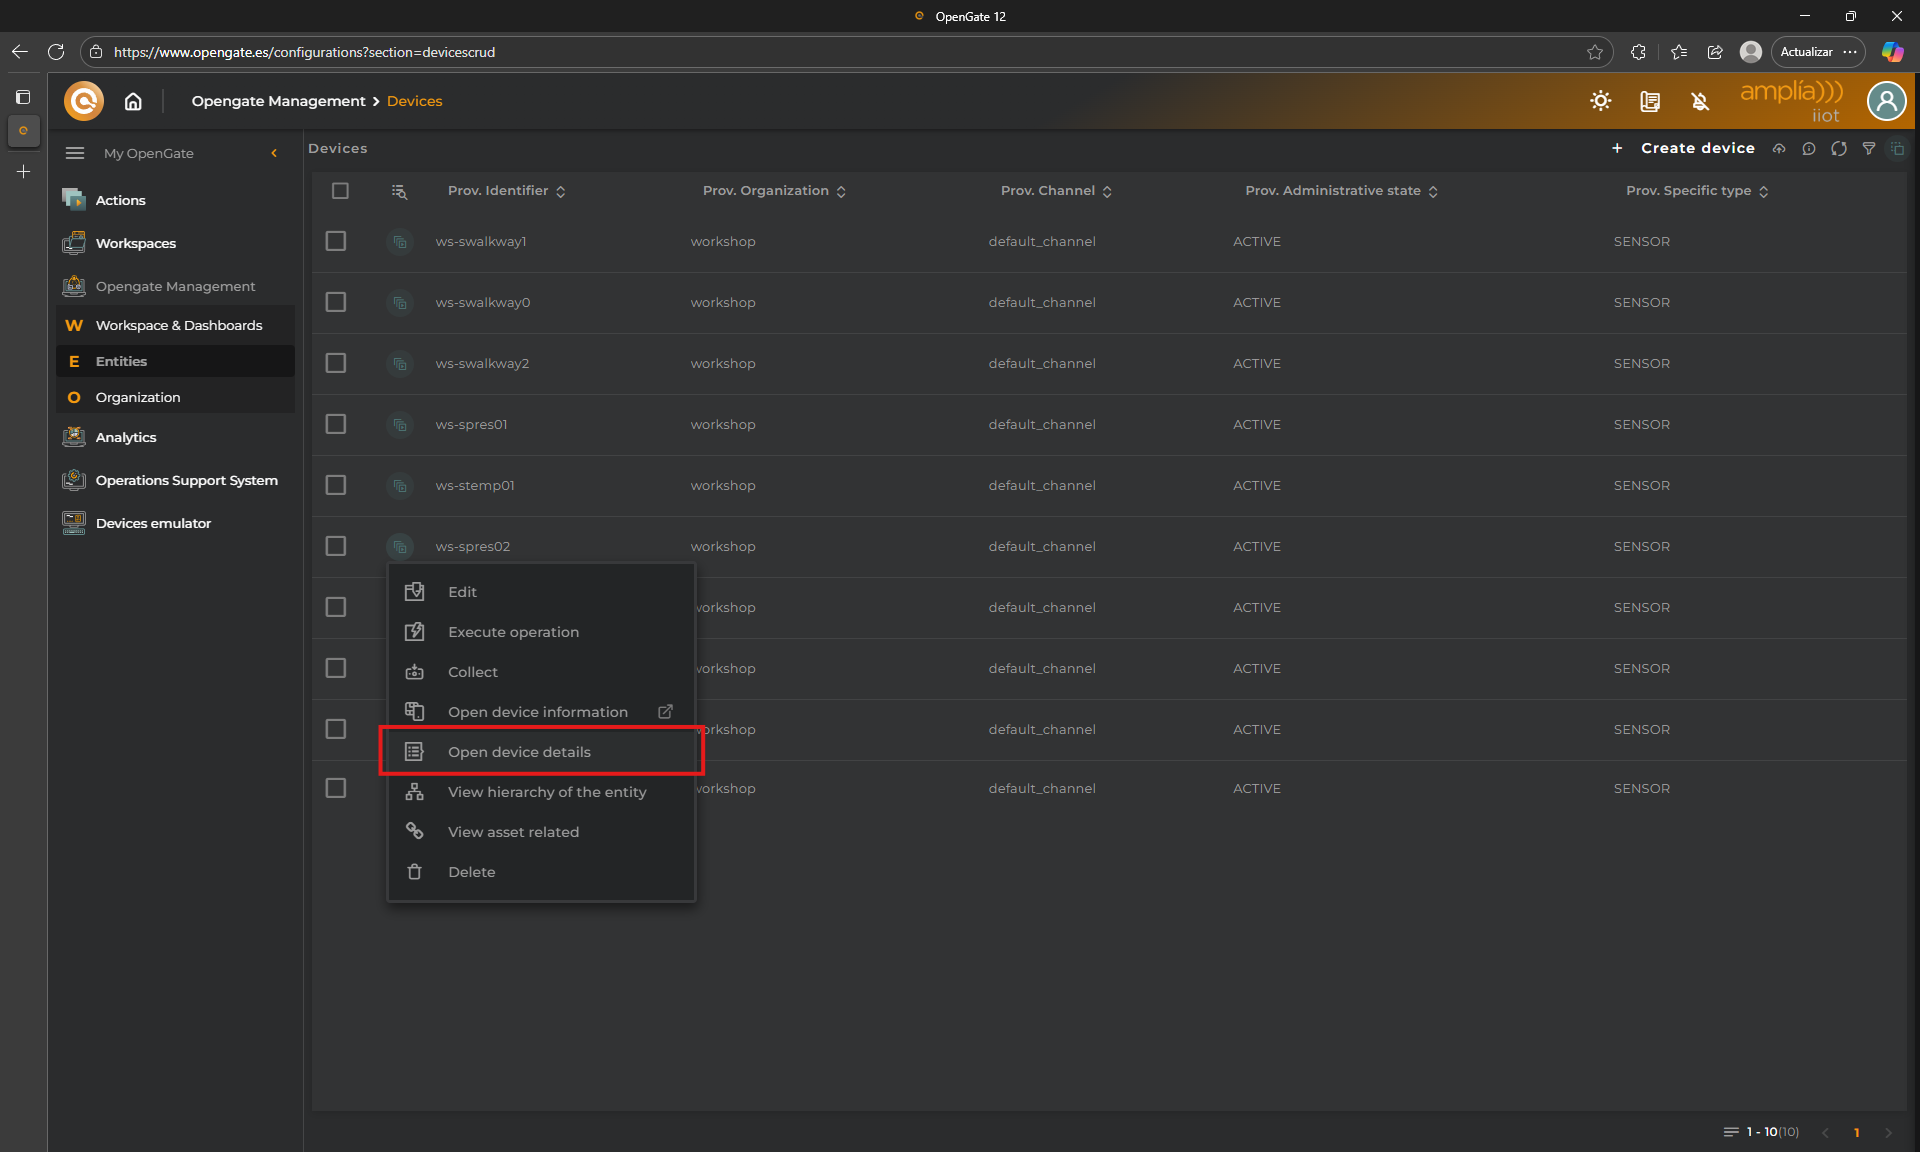
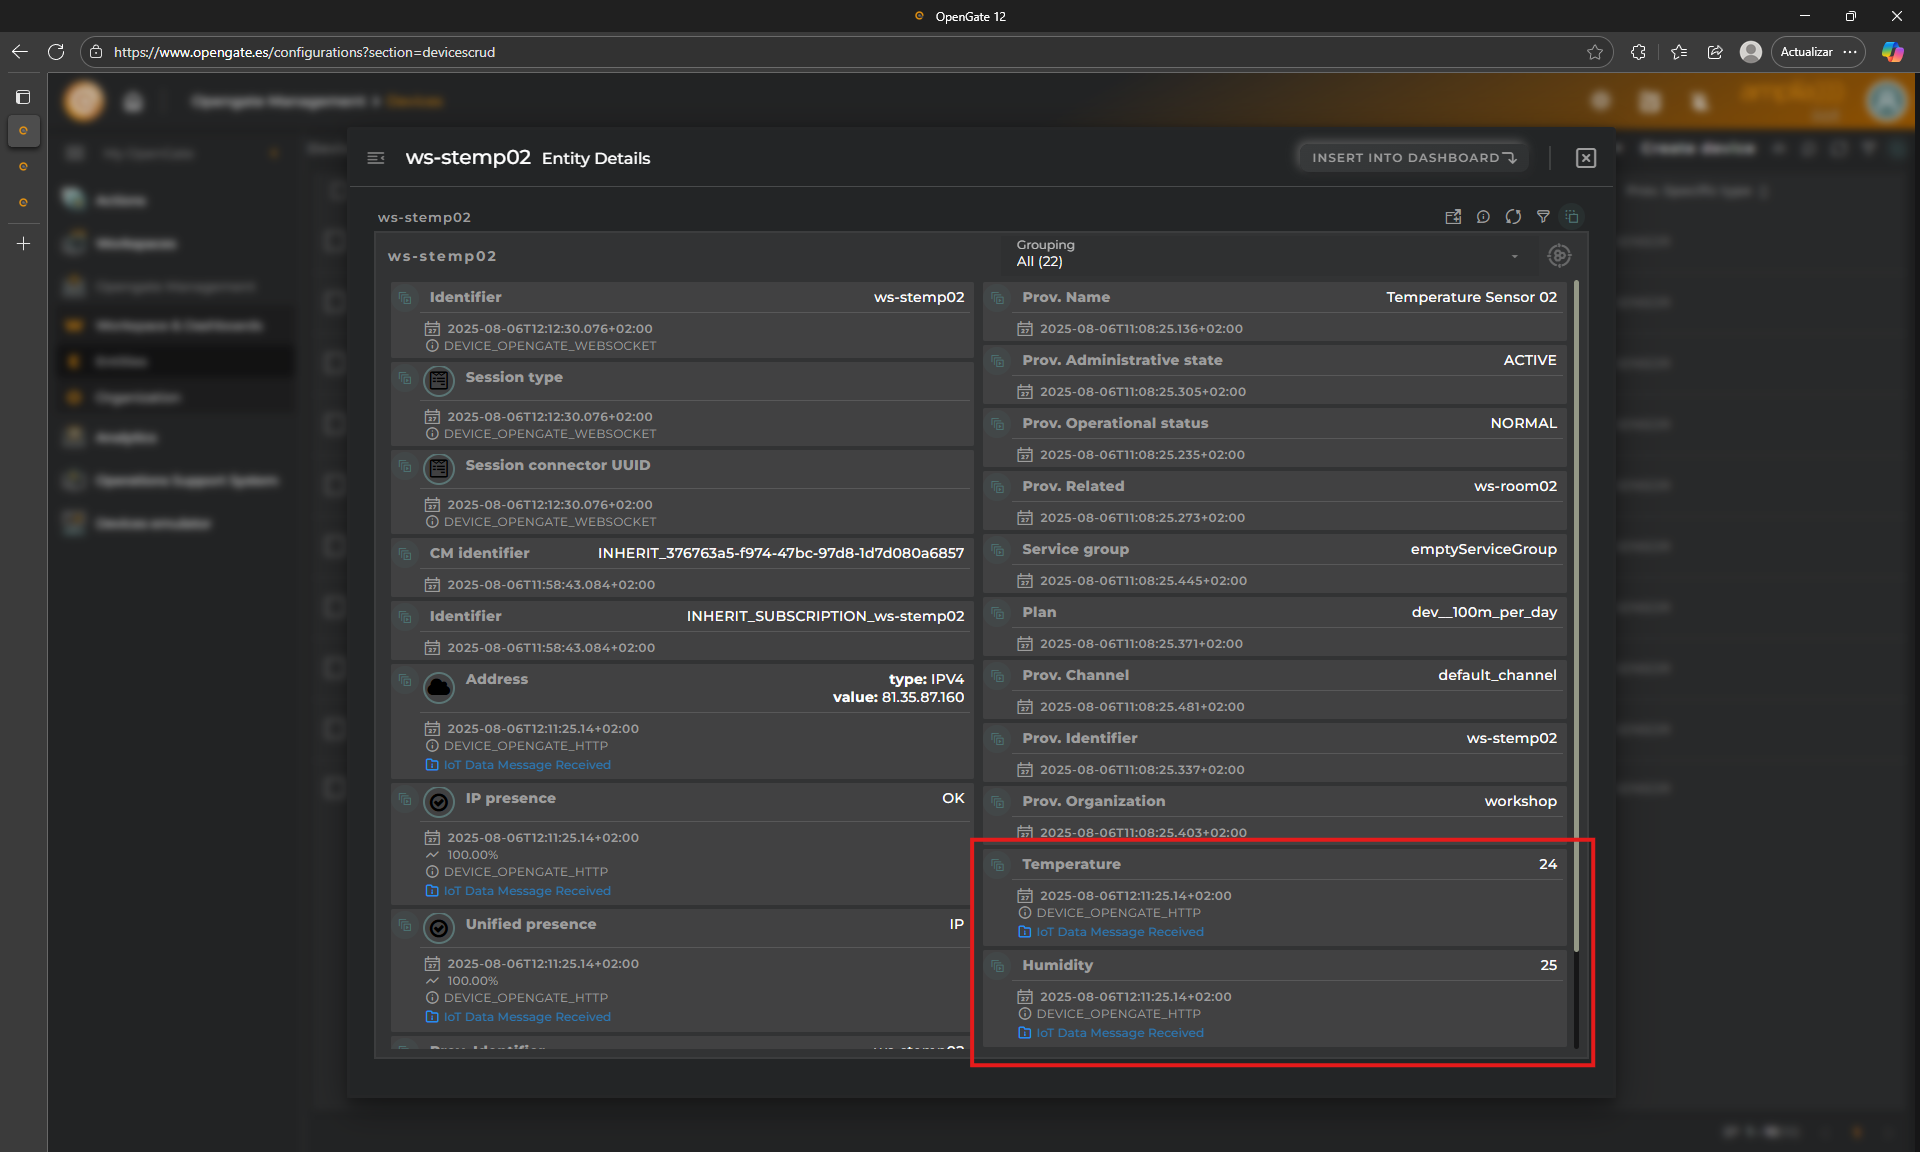
Go to “OpenGate Managemenet > Devices” and click on the menu for “[YourPrefix]-ws-stemp02”, then choose “Entity Details Panel”
Here you can see the last value for the data streams that we use for the test: temperature and humidity:
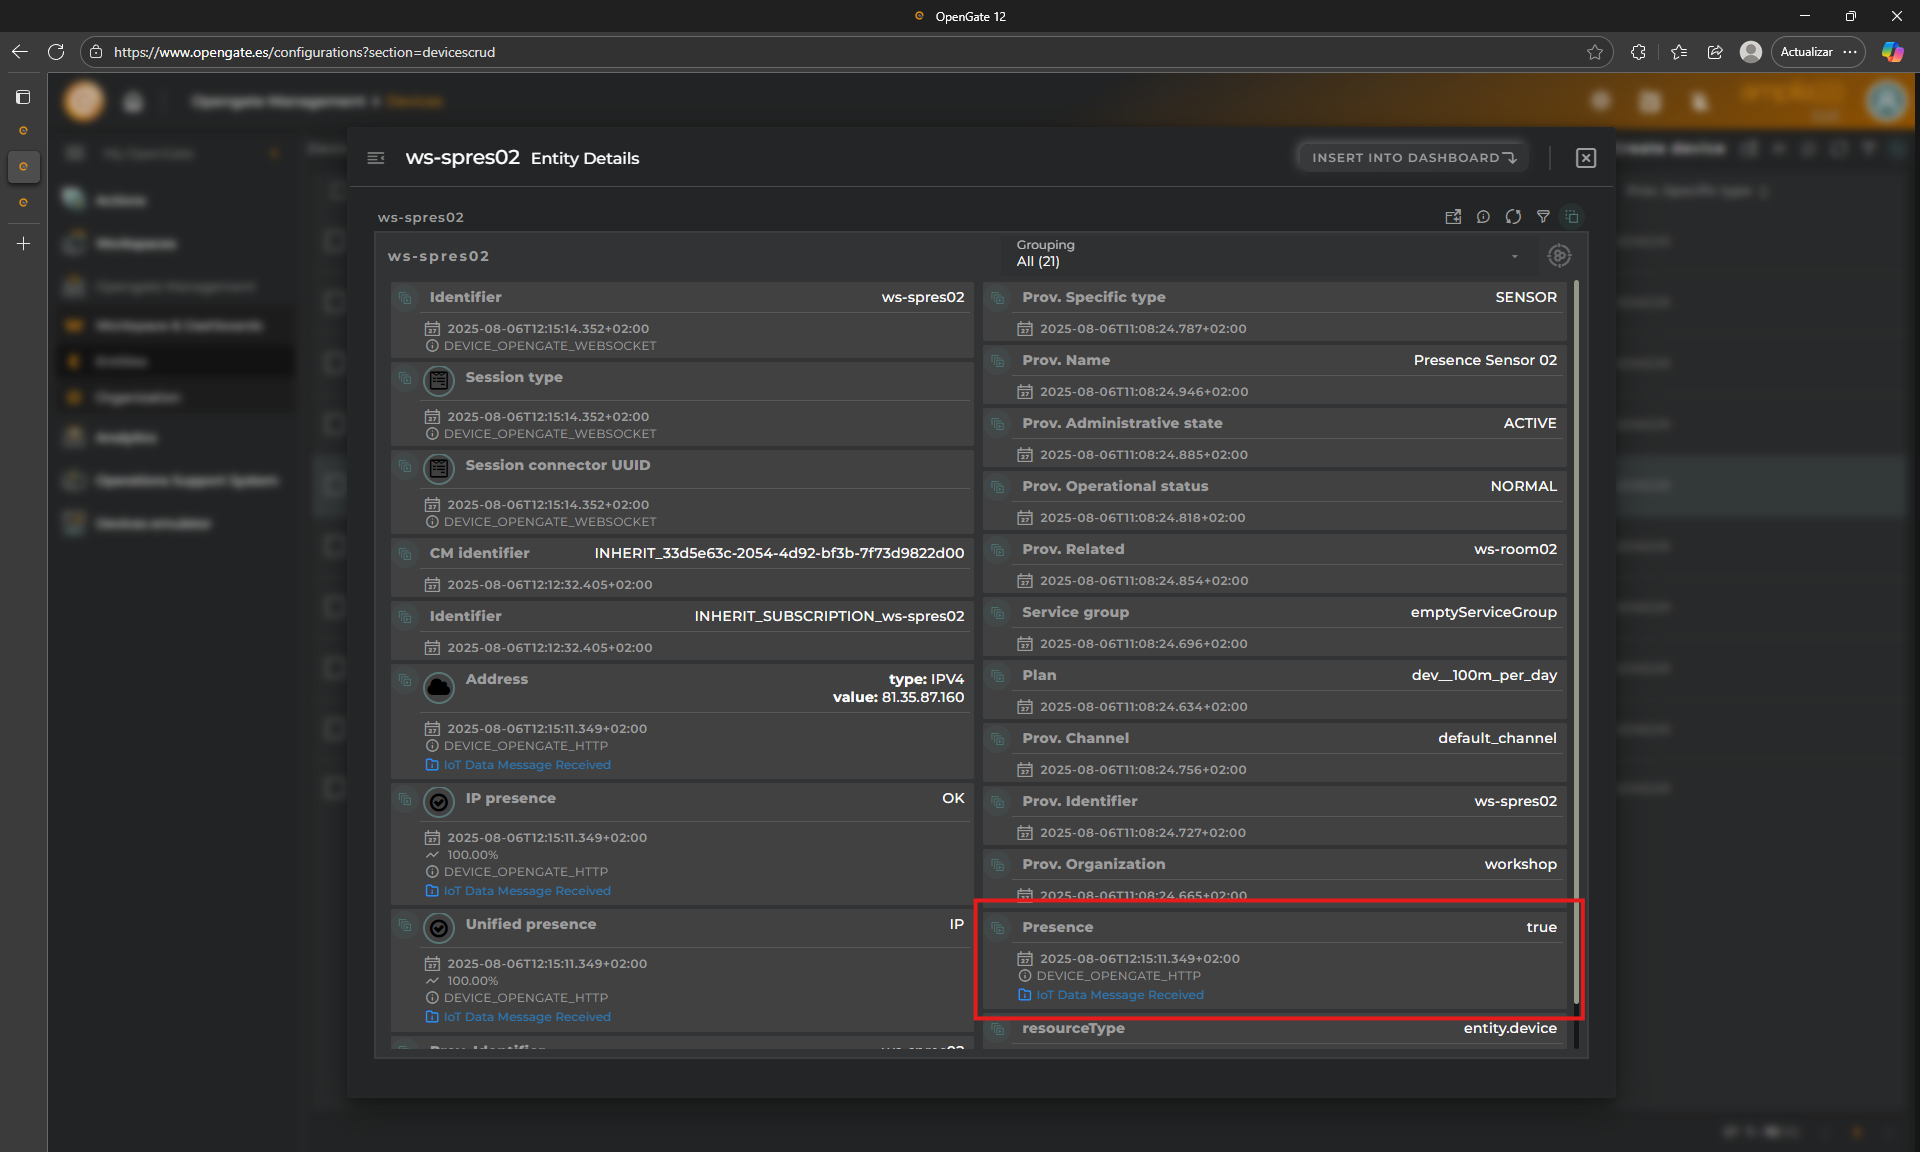
Now repeat the process for [YourPrefix]-ws-spres02 and check that the “presence” value is collected in the data stream.
You will see something like this:
2. Checking data is populated to the asset
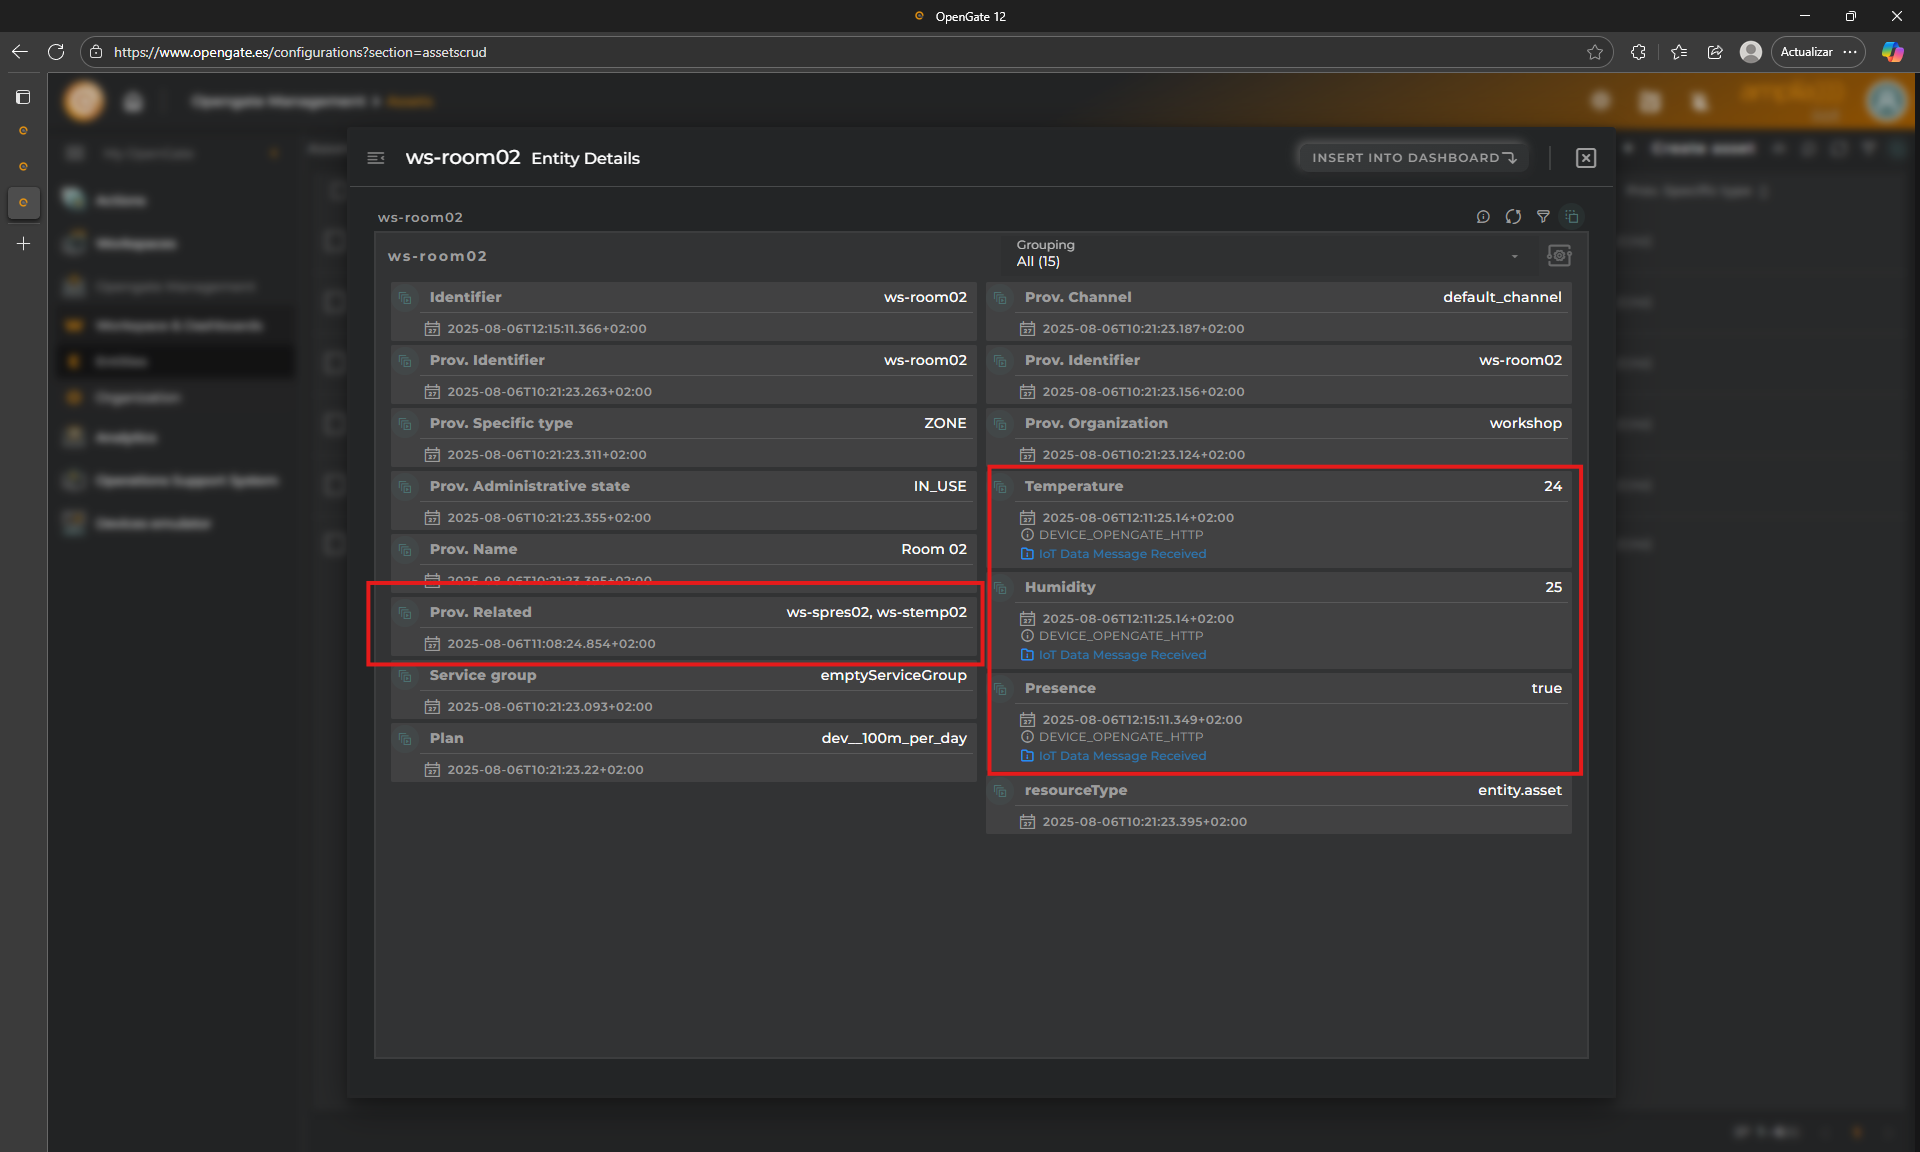
As you may notice, both devices [YourPrefix]-ws-stemp02 and [YourPrefix]-ws-spres02 are related with the [YourPrefix]-ws-room02 asset. That means that both devices are present in the same room of our warehouse and then both devices provide data about the status of that room, so the data of bothe devices will be populated to the asset
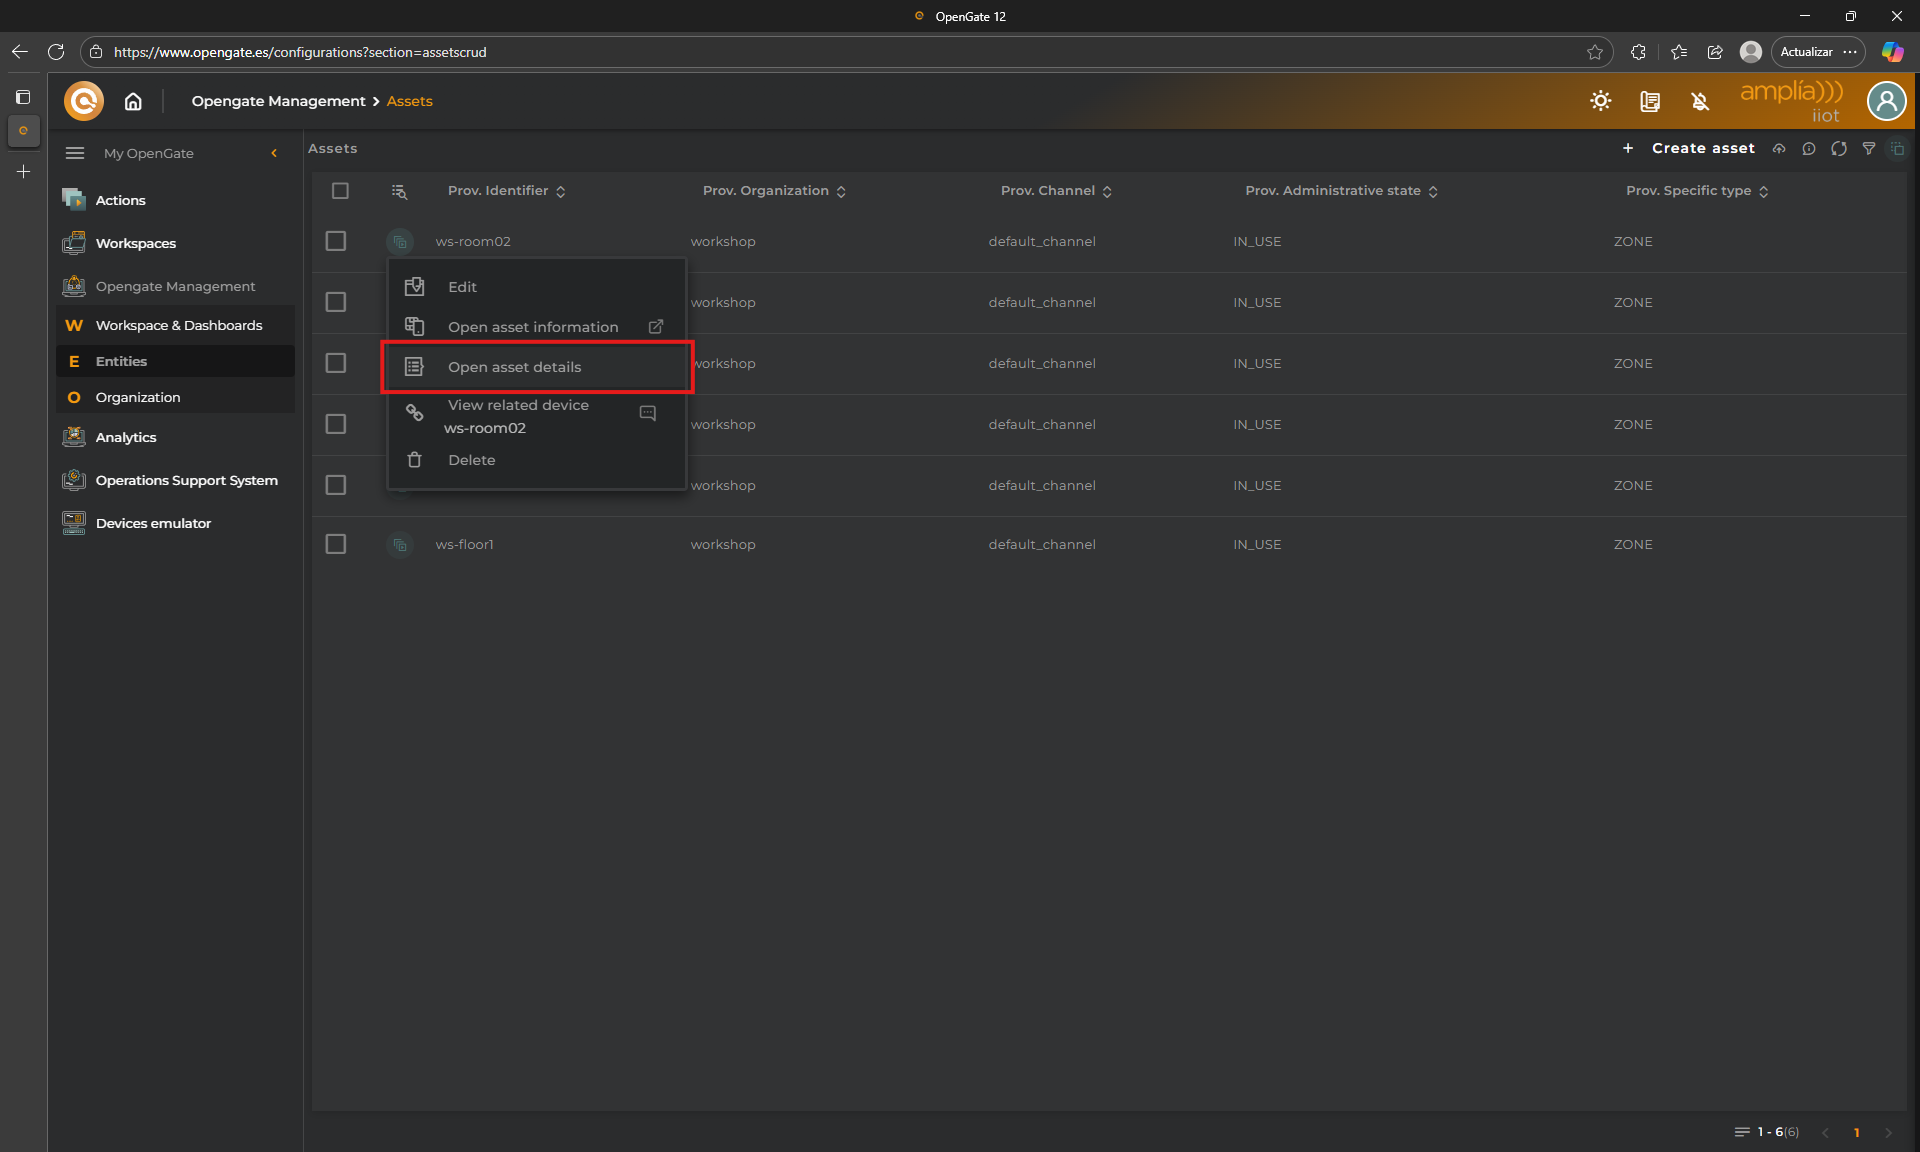
To check this, just go to “OpenGate Management > Assets” and click on the menu for the [YourPrefix]-ws-room02
As you can see there are some relevant information here… On one hand, you can see that the related devices for that asset are [YourPrefix]-ws-stemp02 and [YourPrefix]-ws-spres02 and, additionaly you can check that the data collected for that devices, is recorded also for the asset so you we have values for temperature, humidity and presence.
🧠 Pro Tips
Using the emulator to simulate devices helps you to test dashboards, connector functions, rules, operations and so, the entire OpenGate workflow that you are configuring. You can also combine emulated data with real devices to validate hybrid scenarios.
On the “RECOLECTION” tab, you can IMPORT/EXPORT a JSON file with the datastreams and values to use so you may prepare different sets of data to work in a more efficient way.
The exported JSON from the “RECOLECTION” tab, works directly using OpenGate South API collection endpoint. Just paste the JSON on the POST request body to test it!
6. Connector Functions
⚡ The Superpower of Connector Functions
What if your devices don’t follow the OpenGate standard message schema?… Use Connector Functions.
Connector Functions are one of OpenGate’s most powerful features. They allow you to transform, enrich, and adapt incoming data so it can be properly collected and processed by the platform.
Whether your devices send custom payloads, use different field names, or require preprocessing, Connector Functions give you the flexibility to make it work.
🧪 Connector Function Example
Let’s walk through a practical example. We’ll create a Connector Function to receive a JSON payload using the OpenGate Standard HTTP connector and adjust it to collect the values correctly.
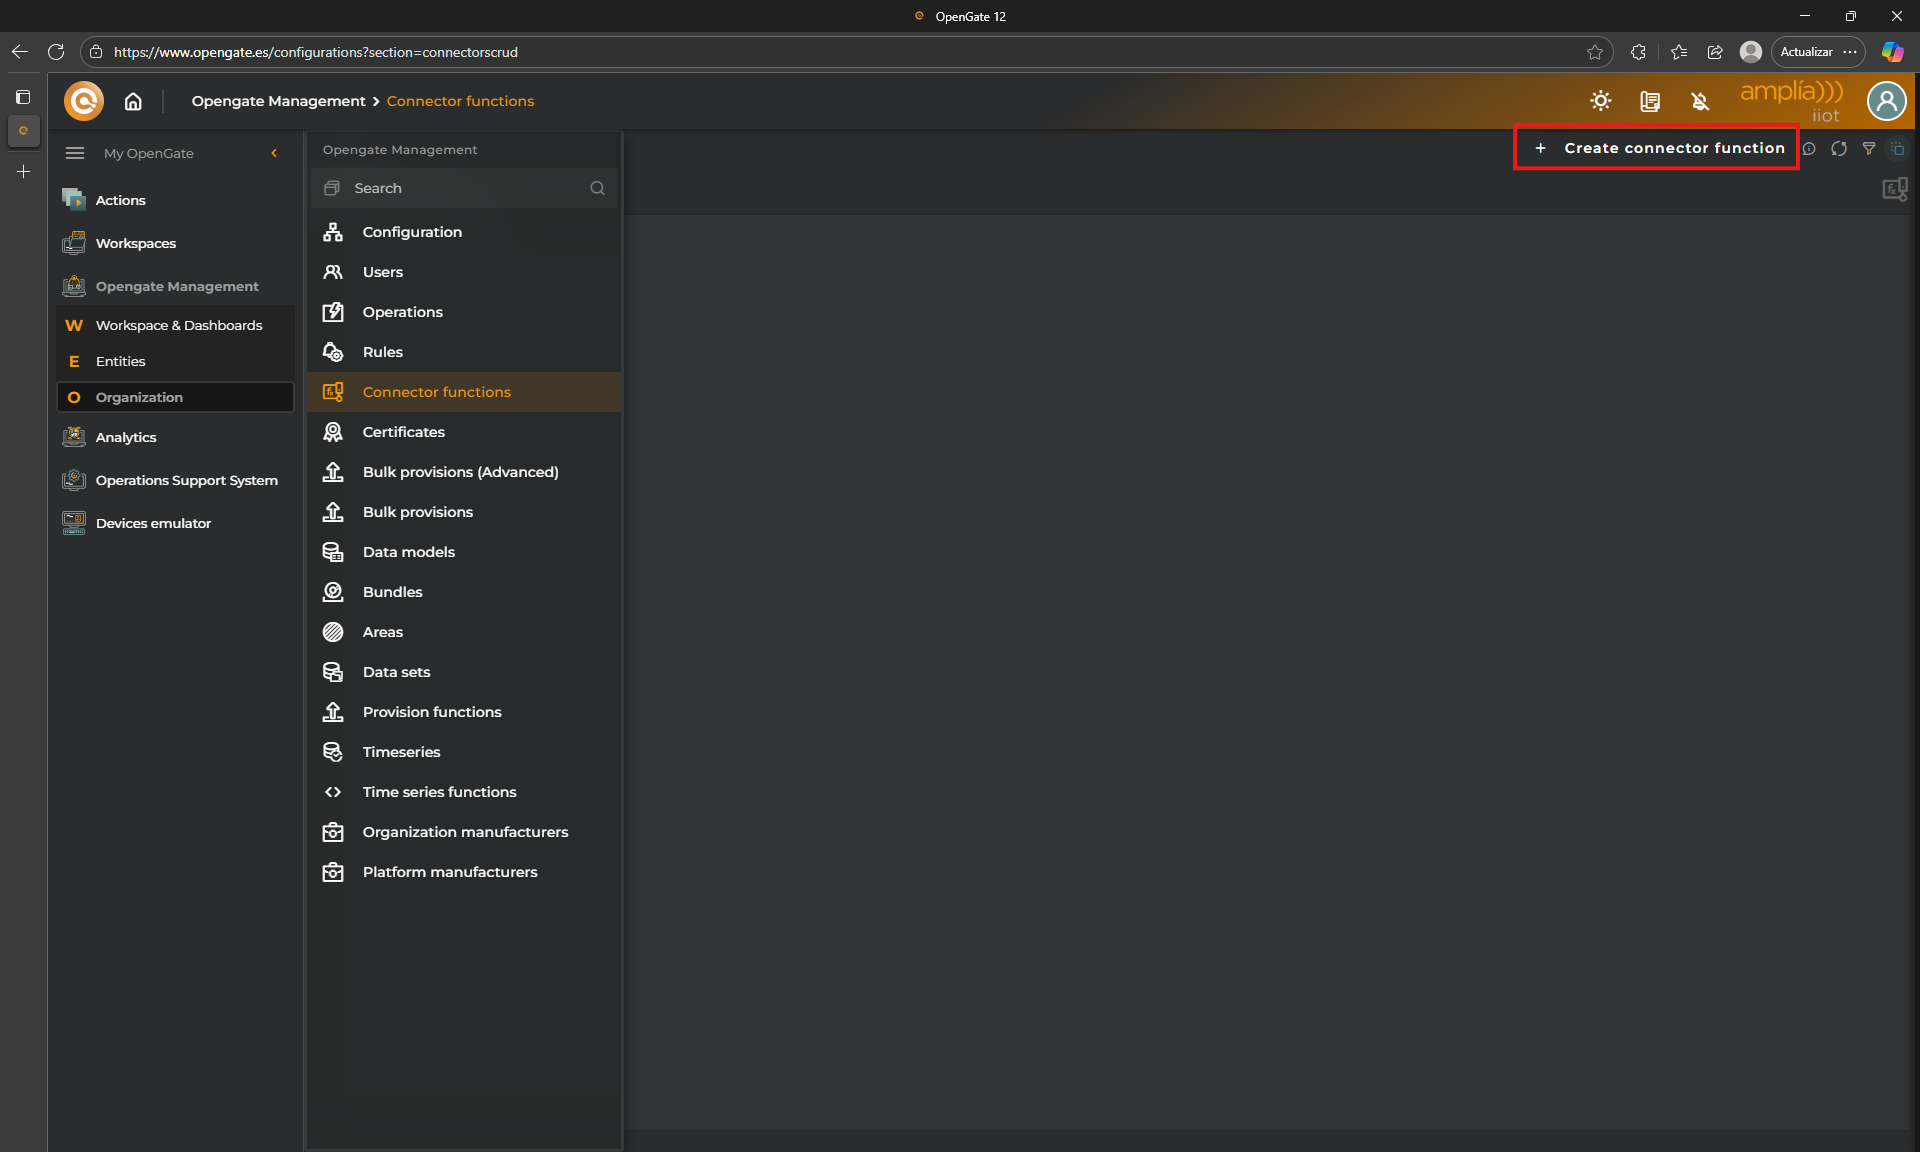
🔧 Step 1: Create the Connector Function
1. Open the wizard
Go to OpenGate Management > Connector Functions and click on New Connector Function.
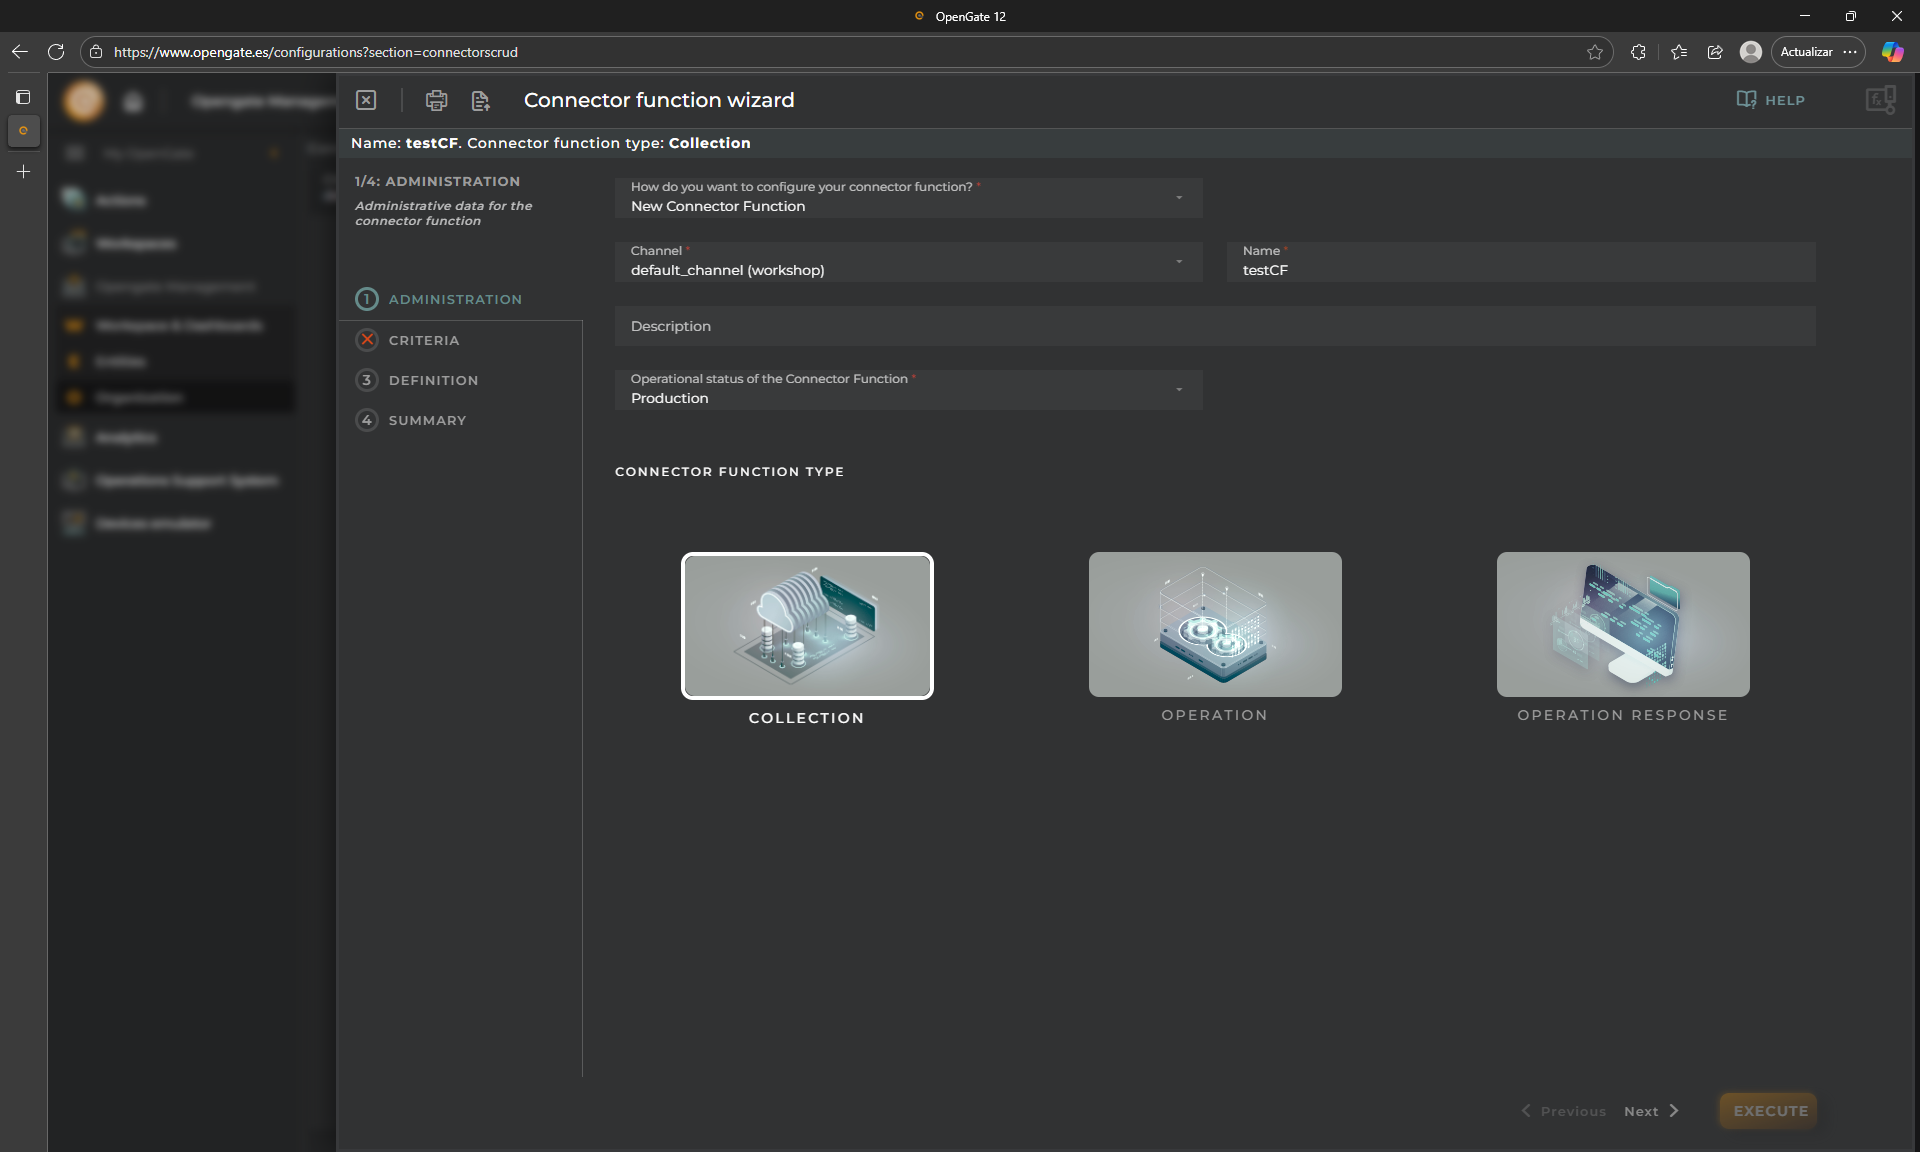
2. Fill administrative data
Let’s configure our Connector Function administrative data:
New Connector function?: In case we have others we could clone another as template, but this is our first one, so click on New Connector function
Name: for this tutorial, use testCF
Operational Status: You can choose if you want to enable or disable this CF, choose Production
Type: We said that is a superpower because not only we can use the Connector Functions to collect data. We can use it to manipulate operations request or responses. For this tutorial, choose COLLECTION
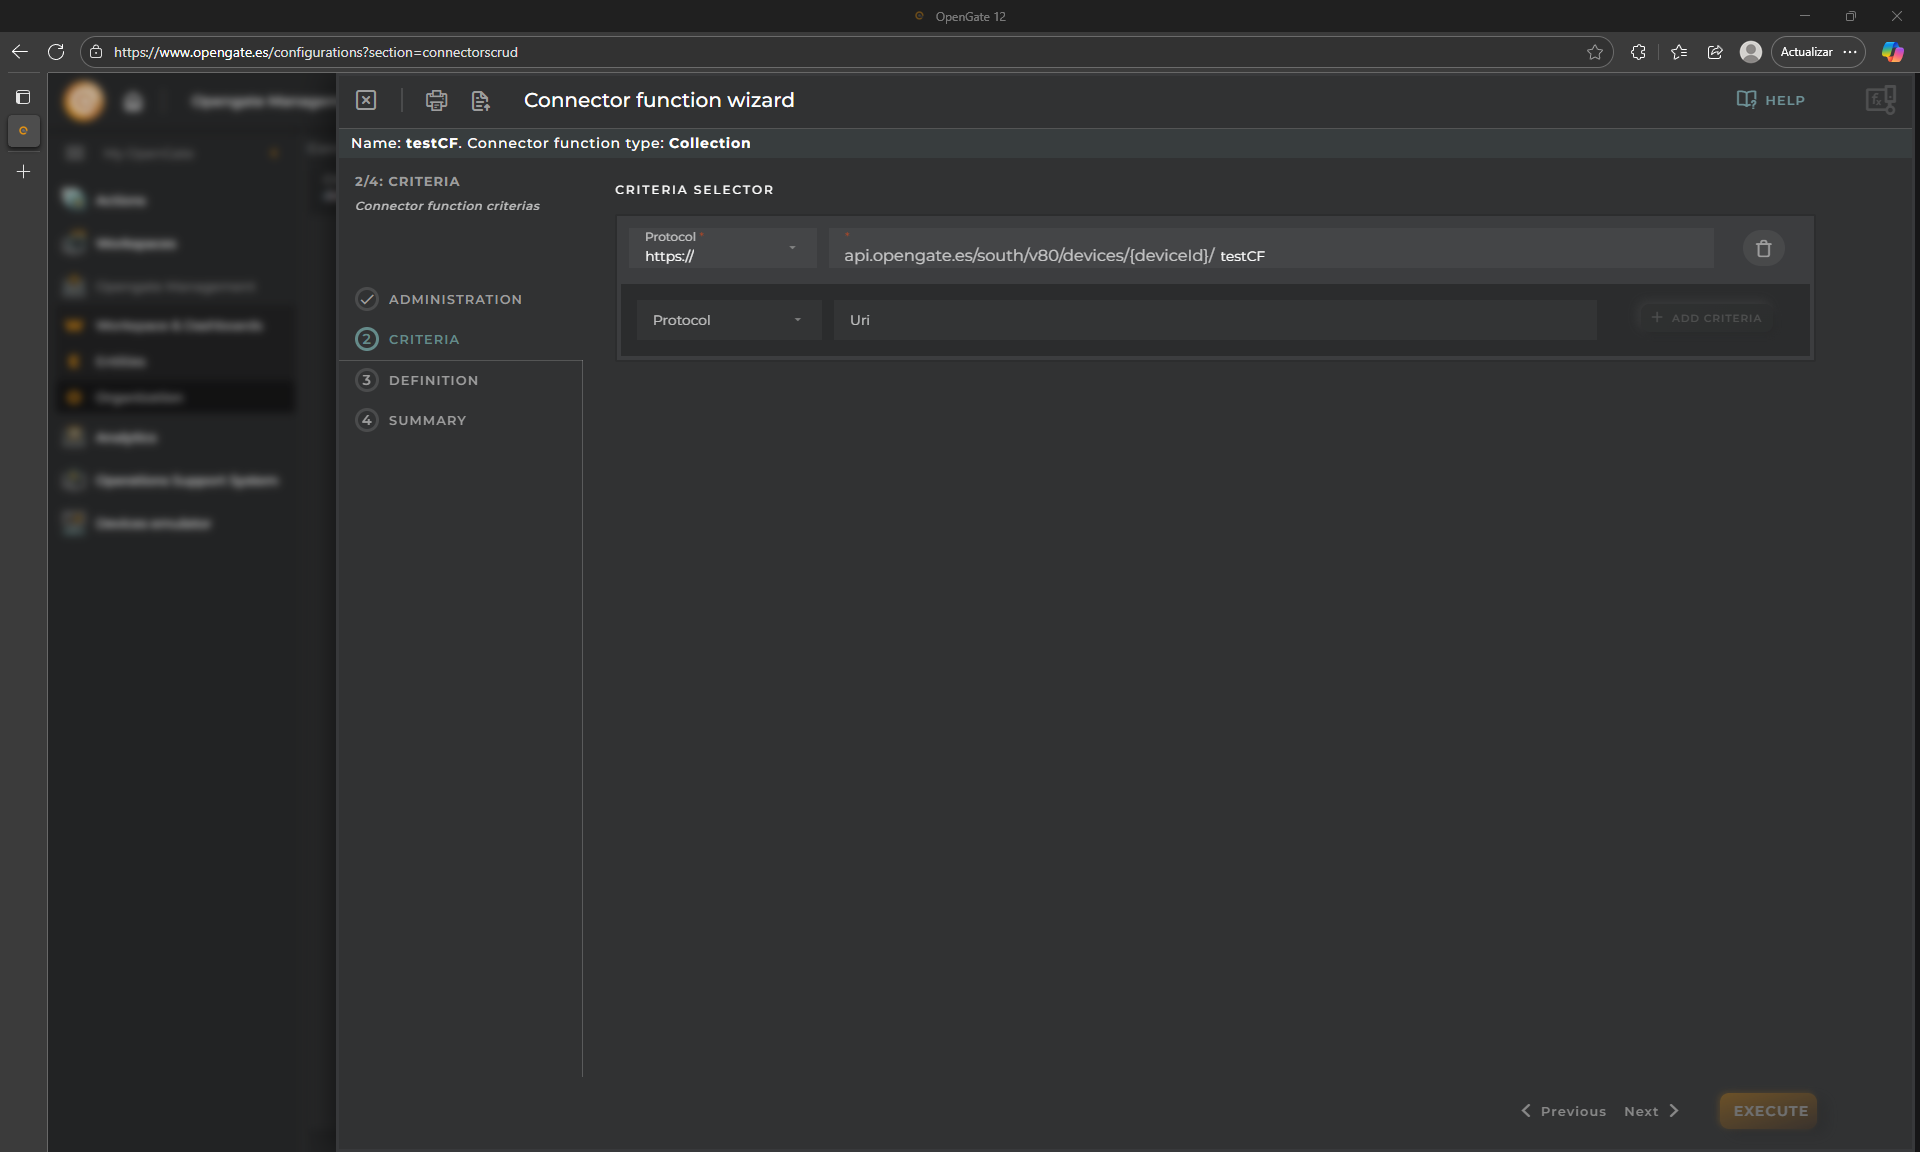
3. Configure criteria
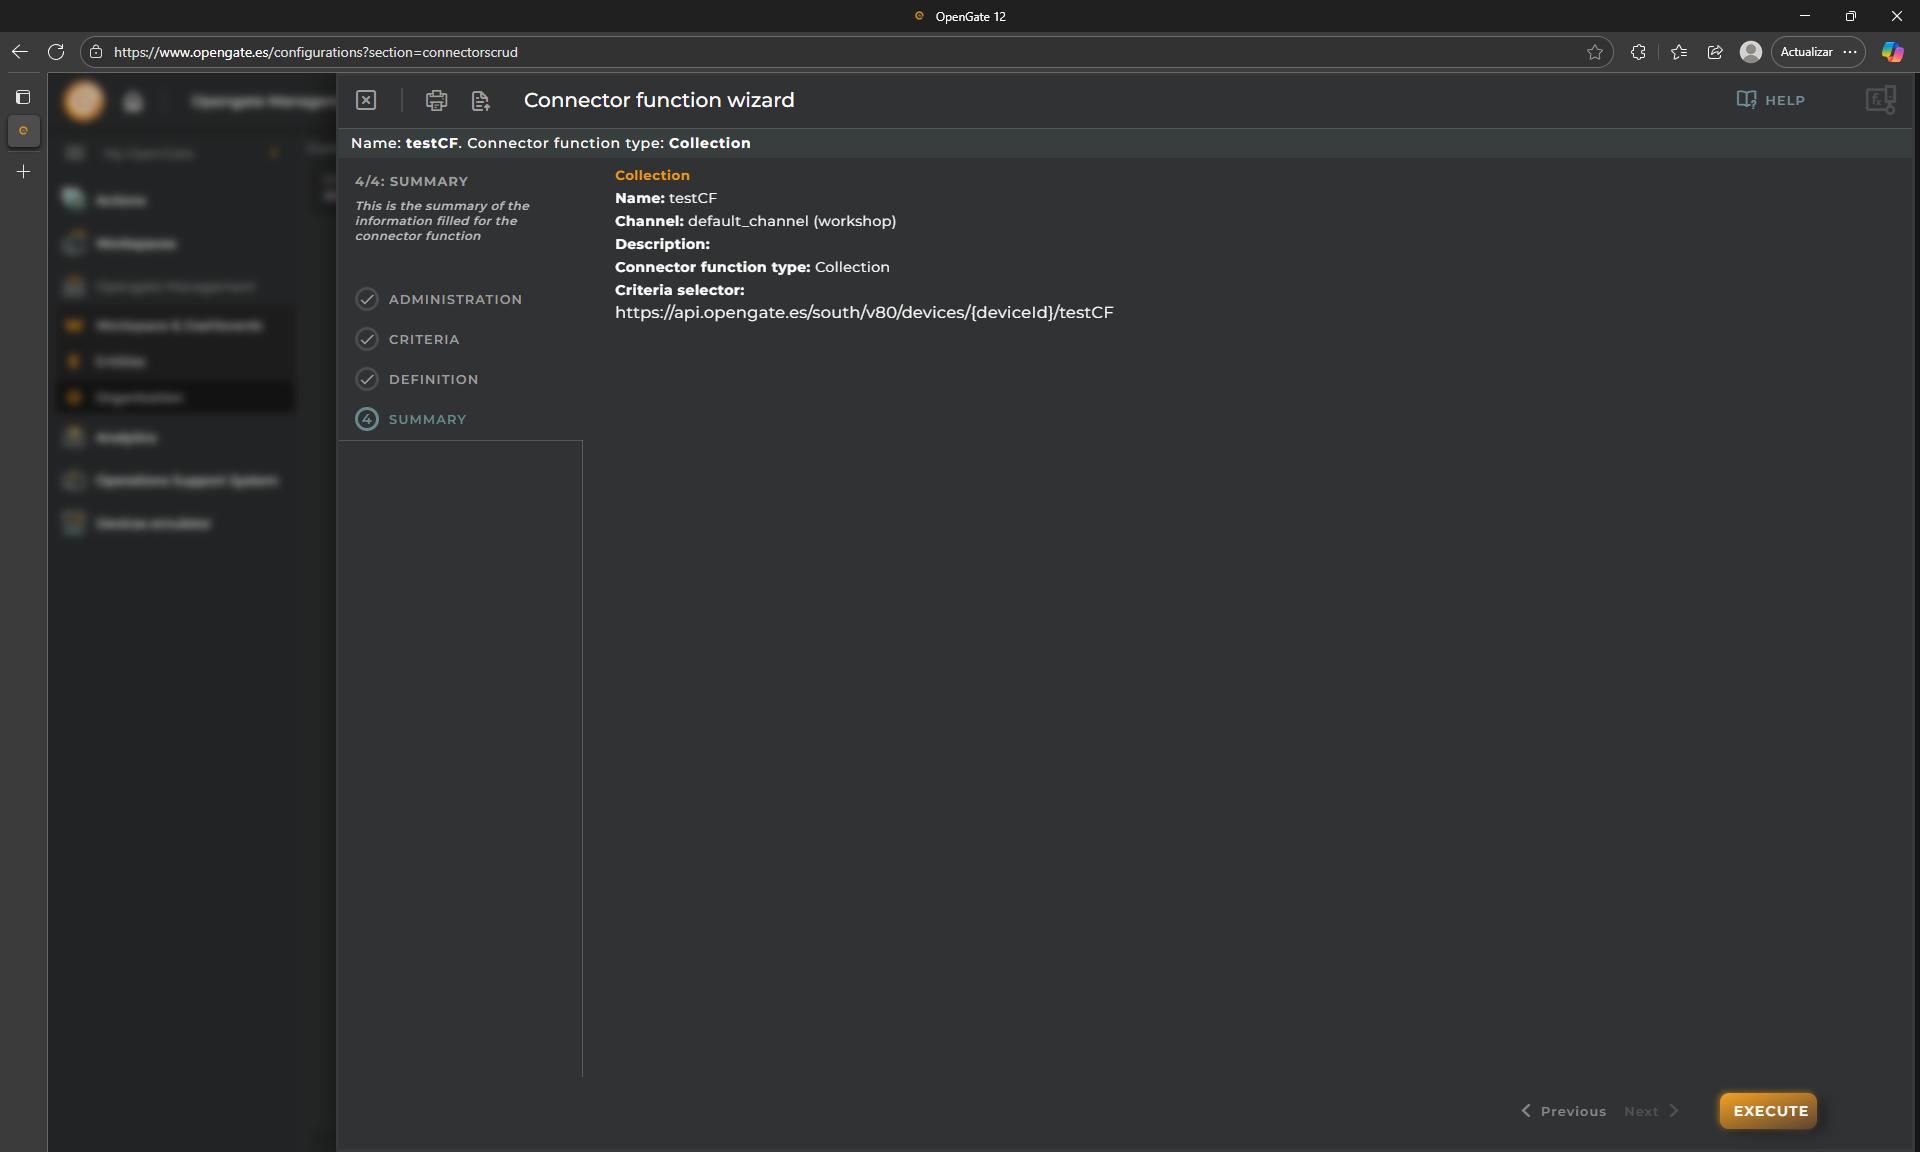
This allows you to decide what of the available protocols will activate this Connector Function and the URI to use as target by the devices collection process. For this demo, we will use https:// and for the URI enter: testCF. As you can see, our endpoint will be https://api.opengate.es/south/v80/devices/{deviceId}/testCF where {deviceID} must be replaced by the device identifier.
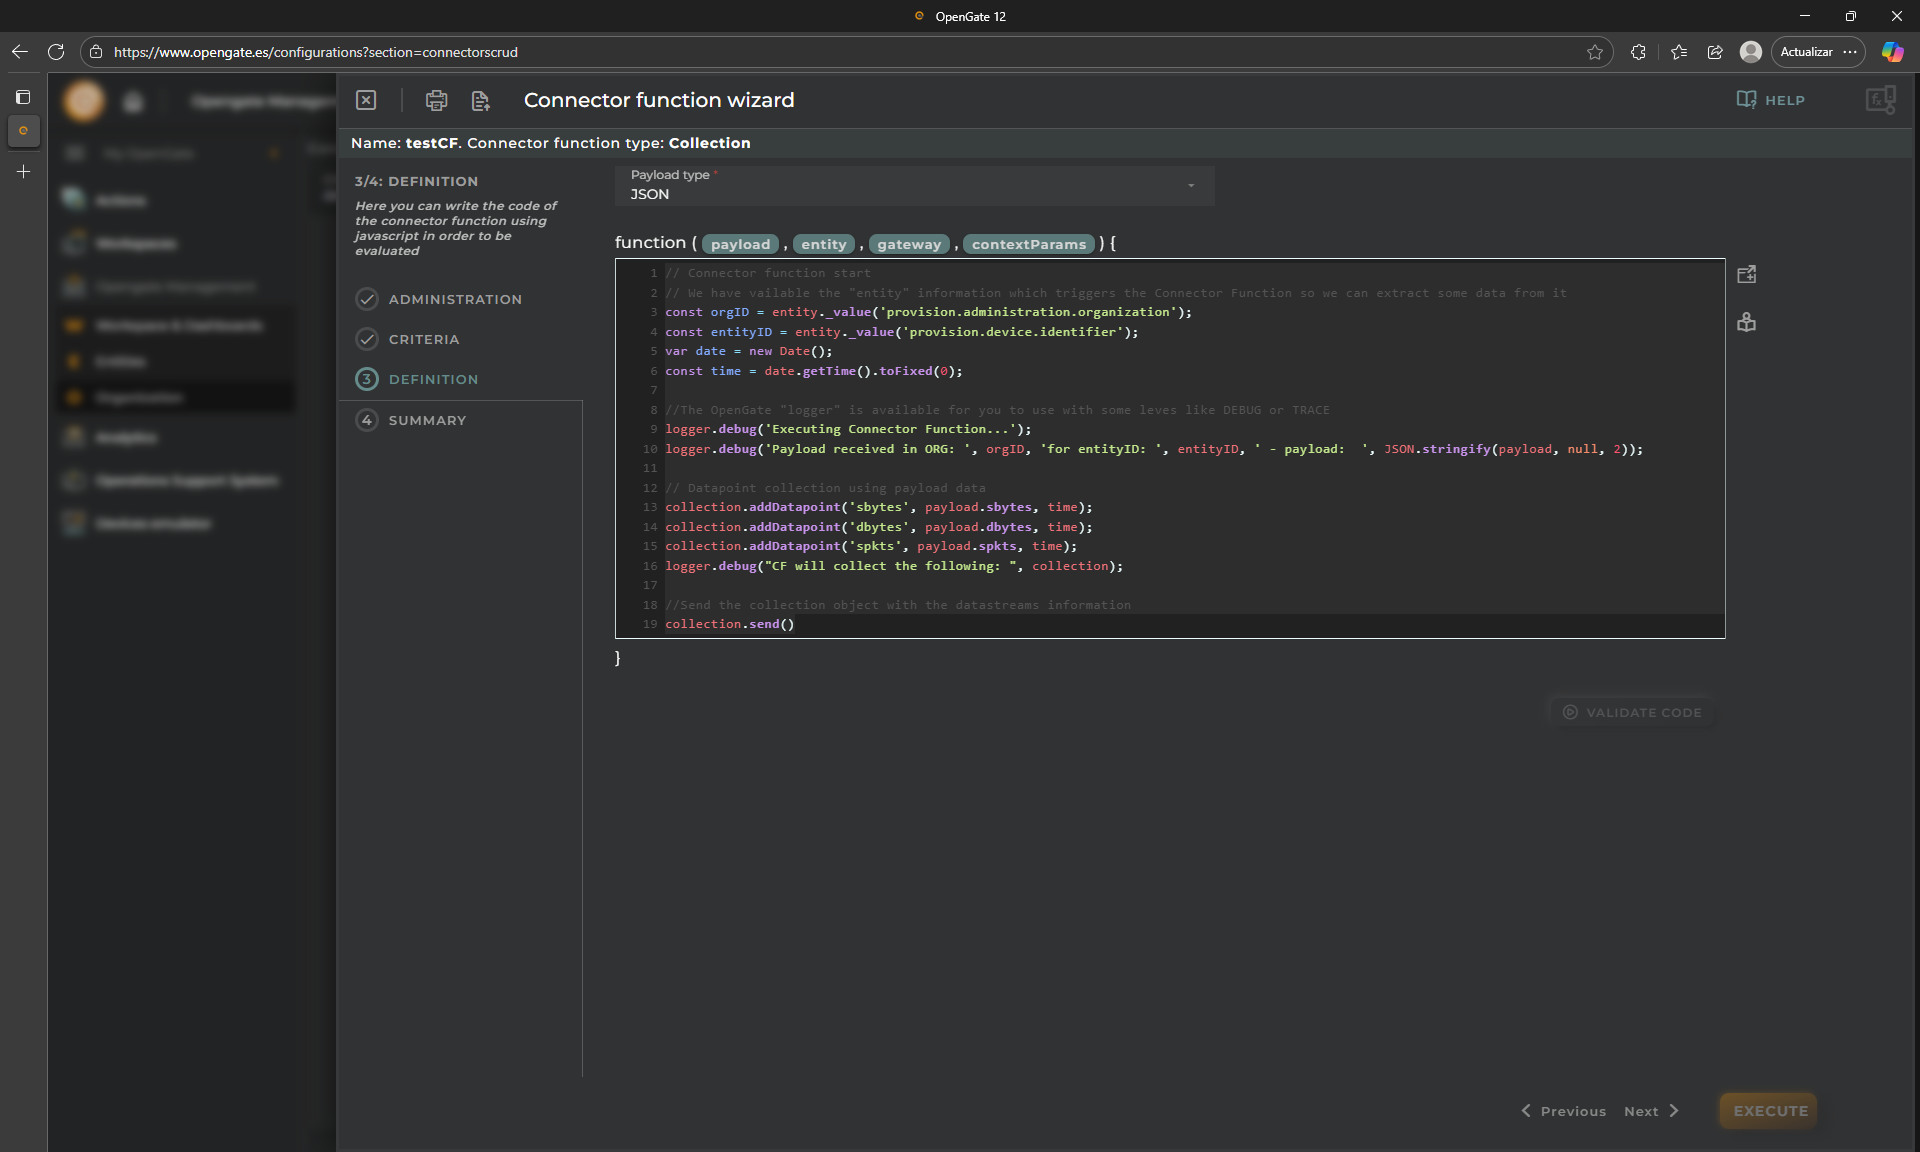
4. Definition, Let’s Coding!
All the power of JavaScript and a lot of predefined functions and connectors are available for you to build your connector function.
For this tutorial, the idea is to show you the power of this functionality, so let’s code a basic connector function that take the values of the payload (we will see later the payload and collect them to the device datastreams).
Check the code below, read the code comments to better understanding:
// Connector function start
// We have vailable the "entity" information which triggers the Connector Function so we can extract some data from it
constorgID=entity._value('provision.administration.organization');
constentityID=entity._value('provision.device.identifier');
vardate=new Date();
consttime=date.getTime().toFixed(0);
//The OpenGate "logger" is available for you to use with some levels like DEBUG or TRACE
logger.debug('Executing Connector Function...');
logger.debug('Payload received in ORG: ', orgID, 'for entityID: ', entityID, ' - payload: ', JSON.stringify(payload, null, 2));
// Datapoint collection using payload data
collection.addDatapoint('temperature', payload.temp, time);
collection.addDatapoint('humidity', payload.hum, time);
collection.addDatapoint('presence', payload.pres, time);
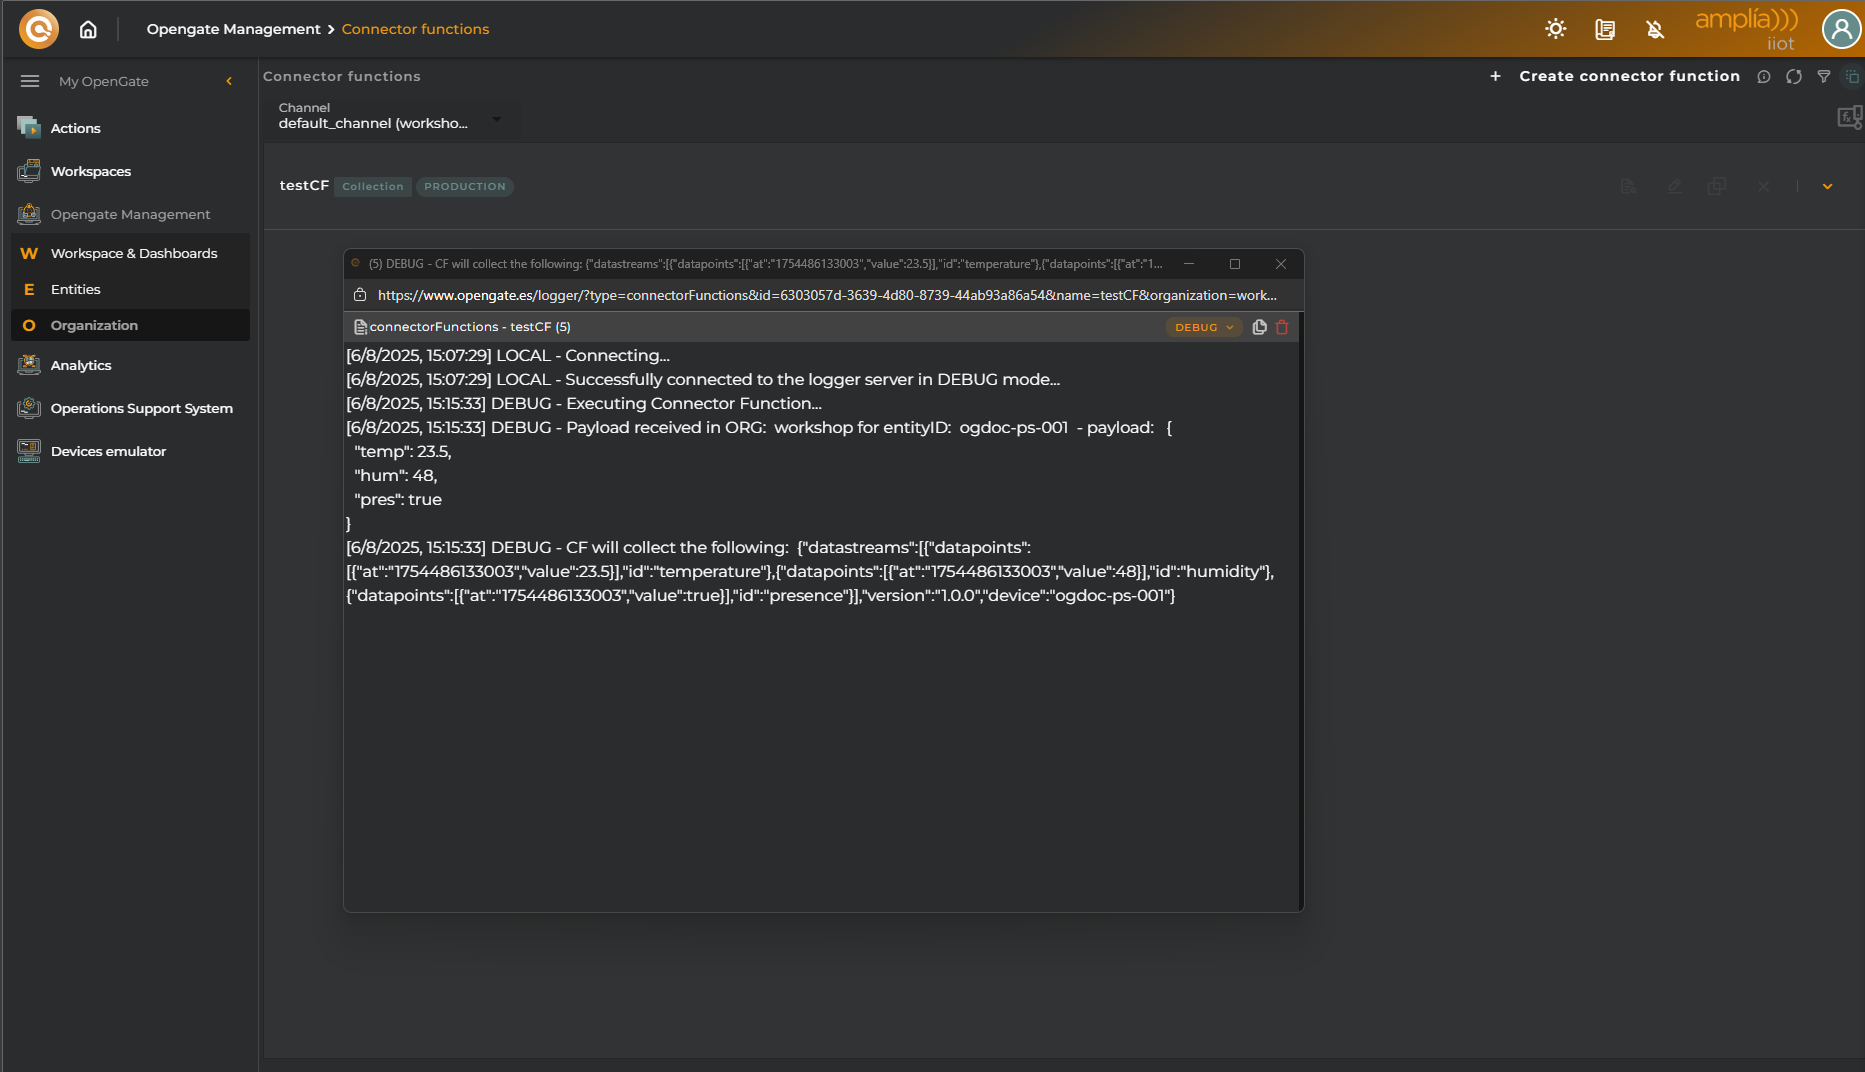
logger.debug("CF will collect the following: ", collection);
//Send the collection object with the datastreams information
collection.send()
Use this code, copy and paste into the code box and click on “VALIDATE CODE”
⚠️ IMPORTANT: Choose JSON as Payload type in the top part of the screen and click on validate code. Then, go to the next step.
5. Review the summary and EXECUTE!
You can check what we will do with this connector function from the summary. Click on “EXECUTE” to save it.
🐞 Step 2: Prepare for Debugging
Now that we have created our Connector Function, we want to ensure that it works so, for that OpenGate offers the possibility to debug it directly on the platform. We need a couple of things…
1. Use a Test Device
Remember our first device: [YourPrefix]-ps-001?
We’ll use it to test the connector function.
Go to OpenGate Management > Devices
Click EDIT from the entity menu
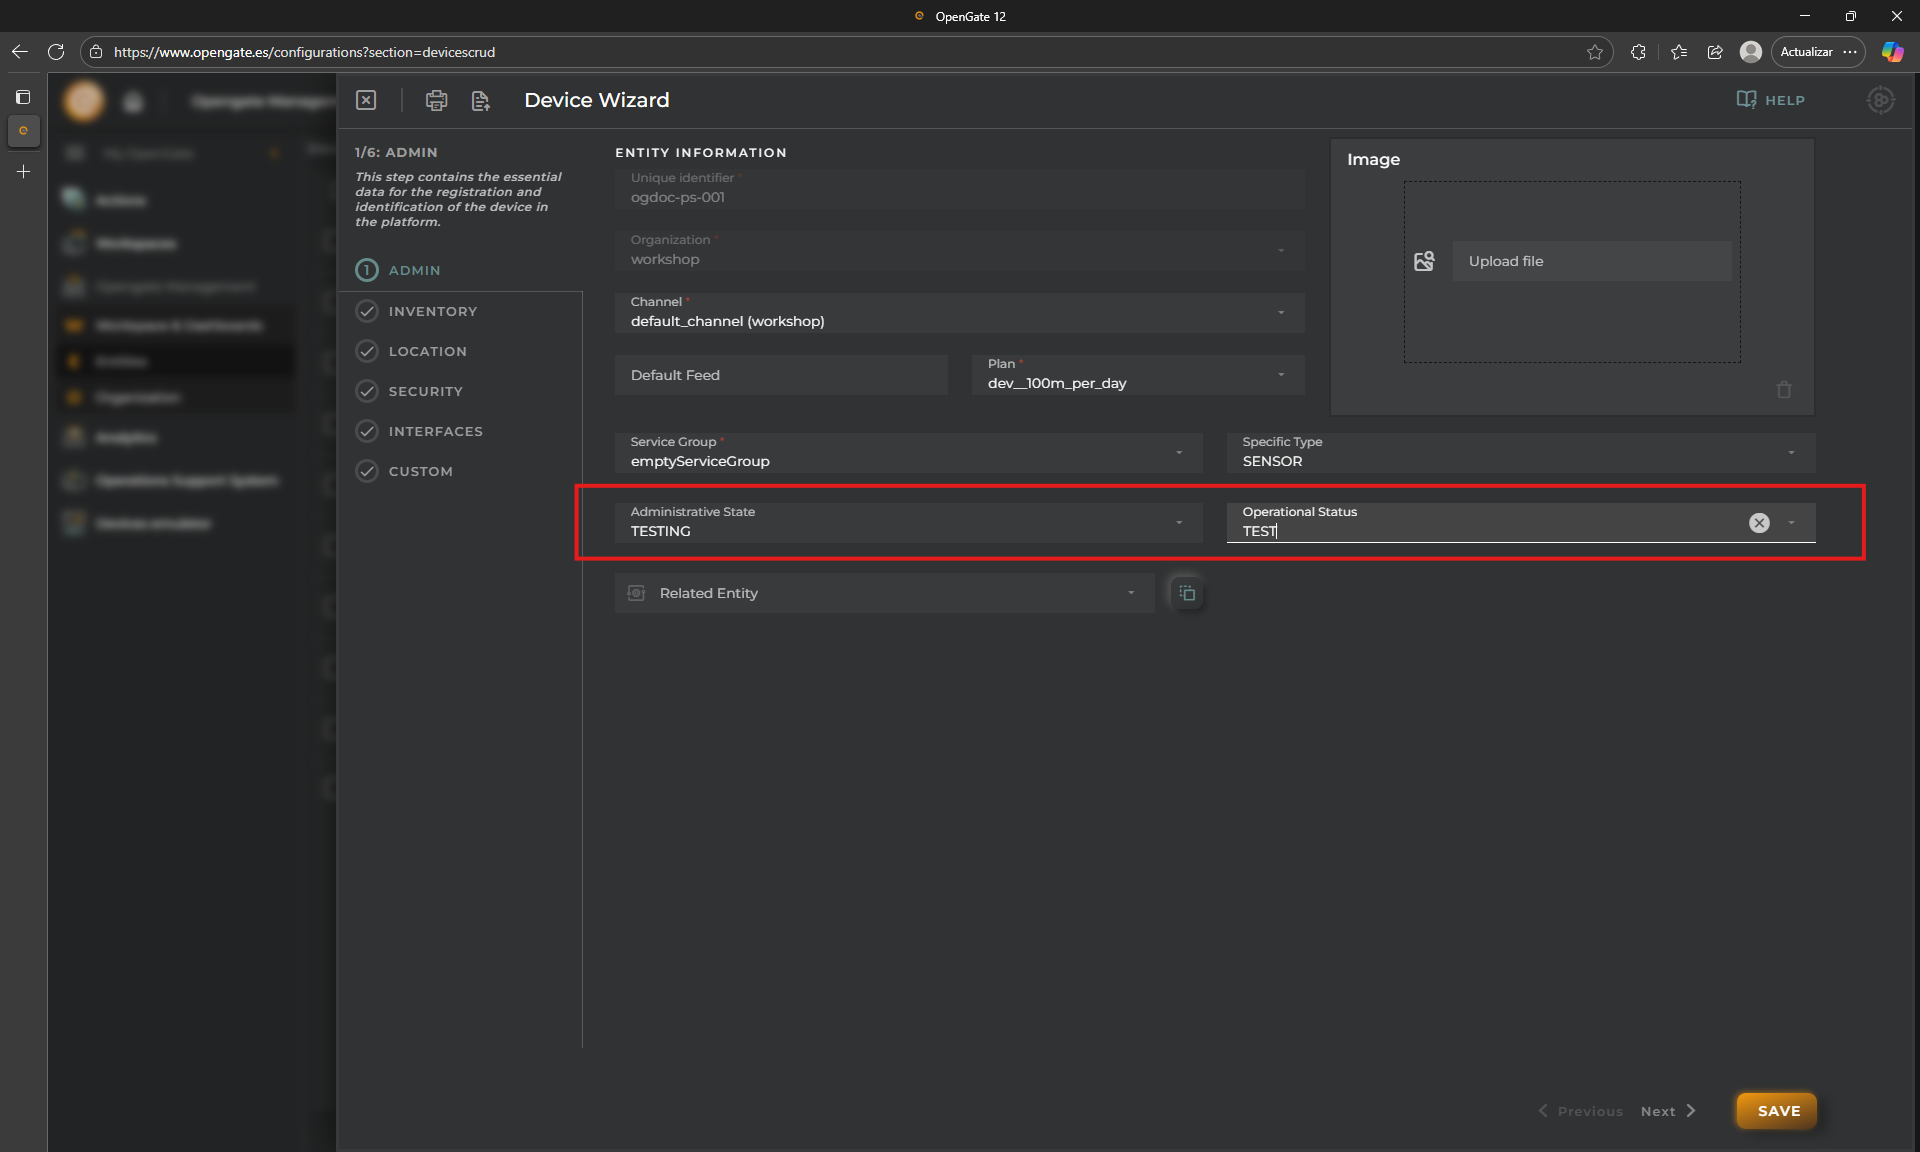
In the wizard:
Set Administrative Status to TESTING
Set Operational Status to TESTING
Click EXECUTE
2. Open Connector Function Logs
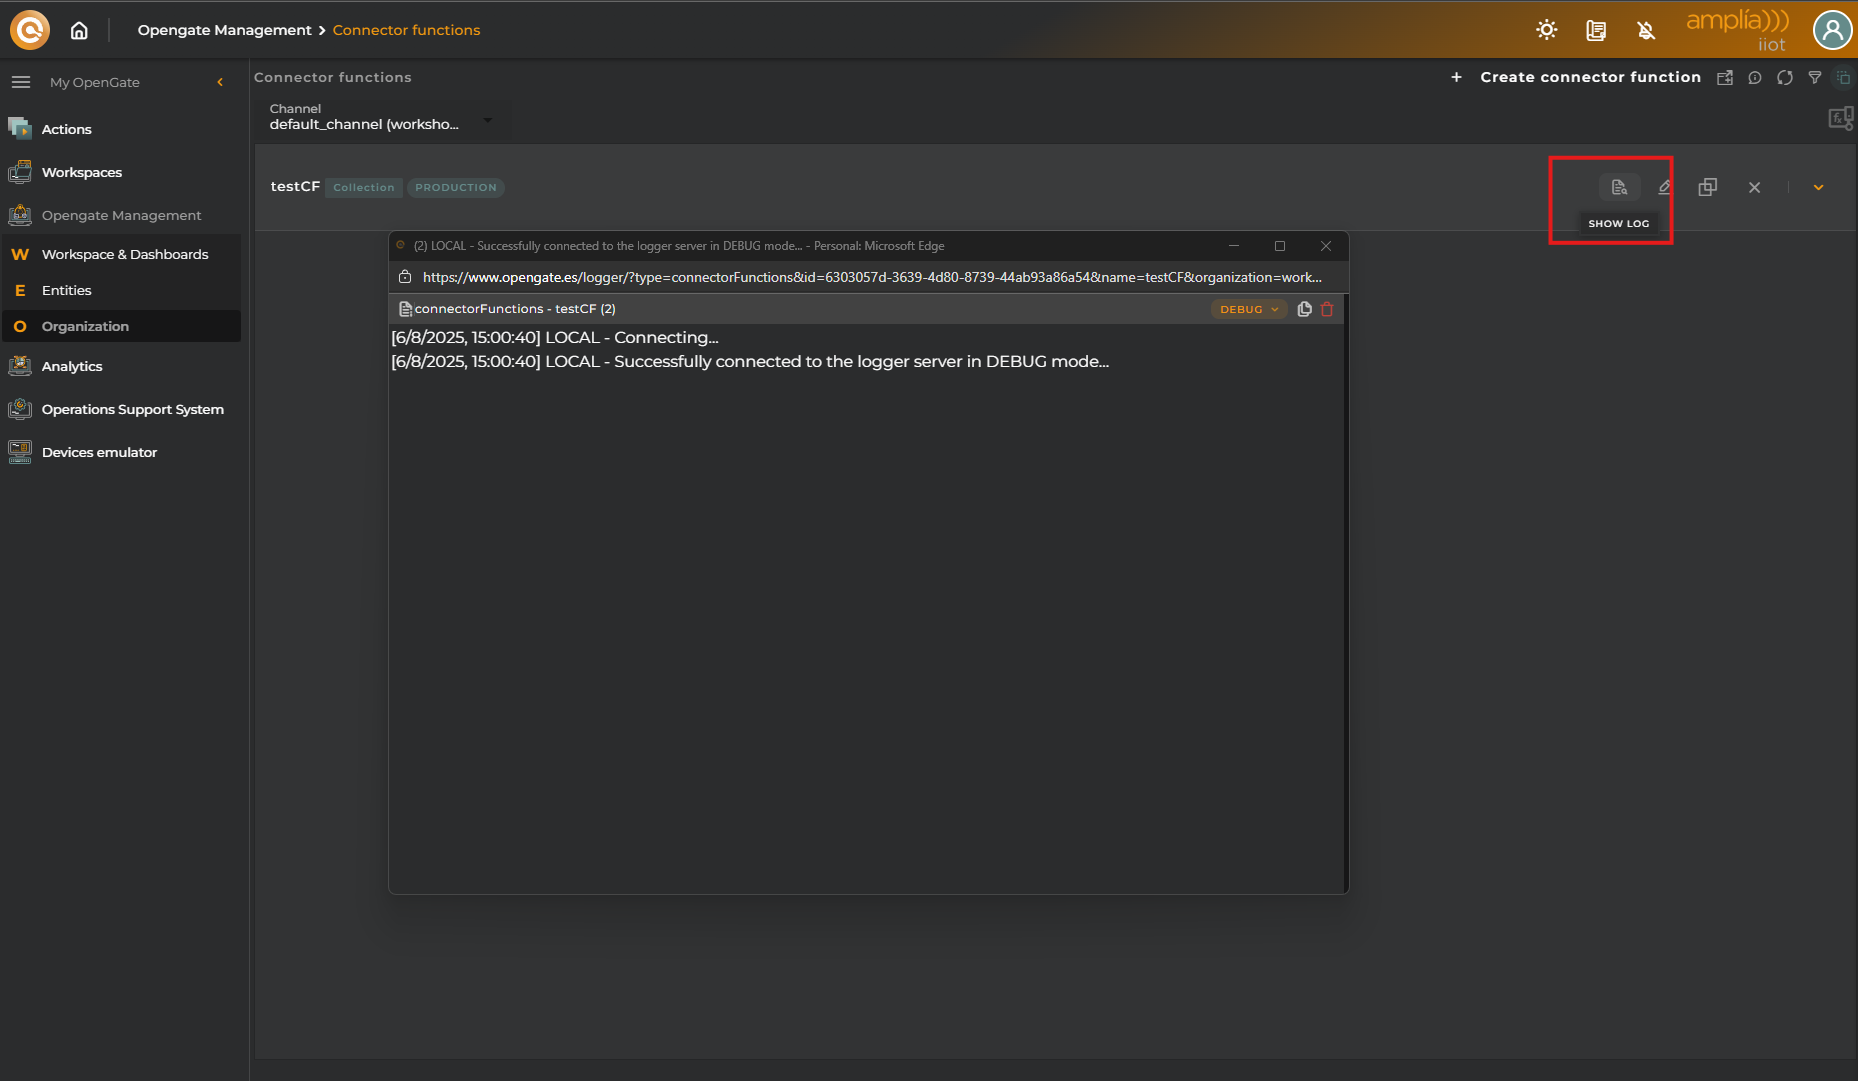
Go to OpenGate Management > Connector Functions
Click on OPEN LOG for your connector function (testCF)
In the log viewer, set the log level to DEBUG to see detailed execution traces that we configured previously.
🔌 Testing with the OpenGate REST API
OpenGate’s REST API provides full access to platform functionality, including data collection. The endpoint used by the Device Emulator is the same one your physical devices will use via the HTTP connector.
1. Prepare Your JSON Payload
For this tutorial, use the following example payload:
{
"temp": 23.5,
"hum": 48,
"pres": true}
2. Retrieve Your API Key
Each OpenGate user has a unique API key for authentication.
Go to the OpenGate Web Console
Click on your user icon (top right)
Copy your API key from the dropdown
⚠️ Important: Keep your API key secure and never share it.
3. Send the Request
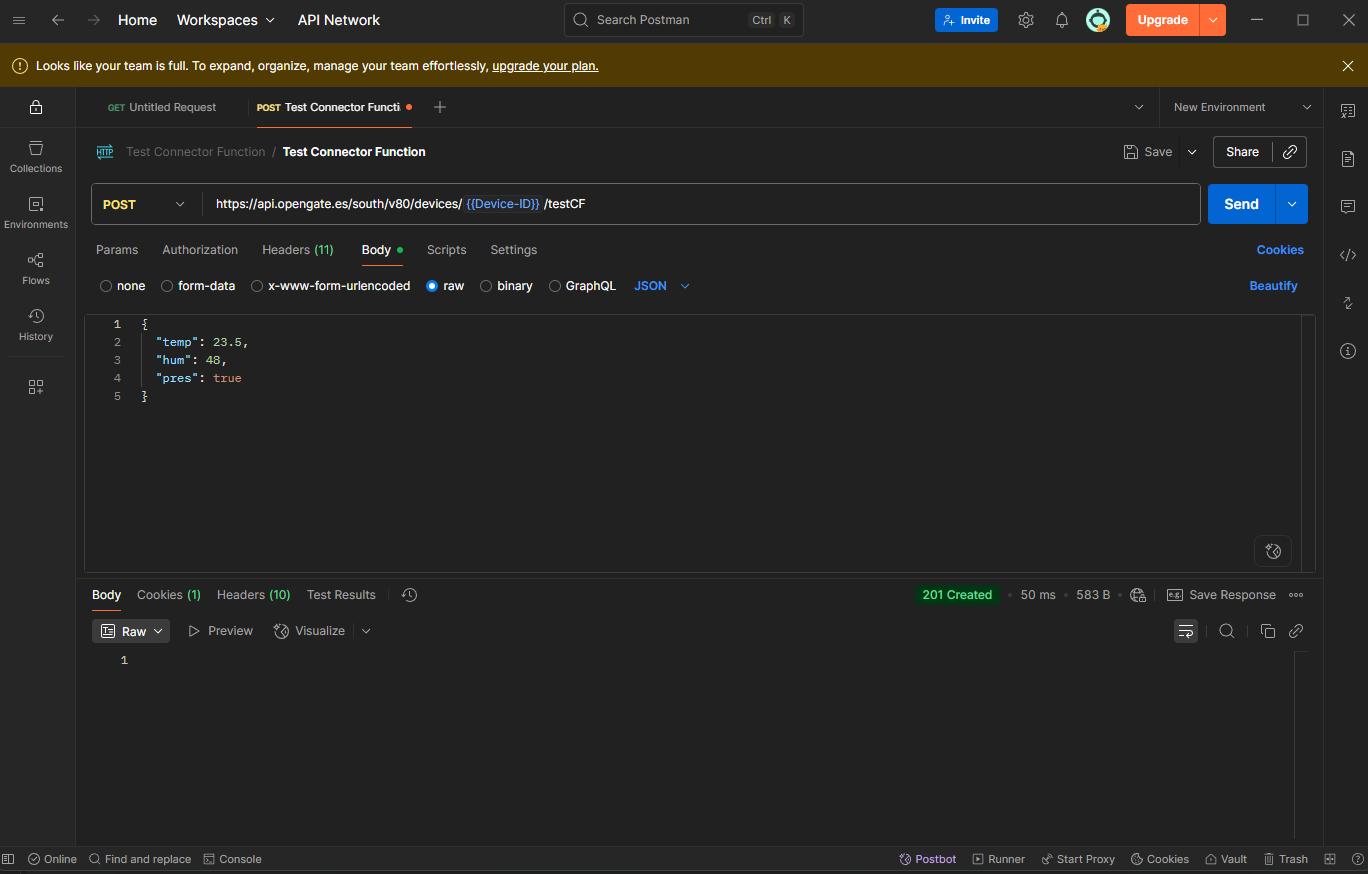
Send a POST request to the collection endpoint replacing {{Device-ID}} with [YourPrefix]-ps-001:
If the response status is 201 Created, your data was successfully received.
📋 Check Connector Function Logs
Return to the Connector Function log viewer and inspect the execution trace.
If the function ran successfully, you’ll see the transformed payload and confirmation of data collection.
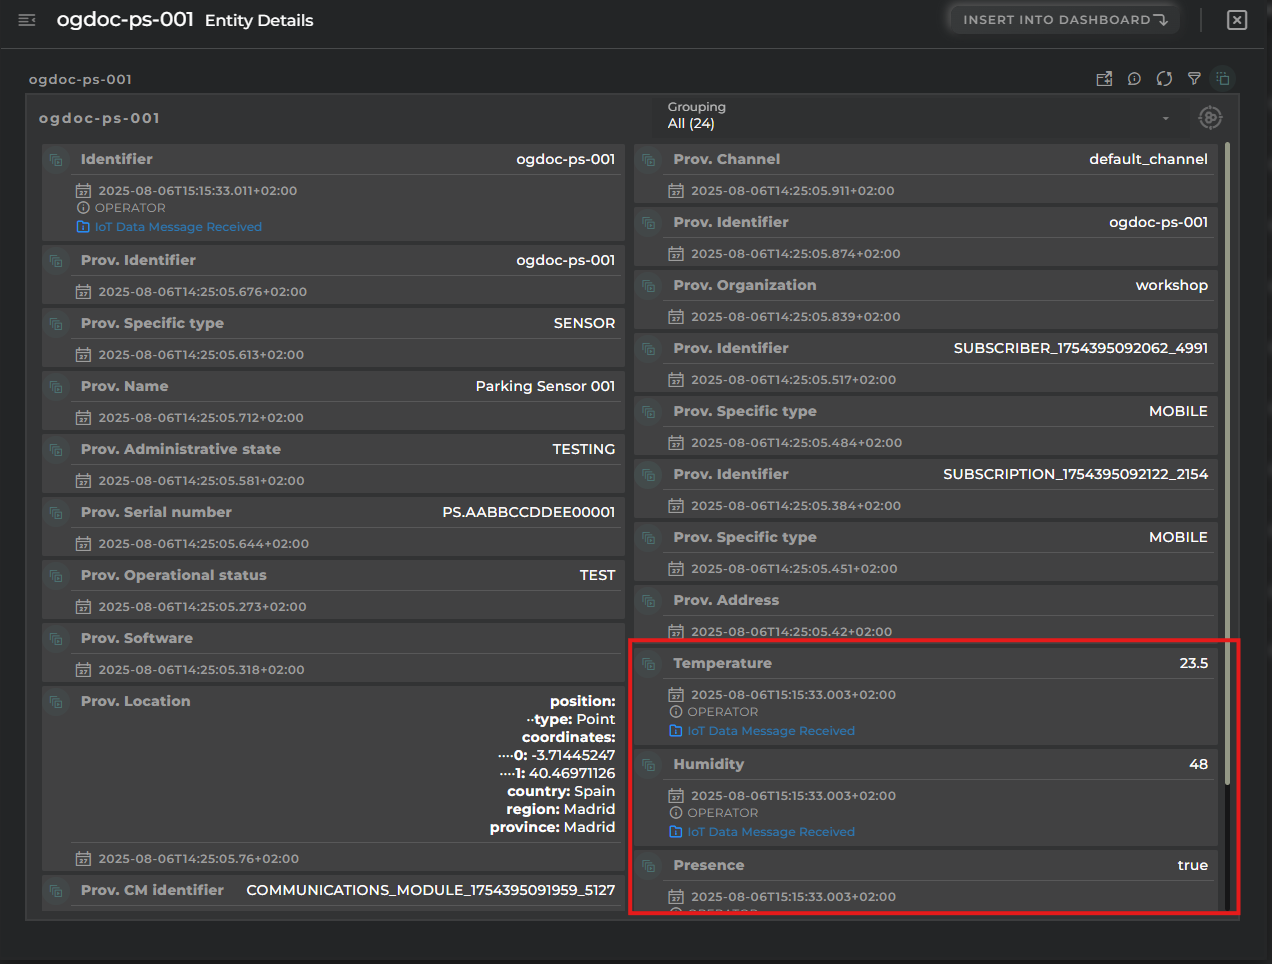
📊 Validate in Entity Details
Finally, go to OpenGate Management > Devices
Open the Entity Details Panel for the device "[YourPrefix]-ps-001"
You should see the collected values displayed in the corresponding datastreams.
🚀 Why Connector Functions Matter
Connector Functions are more than just a technical feature — they’re a gateway to flexibility, interoperability, and control.
In real-world IoT deployments, data rarely arrives in a perfect format or the firmware devices cannot be manipulated. Devices from different vendors, legacy systems, or custom firmware often send payloads that don’t match the expected schema. Without Connector Functions, this would mean costly integrations, manual preprocessing, or limited compatibility, as well as generate and deploy new software versions when devices or firmwares change…
With OpenGate’s Connector Functions, users can:
🧠 Transform incoming data to match their datamodels, regardless of origin for different supported protocols (HTTPs, COAPs, DLMs, etc.).
🧩 Enrich telemetry with metadata, calculated fields, or contextual information and fill other datastreams with values calculated in processing time.
🔄 Normalize formats across heterogeneous devices and protocols.
🛠️ Adapt to change — update logic as devices evolve or business rules shift directly from the OpenGate Web Console.
📈 Accelerate onboarding by removing friction between device and platform, or additional services.
Whether you’re integrating industrial PLCs, smart meters, or custom-built sensors, Connector Functions empower you to make OpenGate work for your data — not the other way around.
💡 Pro Tip: Use Connector Functions to build reusable logic across multiple devices or projects. They’re not just a patch — they’re a strategic tool for scalable IoT architecture.
7. Workspaces & Dashboards
🧭 Workspaces & Dashboards in OpenGate
In the previous steps, we’ve covered everything needed to collect data in OpenGate and make information from devices and assets available on the platform. We’ve provisioned entities, configured datastreams, and started receiving real-time data even adjusting the data using Connector Functions.
Now it’s time to shape that data so we can work with it effectively and build our IoT solution on top of OpenGate. To do this, we’ll use Workspaces, which allow you to visualize, organize and build your solution areas, and Dashboards, where you usually work to monitor, explore, and interact with entities data in real time.
A Workspace is a container that organizes dashboards around a specific context — such as a location, a functionality, a project, or a team.
A Dashboard is a visual canvas within a workspace, composed of customizable Widgets that display data from entities, datastreams, or assets and allows you to interact with your entities.
Widgets are the building blocks of dashboards. OpenGate has a huge catalog that includes customizable tables, maps, charts, gauges, HMIs, and more — each designed to present data in a specific format.
📌 Note: Workspaces can be shared with other users in your organization. This allows administrators to create curated views and make them available to operators, analysts, or any users group.
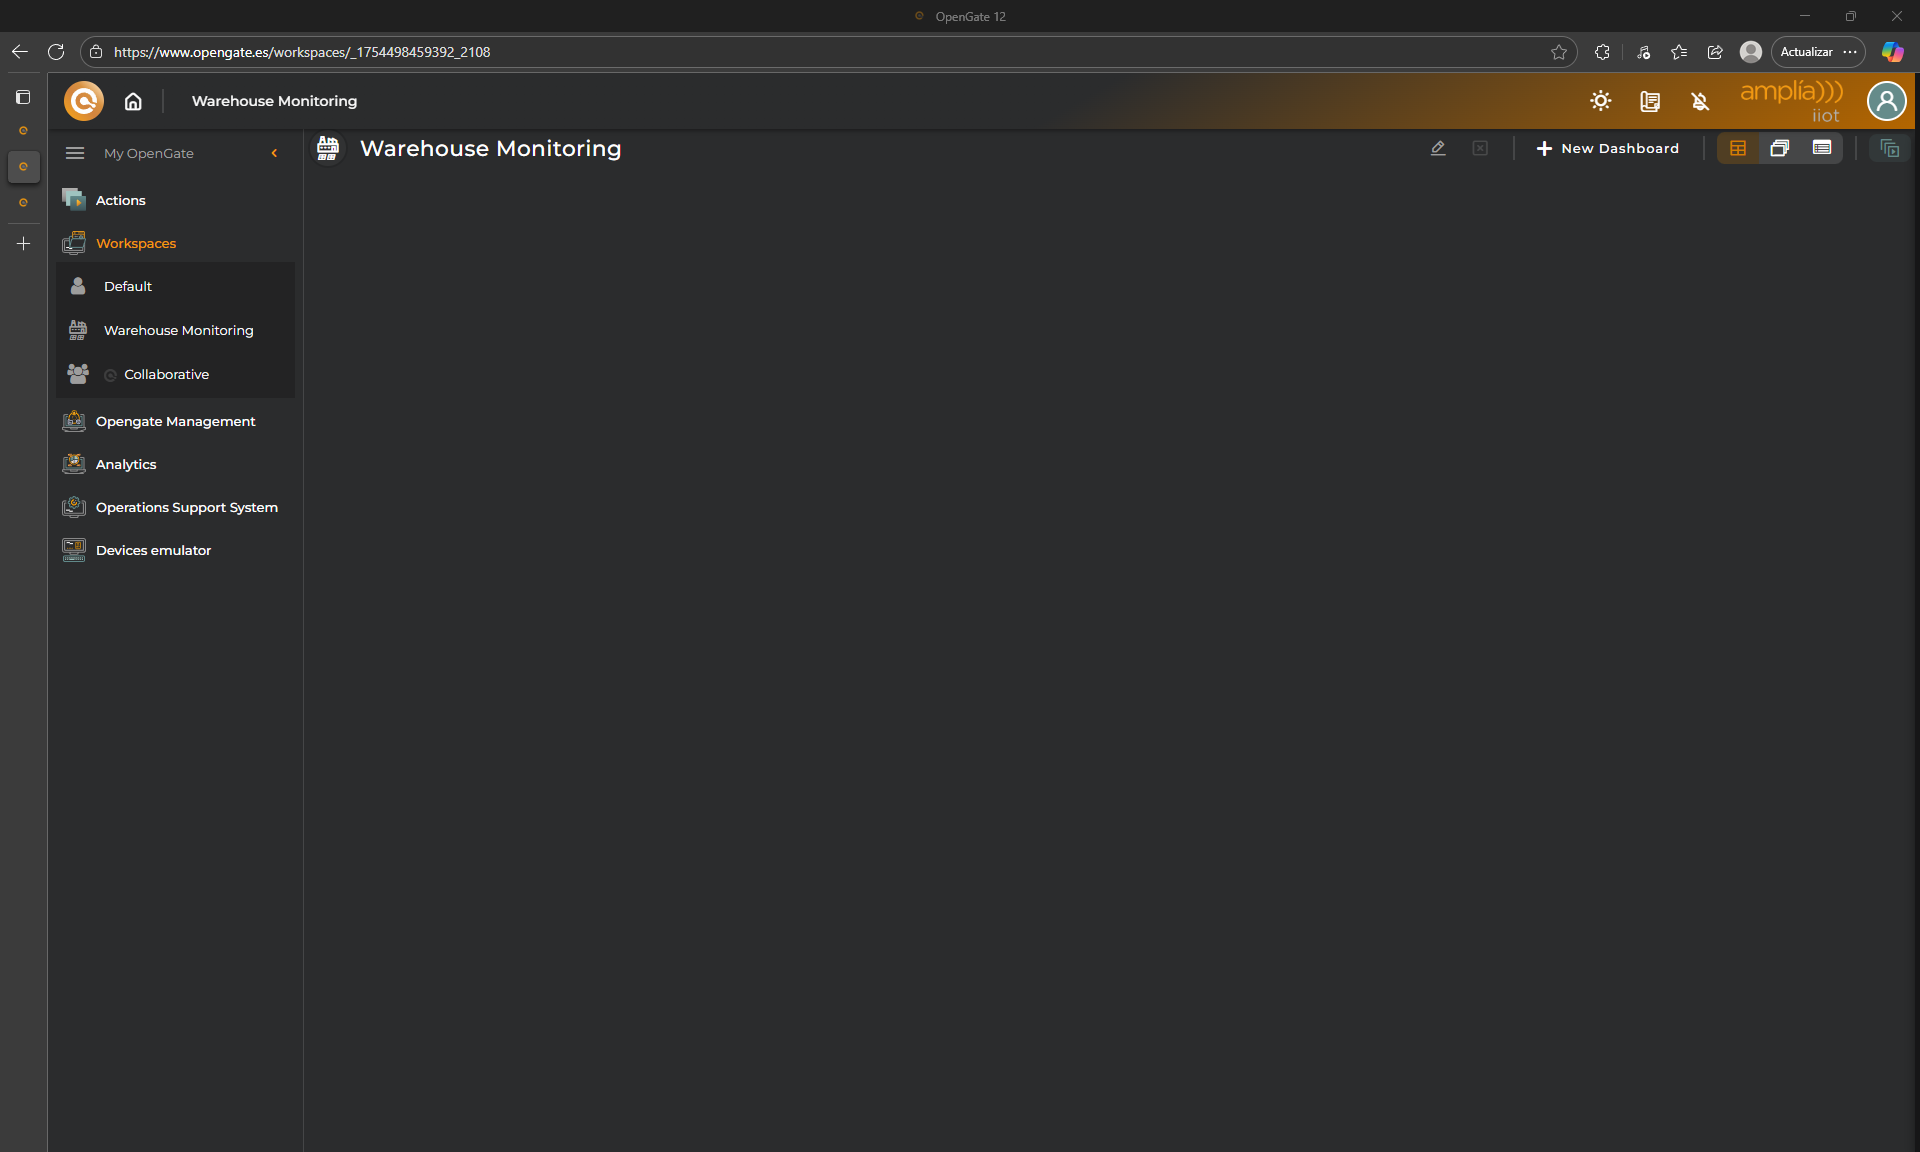
🏗️ Creating a Workspace and Dashboard
Let’s continue with our ongoing warehouse scenario. We’ve already provisioned sensors and collected data. Now, we’ll create a workspace and dashboard to visualize that information.
🗃️ Step 1: Create a Workspace
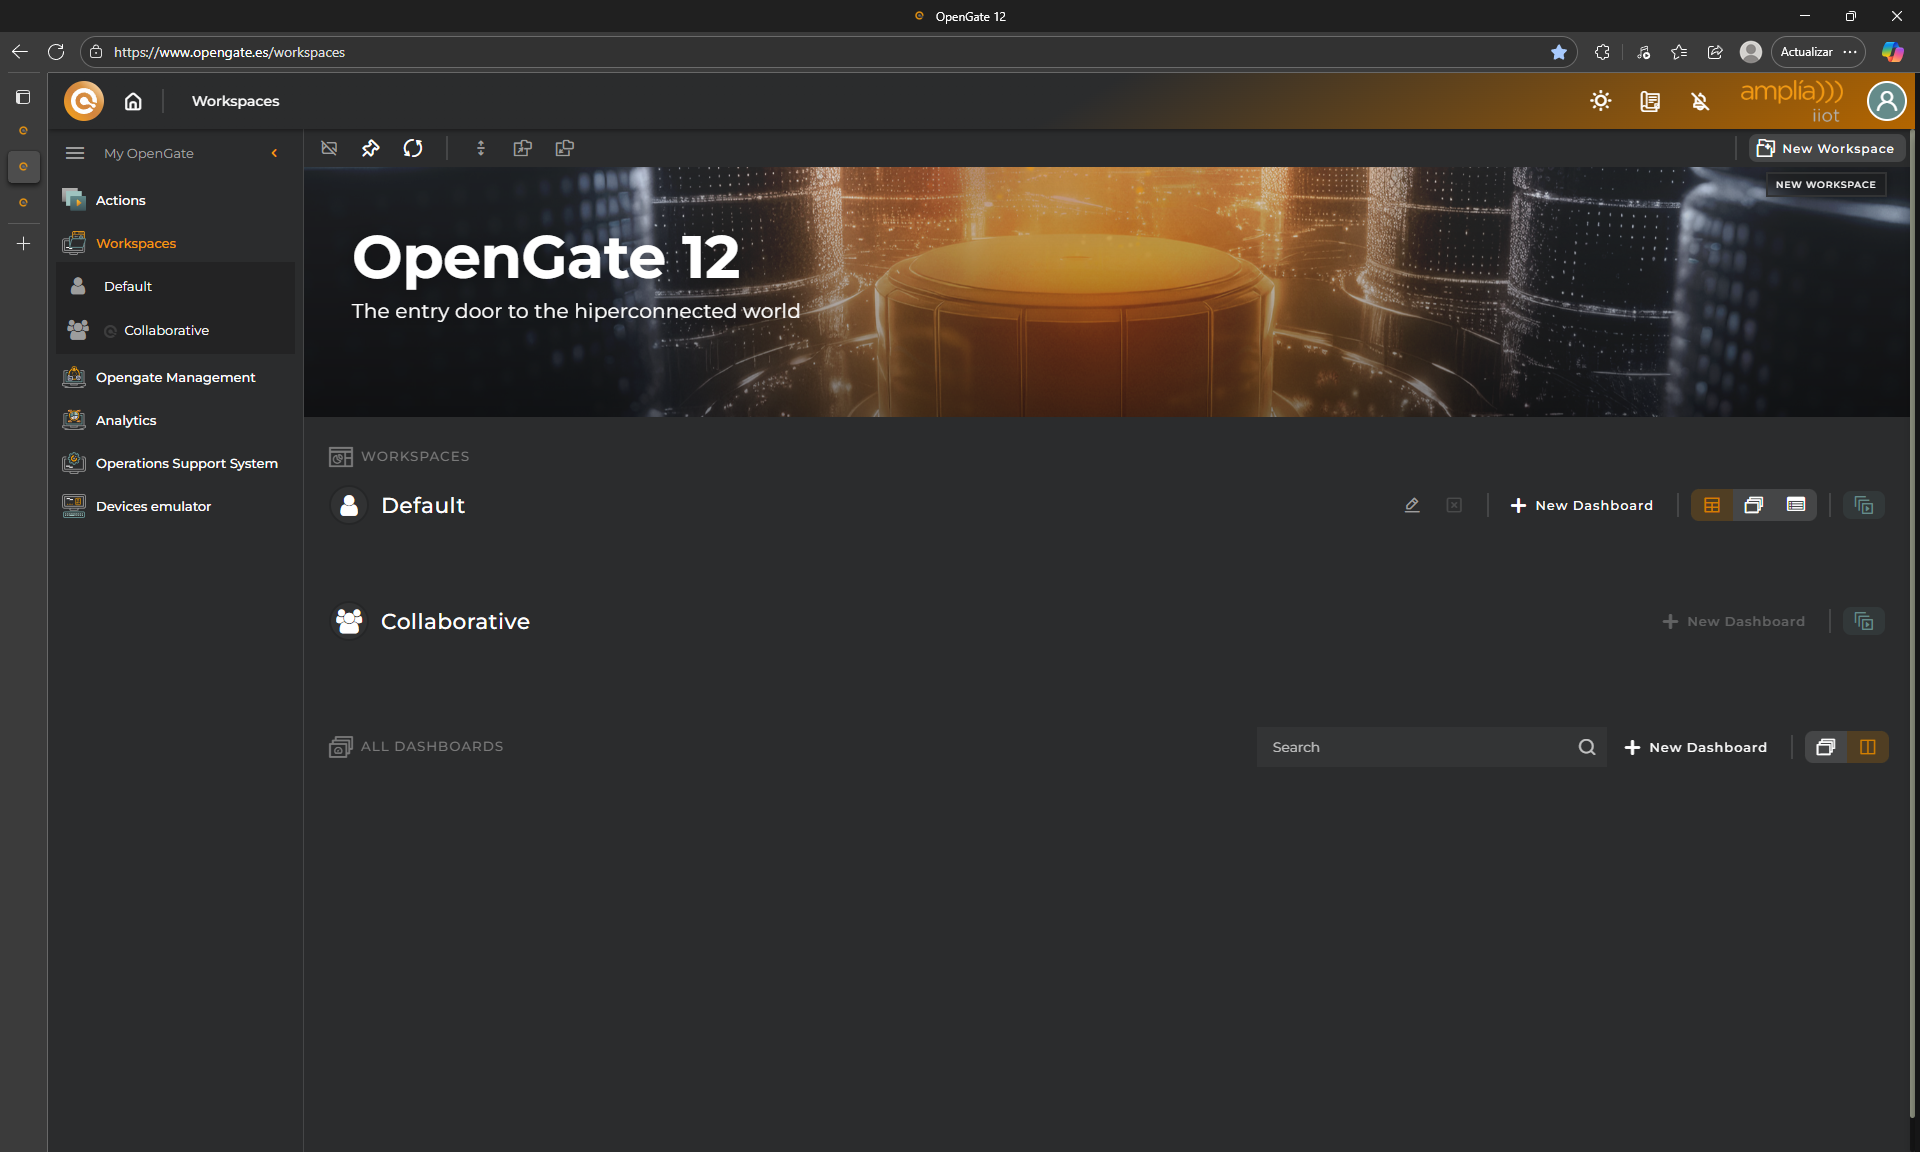
Go to OpenGate Management > Workspaces, you can open in new window
Click on New Workspace
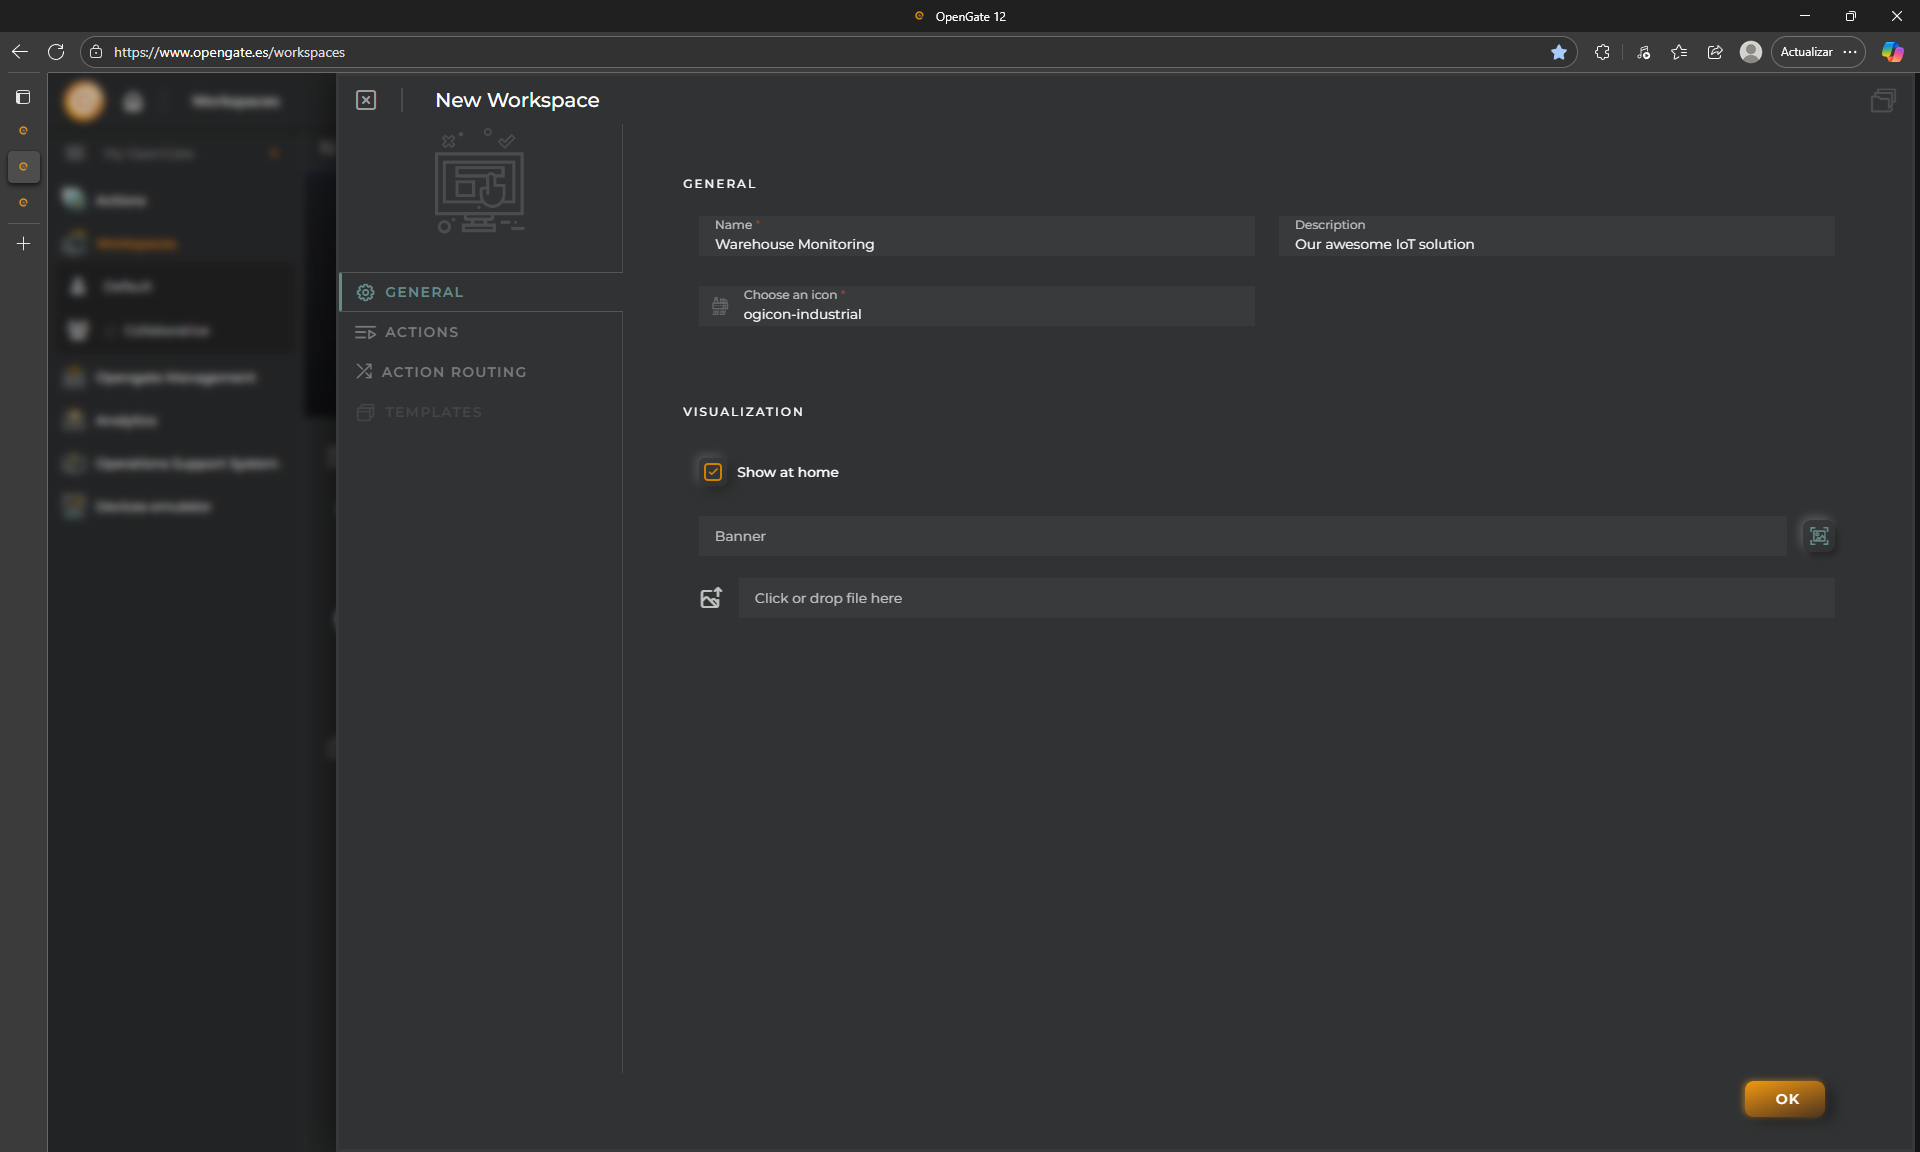
Now fill the information required and click on “OK”:
Name: Use Warehouse Monitoring
Description: Enter something if you like, for example: Our awesome IoT solution
Choose an icon: OpenGate has a huge predefined library, use ogicon-industrial
Visualization: Check “Show at home” to be able to see this workspace on the home screen.
Banner: It is possible to redefine the banner or background image, keep it blank for this tutorial
👏 Done! OpenGate redirects you directly to the new workspace view
📊 Step 2: Create a Dashboard
Let’s continue. Inside the workspace, you just need to click on “+ NEW DASHBOARD”
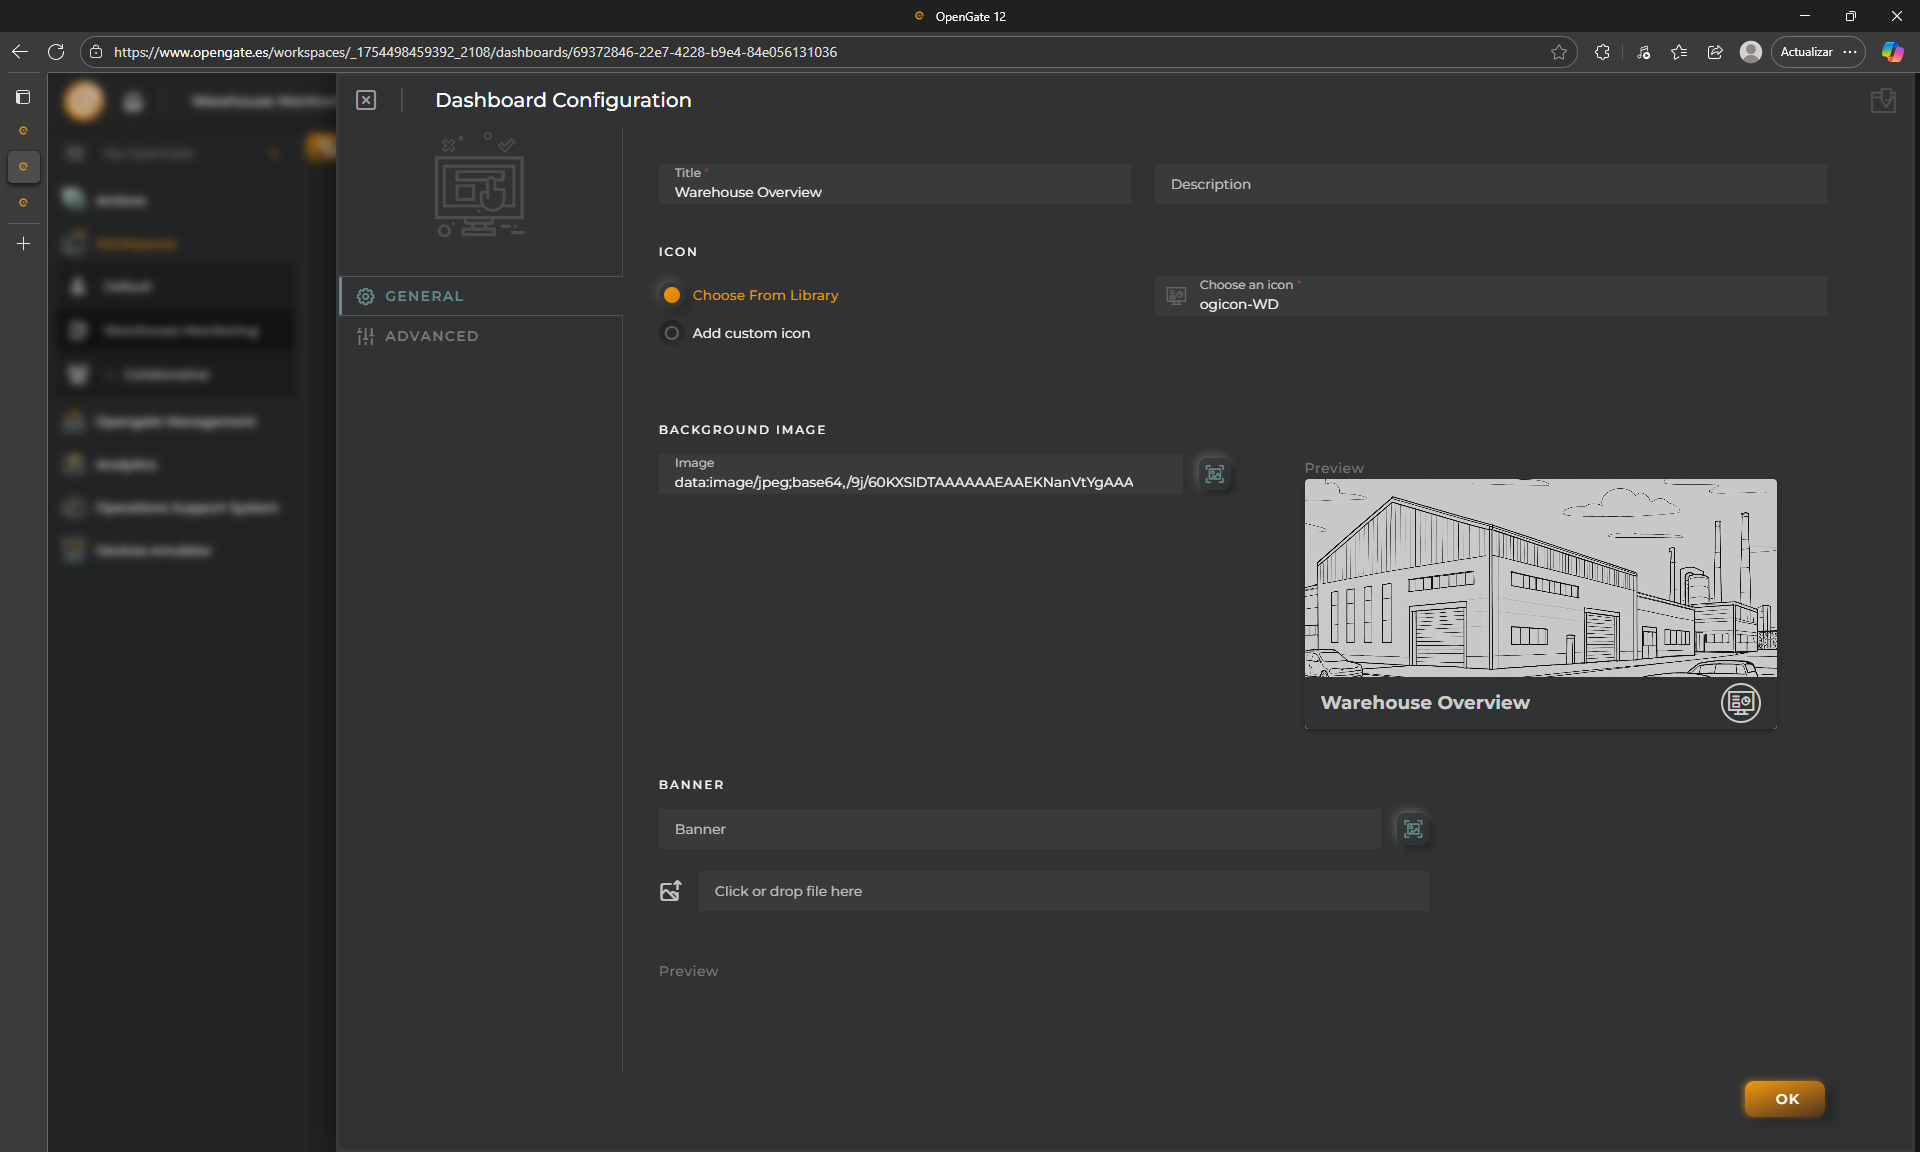
Now, we need to configure our dashboard. For this tutorial we fill the following data.
Name: use Warehouse Overview
Icon: choose one, for example ogicon-WD
Image: Use default or something like this: 🖼️warehouse.jpg
Click on “OK” and your new dashboard is created
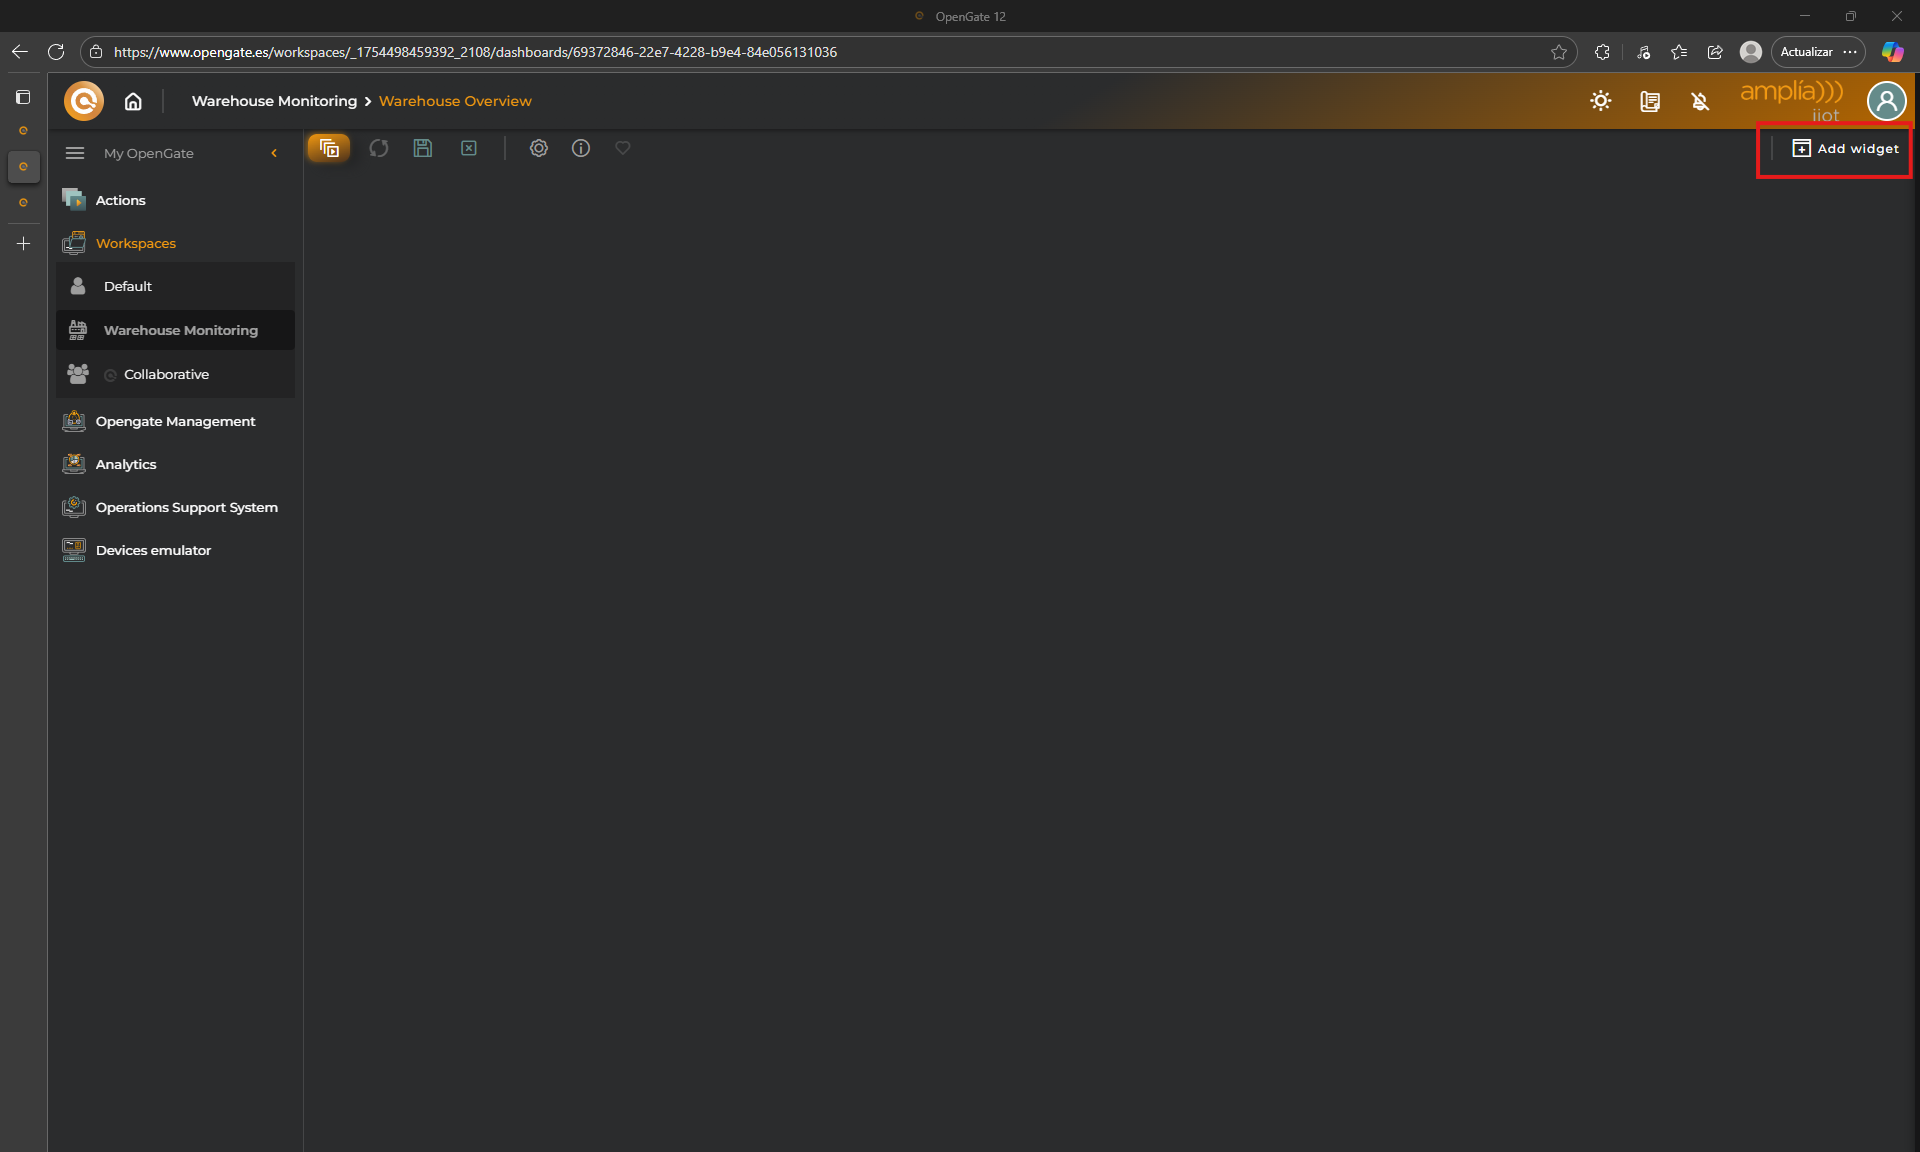
🧩 Adding Widgets
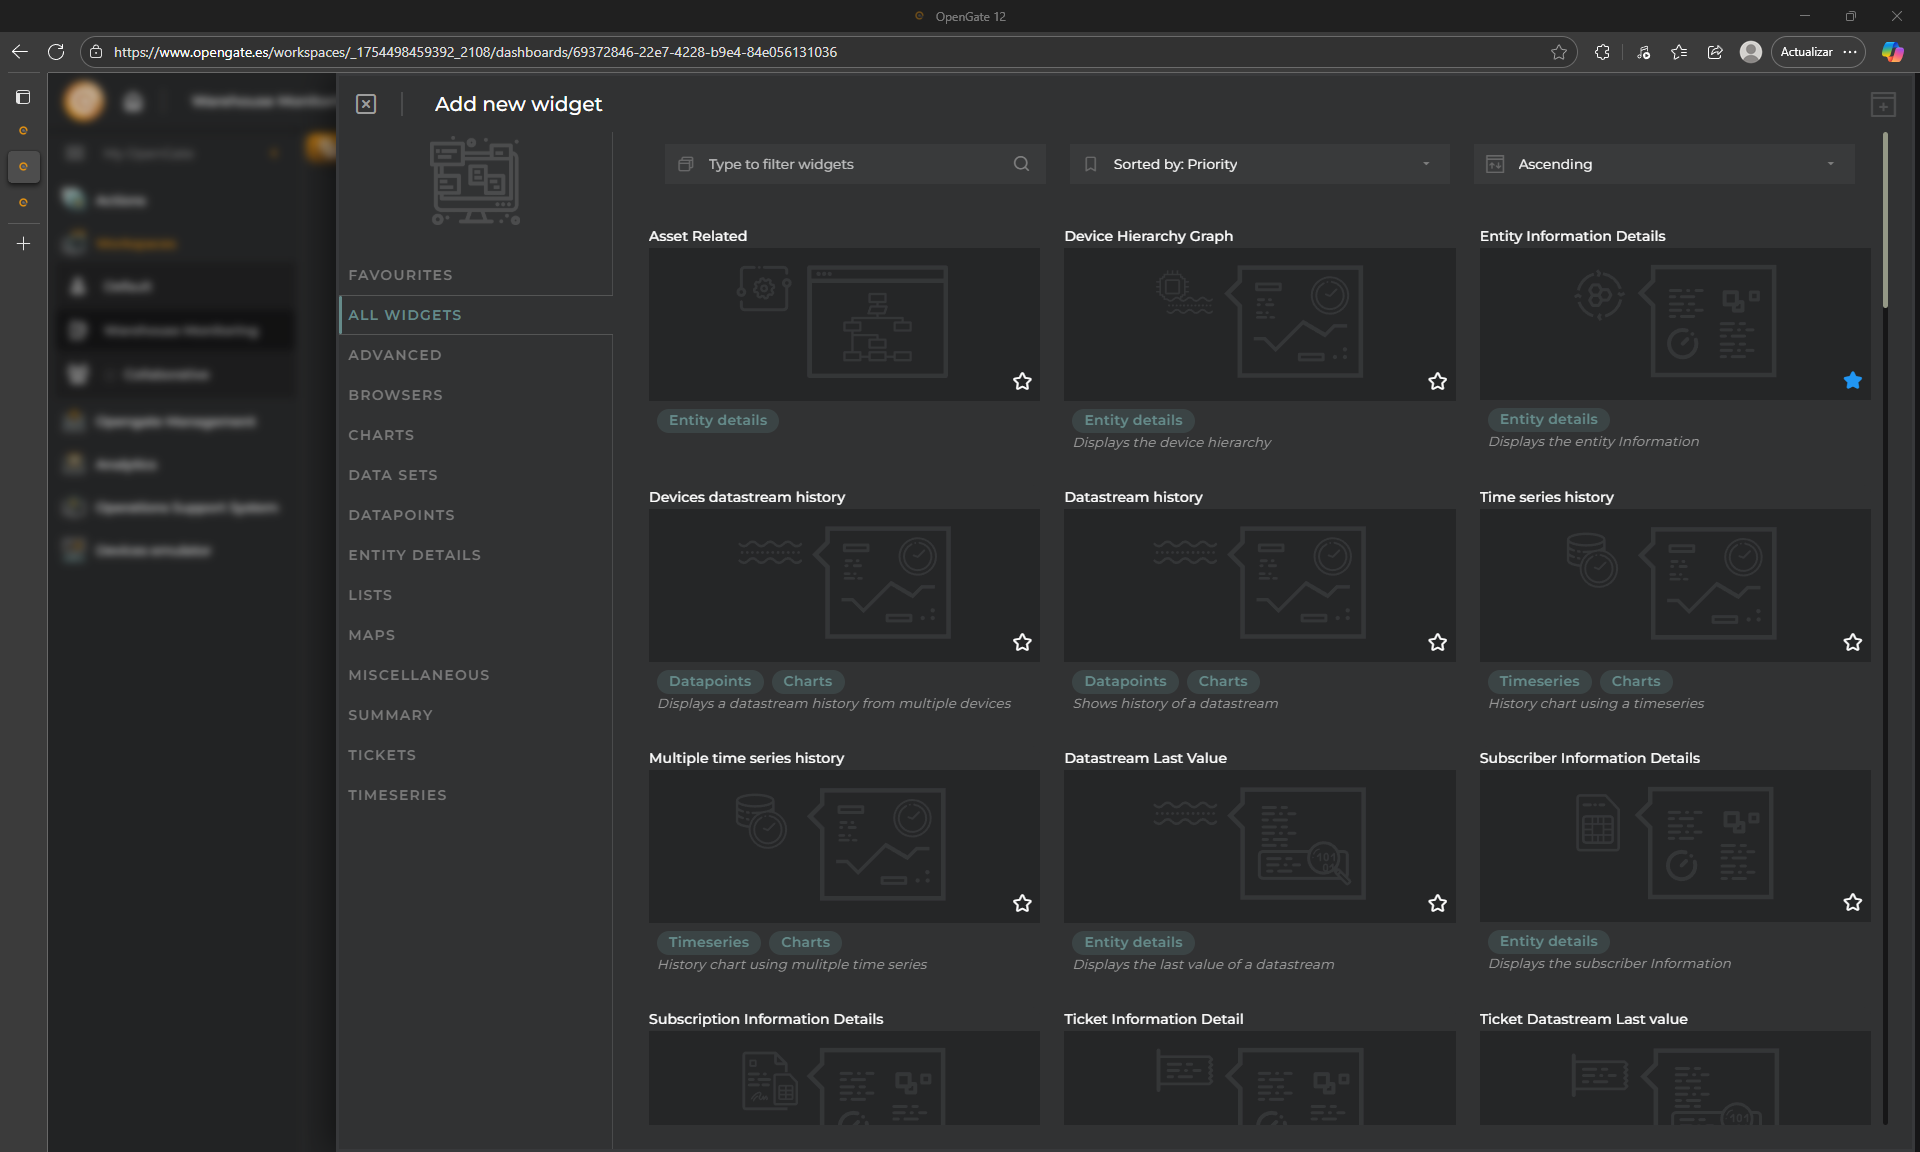
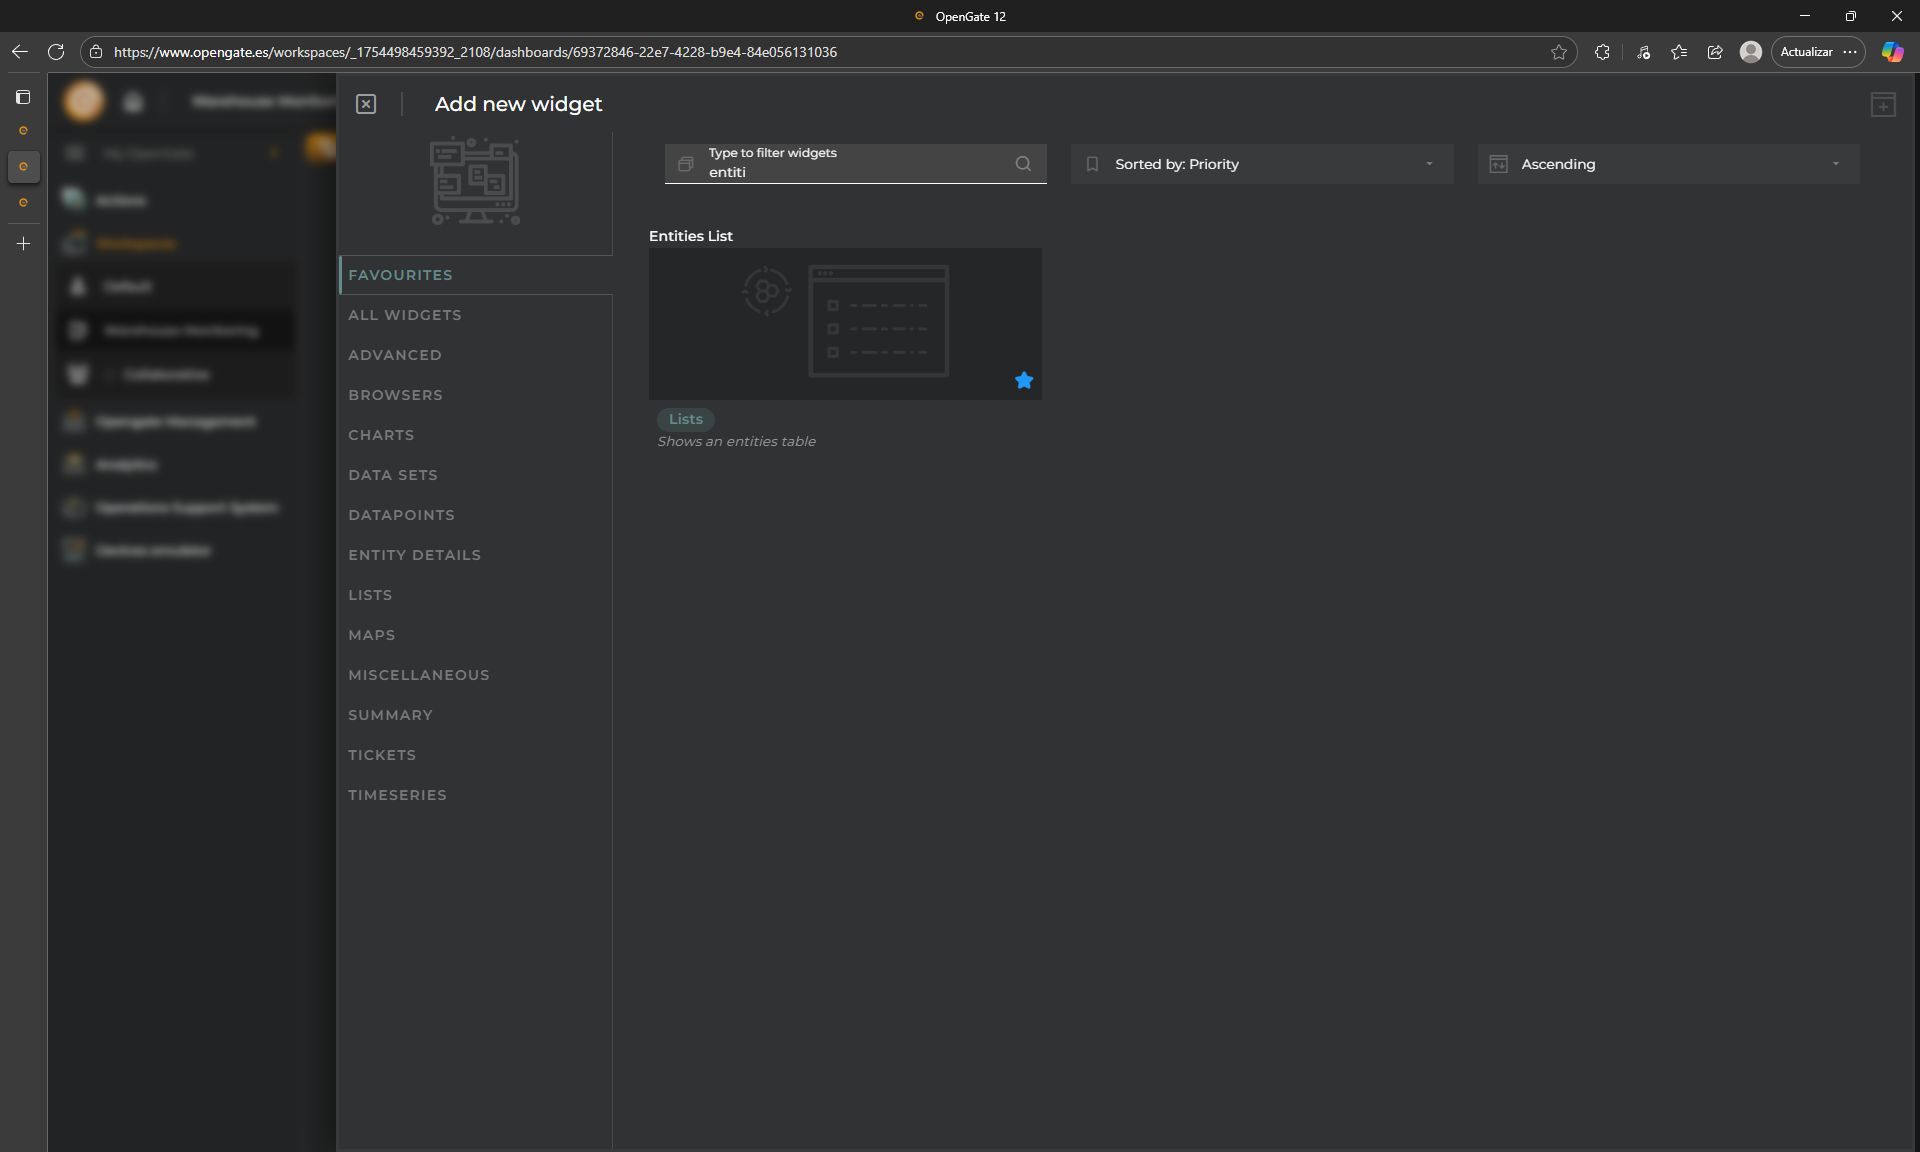
Empty right? Let’s add two basic widgets to visualize our data. click on “Add Widget” and check the catalog
📋 Entities list widget
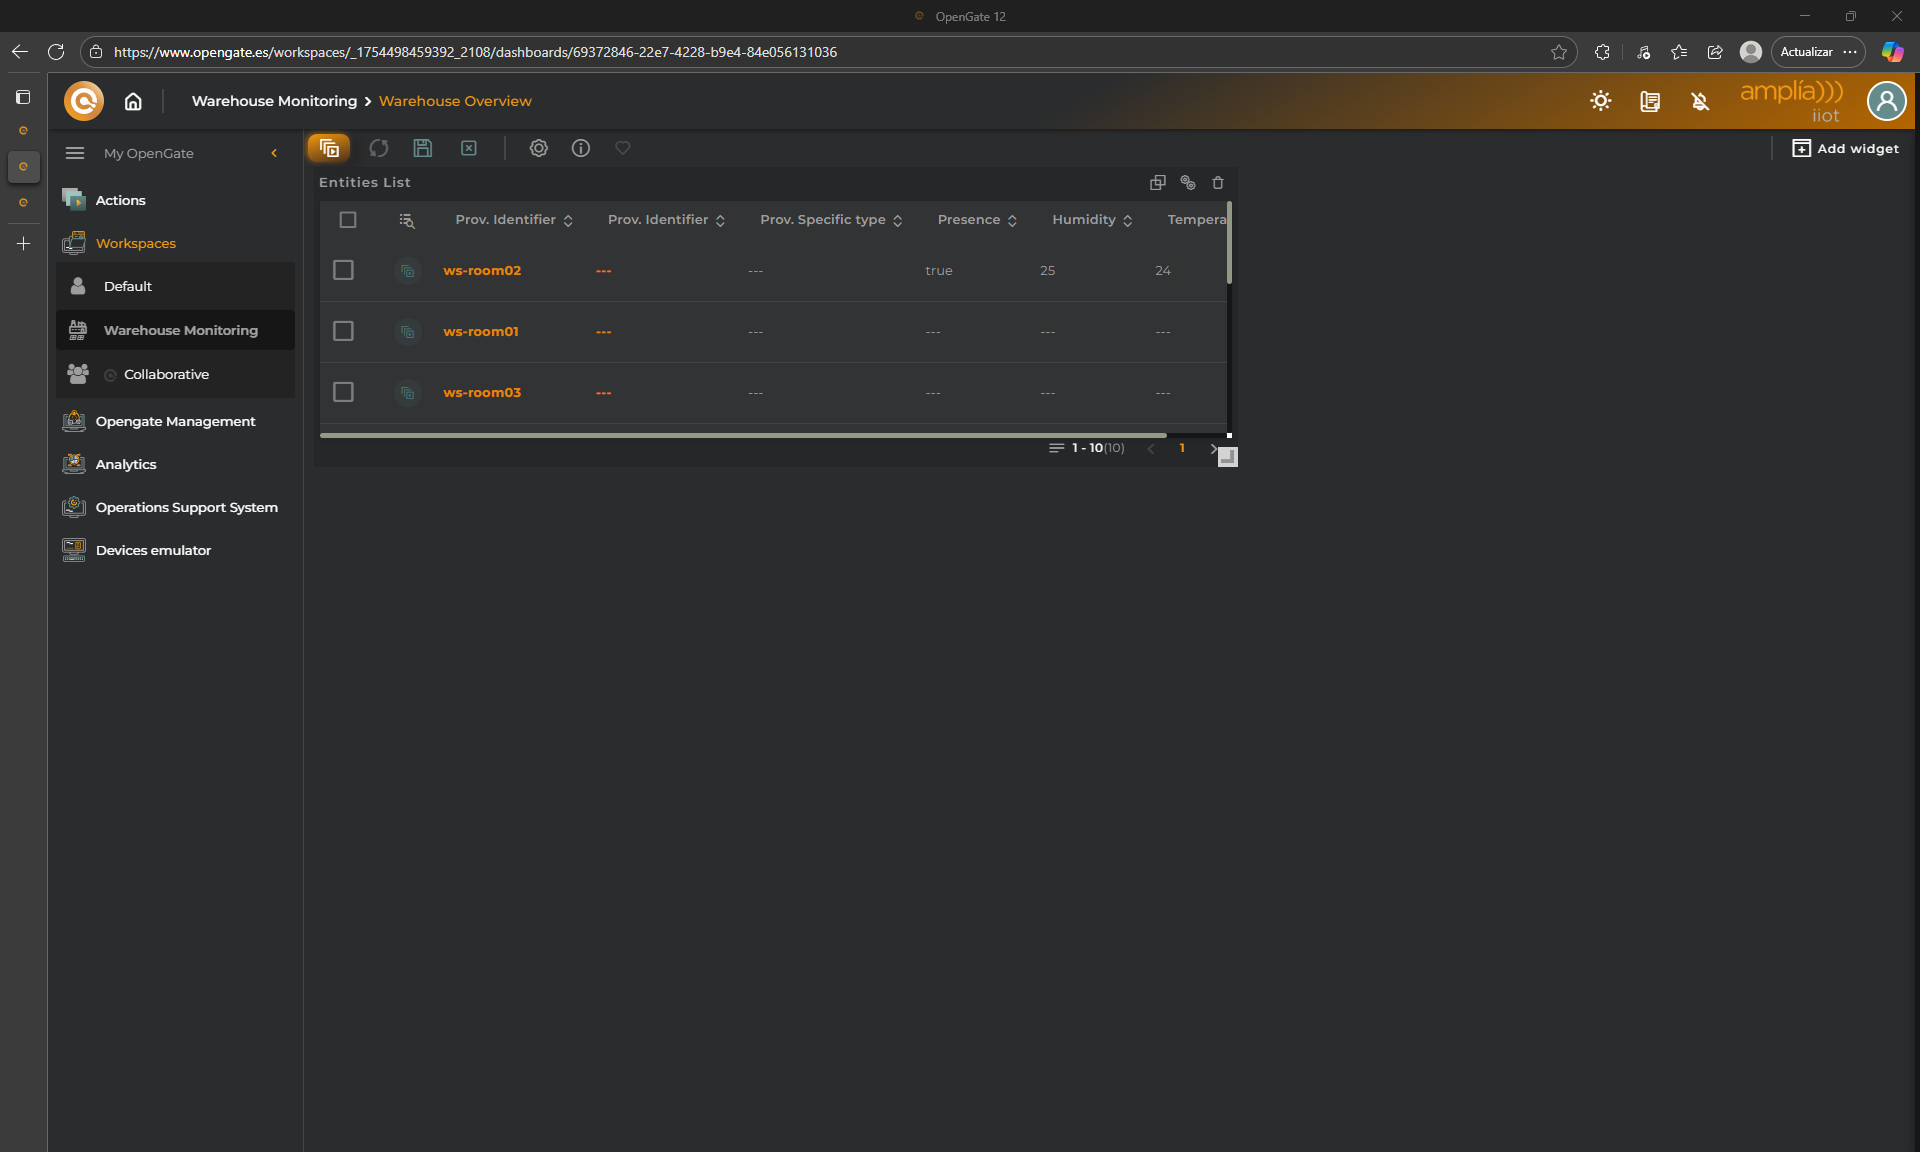
This widget is a table which shows entities in table format we will use this to show all our entities and its more relevant data.
Click Add Widget and look for Entities List
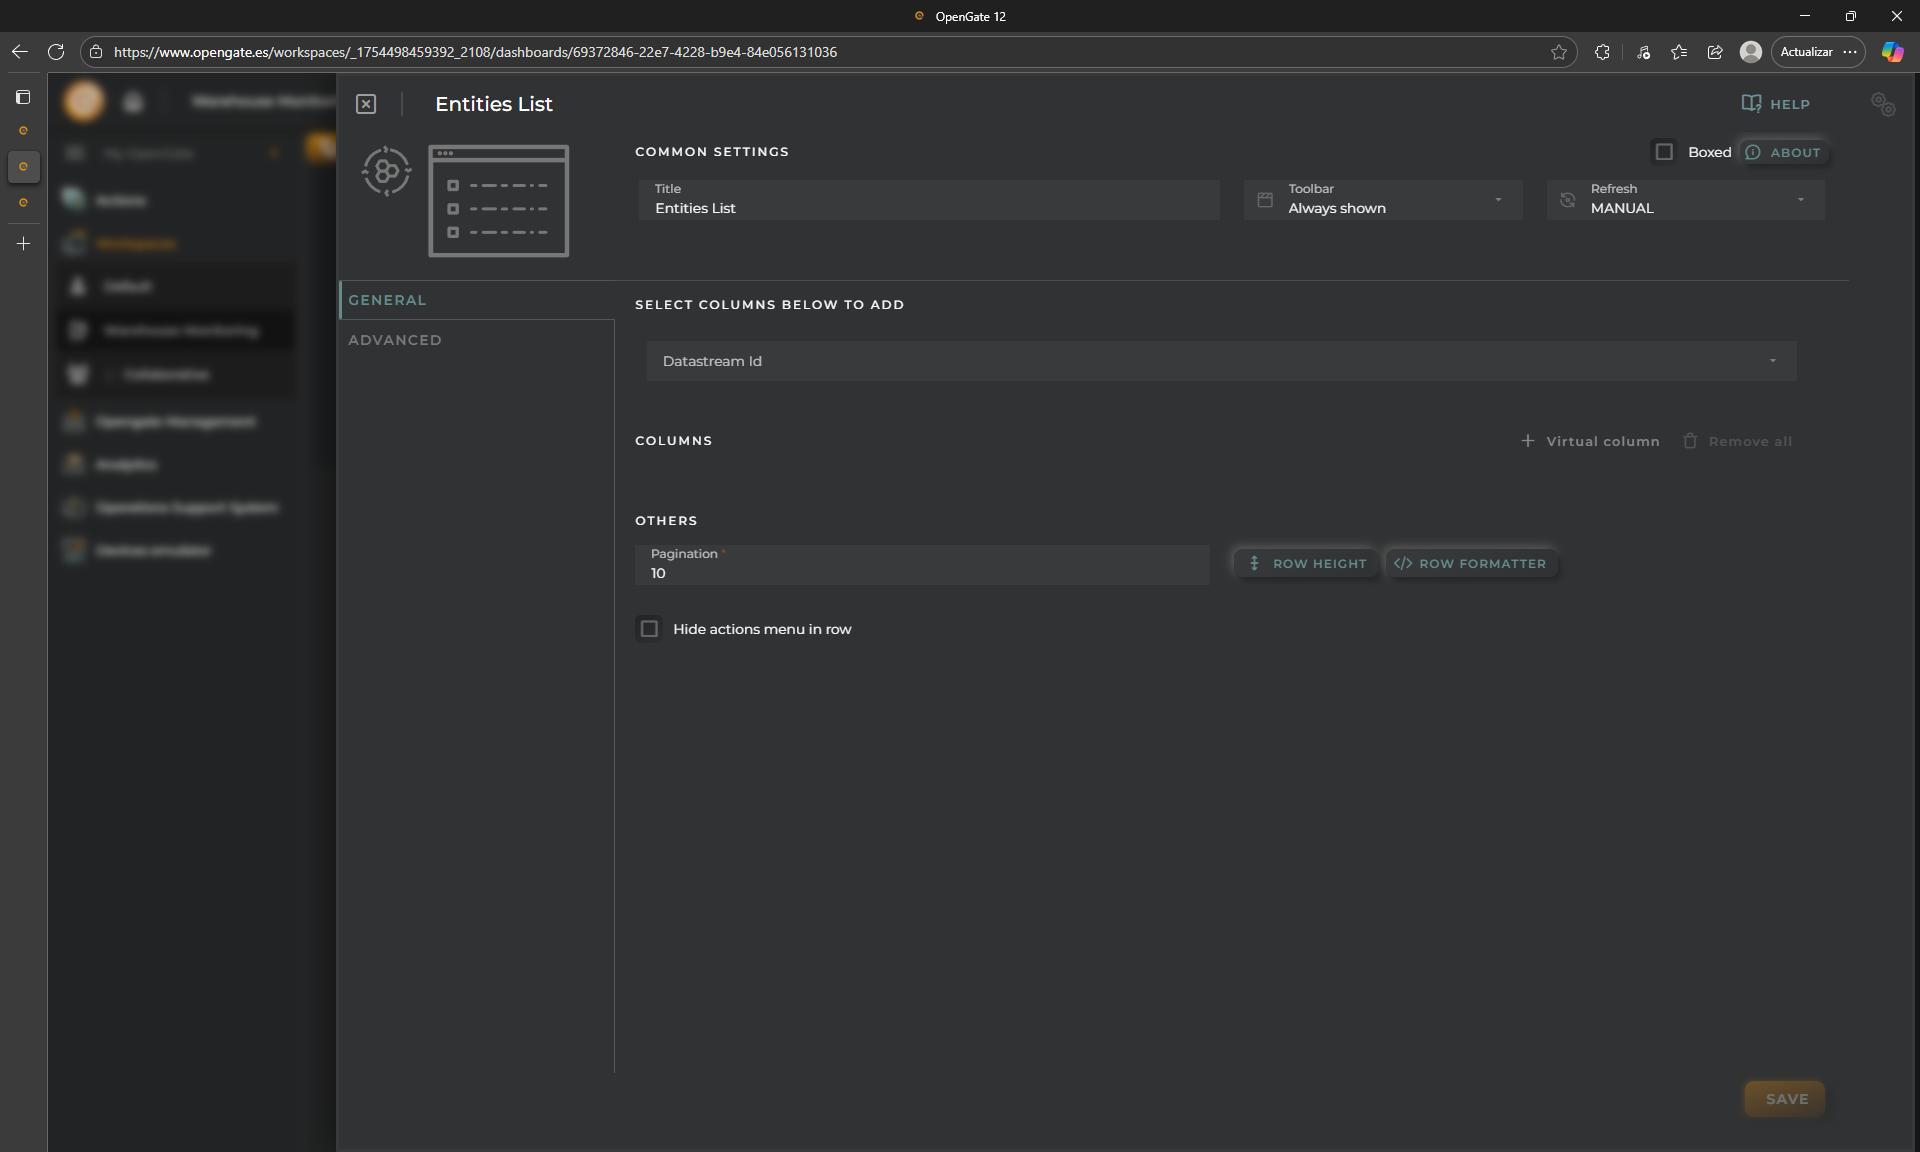
Click on “Add” and the widget configuration appears. Let’s configure our new widget.
For this tutorial, we will focus in the warehouse rooms, so fill the following:
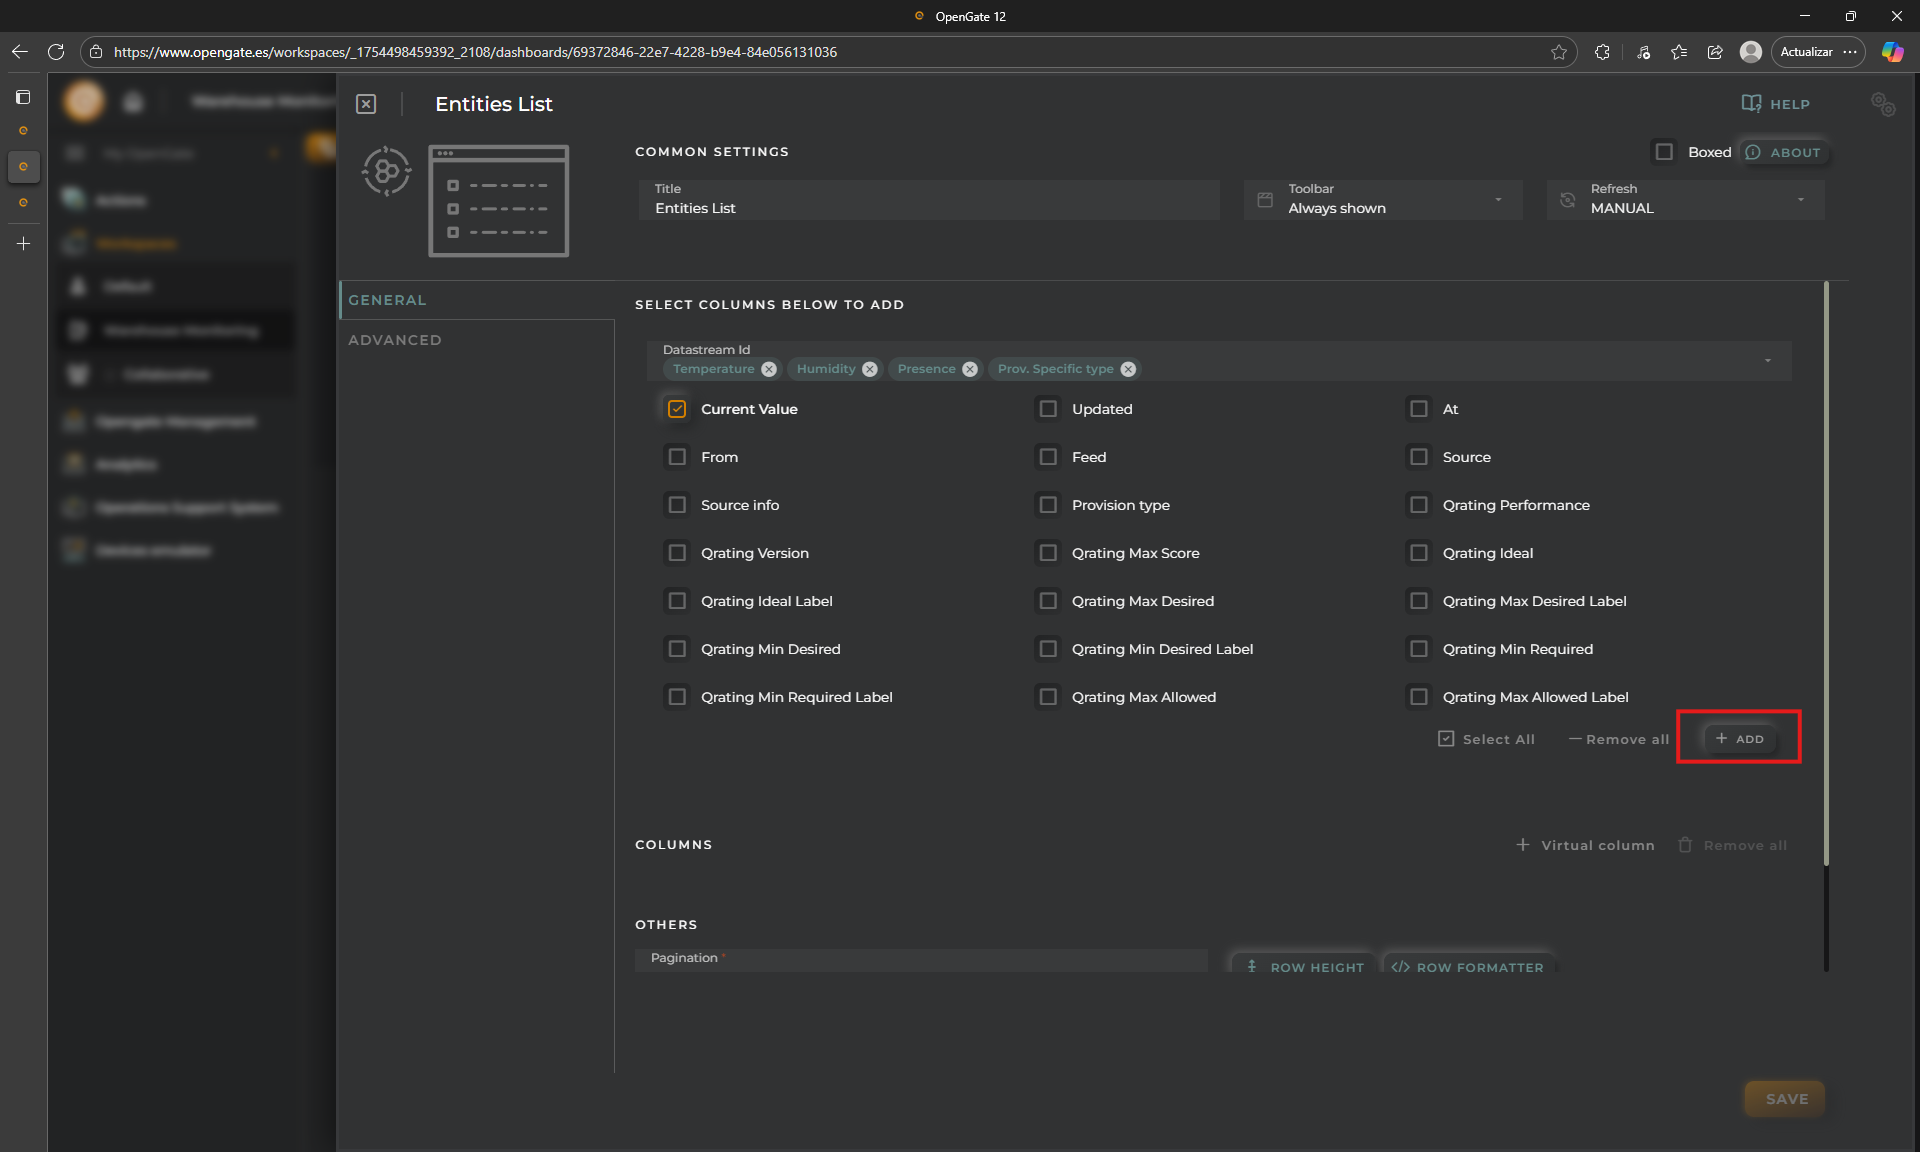
SELECT COLUMNS TO ADD: This allows you to indicate what columns you want to see. The information is selected from datastreams list, OpenGate standard and custom, for provision, and collection datastreams. Fill this with: temperature, humidity, presence from our datamodel “warehouse” and provision.device.specificType, provision.device.identifier, provision.asset.identifier from the OpenGate standard data models. You can choose what datastream property show in the table. Check on “Current Value” and click on “+ ADD”
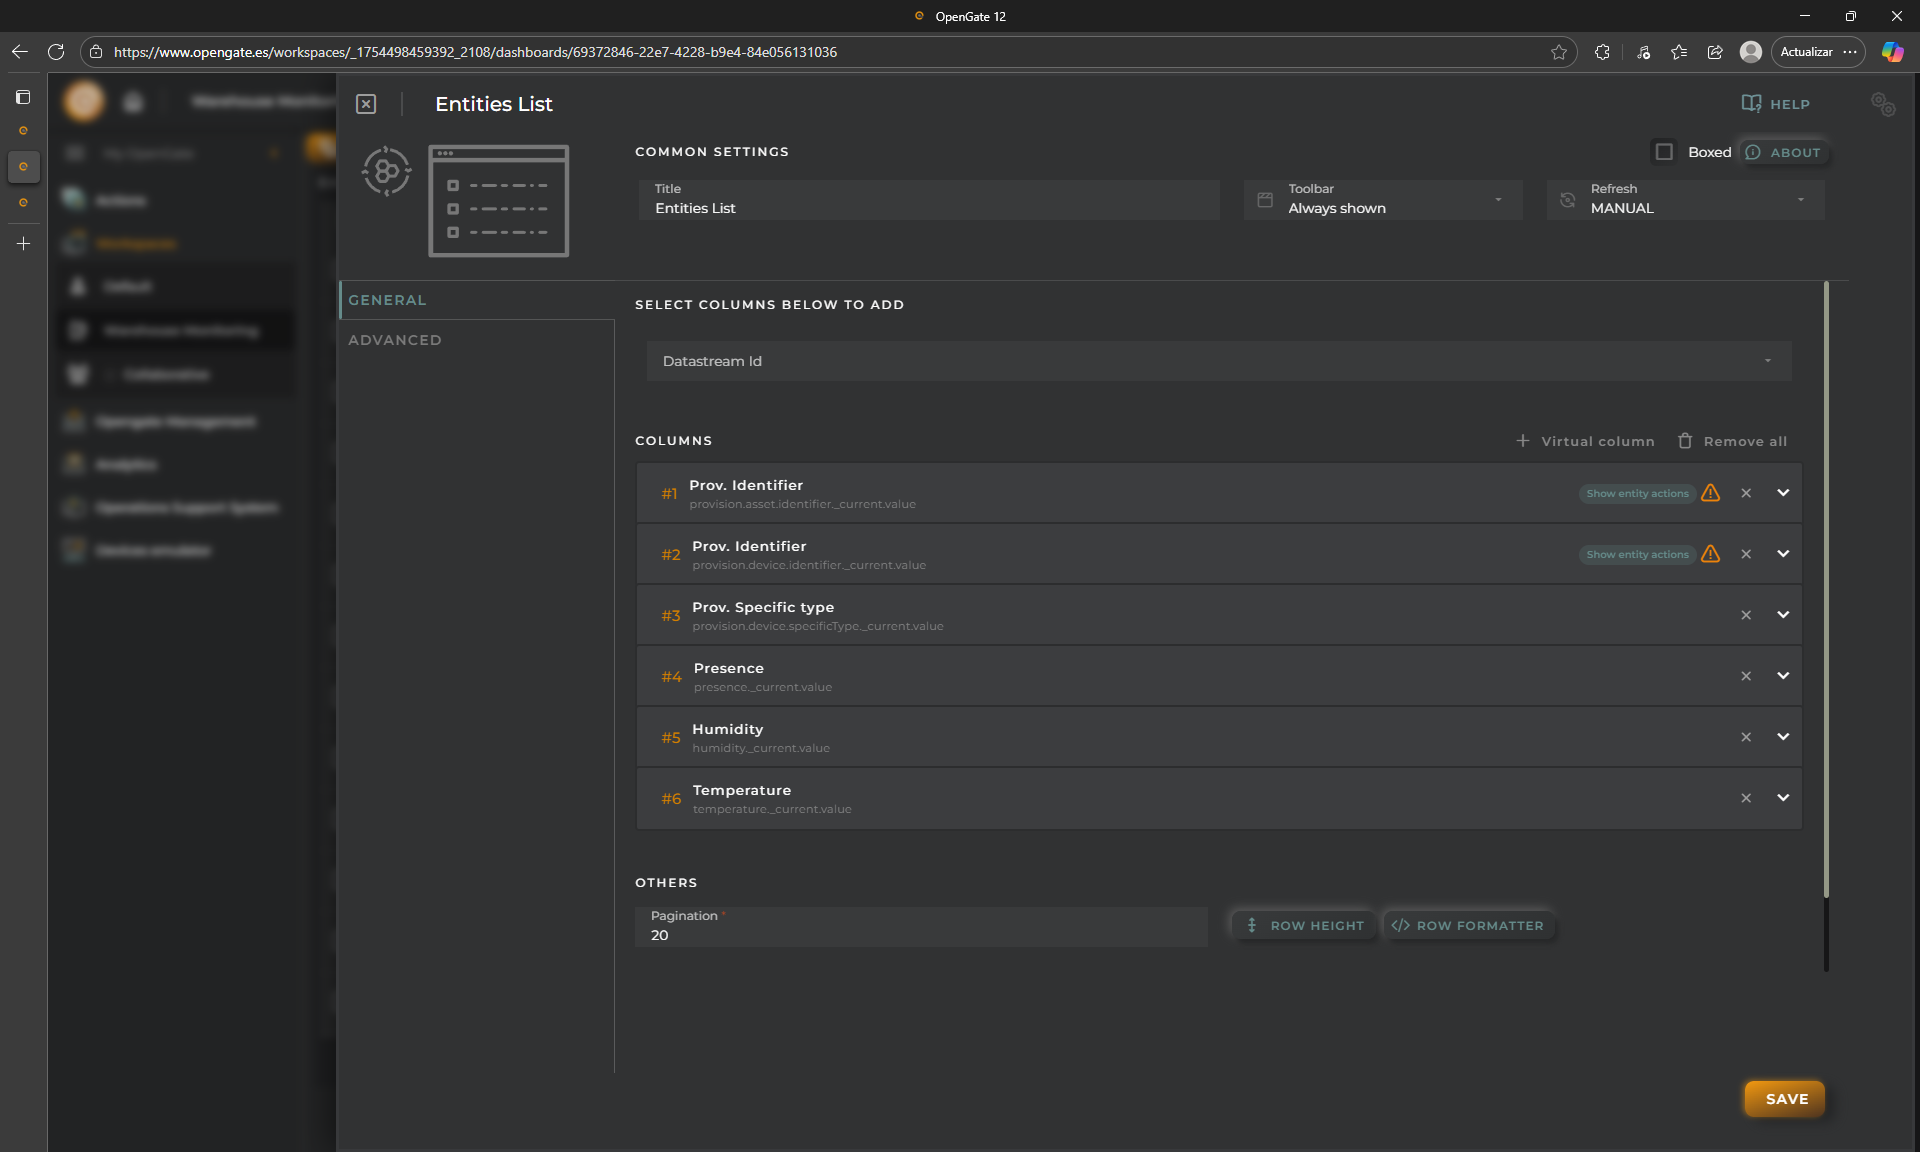
PAGINATION: The standard value is 10, change it to 20.
Then you will see the columns that the widget will show. Keep it as is, but you can change some things such order, name or apply formaters, we will see this later
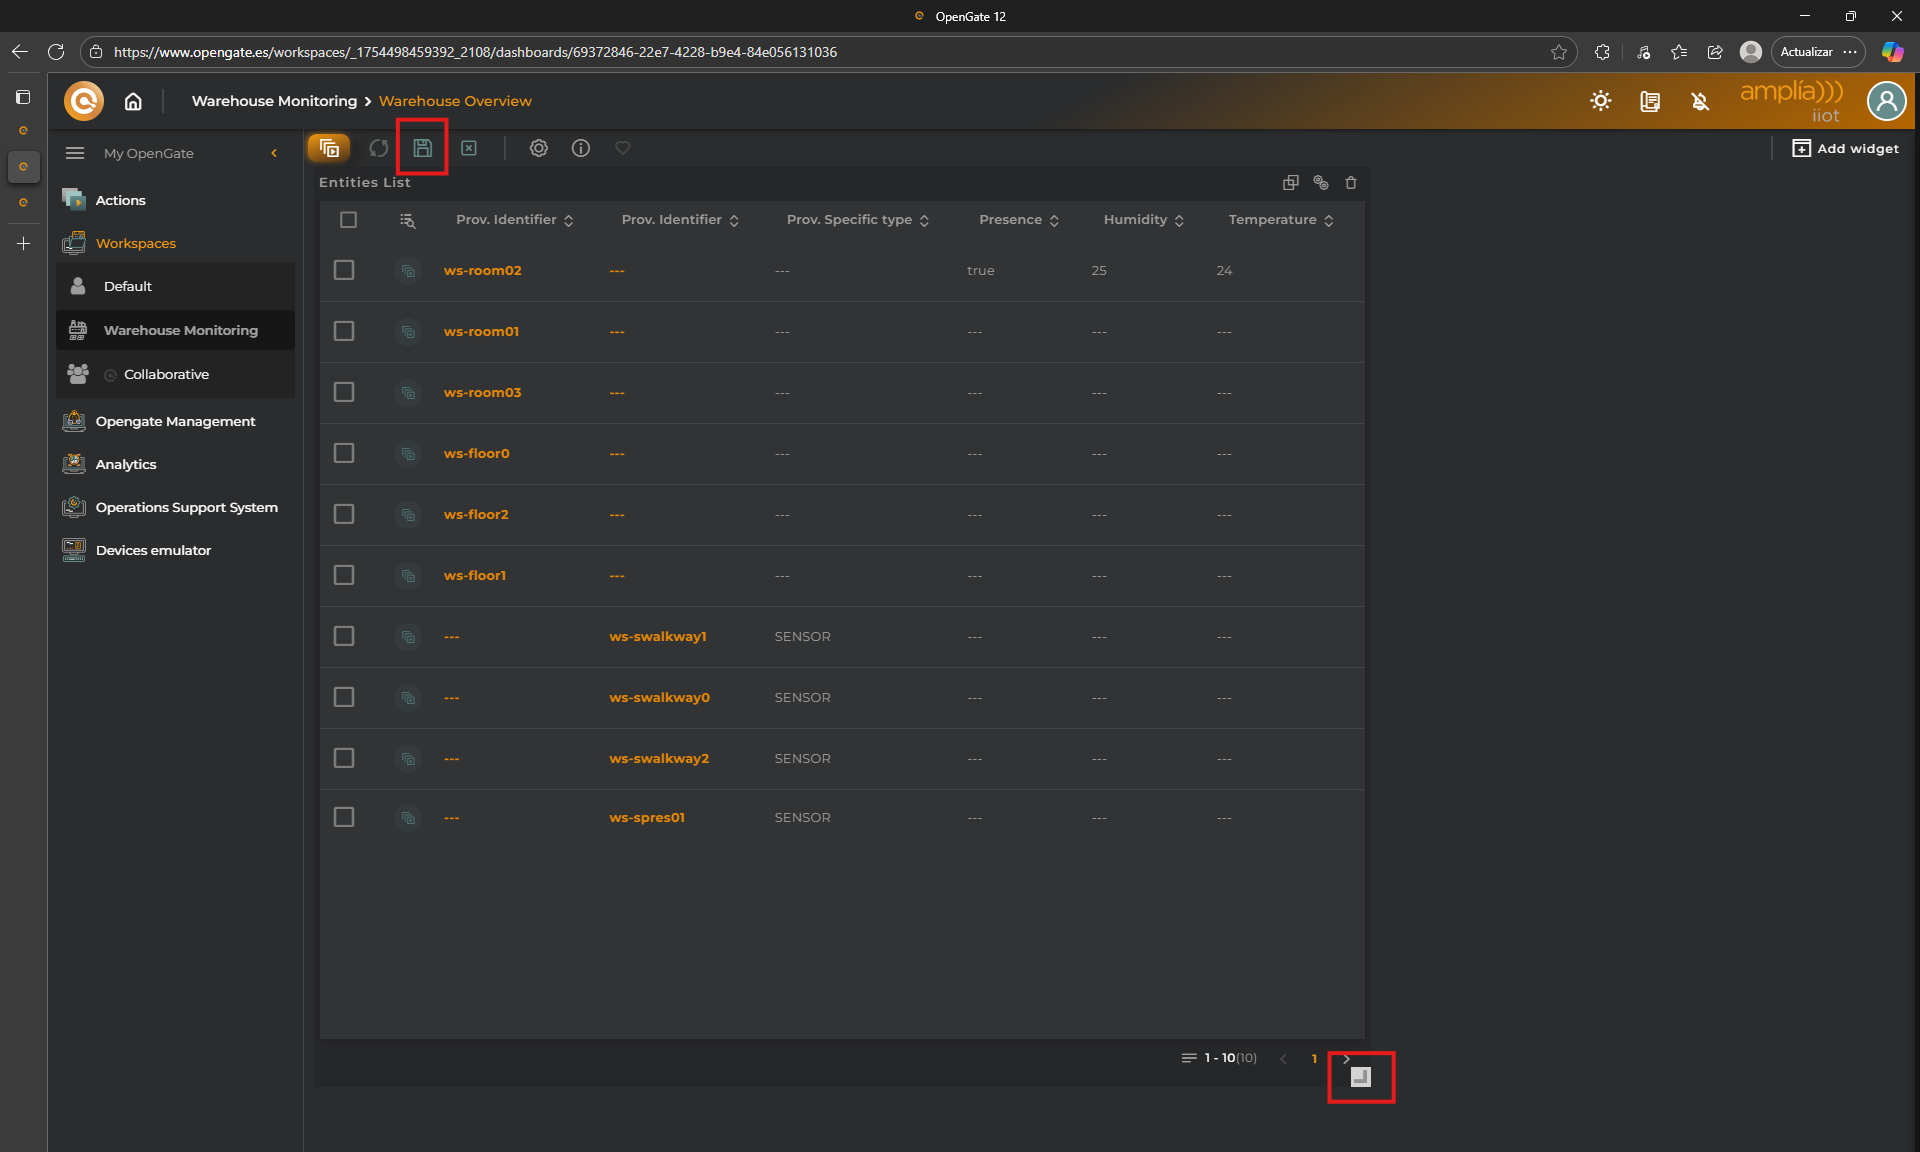
Save the widget and the widget will be added to the dashboard automatically.
Use the bottom-right arrow icon on the widget to adjust the widget size, and click on “SAVE” icon in the Dashboard toolbar.
🎉 Congratulations you have your first dashboard with one widget!!!
🗺️ Map Widget
Let’s continue by adding a map widget.
Like you performed before, click Add Widget and choose Maps
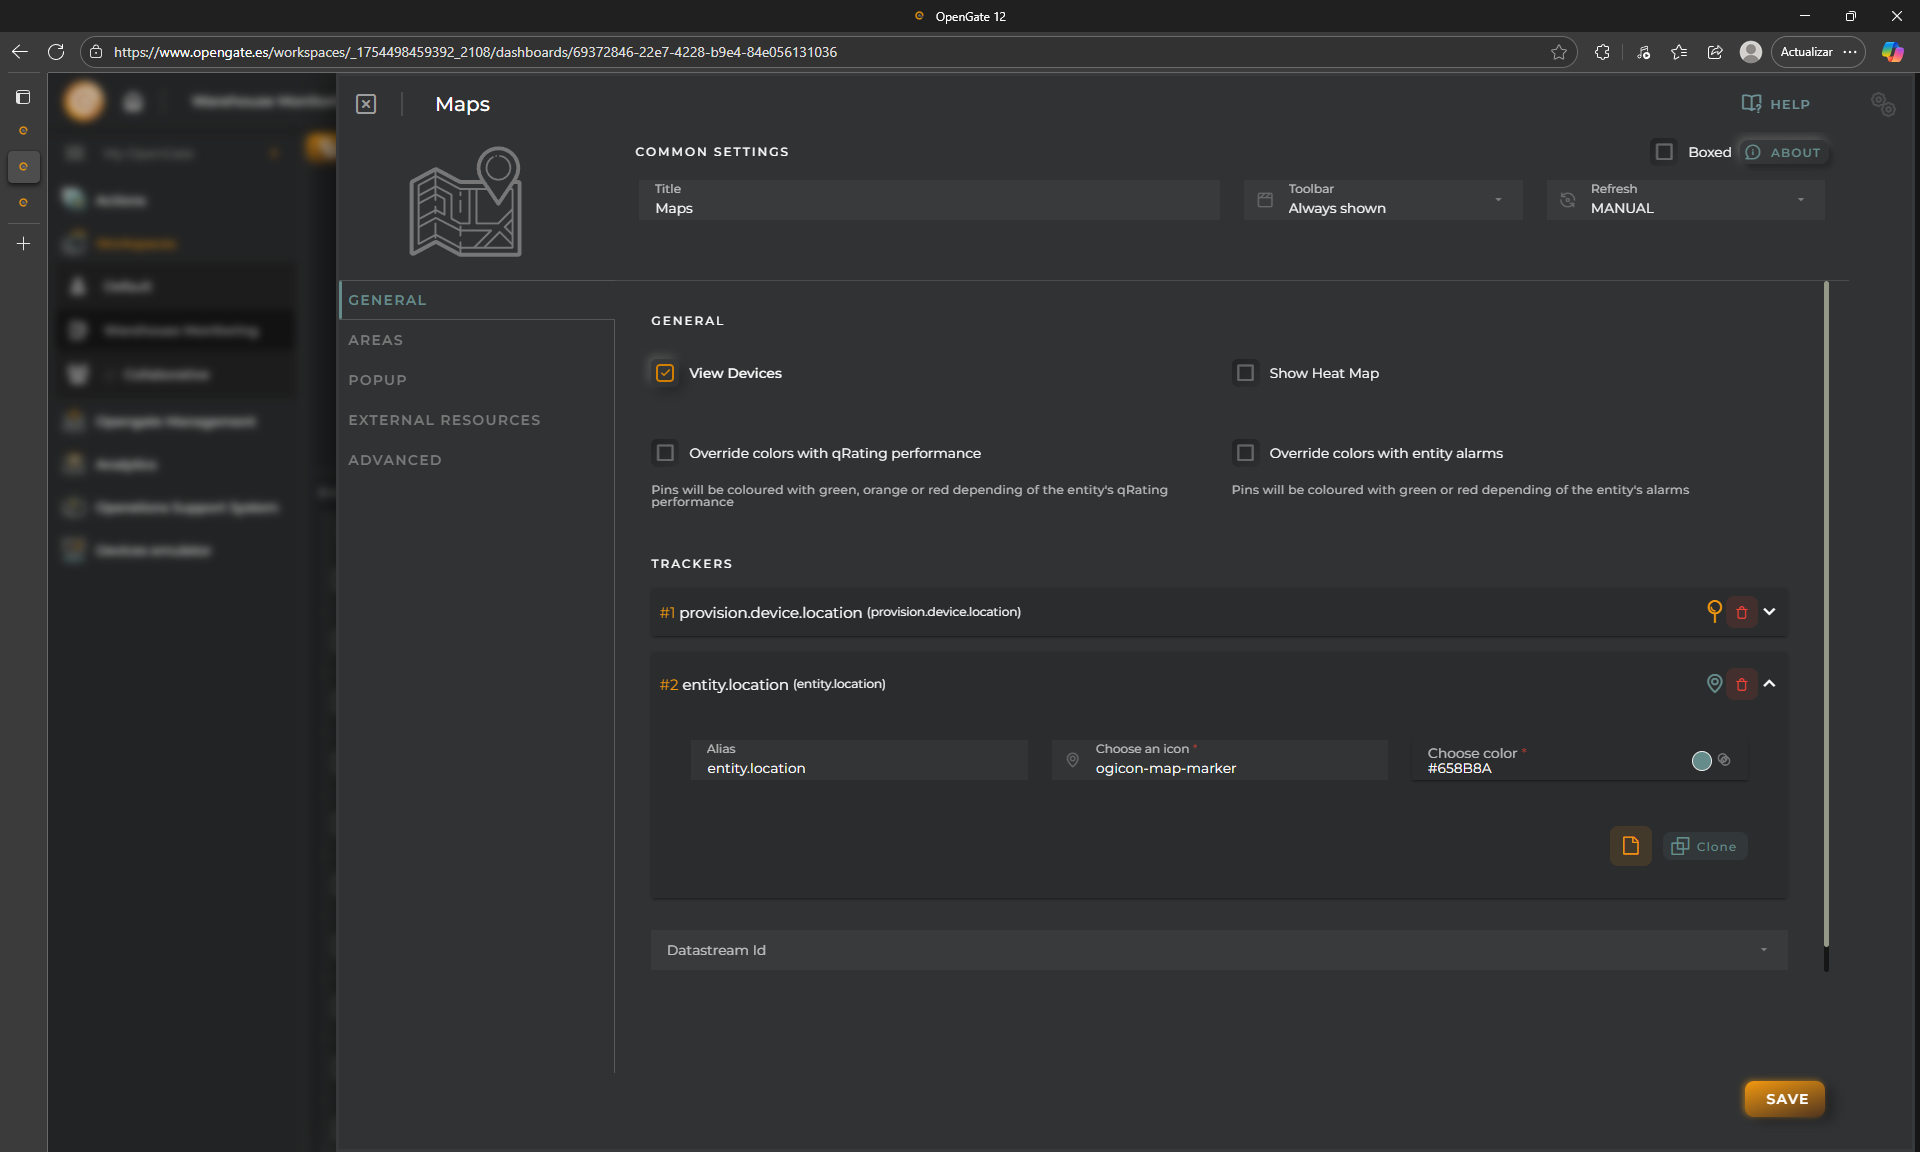
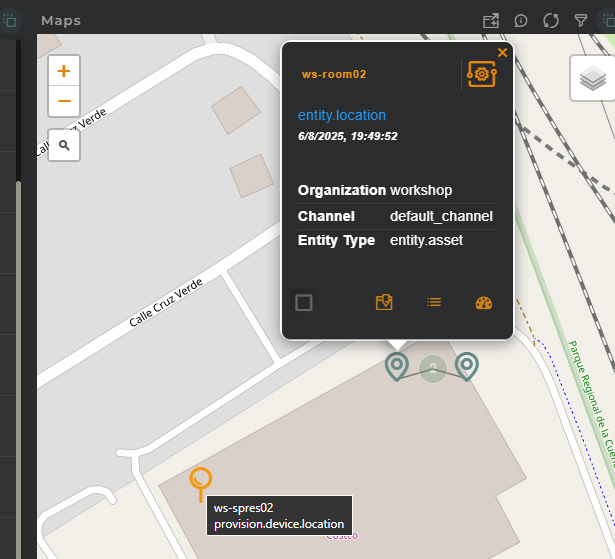
The “Maps” widget is another powerful tool that can be configured to show a lot of customizable information of your entities, directly over a geolocated map. For this tutorial, we keep the widget as default. But lets review what the widget will show:
“provision.device.location”: This marker represents the provision location of a device
“entity.location”: This marker represents the location collected for a device
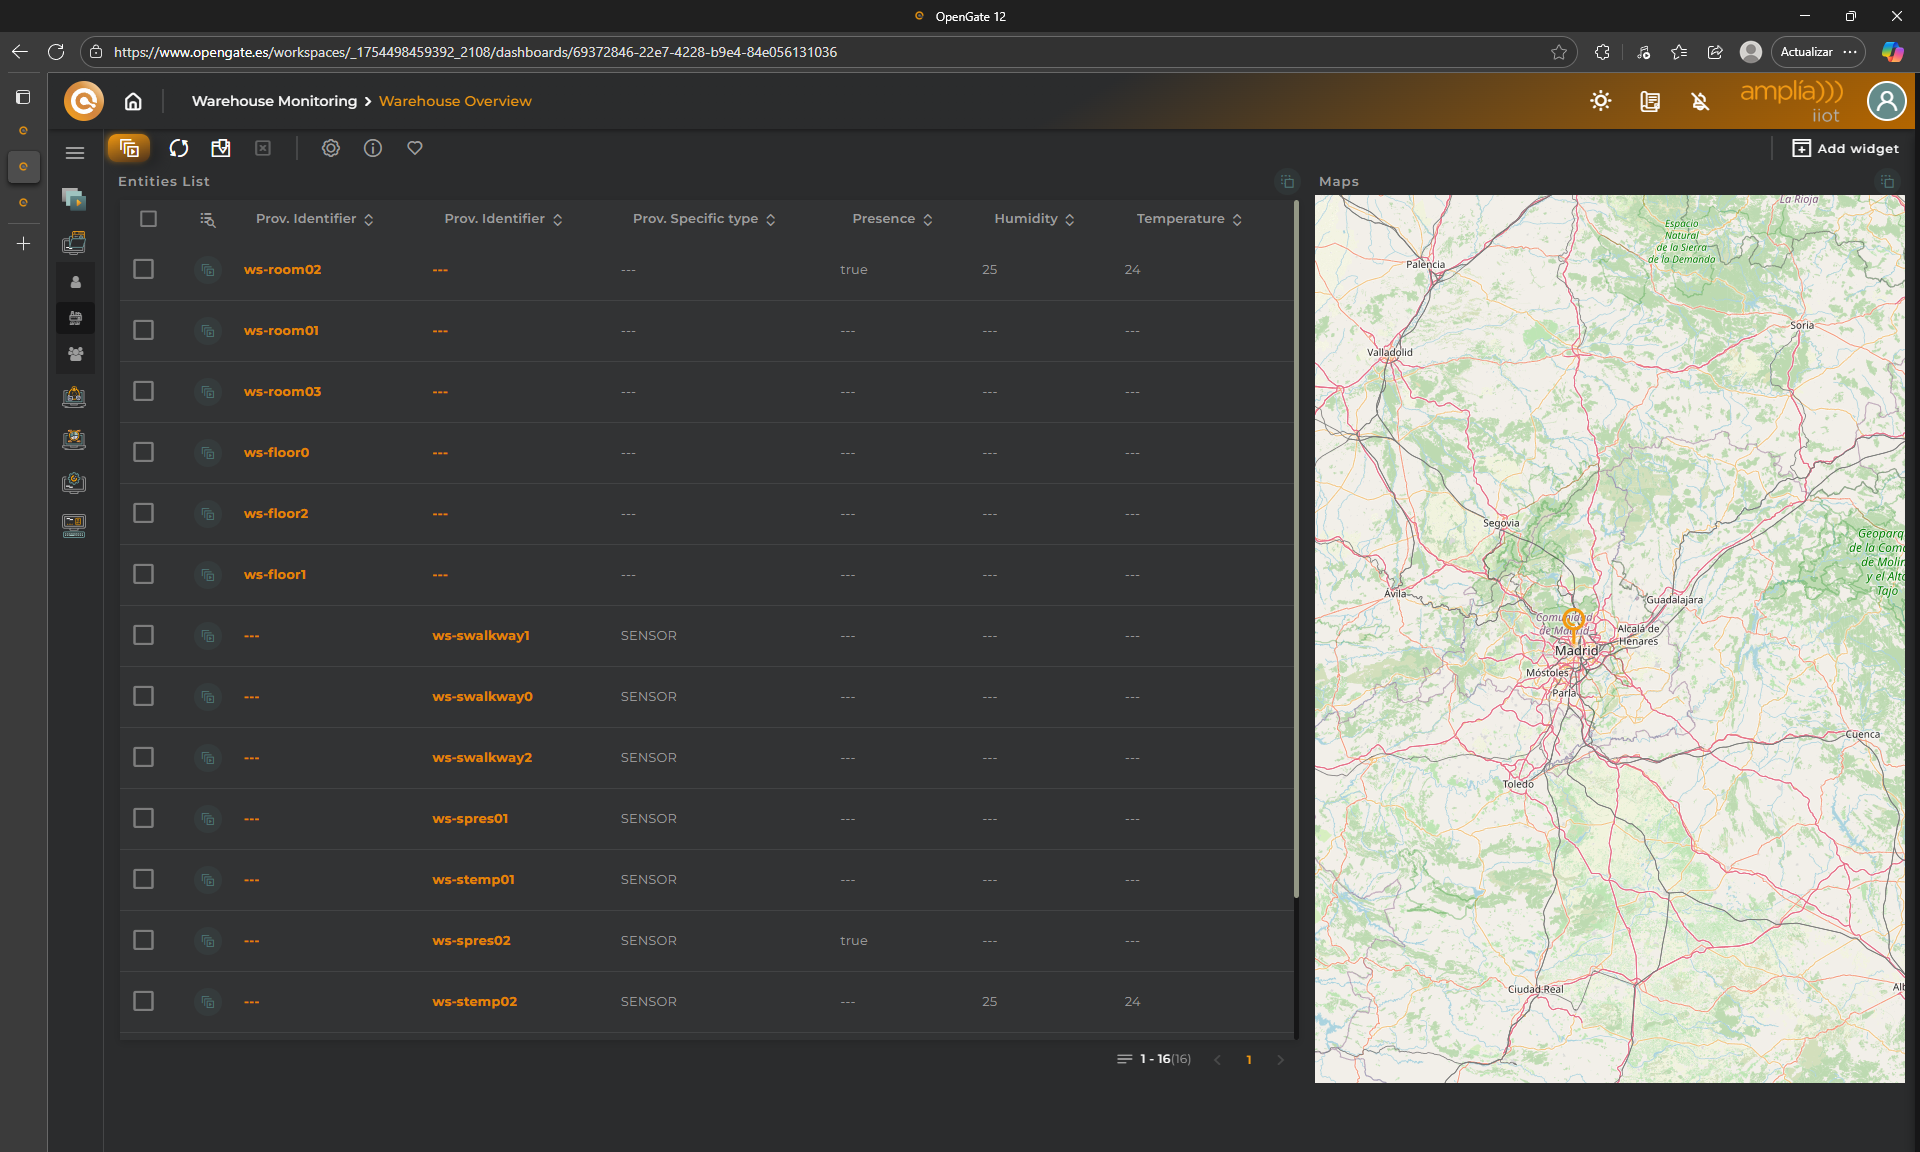
Save the widget and move it to the right part. Try to achieve this
✅ Finish your work
I know, I know… we did not enter the location for all devices, but you can do it with what you have learned in this tutorial.
I give you a clue, you can do it in two ways depending on the information that you want to represent:
Use OpenGate Device Emulator, to collect the location of the entities
Use EDIT device option, from the menu of each entity in the widget table, to provision the location of the entities
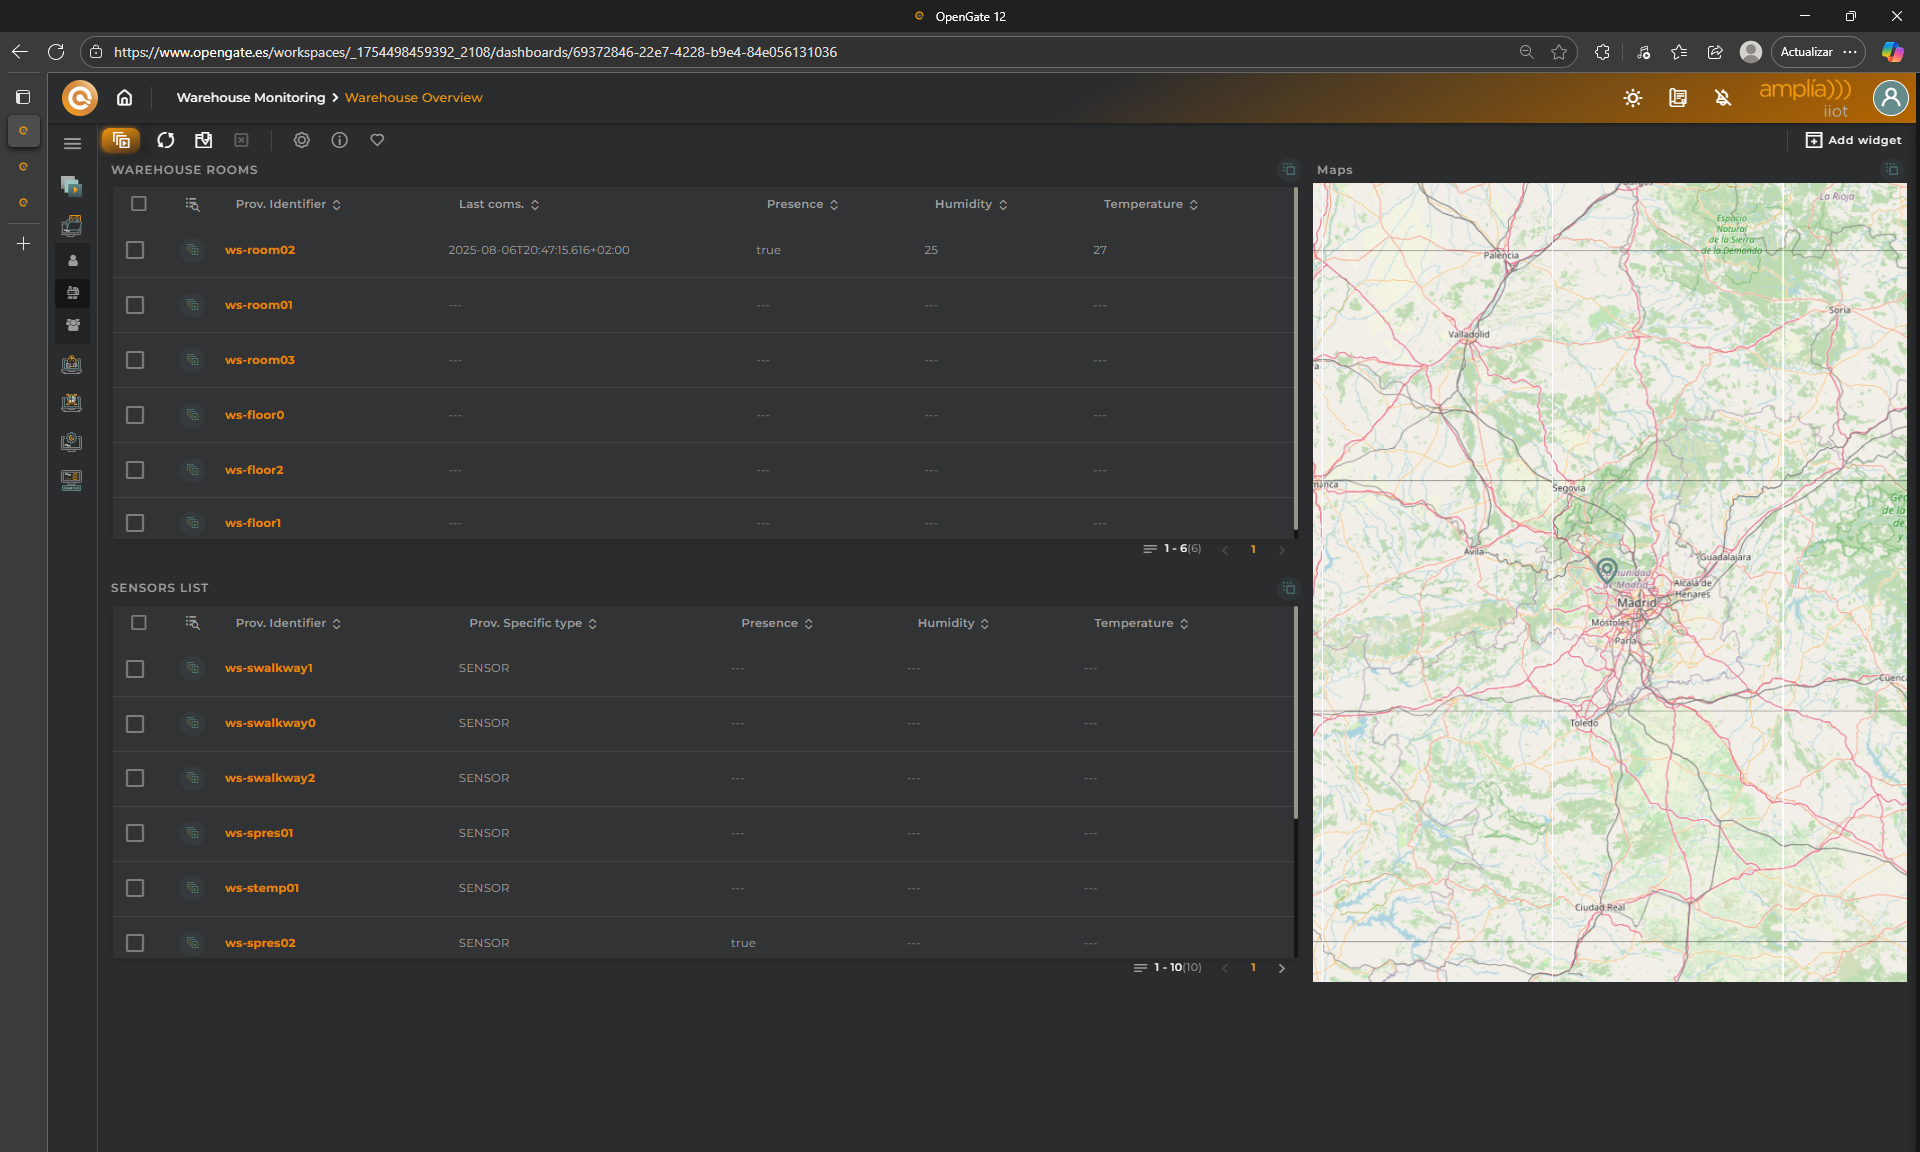
Use both if you wish and refresh the dashboard, now you see the map position. Enjoy the Maps widget, move around, CNTRL+SCROLL to zoom in/out, and click on some device to see its information. Look this:
🔍 Applying Filters
We have configured a great dashboard, but we can adjust it to refine the dashboard view.
Because we want to use this dashboard as “Warehouse Overview”, we’ll create a basic filter to only see our warehouse rooms information.
🧮 Filter the “Entities list” widget
Remember, these entities are assets. The entity type is recorded in OpenGate standard datamodel using ‘resourceType’ datastream.
So that, lets reconfigure our widget to apply a filter:
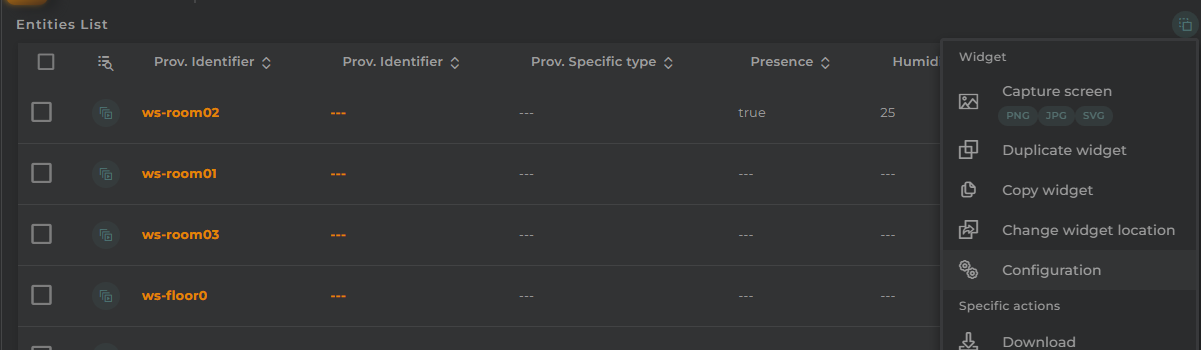
Open the widget configuration from the widget menu:
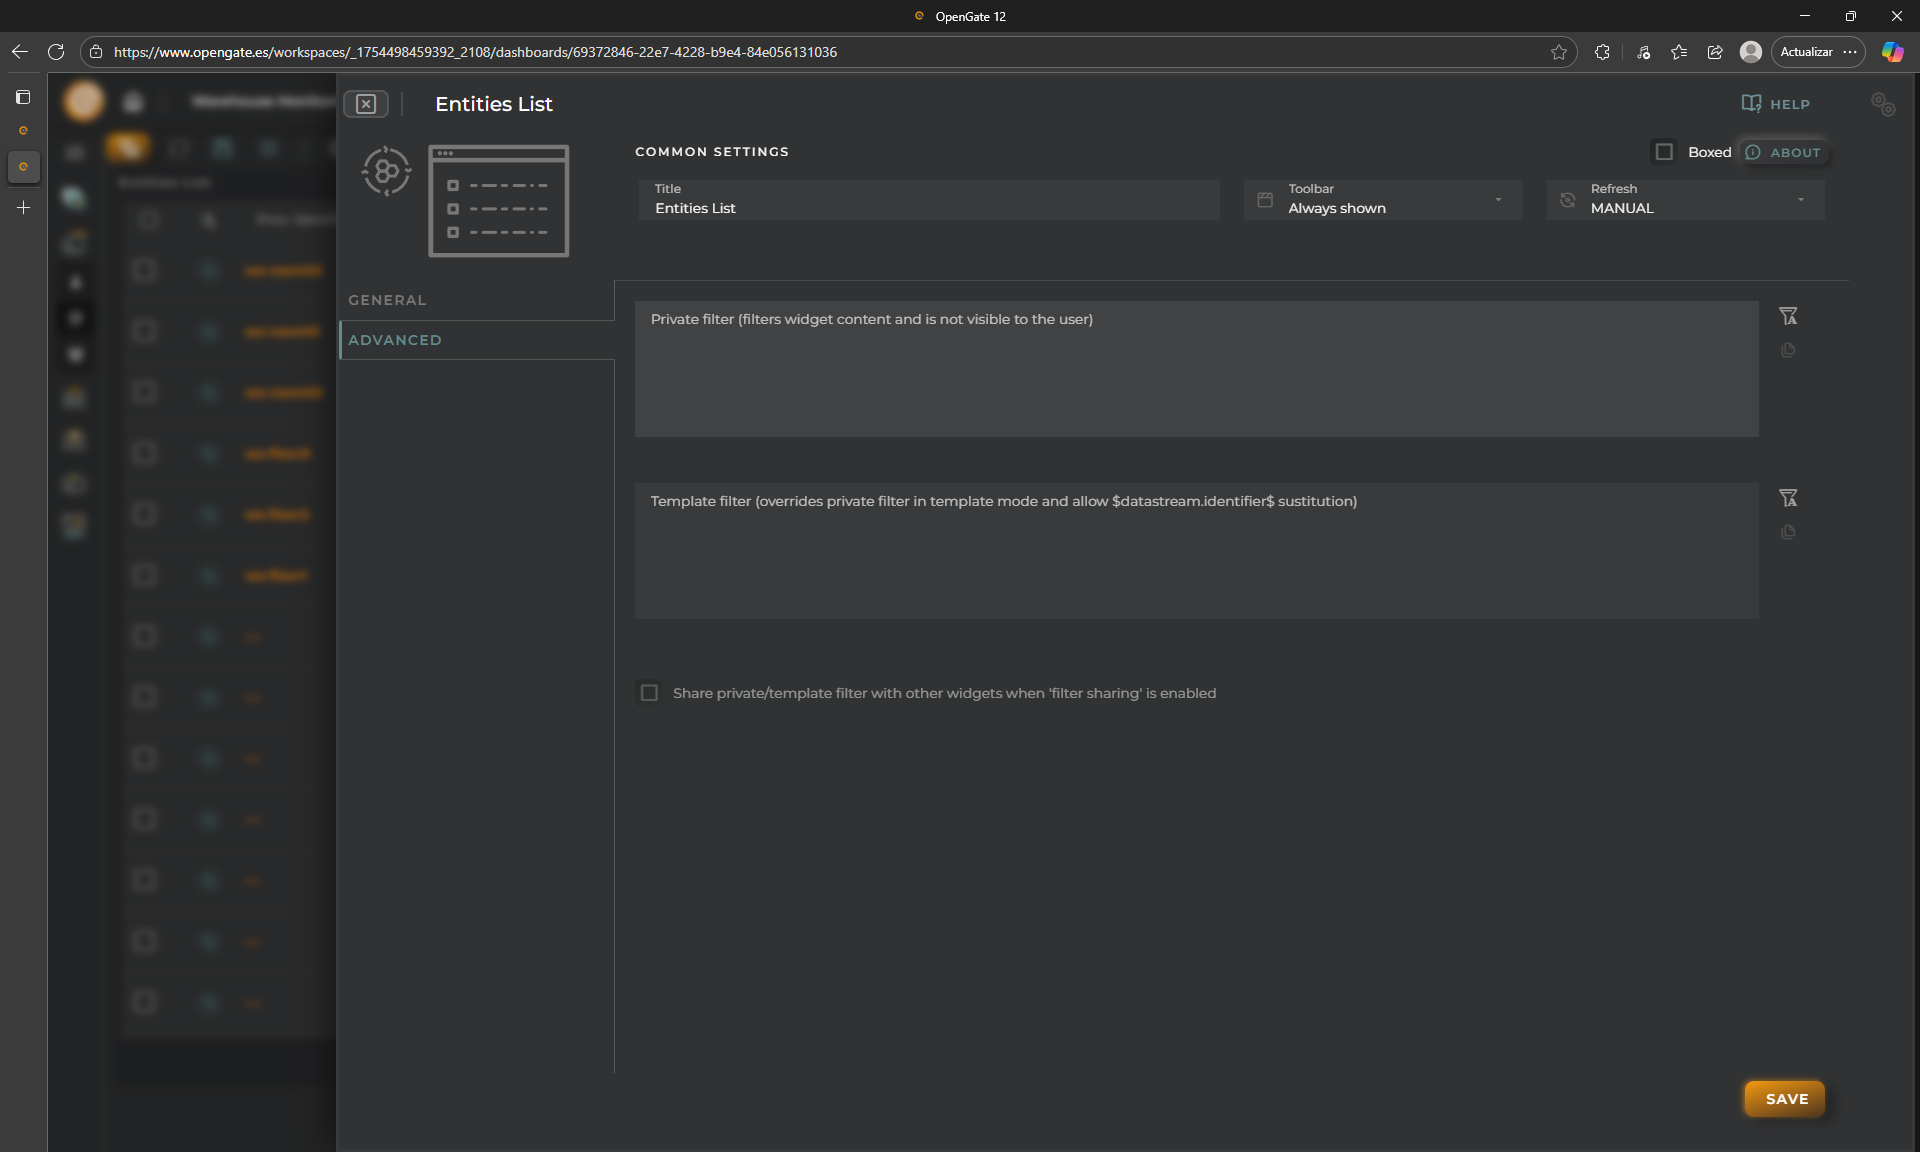
Go to the “ADVANCED” tab and click on “Private filter”
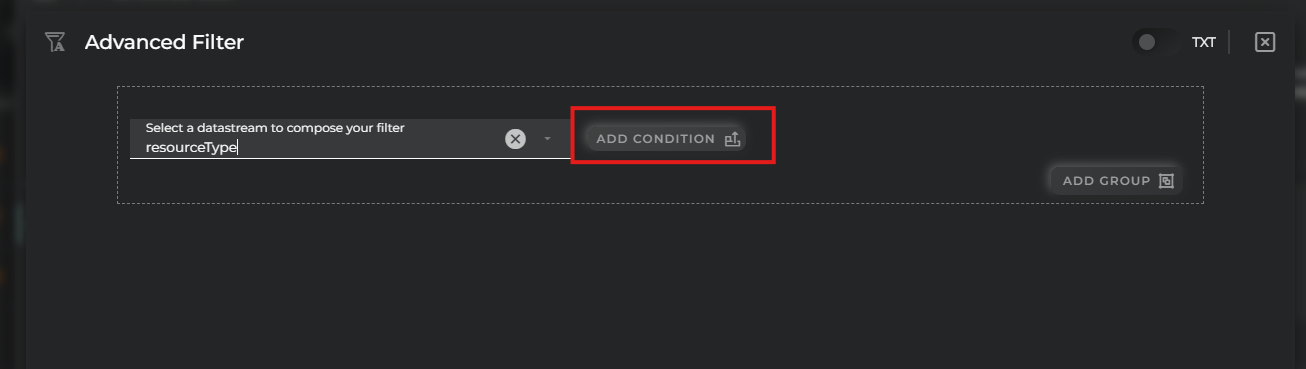
Choose resourceType and click on “ADD CONDITION”
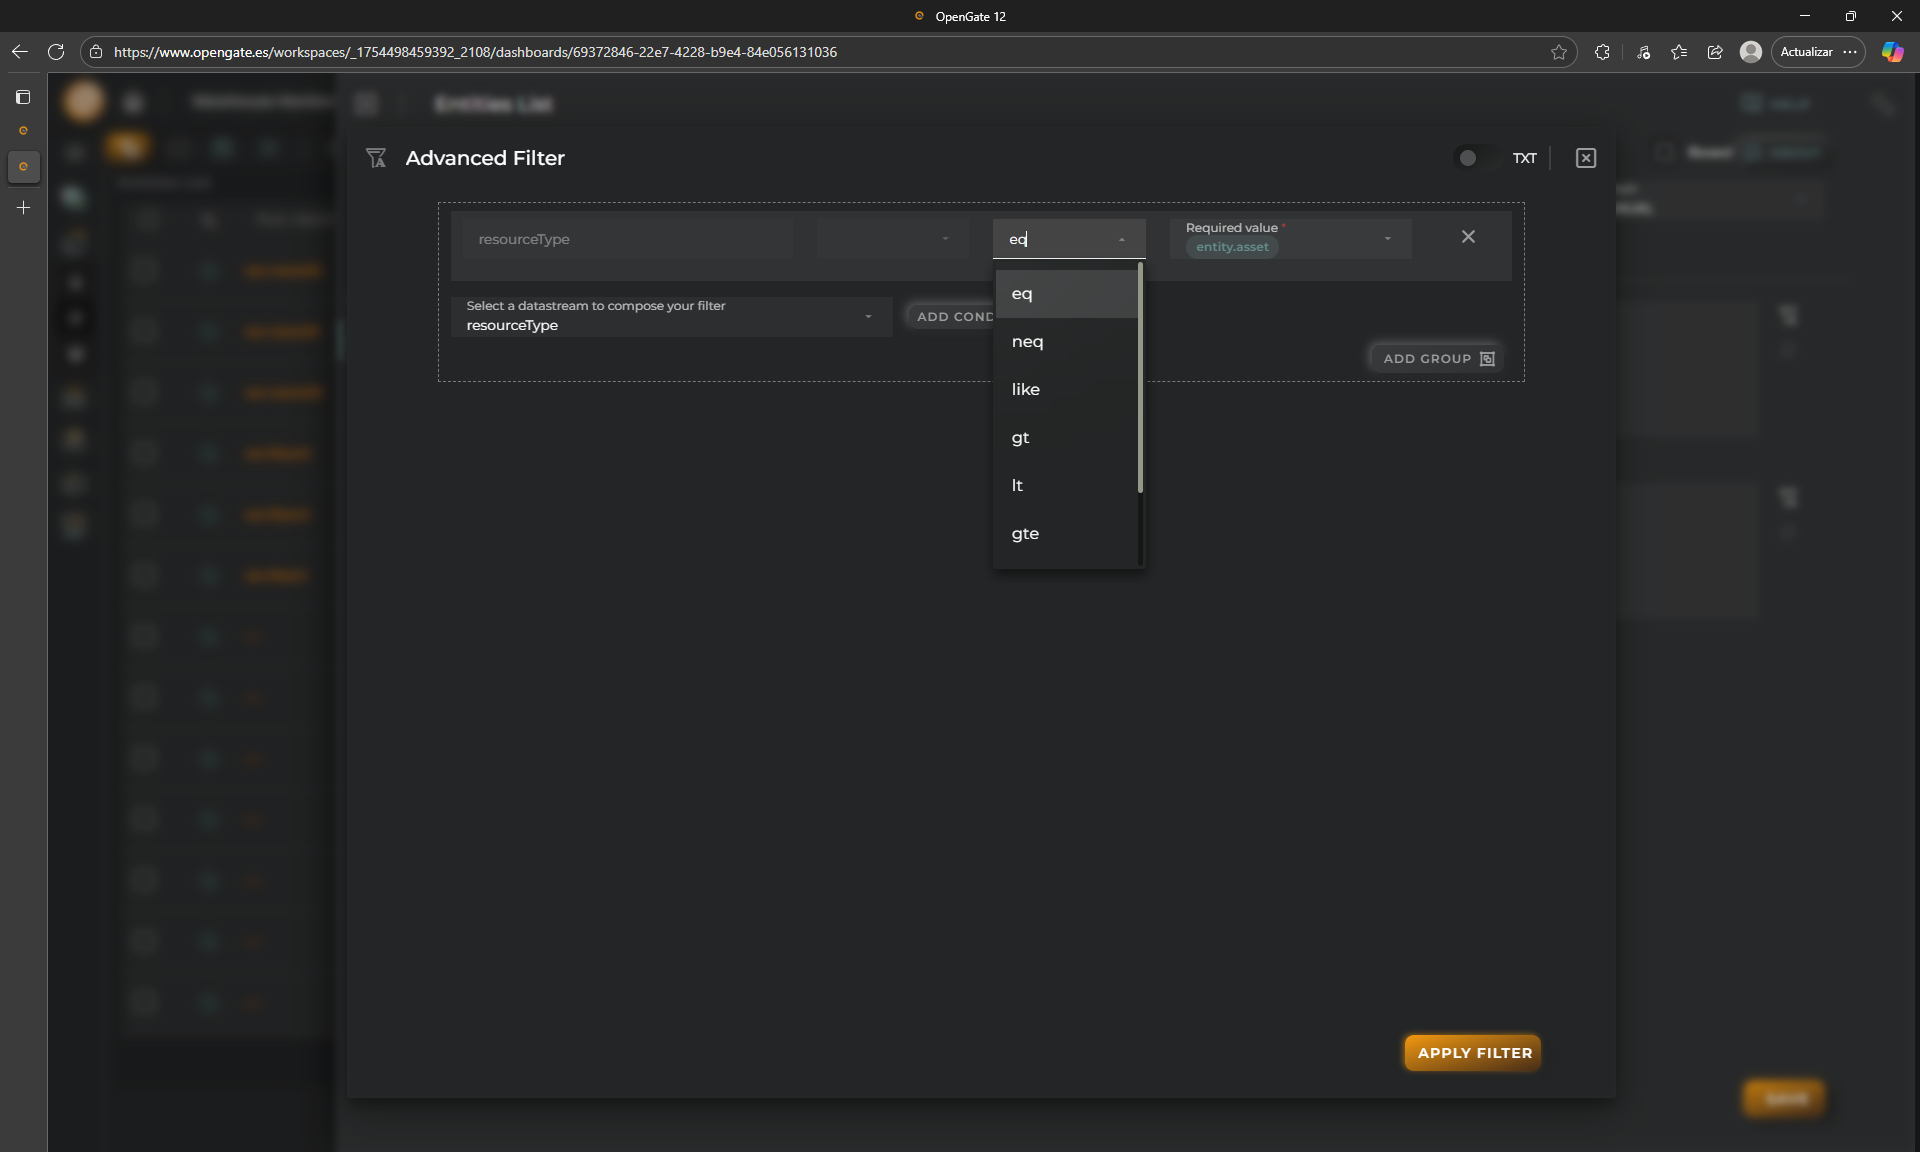
Choose “eq” (that means equals) for the condition operator, and fill entity.asset in the value. Click on “APPLY FILTER”
Let’s do a couple of things more.
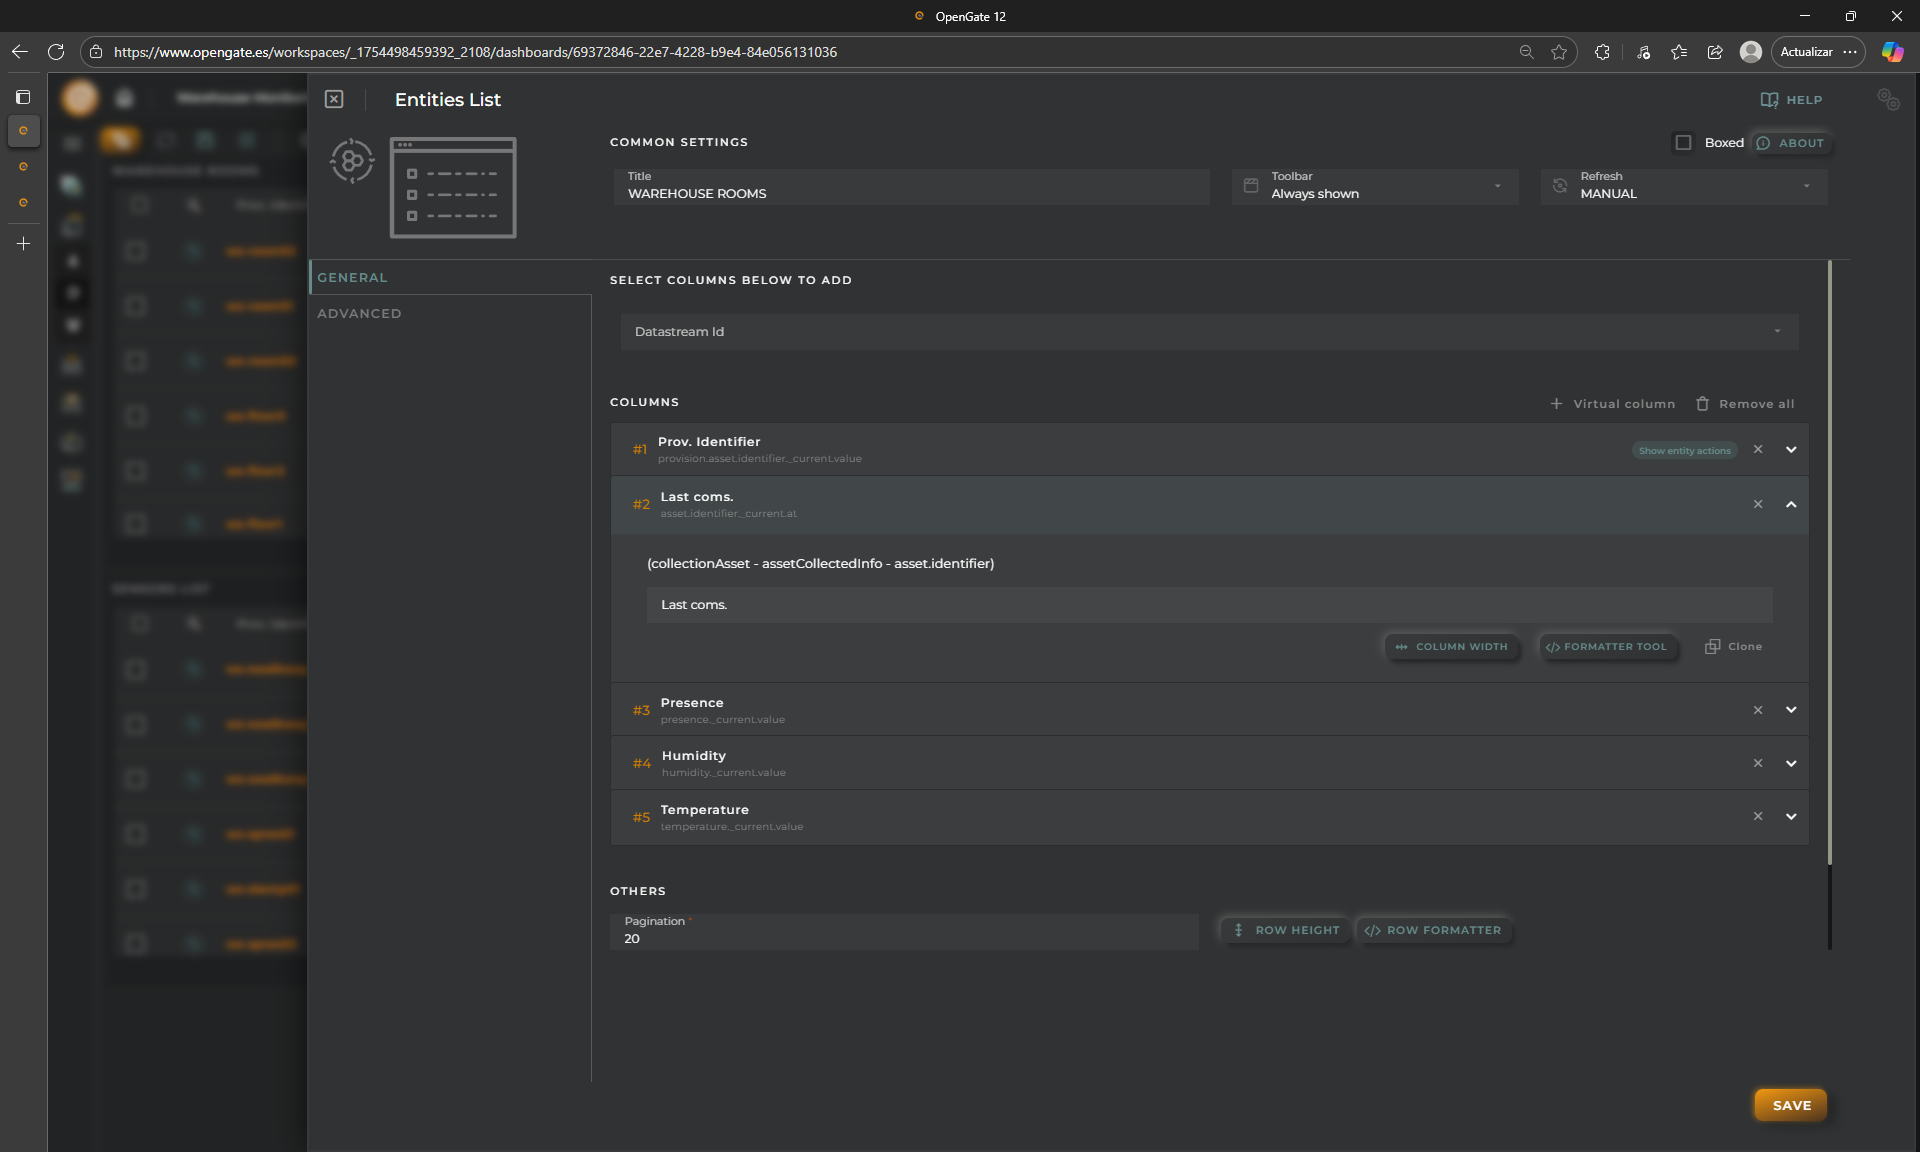
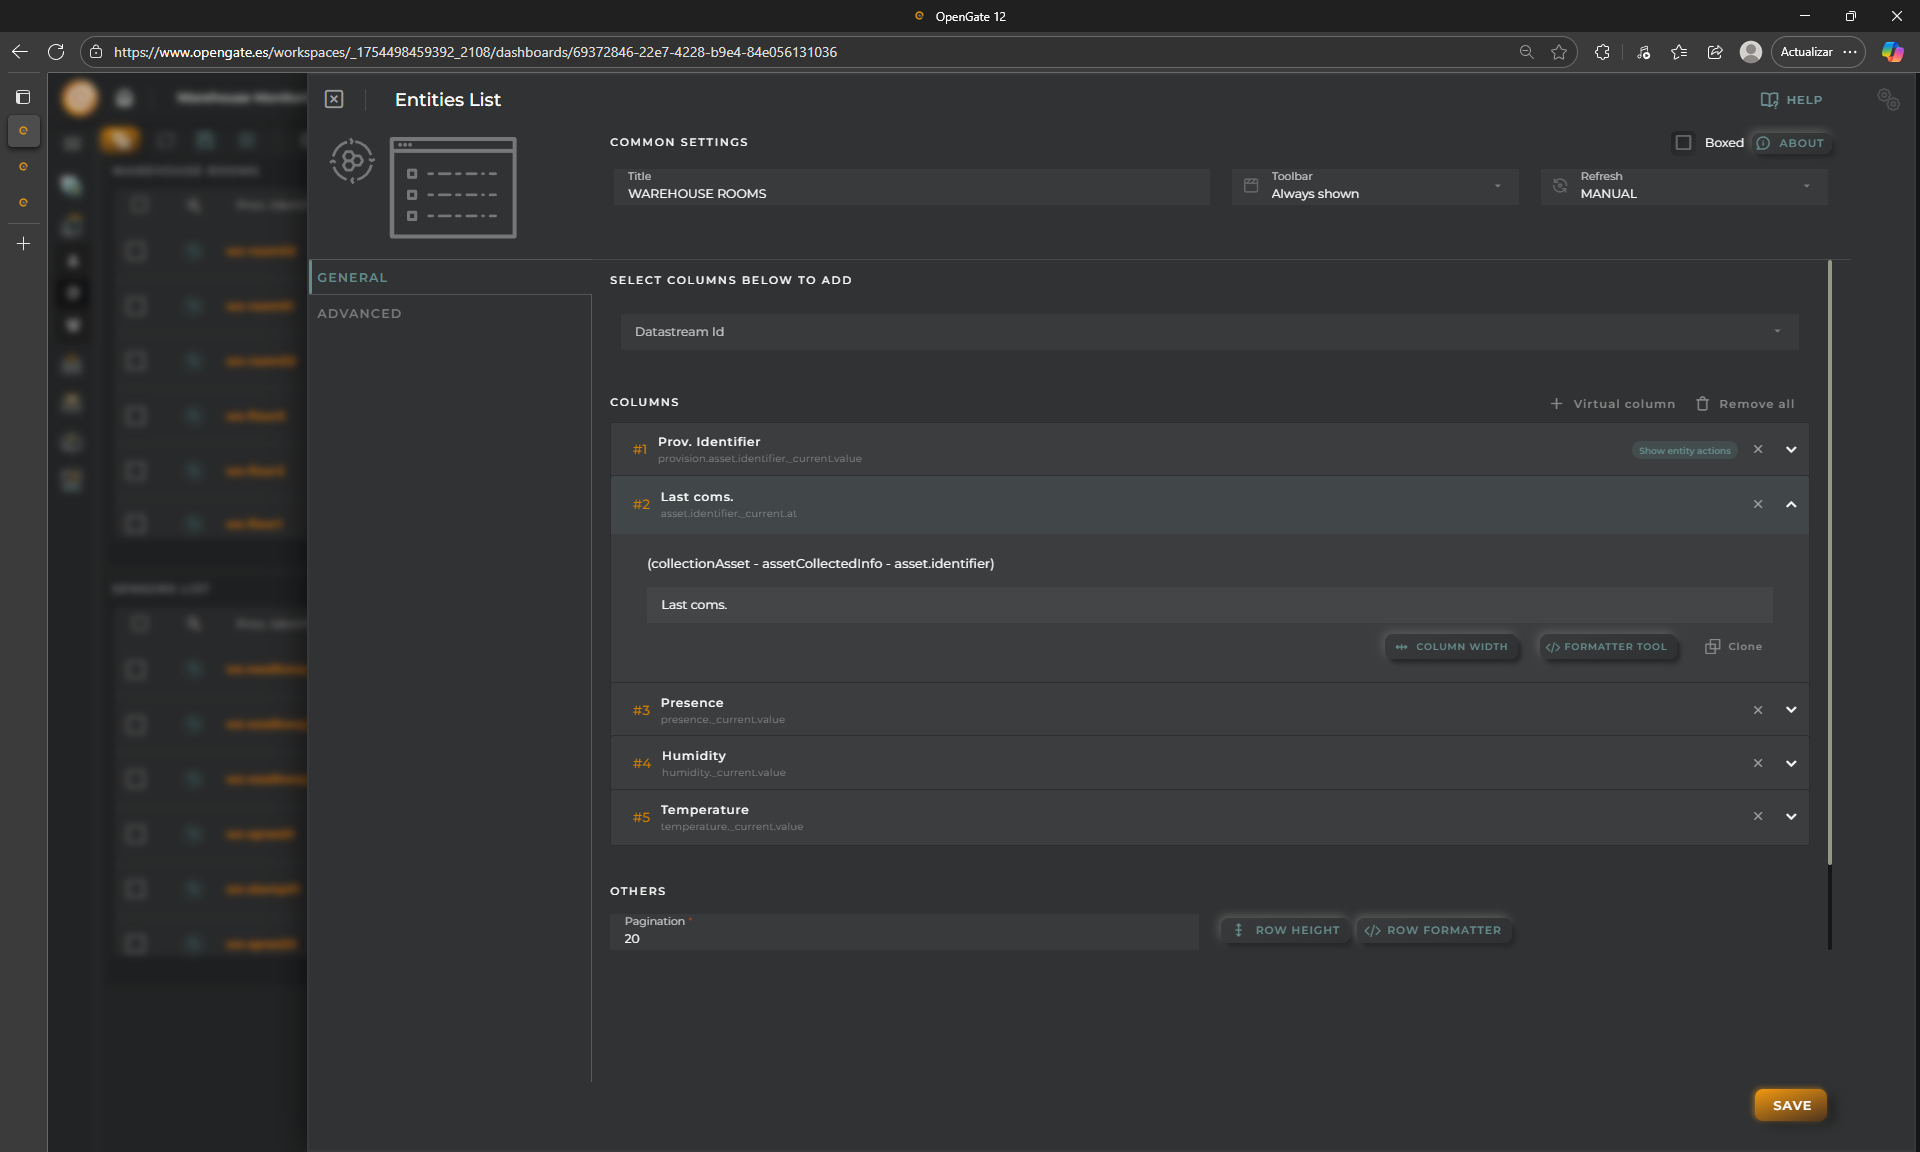
Add a new column using asset.identifier datastream and choose at. This will create a new column that shows each time some asset information is updated by one of its related devices. Edit it and change its name to Last coms.
Remove columns provision.device.specificType and provision.device.identifier, note that these datastreams are relevant for devices, not for assets, so we can safely remove them from this view!
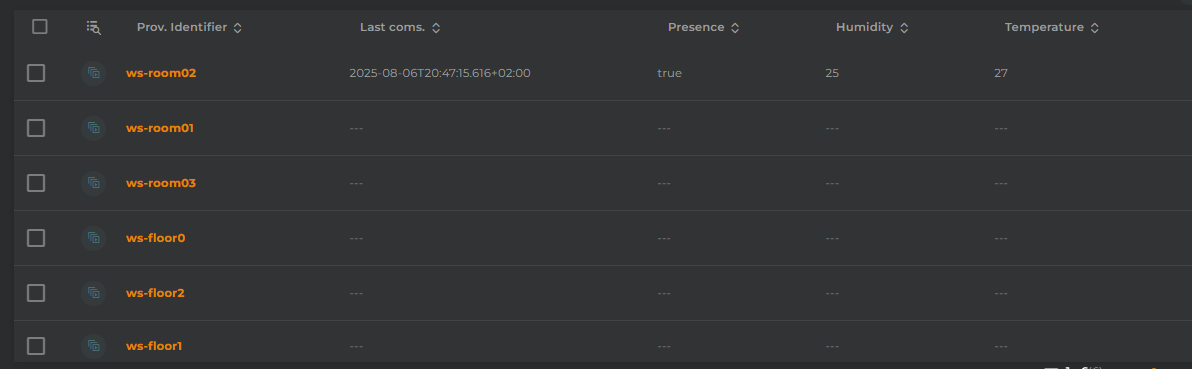
You should have something like this:
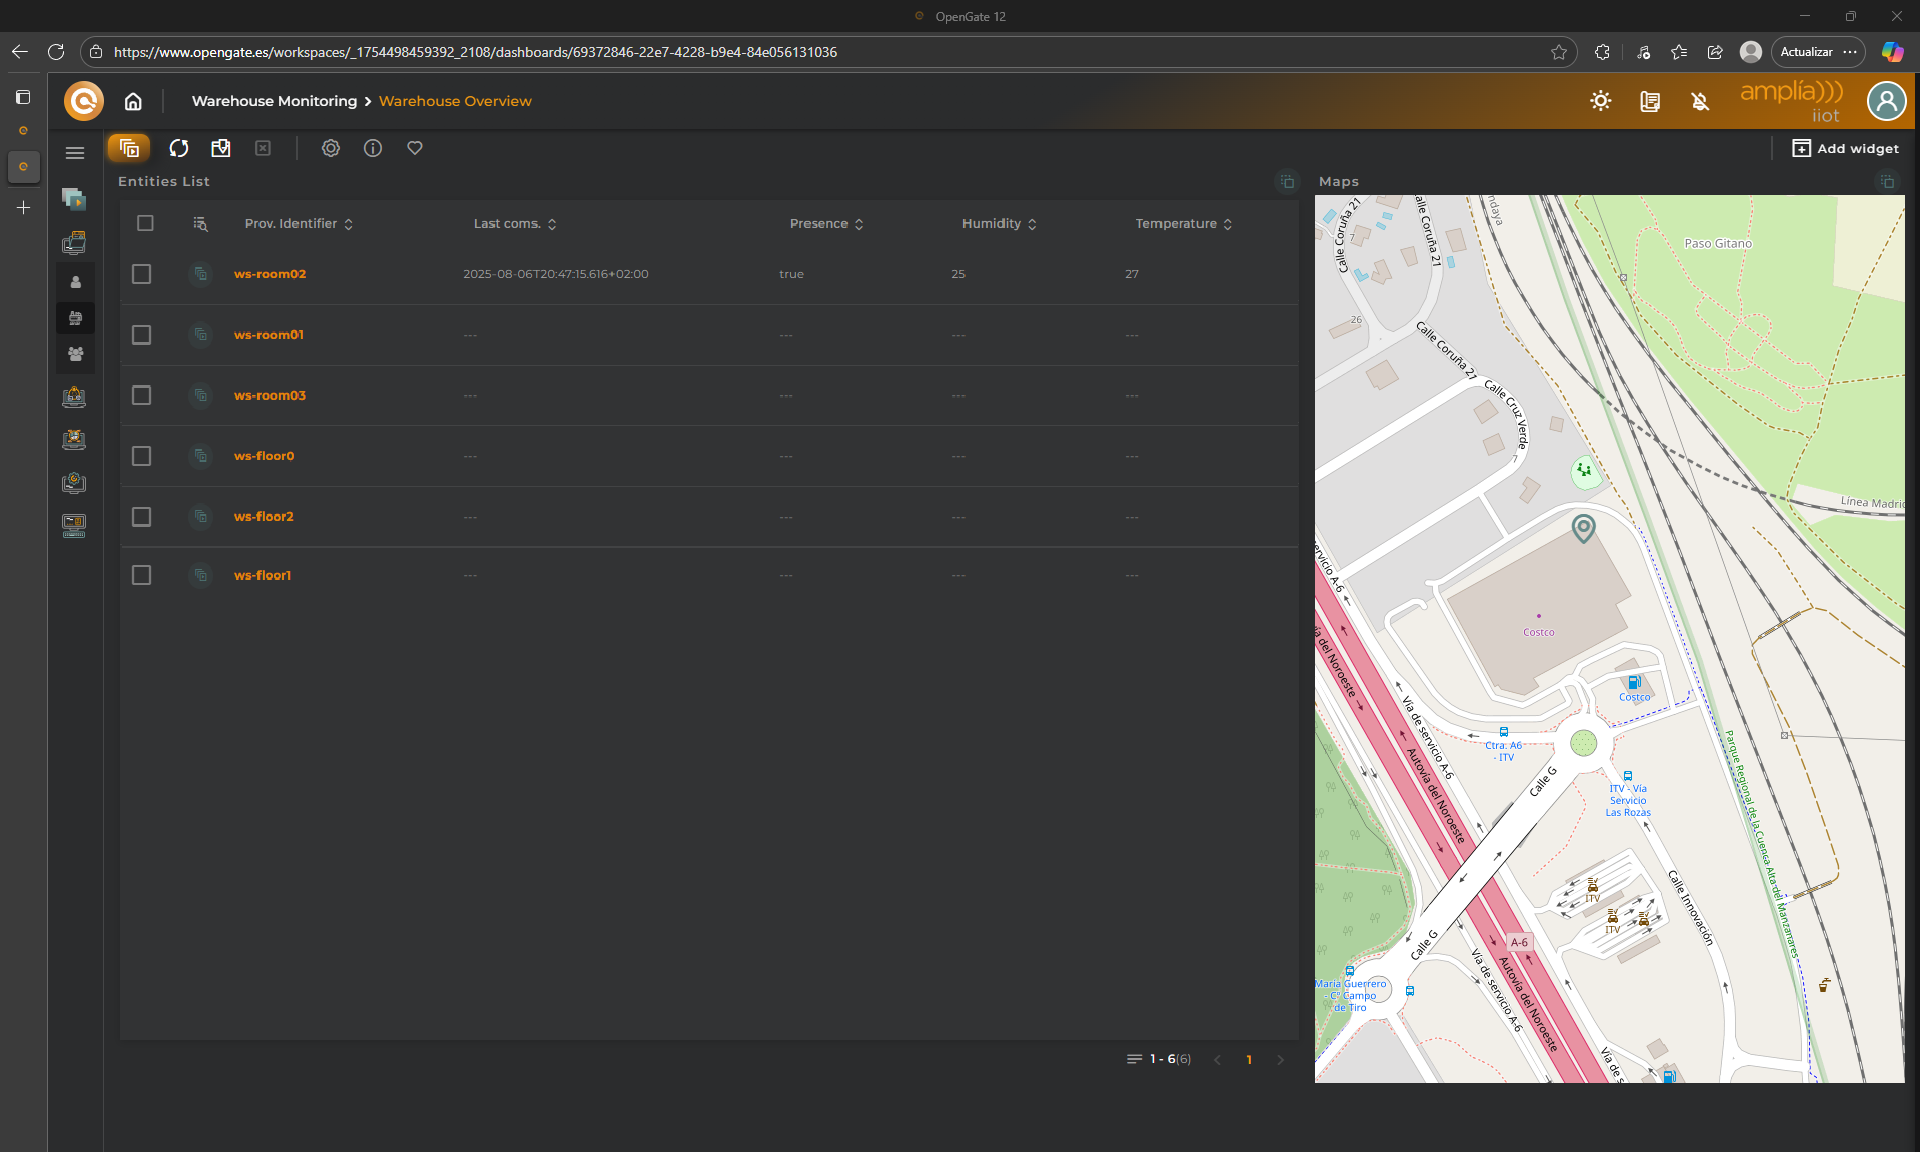
Click on “SAVE” to apply the changes. The widget will now display only assets, with the updated column layout
This will ensure that only assets (not devices or other entities) are shown in the dashboard.
🗺️ Do the same with the “Map” widget
Repeat the job with the map widget. All OpenGate widgets have similar configuration options so you know what you need.
You should accomplish something like this. Only the information from your assets is visible:
➕ Want more?
Repeat all the process and create another entities List widget filtered to show only devices and change the widget names to achieve this dashboard:
🎨 Applying Formatters
Although this may not be part of this basic tutorial, we think that will be relevant for you to know about this feature… Let’s improve our dashboard to another level of customization using “formatters”. This allows you to customize with all the power of web development and its native technologies HTML, CSS and javascript.
Here you have infinite possibilities so for this tutorial we will do the following to our “WAREHOUSE ROOMS” widget:
Format dates: The ISO format is not for everybody. Let’s convert a raw ISO timestamp like 2026-01-01T12:00:00Z into a readable date.
Temperature colors: Apply a code color for temperature datastream values
Presence indicator: Remark the presence detected
NOTE: We assume that you have knowledge in web development, HTML, CSS and javascript.
📅 1. Format dates
Formatters are both simple to use and incredibly powerful. Let’s start with a formatter code to change date appearance.
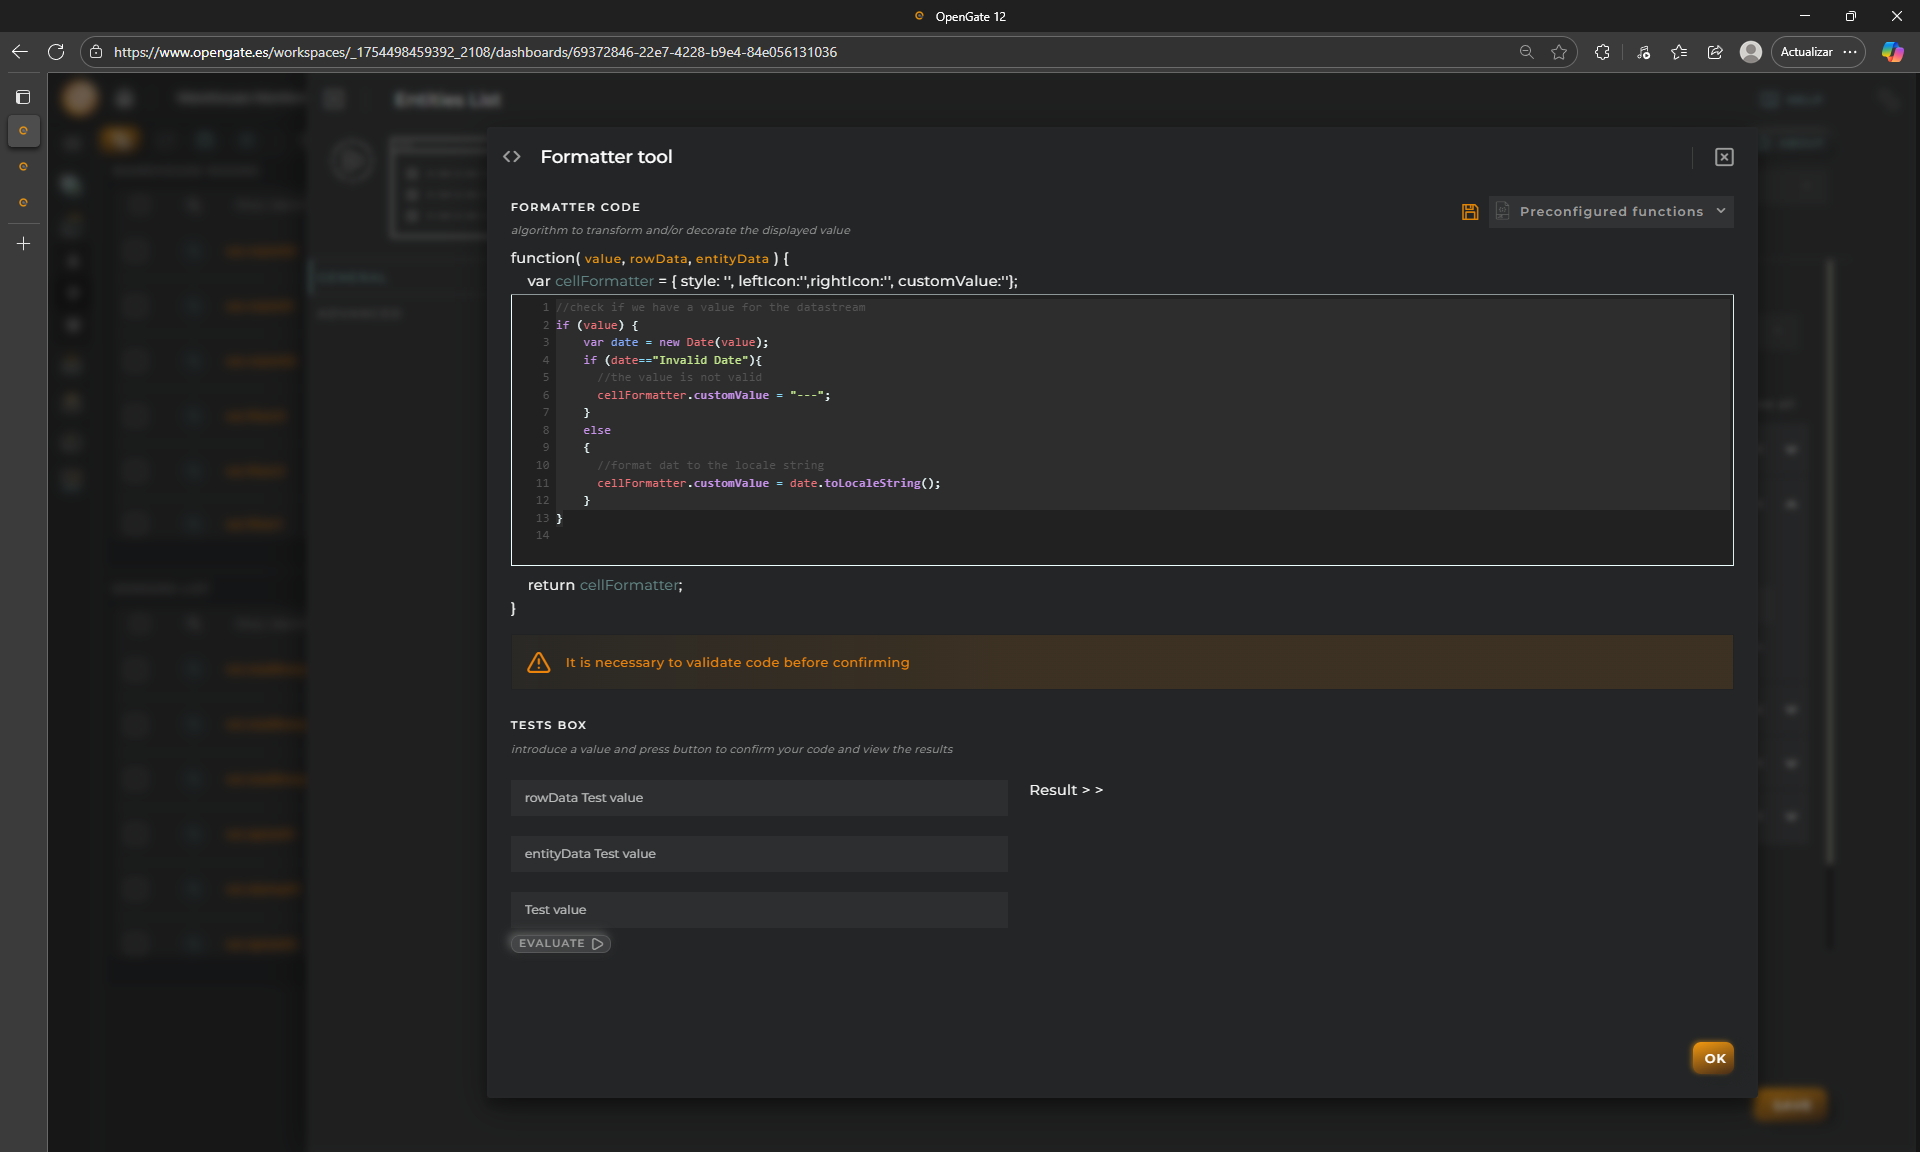
Open the widget configuration and click on “formatter” on the column ‘Last coms.’
Paste the code below, click on “EVALUATE” to check code errors, and “OK” to save your changes
//check if we have a value for the datastream
if (value) {
vardate=new Date(value);
if (date=="Invalid Date"){
//the value is not valid
cellFormatter.customValue="---";
}
else {
//format dat to the locale string
cellFormatter.customValue=date.toLocaleString();
}
}
🌡️ 2. Temperature colors
Repeat the process with the column Temperature and the code below
if (value) { //If value exists
if (value<18){
// Cold
cellFormatter.style='color:lightblue;';
}elseif (value>=18&&value<22 ){
// ideal temperature... using custom green color
cellFormatter.style='color:#20BB38FF;';
}elseif (value>=22){
//more than 22 ºC is hot...
cellFormatter.style='color:red;';
}else{
//grey
cellFormatter.style='color:#808080;';
}
}
👁️ 3. Presence indicator
One more time. Edit column Presence
if (value===true) {
//You can change the cell value for a custom one and even use emojis 🎉🎉!!
cellFormatter.style='color:green;';
cellFormatter.customValue="<strong title='TRUE'>TRUE 🟢</strong>";
} else {cellFormatter.customValue="<span title='FALSE'>FALSE 🔳</span>";cellFormatter.style='color:grey;';}
🎉 4. Check the result
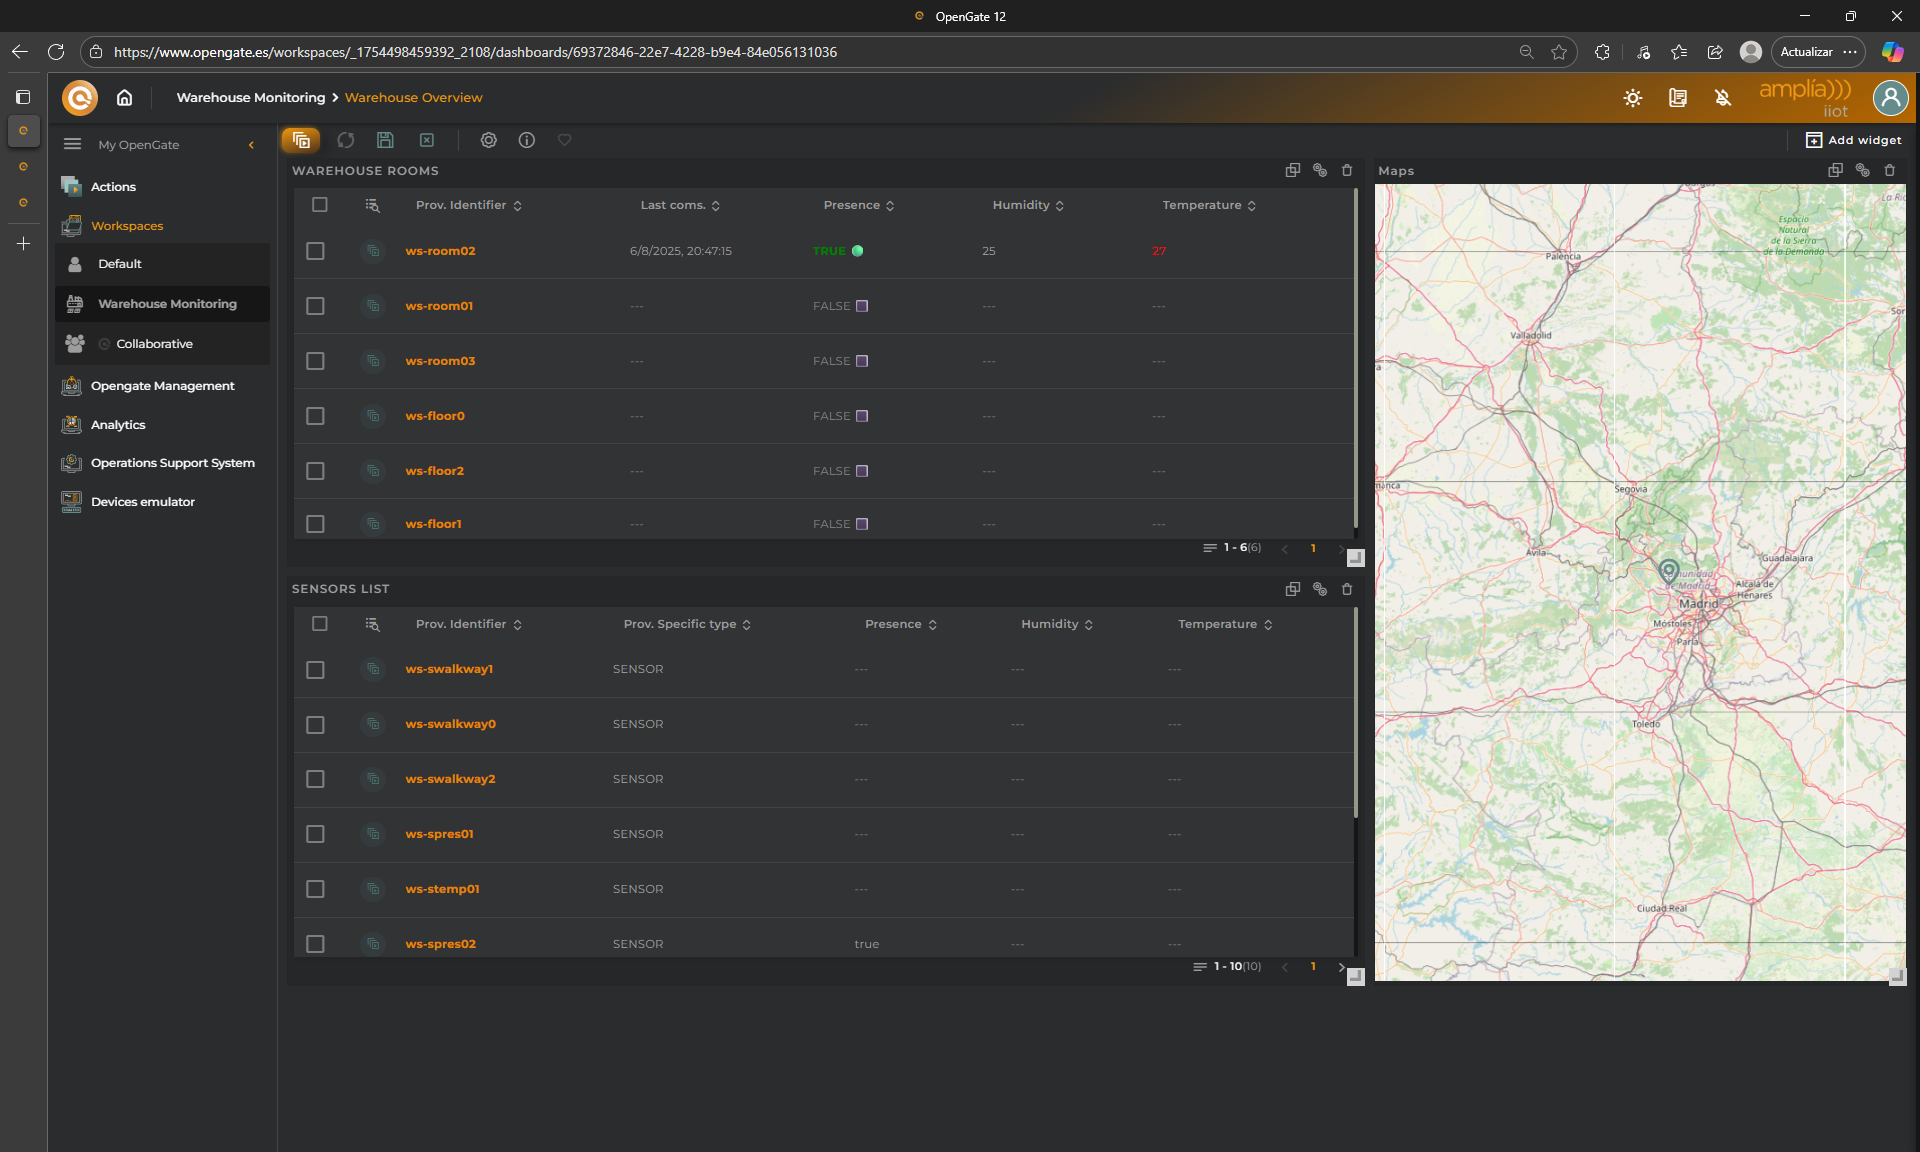
Click on “SAVE” on the widget configuration and check the result… Pretty powerful, right?
8. Operations
⚙️ Operations in OpenGate
Once your dashboard is set up and filtered, it’s time to take action. OpenGate allows you to send operations to your devices directly from the dashboard using the Operations feature. But first, we need to configure a few operations to make them available.
📚 Understanding the Operations
Before sending any operation, it’s important to understand how operations are defined and managed in OpenGate:
Operations are predefined actions that can be executed on entities (devices, assets, etc.).
Each operation includes:
A name and description and target entity types
GUI Form definition and STEPS
Optional parameters
OpenGate offers a predefined Operations catalog out-of-the-box for: Reboot equipments, power on/off devices, refresh_info, refresh_presence, firmware update through bundles, and more.
You can create your own custom operations, but we do not deeper in this basic tutorial.
🛠️ Configuring a Sample Operation: REBOOT
Let’s create a simple operation to reboot a device. This Operation already exists on the OpenGate Operations catalog and it is a good approach to learn how operations work.
1. Create the REBOOT Operation
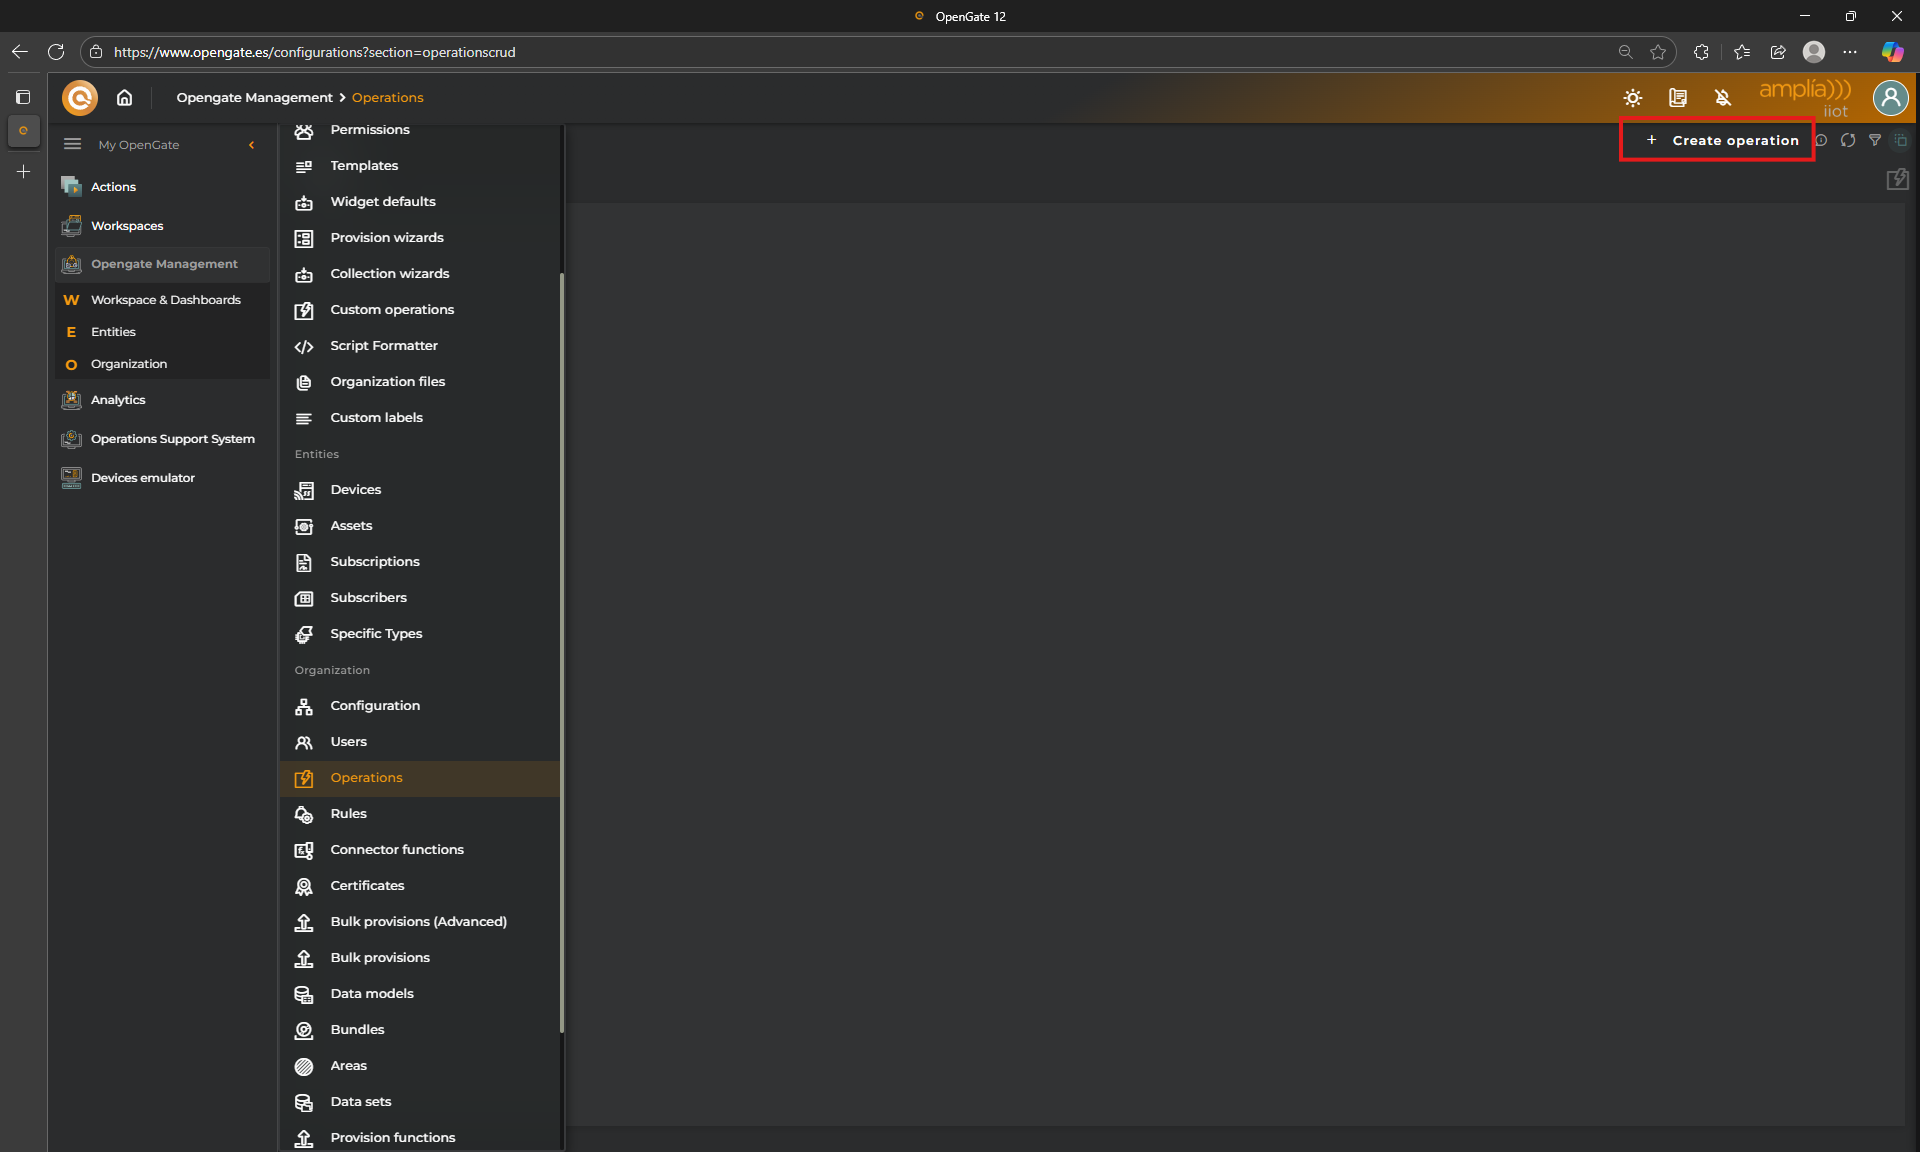
Go to OpenGate Management > Operations and click on “+ Create Operation”.
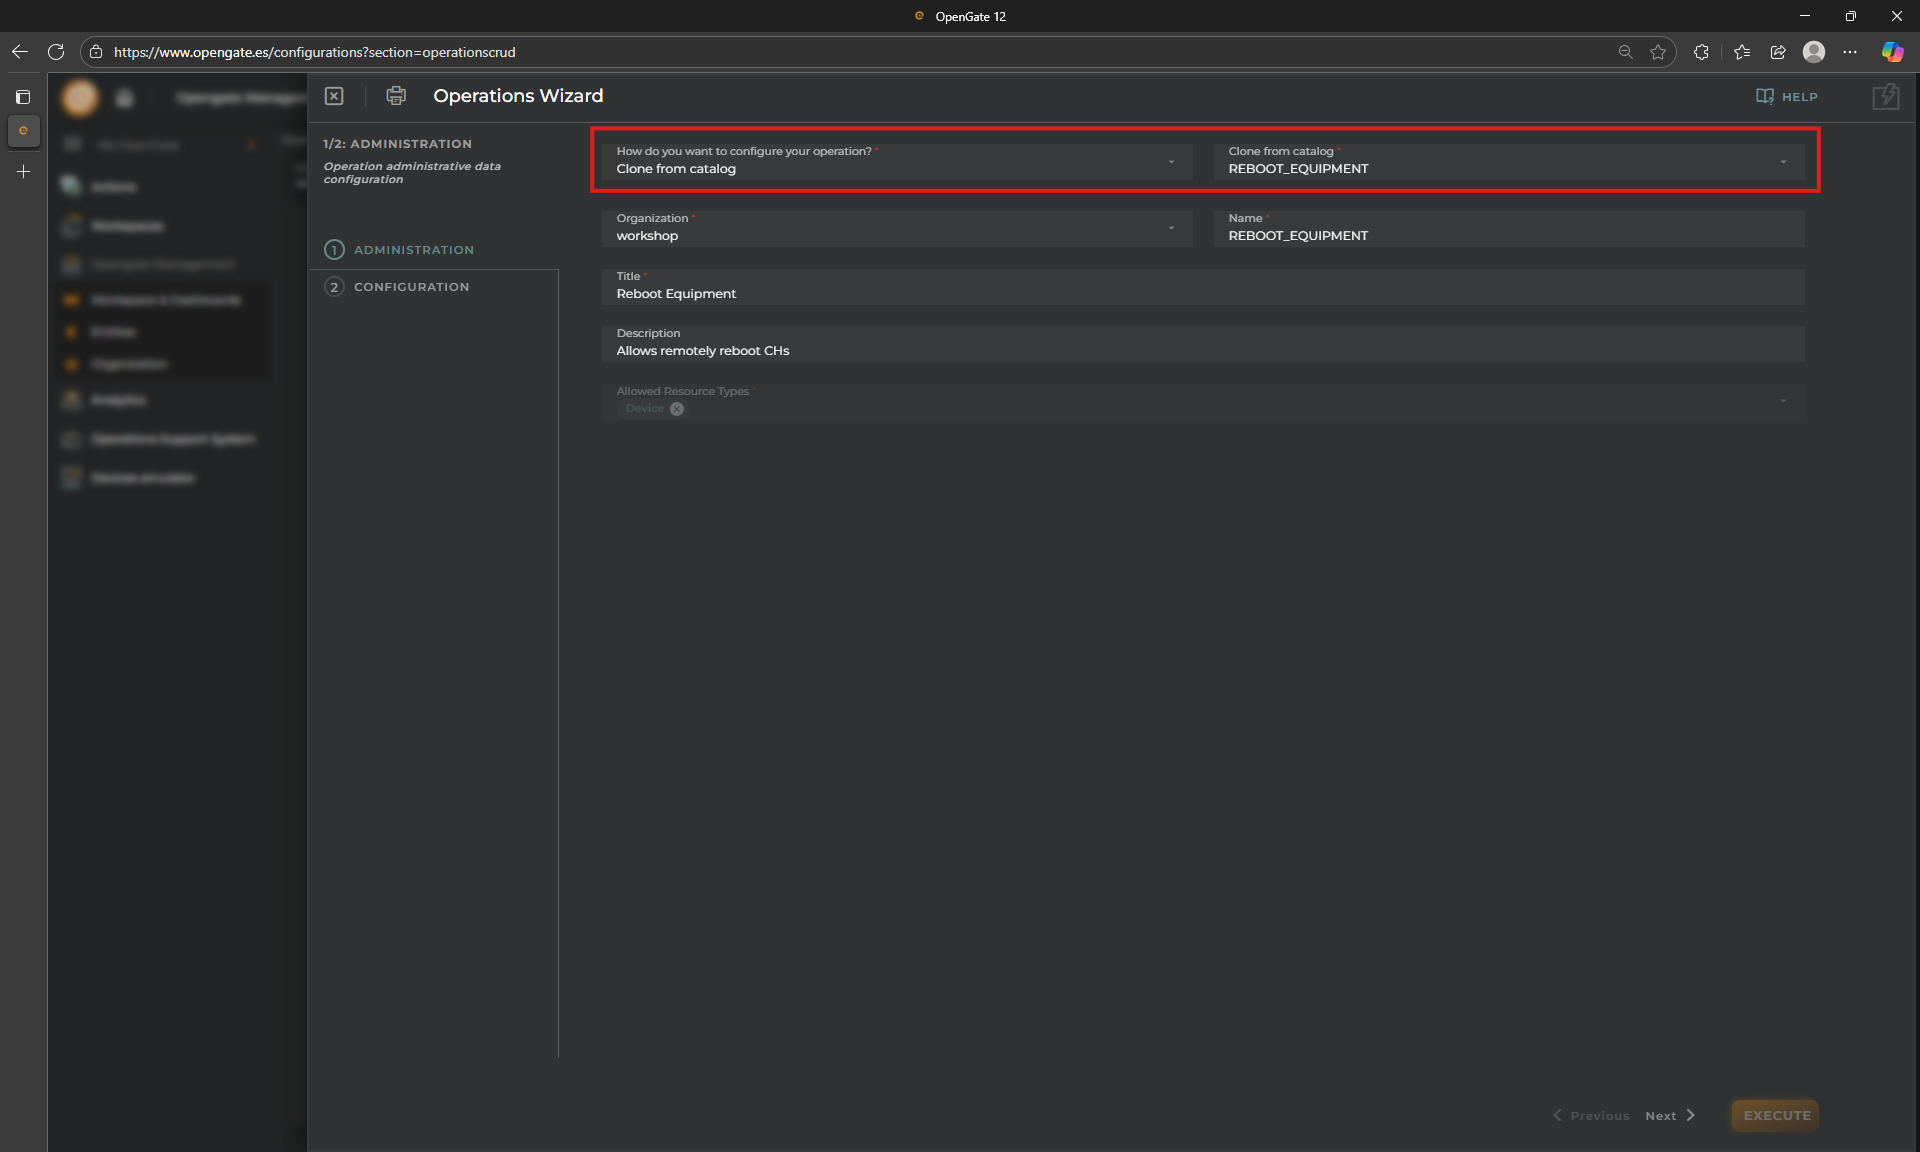
Click Clone from catalog and choose REBOOT_EQUIPMENT. Keep data as default and click on next
Name: REBOOT_EQUIPMENT
Title: Reboot Equipment
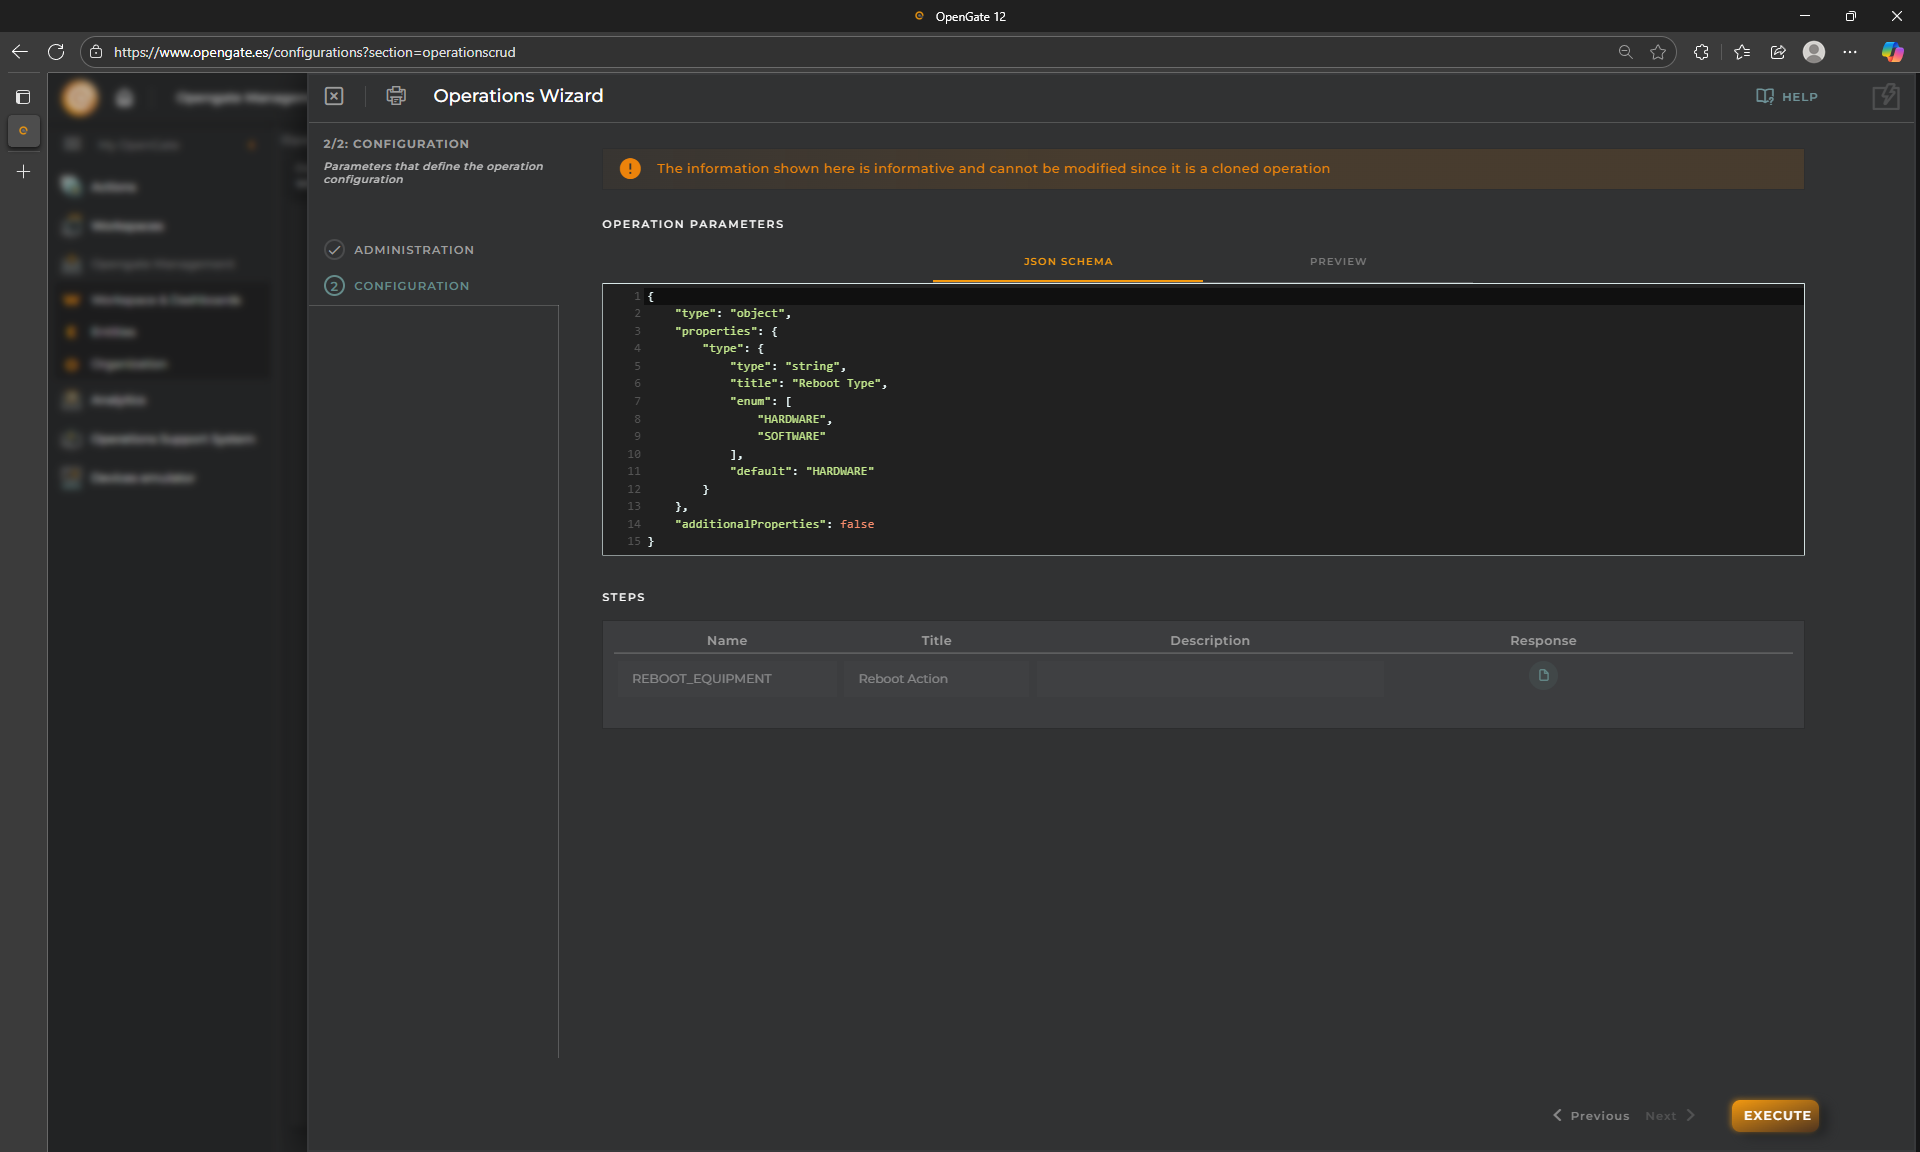
Check Operation configuration.
JSON Schema, Another powerful tool: OpenGate allows you to define custom Operation Wizards using JSON Schema forms.
Additionally, the “Operations” allows you to define STEPS. Because some actions may require a complex workflow in your devices, we design this method so you can notify the platform from the device when each step is completed or failed and then register the full operation traceability on the platfom. For this tutorial, because we used the “clone the operation” before, this operation has only one step and you cannot modify it.
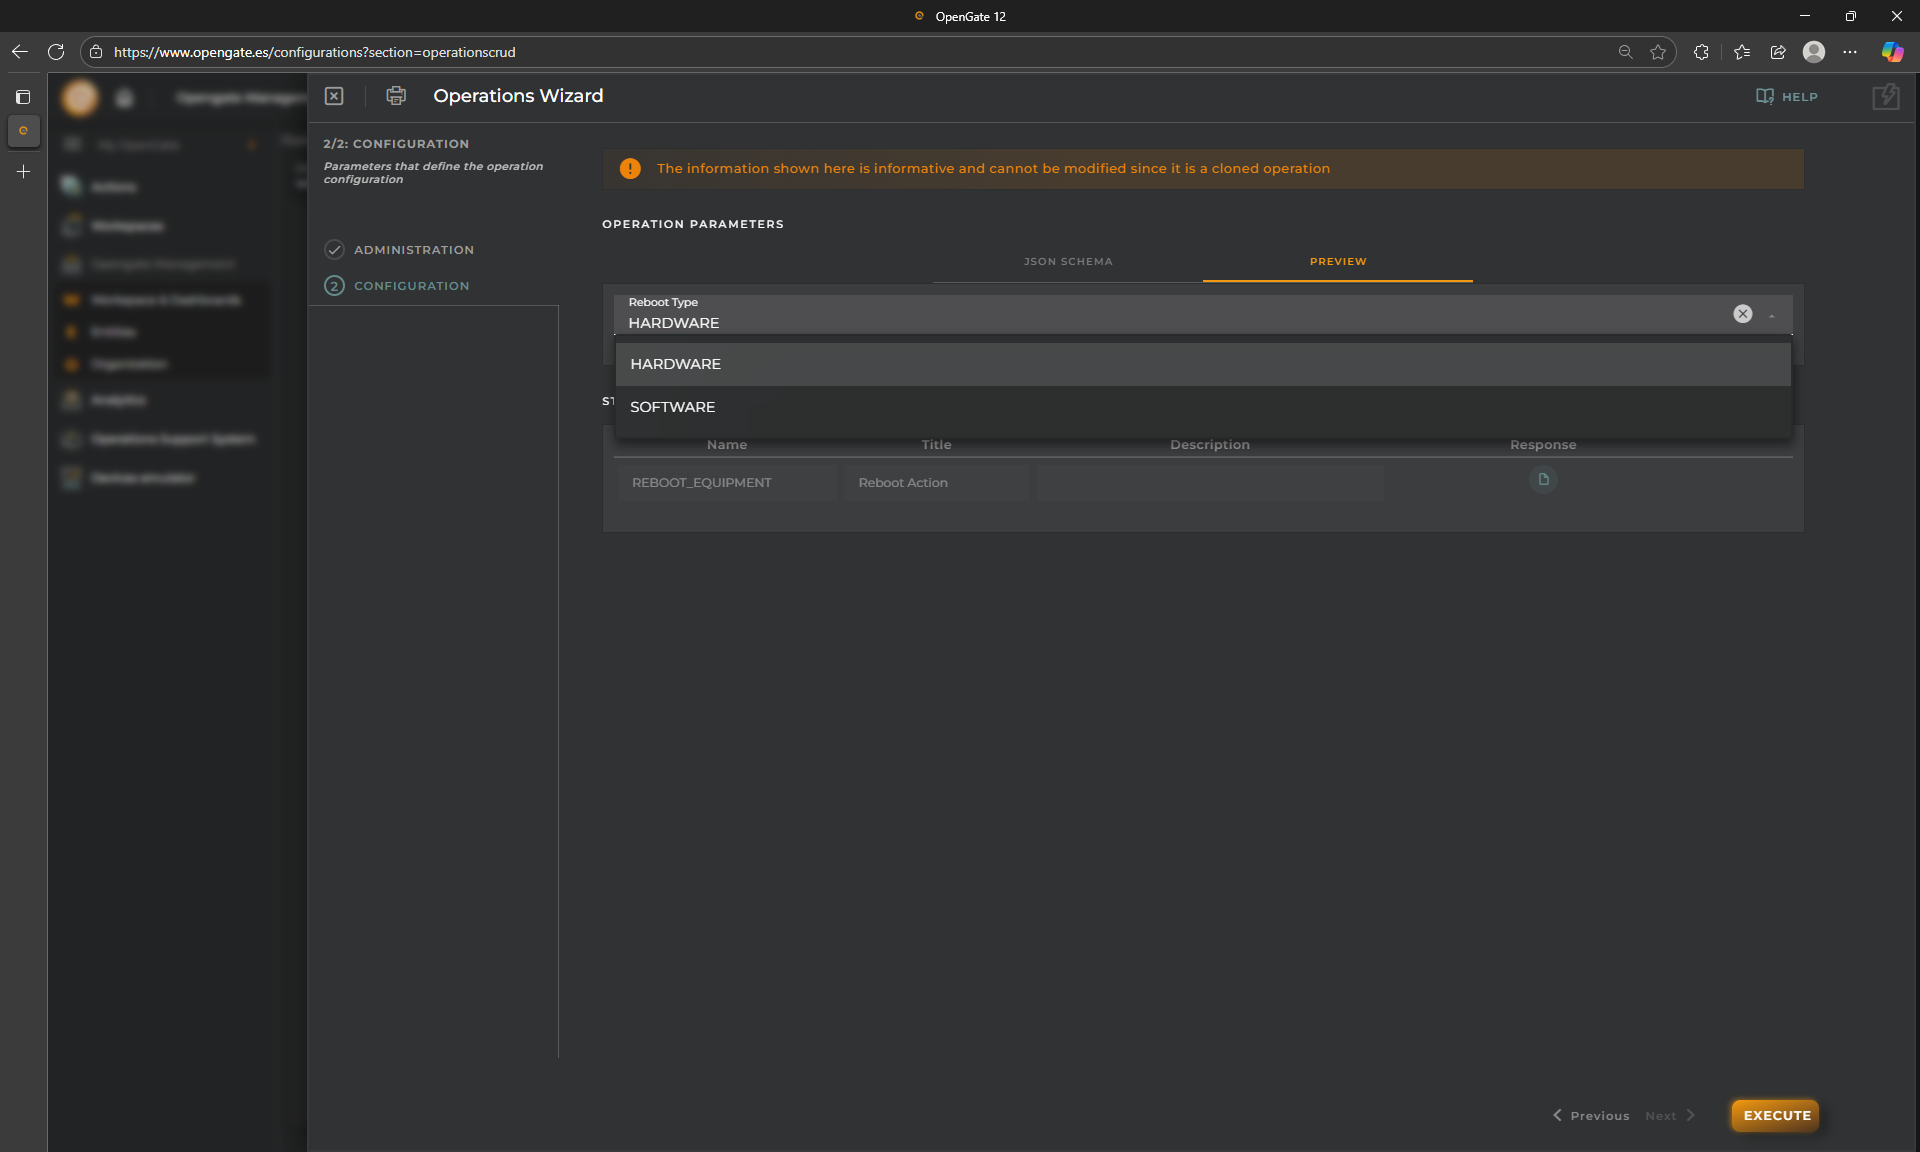
Preview your JSON Schema Operations form:
You can click on “PREVIEW” tab to check how your form will be displayed and even test it.
Just to let you know, this operation has only an input field component, to choose between “hardware” or “software” reboot type to be send to the device.
Create your operation and check the confirmation message on the summary
Perfect! you have created your first Operation successfully. Let’s launch it, right?
2. Testing with the OpenGate Device Emulator:
Do you remember our OpenGate Device Emulator?? We can use it to emulate also operations responses from devices and test our operations workflow.
Open the OpenGate Device Emulator in a new window
Select one of our devices, for example the device [YourPrefix]-ps-001. and go to the “OPERATIONS” tab
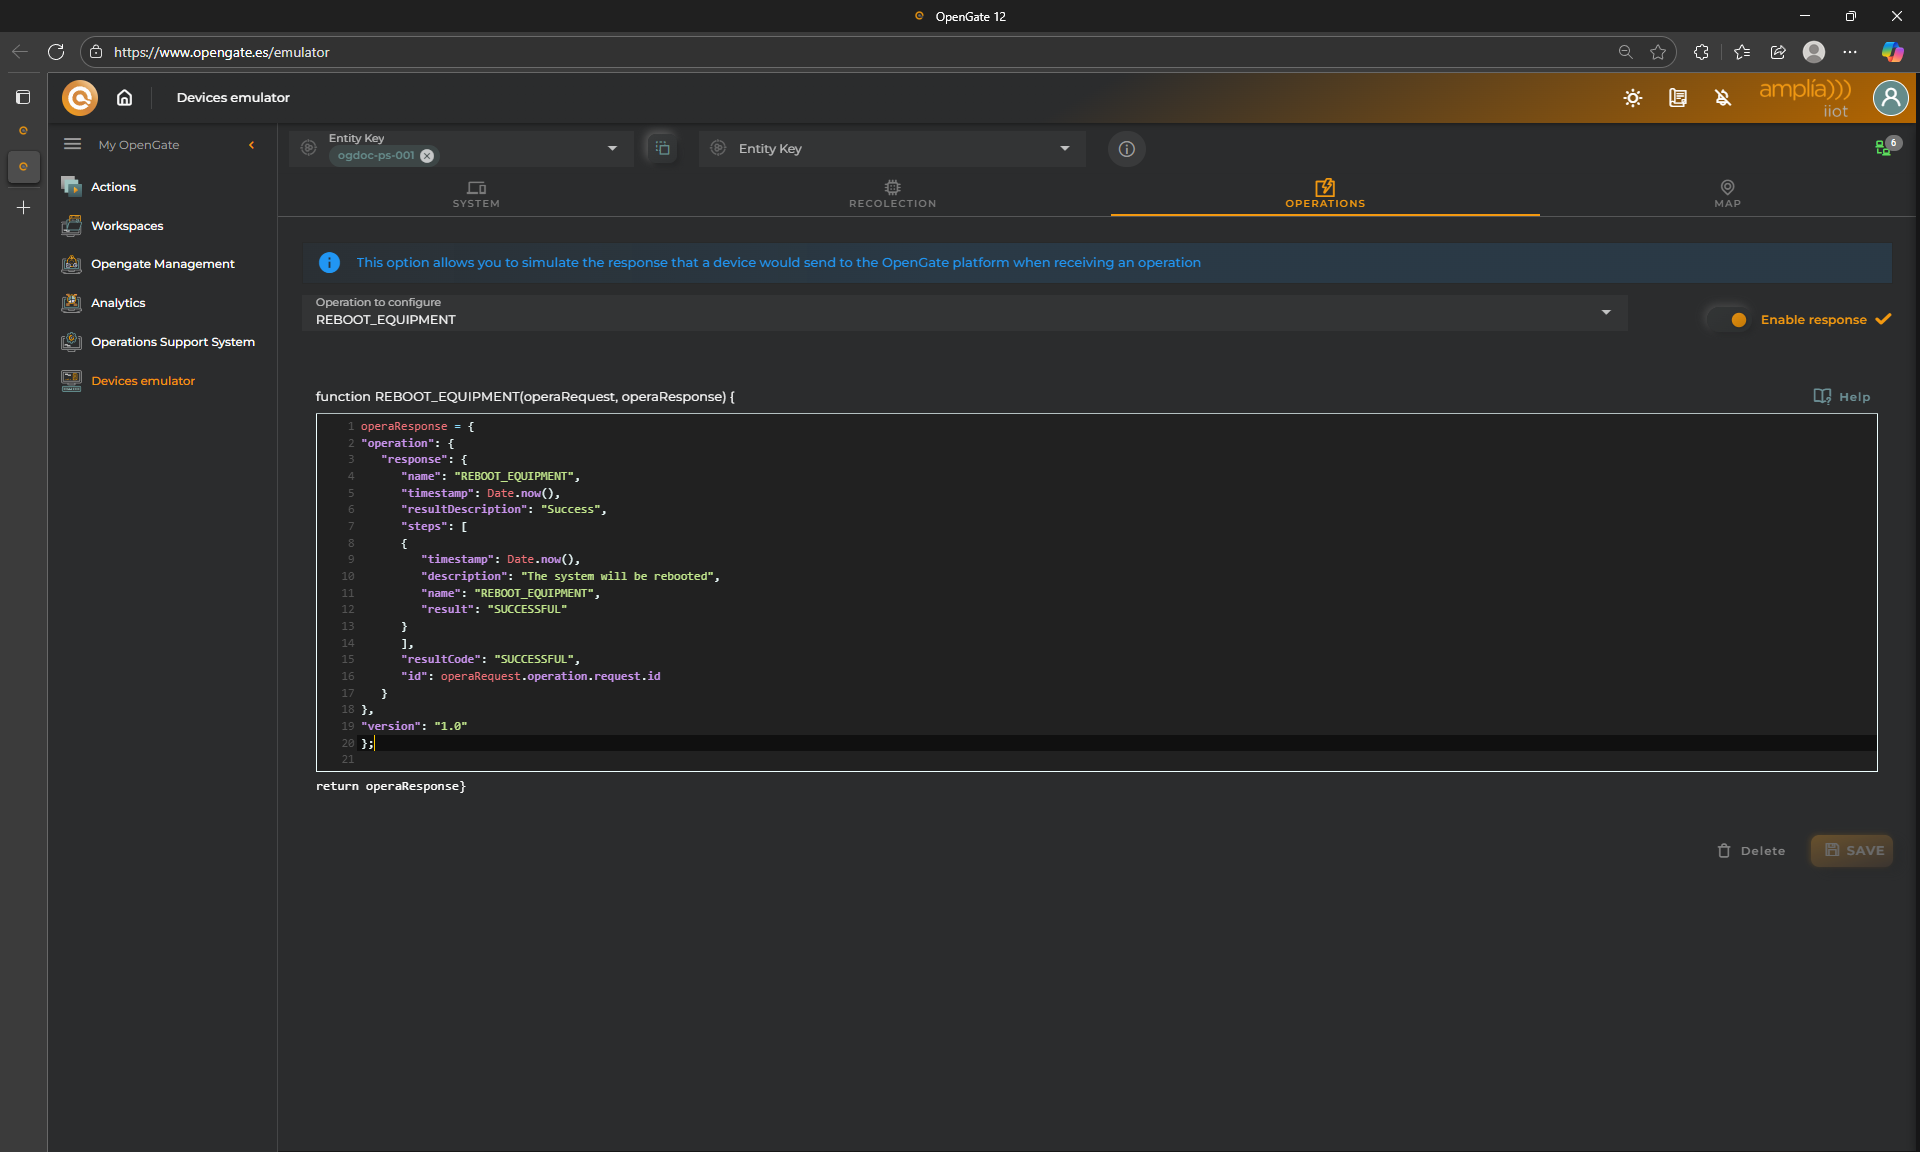
Configure the responses. Fill the following information and click on “SAVE”:
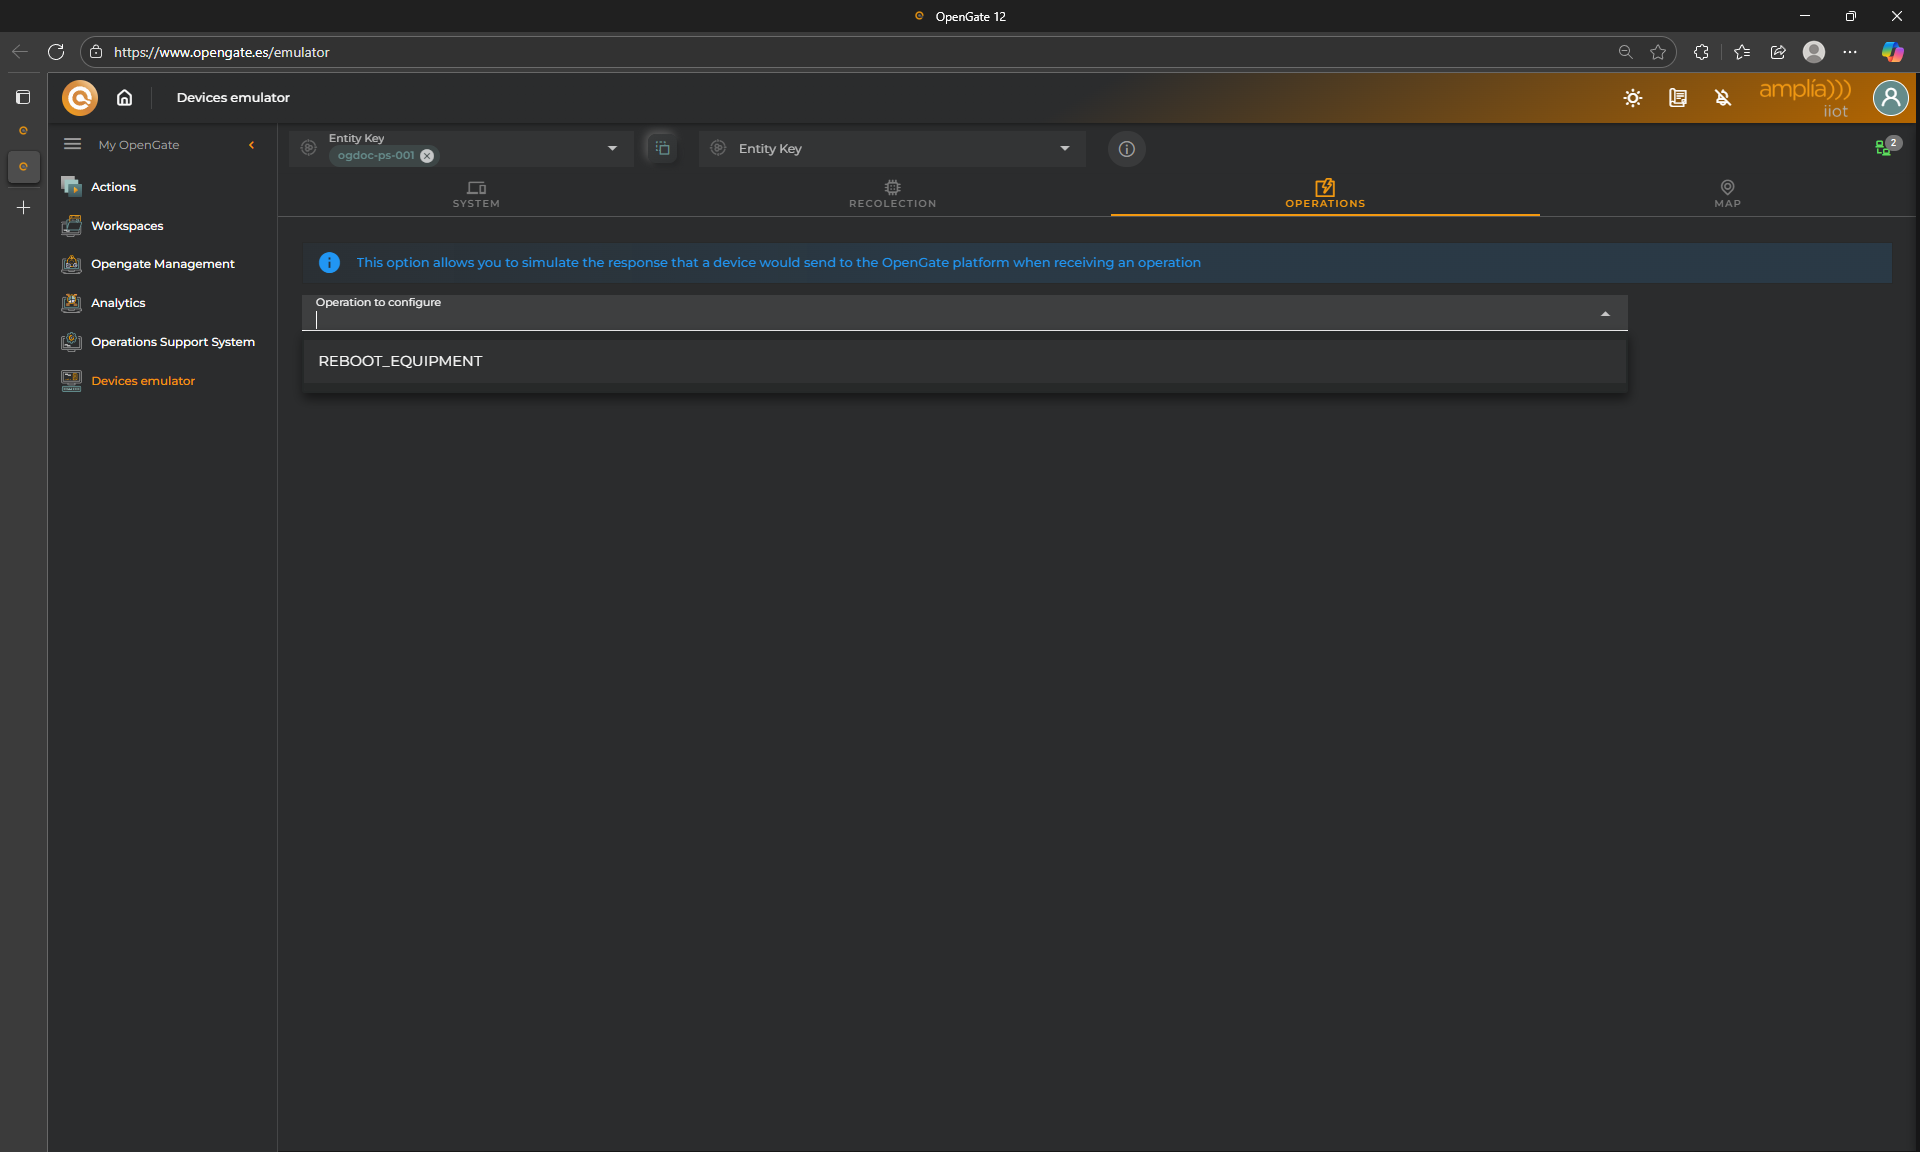
Choose Operation: REBOOT_EQUIPMENT
Check the “ENABLE RESPONSE” option. This indicates if Device Emulator must respond or not
Copy/paste the code below to respond the operation request:
operaResponse= {
"operation": {
"response": {
"name":"REBOOT_EQUIPMENT",
"timestamp": Date.now(),
"resultDescription":"Success",
"steps": [
{
"timestamp": Date.now(),
"description":"The system will be rebooted",
"name":"REBOOT_EQUIPMENT",
"result":"SUCCESSFUL" }
],
"resultCode":"SUCCESSFUL",
"id":operaRequest.operation.request.id }
},
"version":"1.0"};
Now keep open the OpenGate Device Emulator log and return to our dashboard “Warehouse Overview”
🚀 Sending an Operation from the Dashboard
Now let’s send the operation from your dashboard and validate the result.
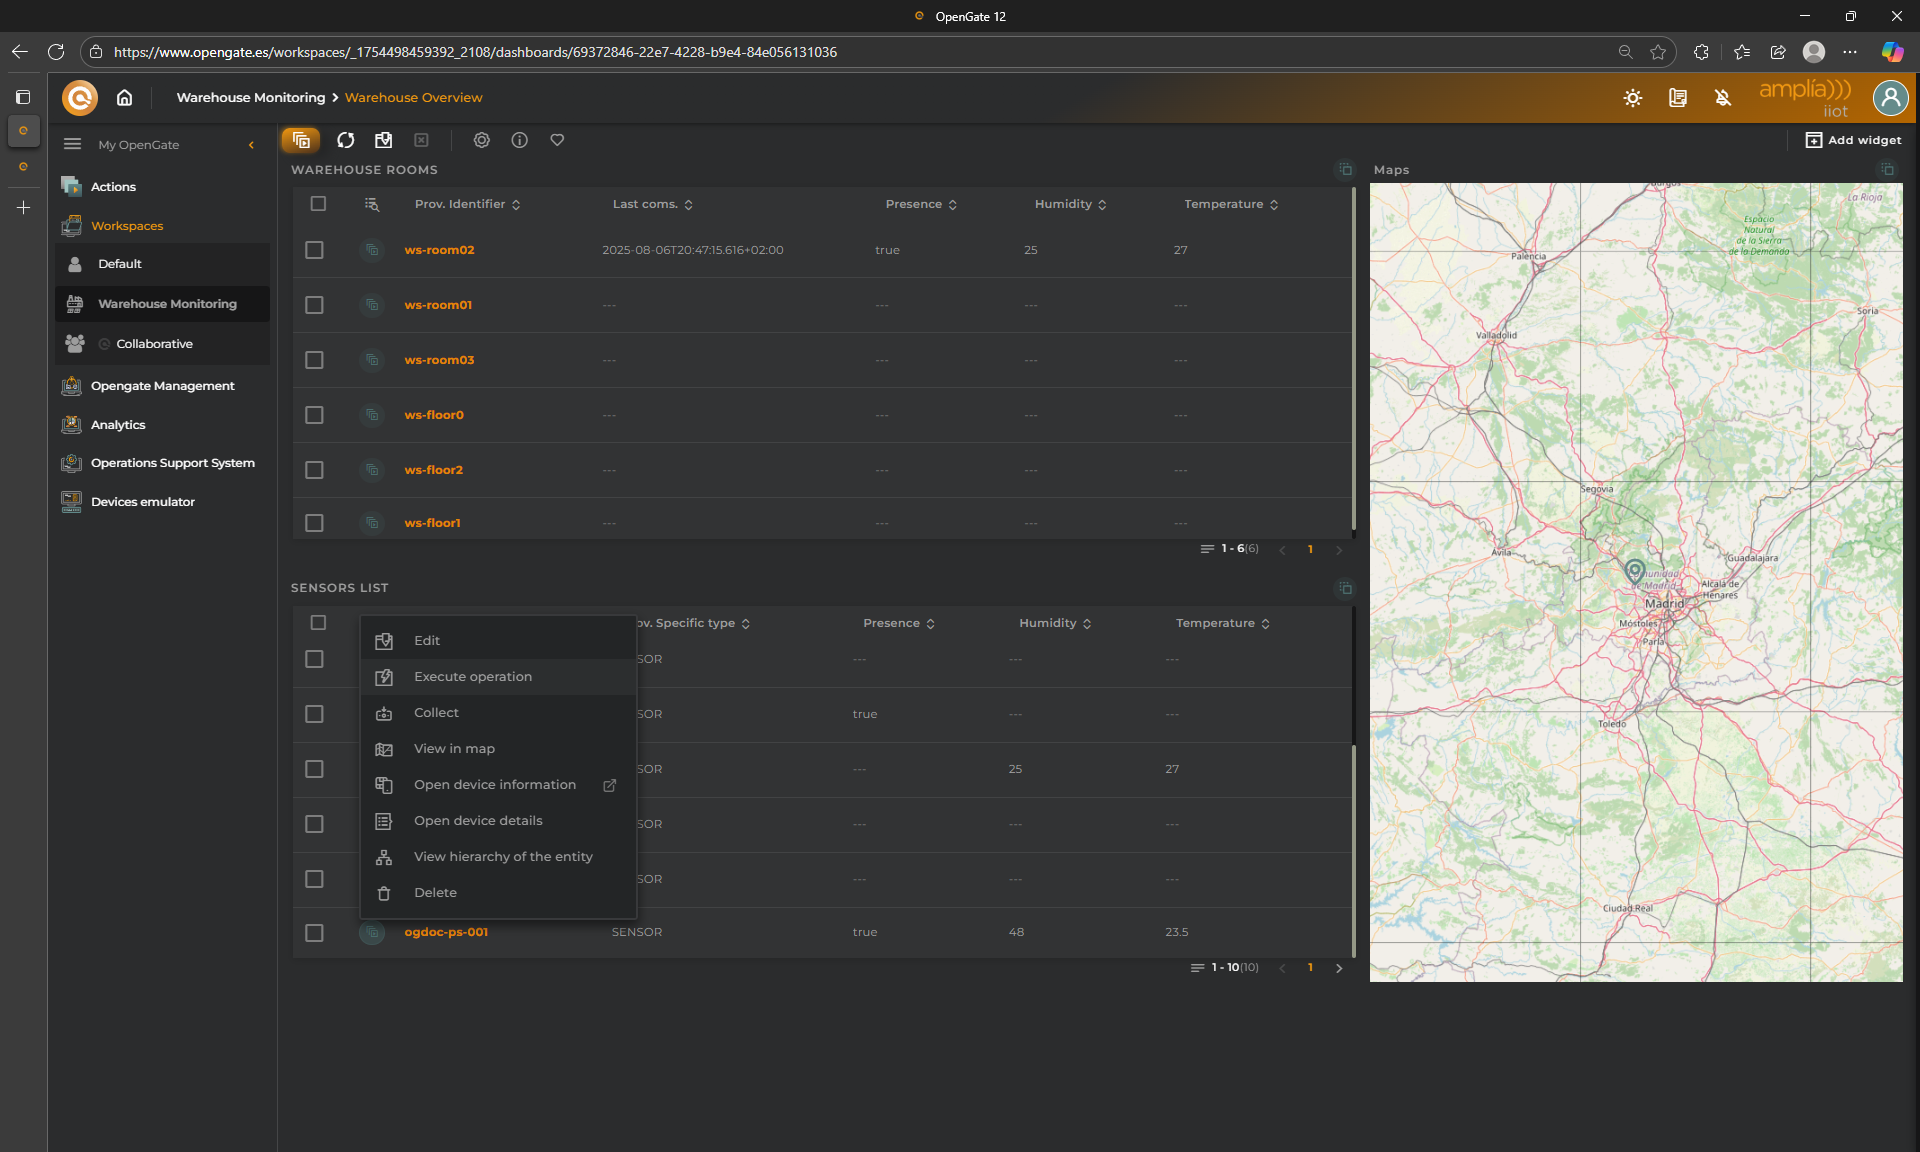
click on “EXECUTE OPERATION” in the device [yourPrefix]-ps-001 menu. This opens the Operation wizard
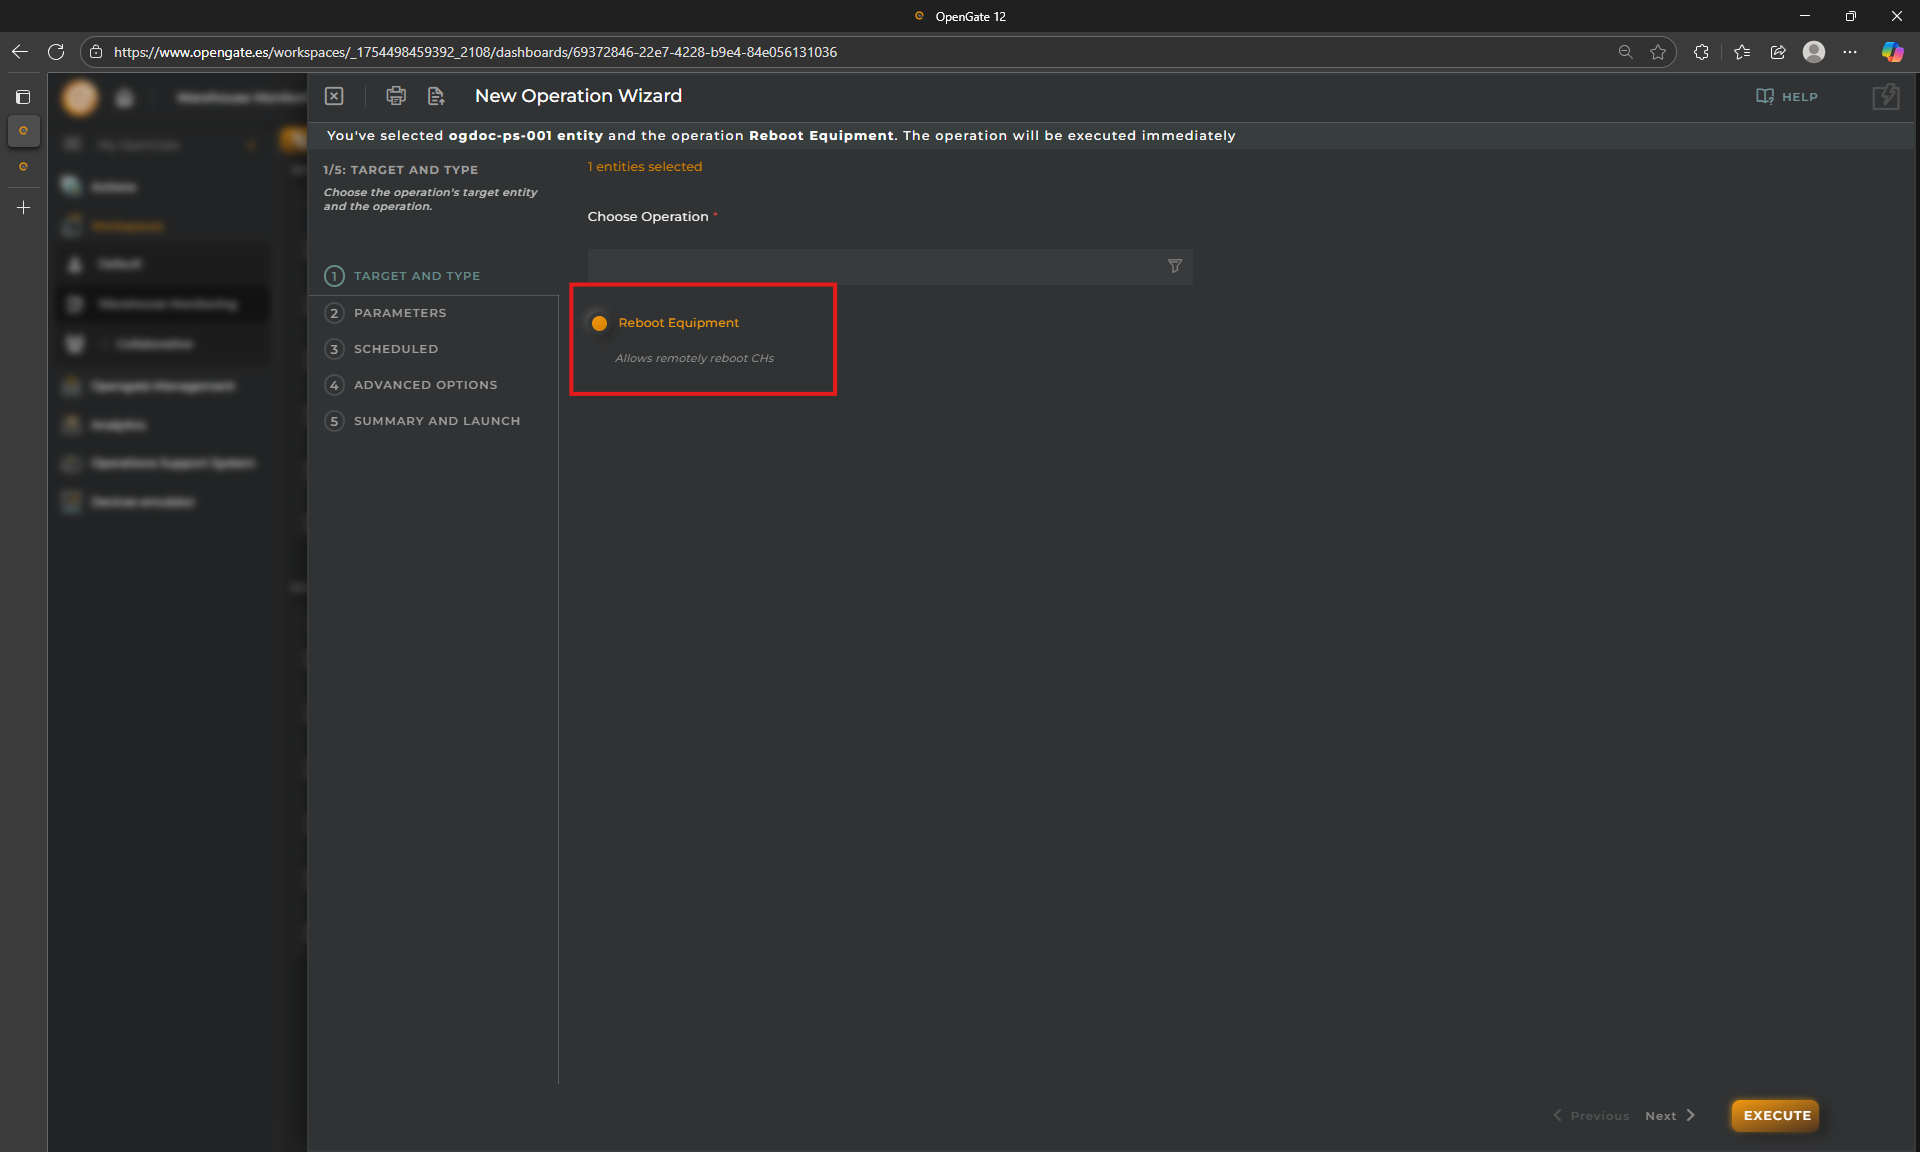
Choose our operation Reboot Equipment and click on “Next” (You can execute it directly, but then the predefined “HARDWARE” reset is send)
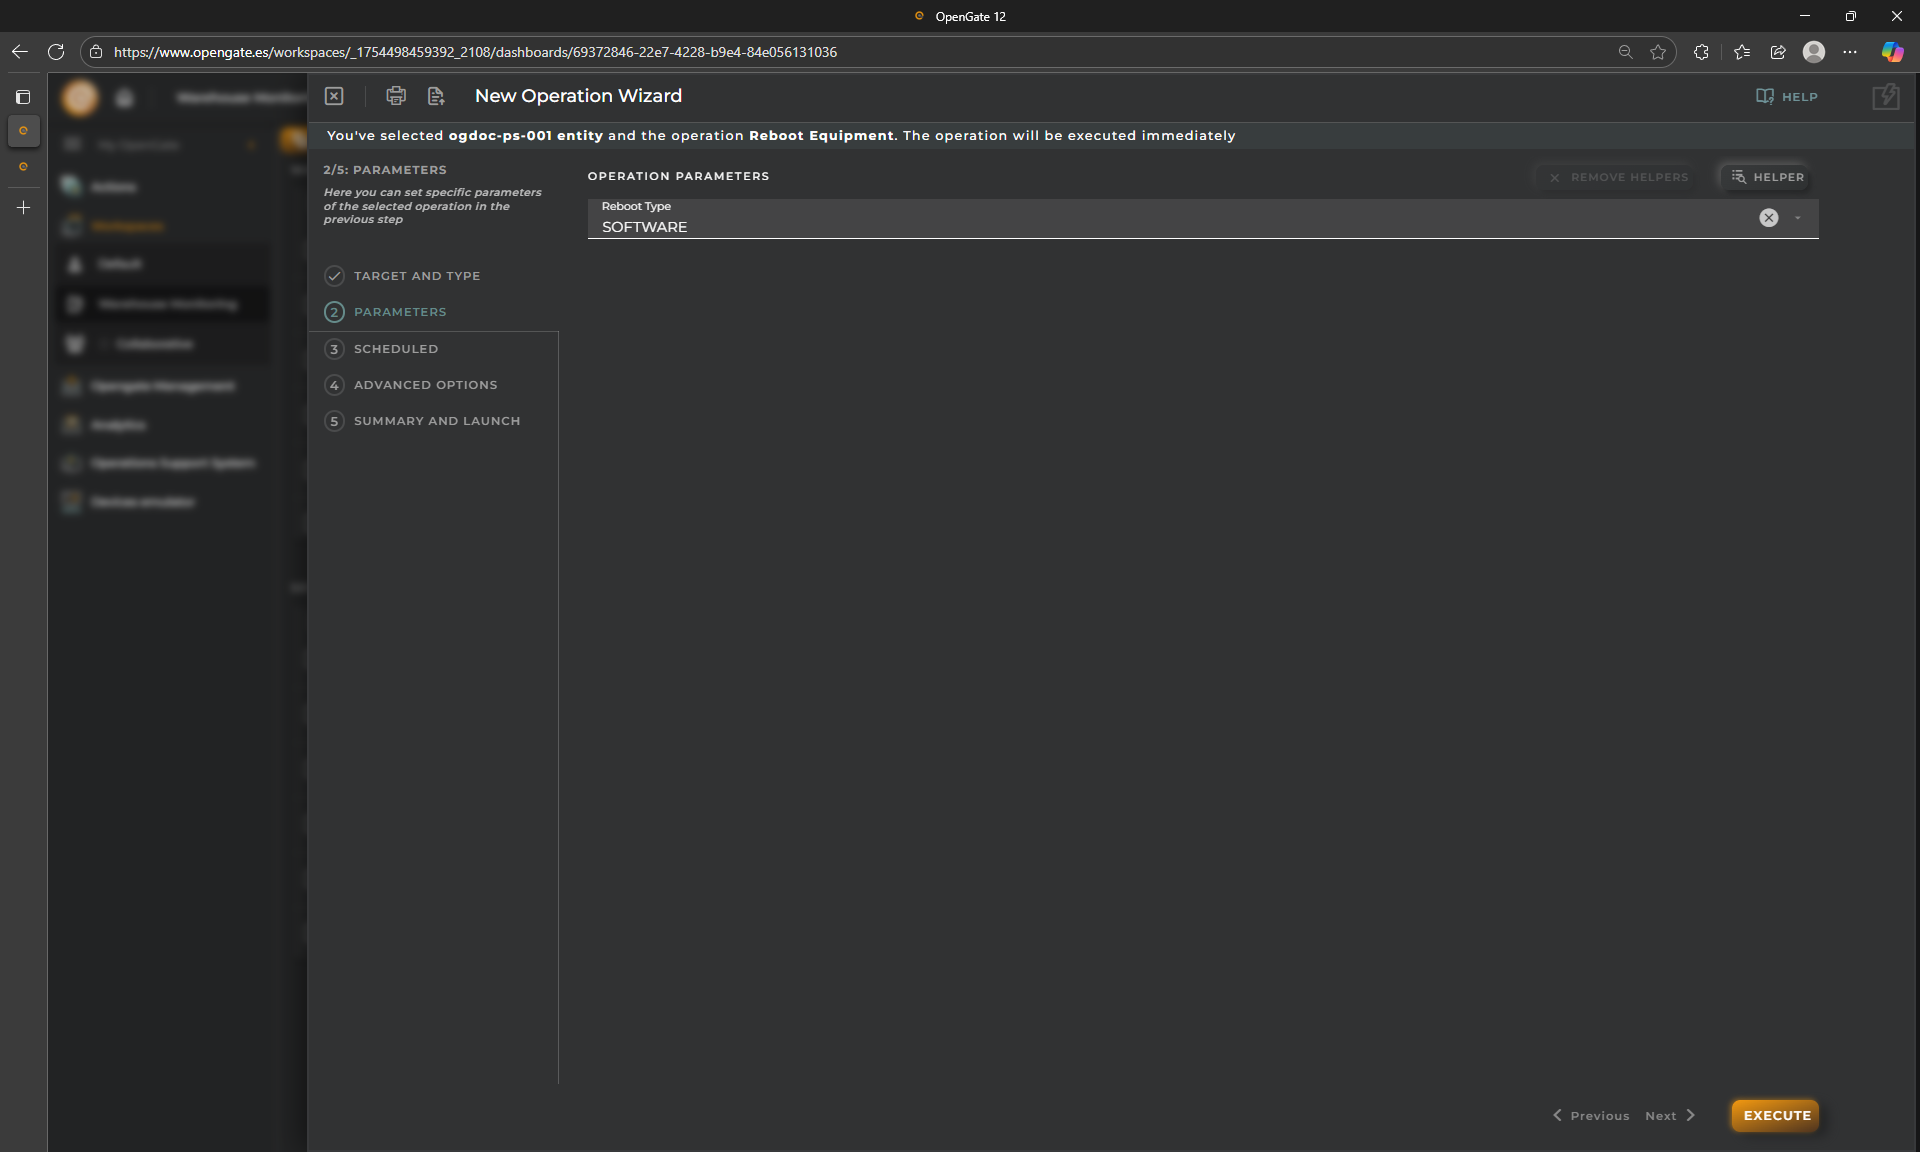
Choose SOFTWARE just to play with the component. There are more additional and powerful options in the wizard (you can review them with “next” button):
SCHEDULED: This allows you to decide when to execute the operation, Now, Later after some minutes or periodically. This last option converts this operation in a “Task” we will not cover this in this tutorial.
ADVANCED OPTIONS: Here you can configure Operation and Execution timeouts for this operation and even adjust optional parameters if the operation accept more.
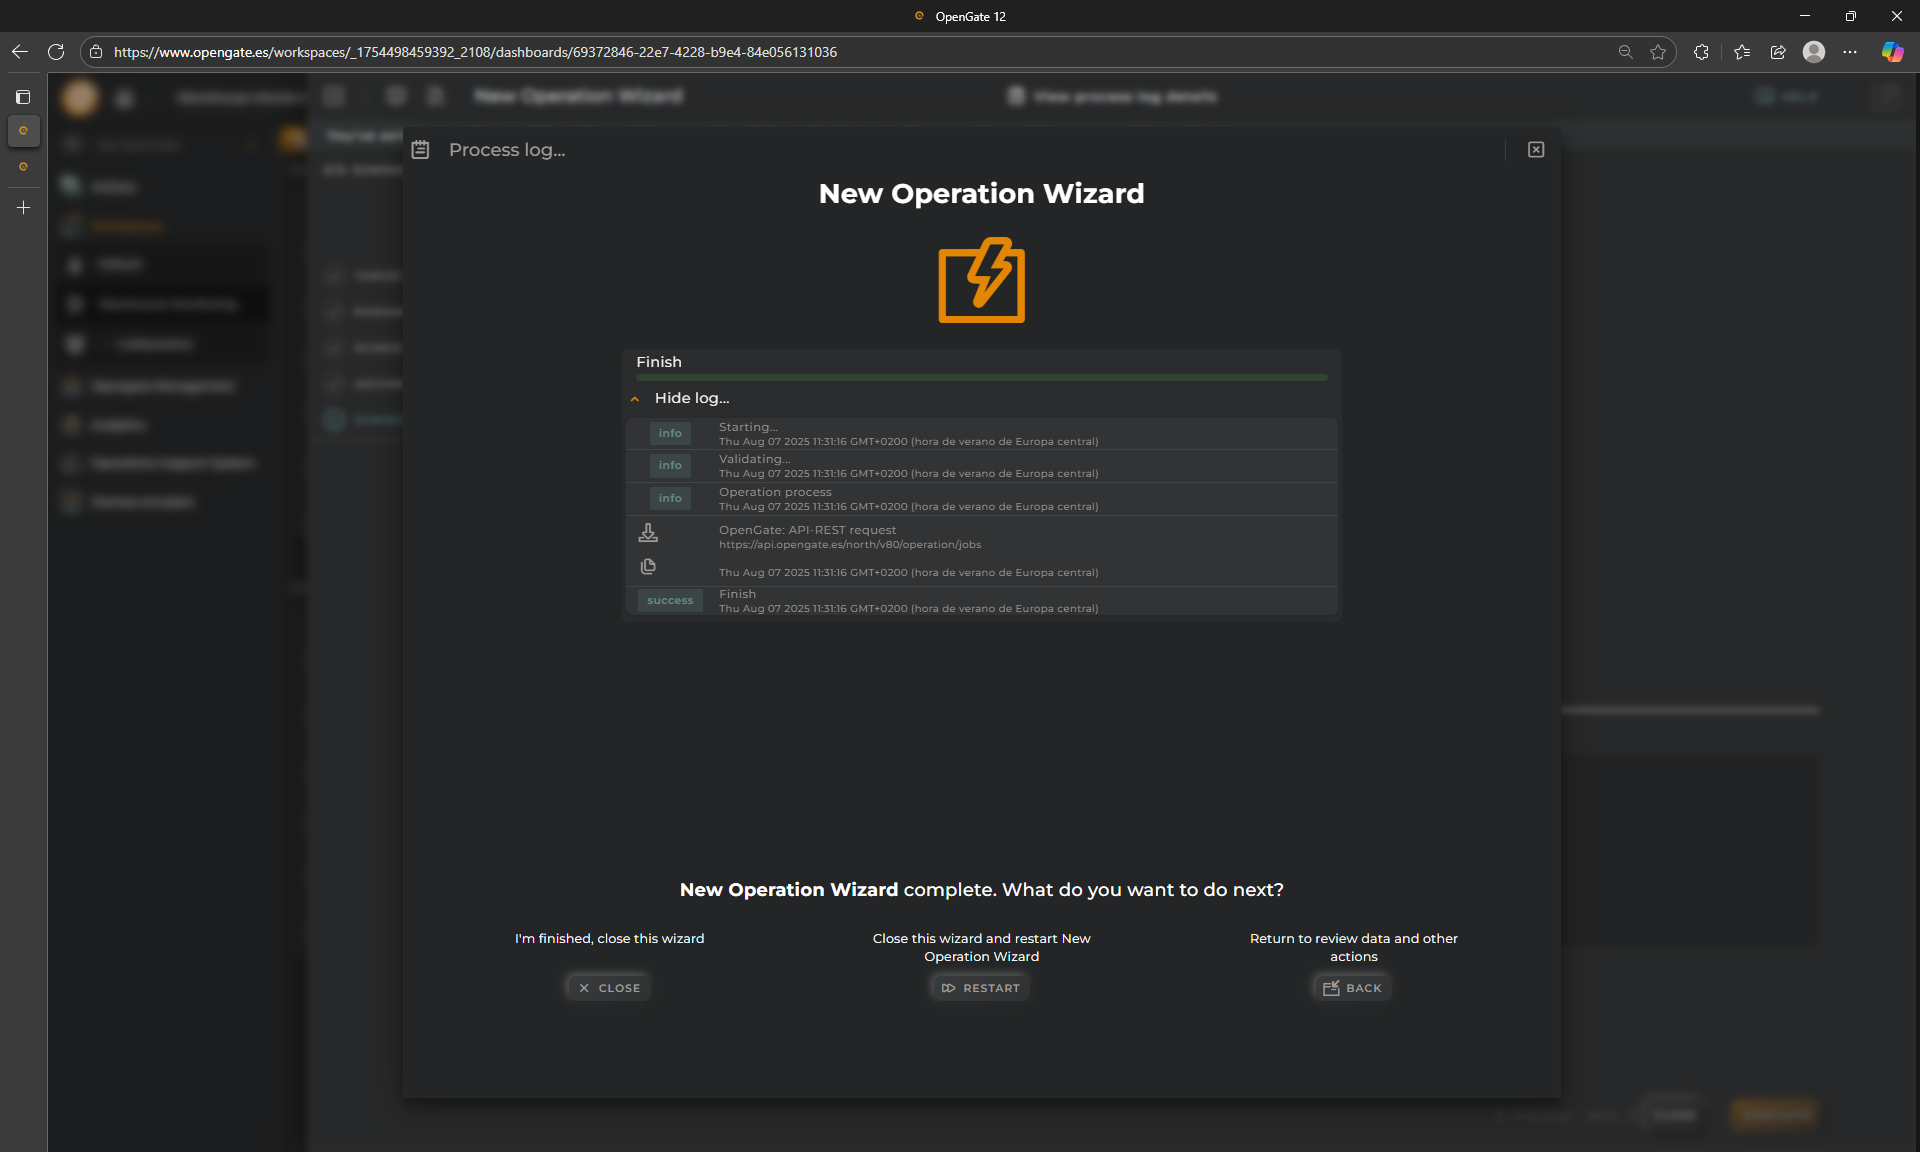
But for this tutorial, we just keep them as default and click on the “EXECUTE”
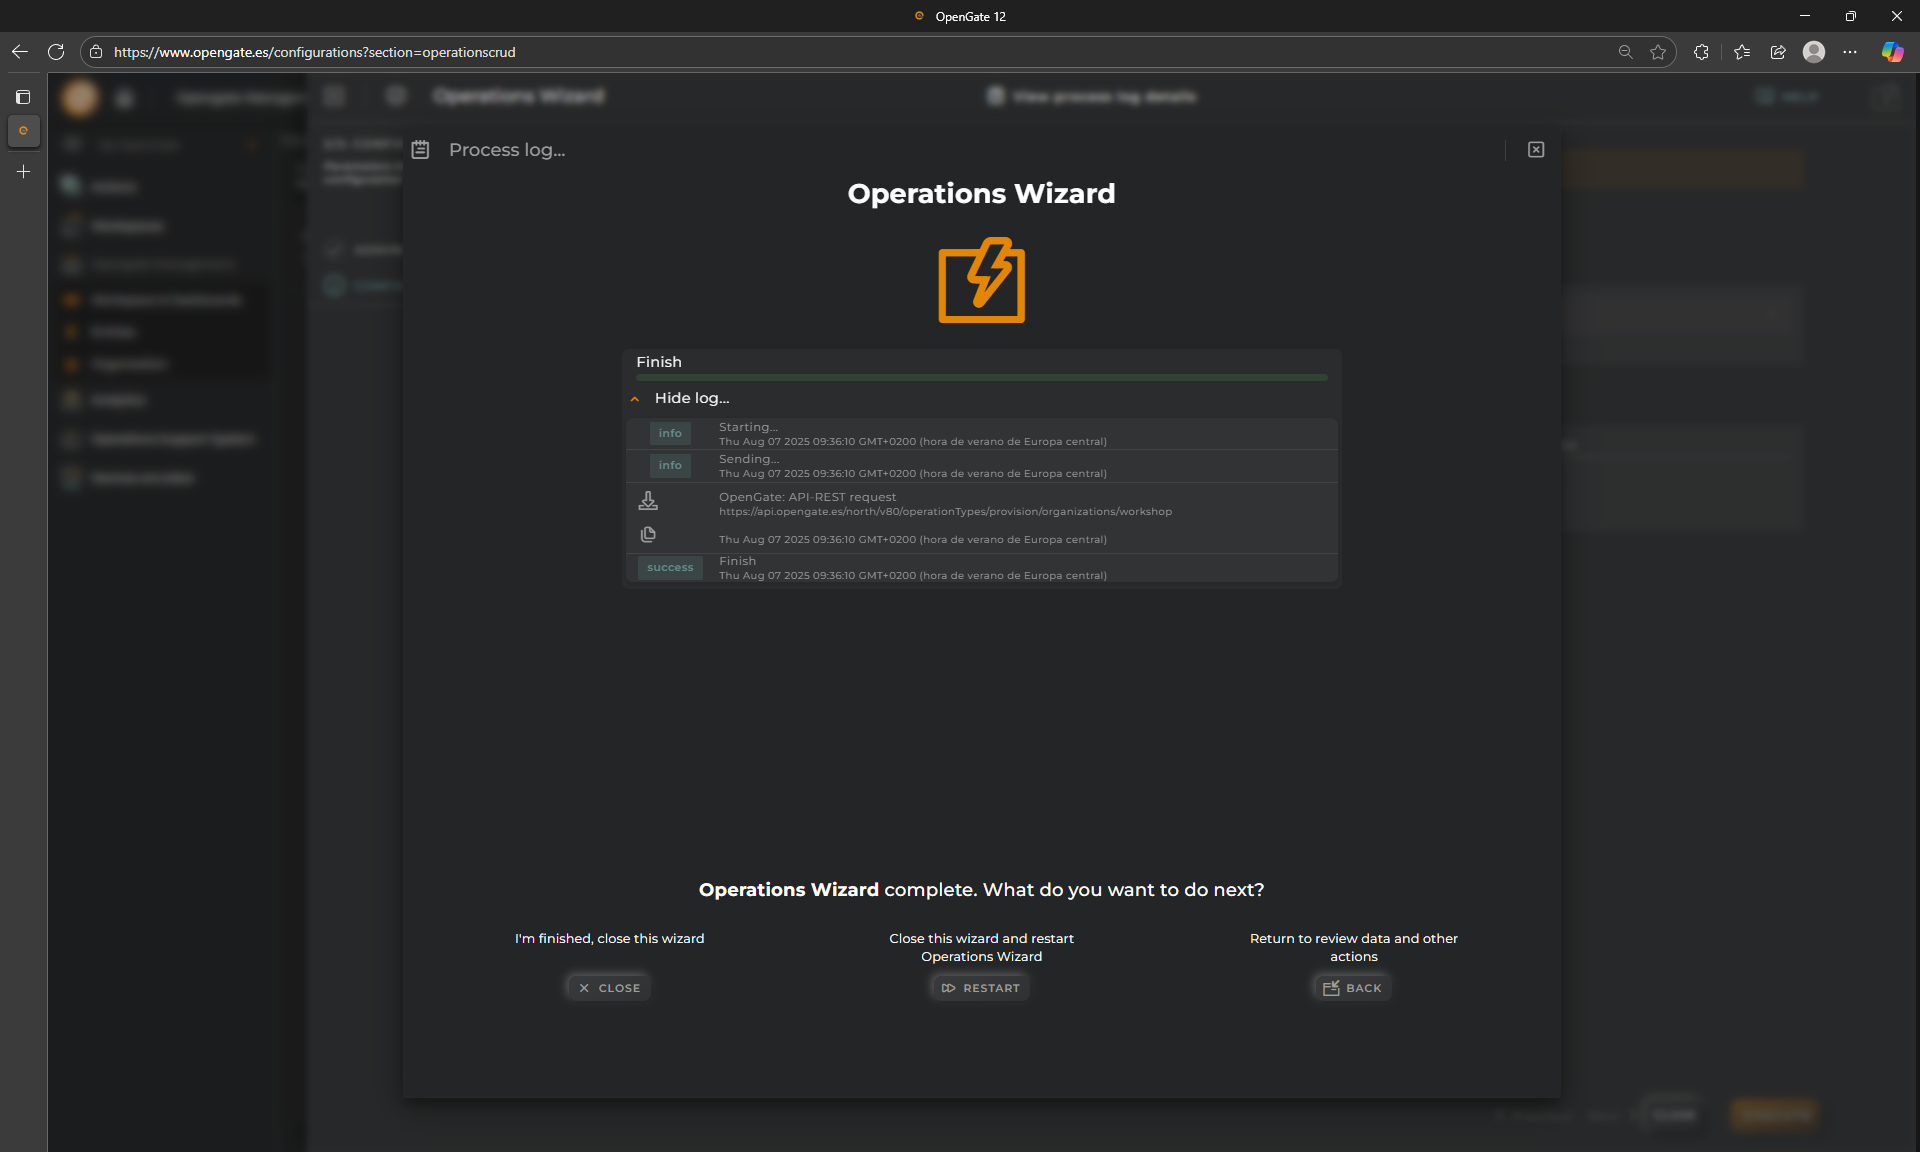
The summary indicates that the operation has been launched
🧪 Monitoring Operation Results
After sending an operation, you can view its execution status and result.
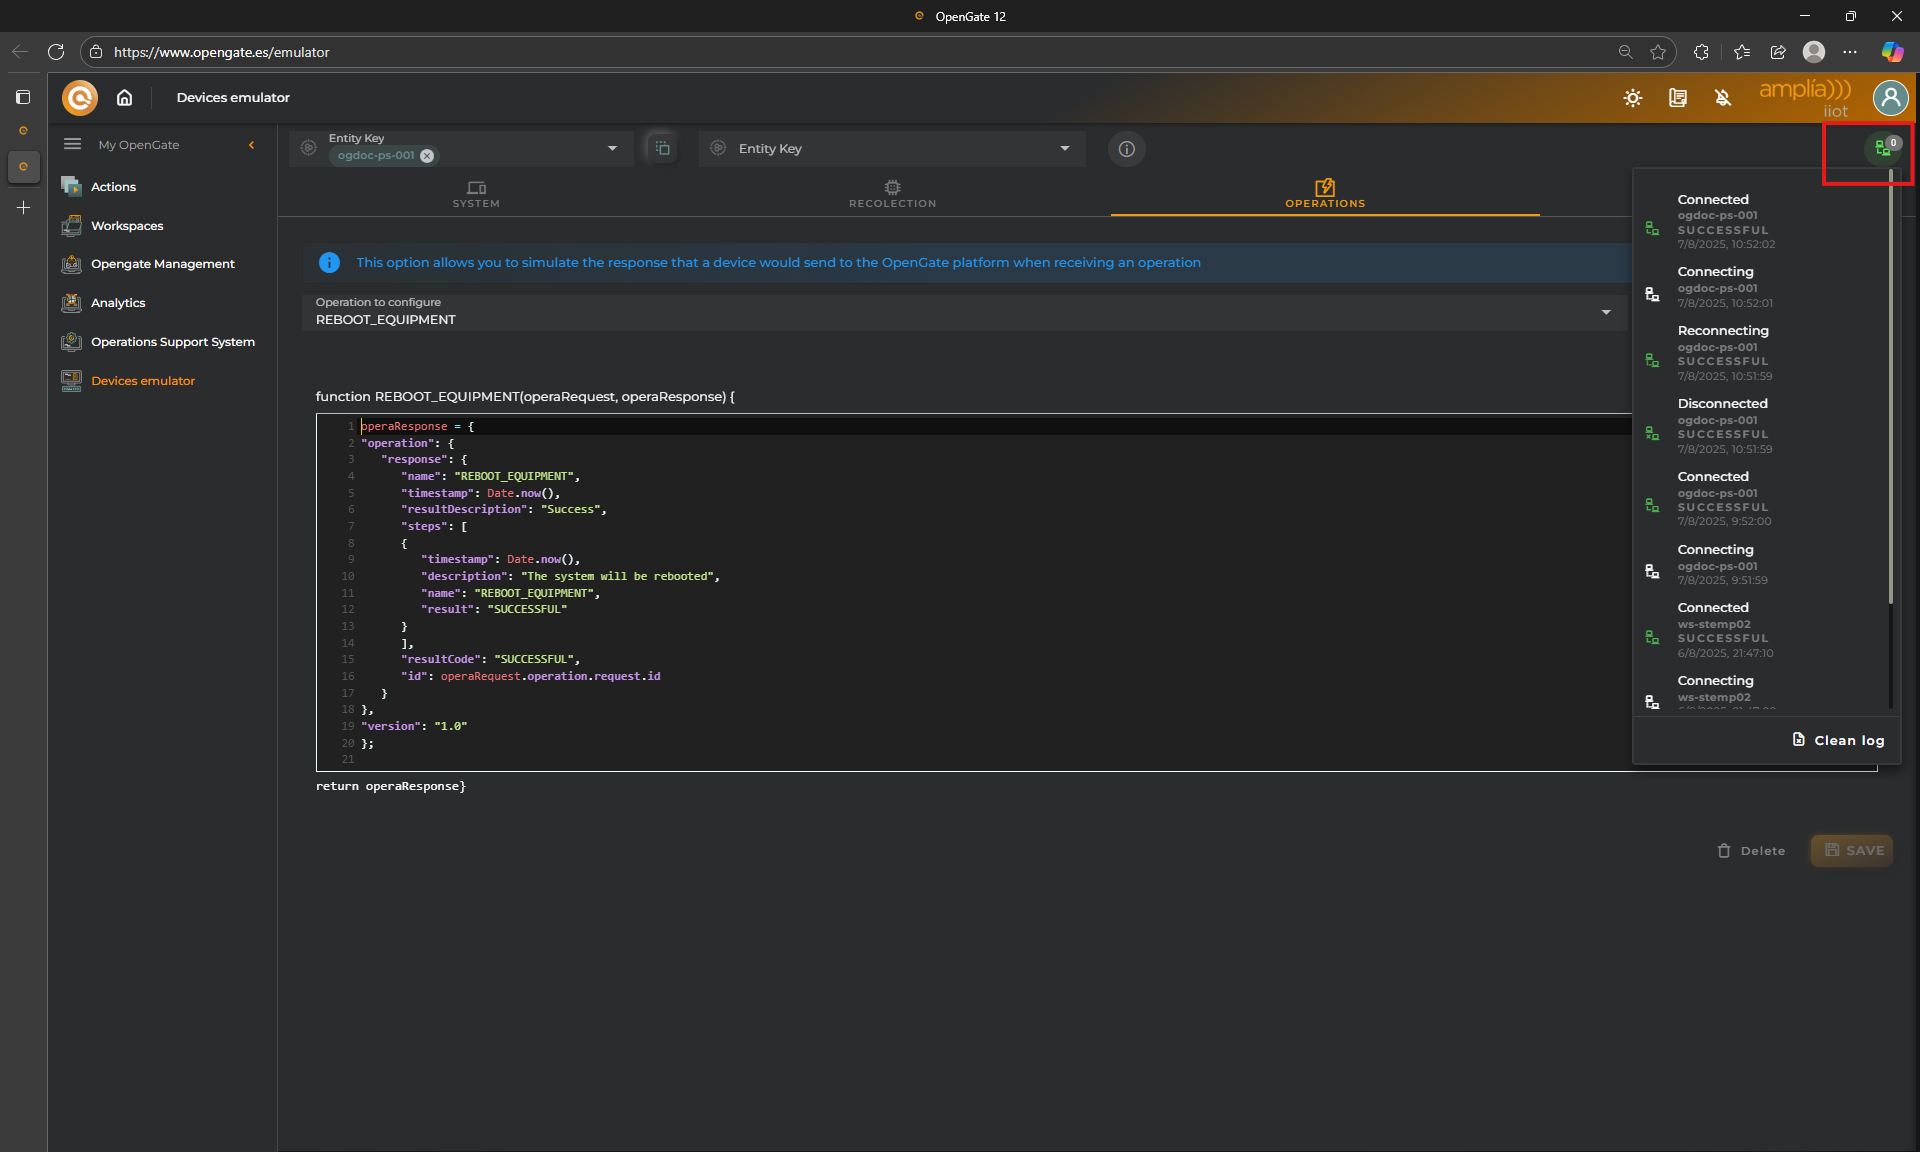
1. Check Opengate Device Emulator log
Here you can see how the operation has been attended and processed by our emulator and the response is sent successfully to OpenGate
This confirms that our operation has been launched from the dashboard and then the device (our Device Emulator) respond to OpenGate.
2. Review in OSS - Operations Support System:
The final step is to check that the response is properly collected in OpenGate, but how?
Well, there is another more tool for you, “Operations Support System”, that allows you to check all your Operation executions. Of course, you can build your own dashboard using operations widgets that you will find on the catalog, but we want to offer you an out-of-the-box solution for operations management.
Go to the Operations Support System section of OpenGate, open in new window.
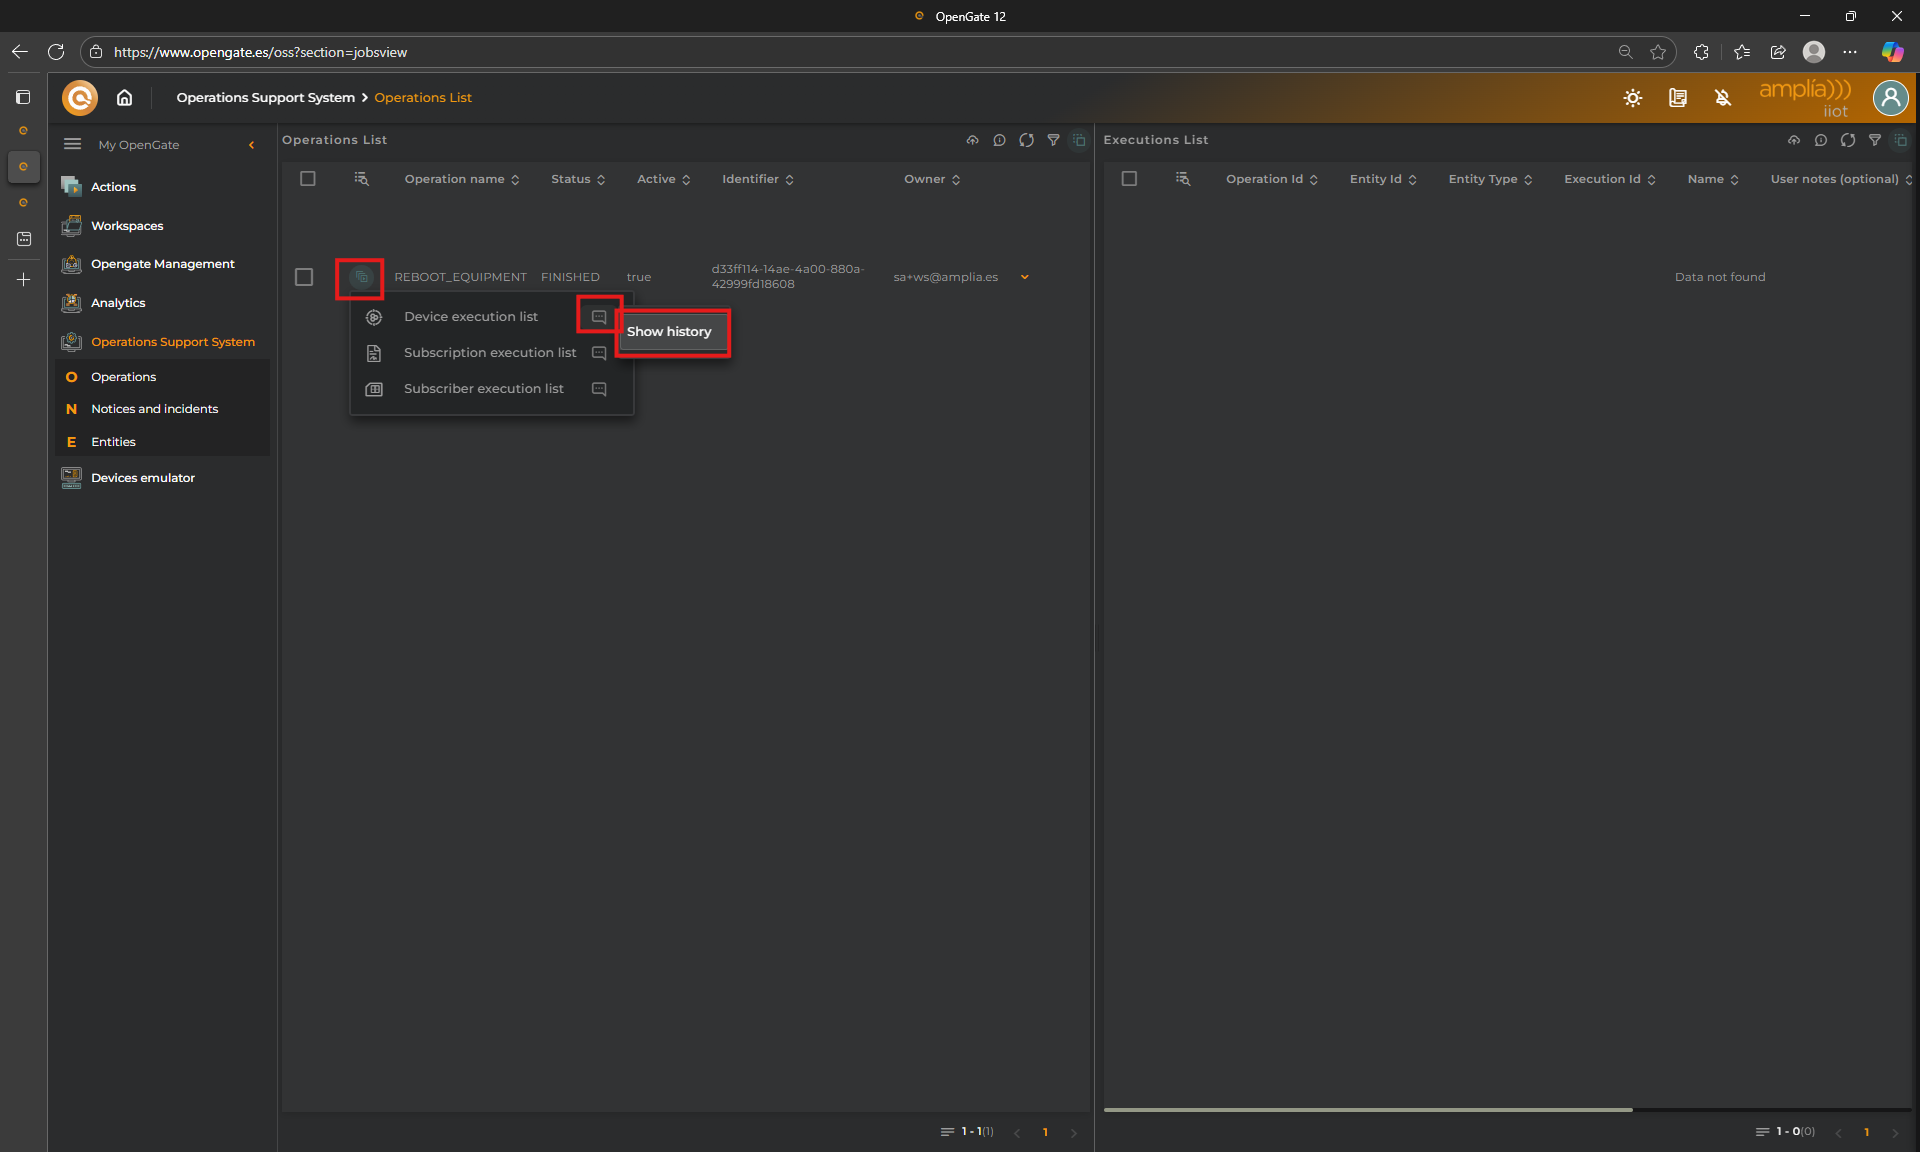
Click on “Operations List” and locate our operation (so easy, you should just have one…).
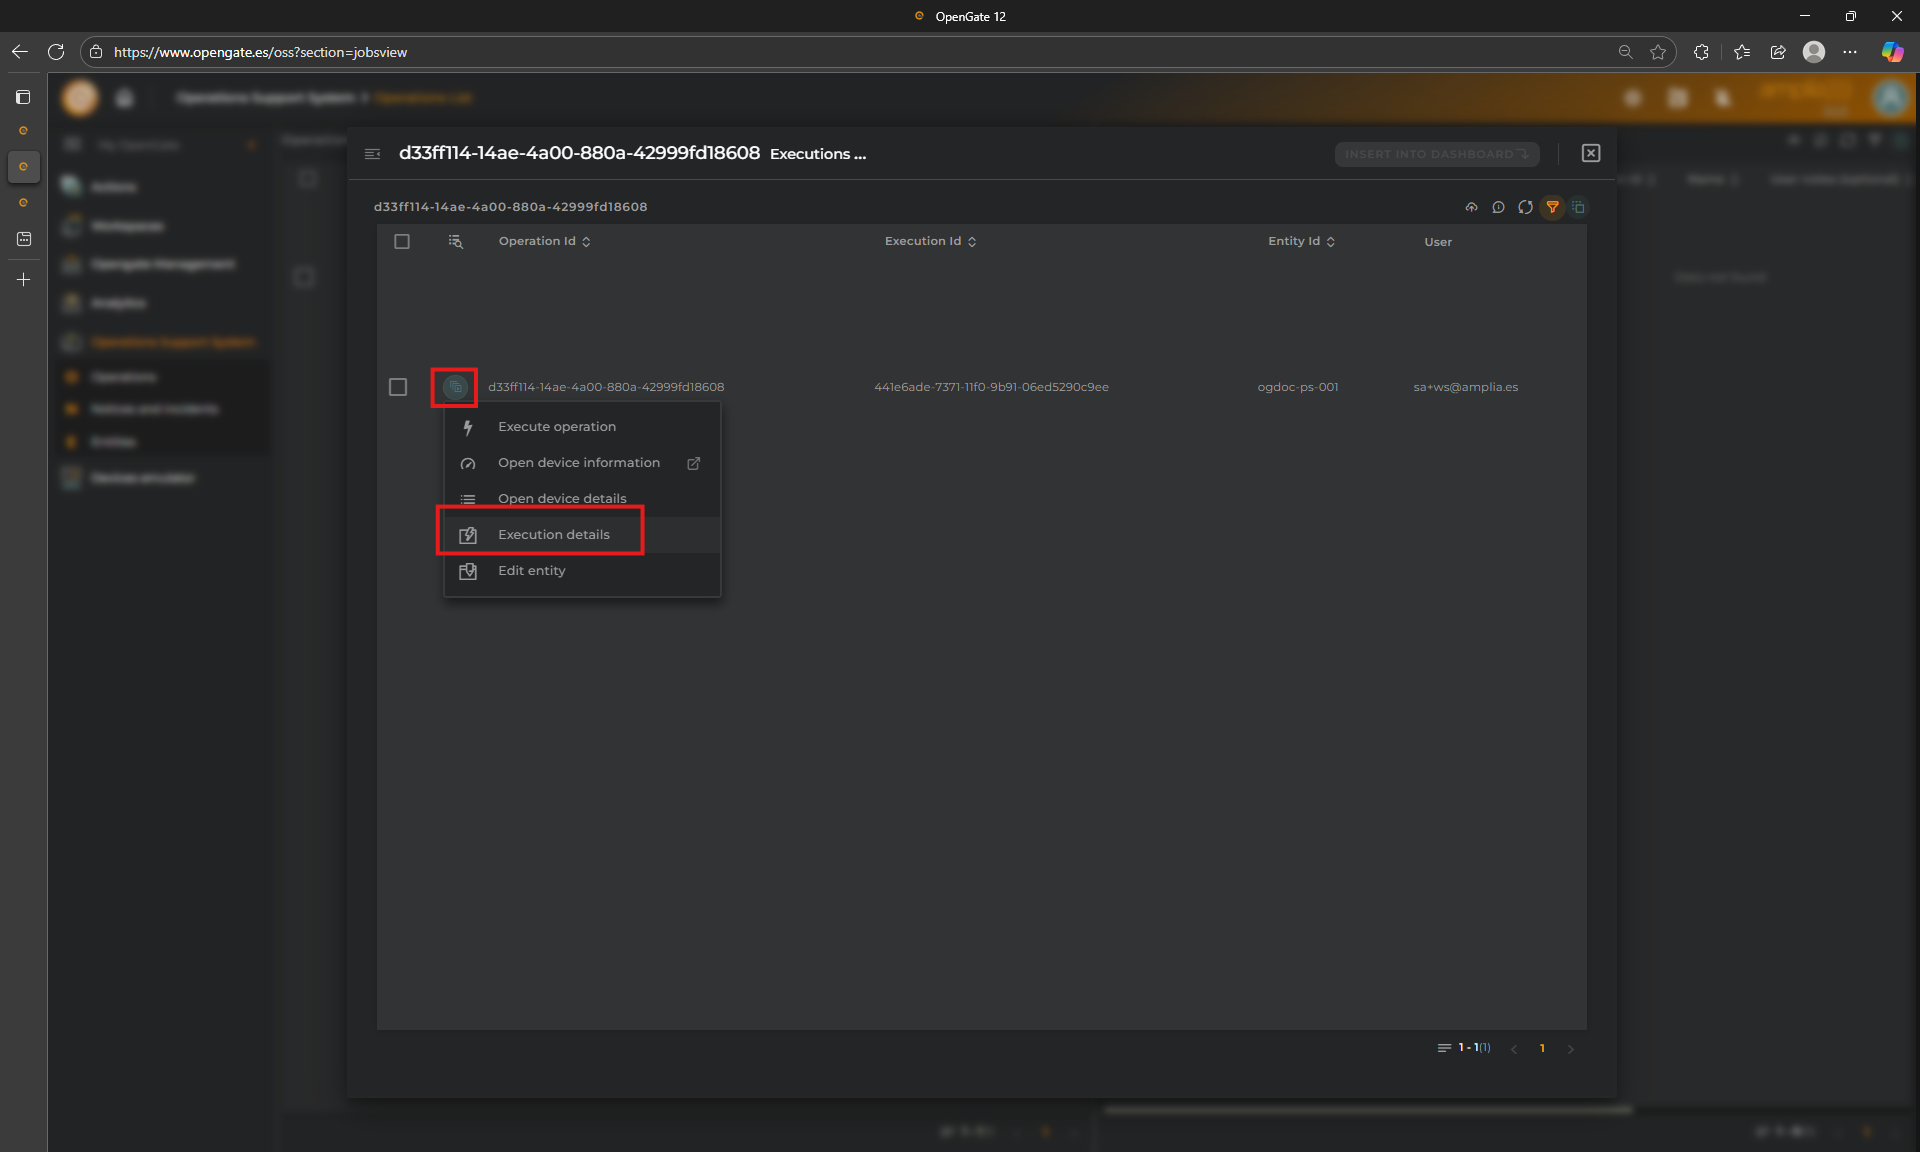
Because the operation is finished, Click on the menu and Device Execution List - Show history.
Click on Execution Details to inspect the execution traceability and result
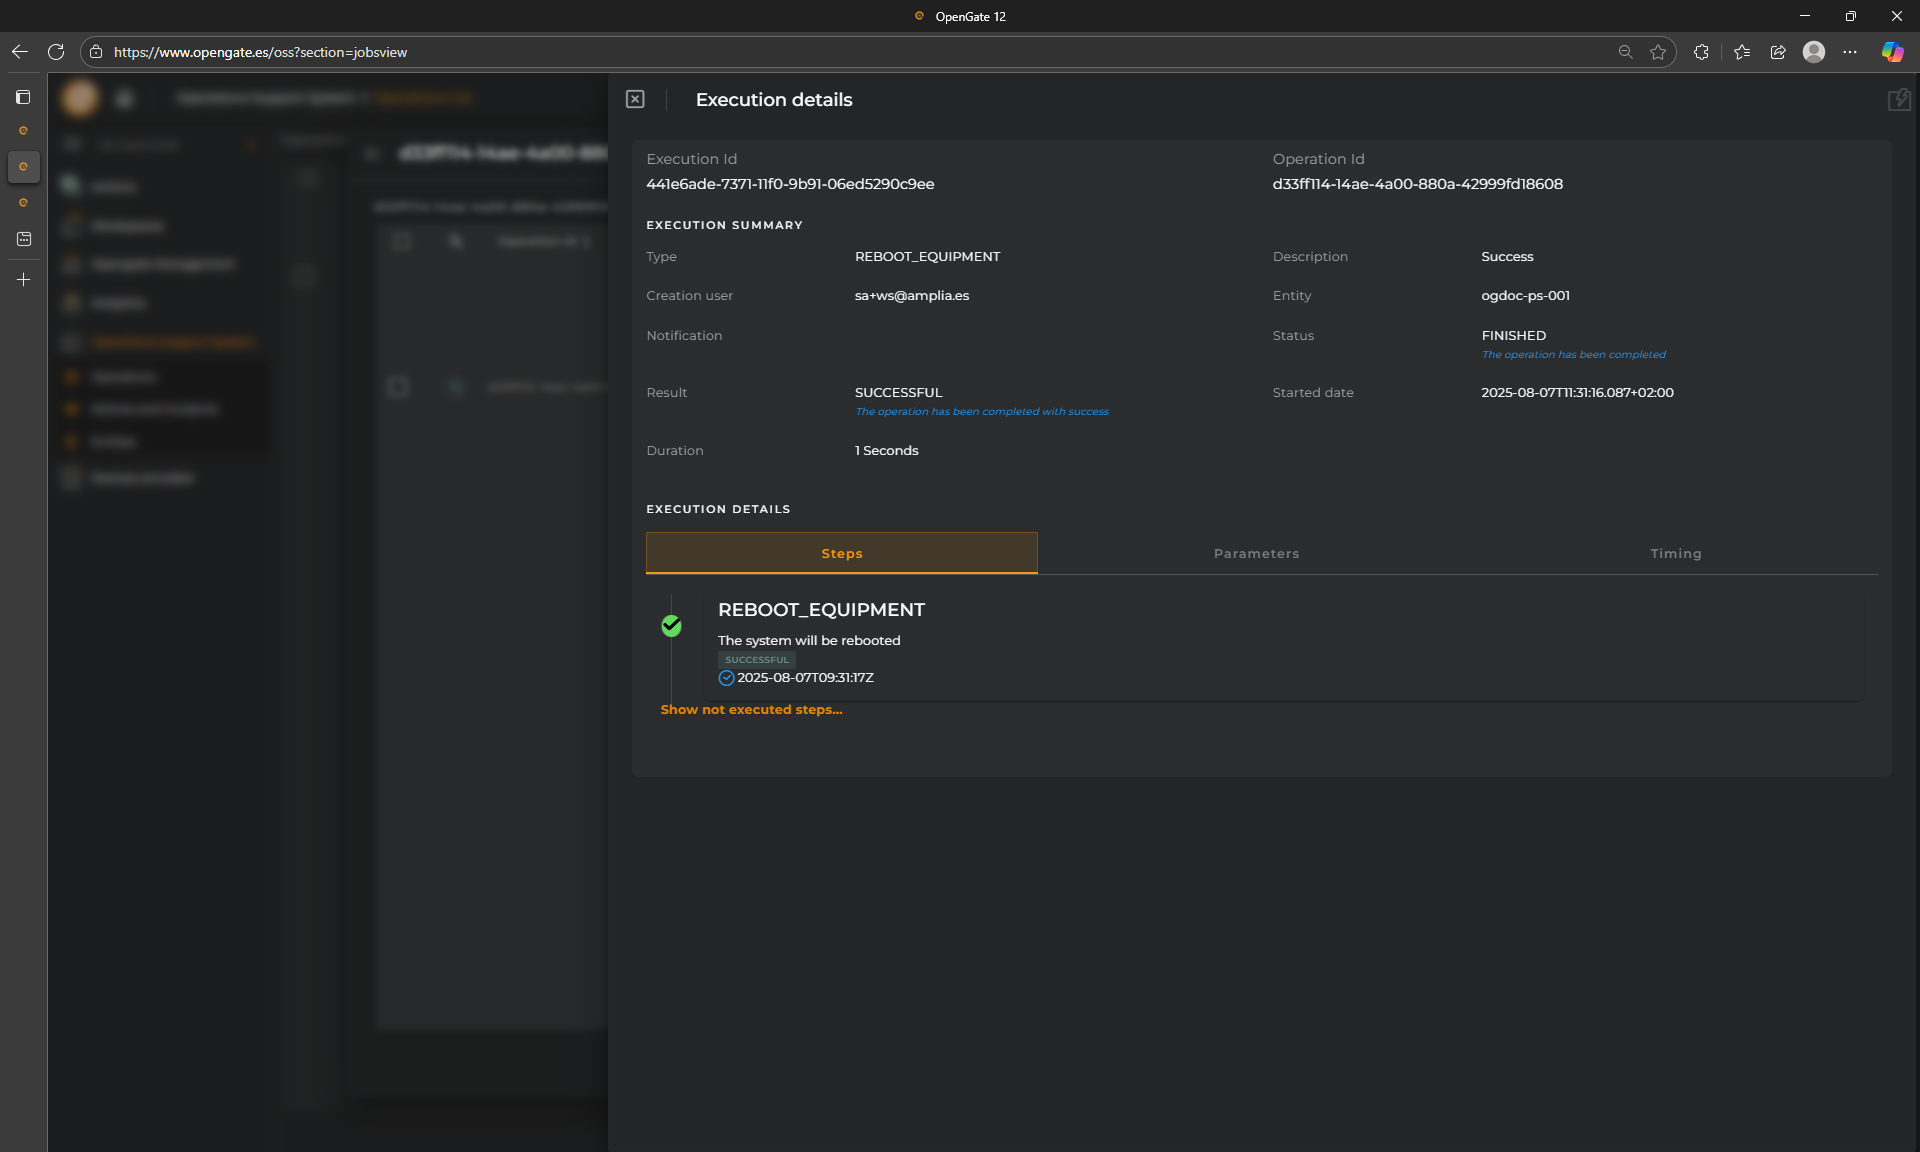
Let’s review the Execution Details panel
From this panel you can check the summary result of the execution. Look the description “Success” that we coding in our OpenGate Device Emulator
Additionally, You can review the Steps tab, to check the times and result (remember that this operation only has one step)
Parameters tab shows what the user send to the device, we selected “software” during the wizard.
The last tab, Timing, shows a timeline with the execution times
💡 What’s Next?
This was a basic operation and response flow, but OpenGate supports much more. You can:
Send configuration updates to your devices
Trigger actuators (e.g., open/close valves)
Perform FOTA (Firmware Over-The-Air) upgrades
Or any other action your devices support!
Operations are a powerful way to turn your dashboards into control centers. Ready to build your next one?
9. Easy mode rules
🚦 Easy Mode Rules in OpenGate
Welcome to one of the most powerful features in OpenGate: the Rules Engine. This system allows you to automate responses based on incoming data, enabling smarter and more efficient workflows across your IoT ecosystem.
There are two rule-building modes available:
Easy Mode: A simplified, intuitive interface for quick rule creation. This allows you to create rules using an assisted interface.
Advanced Mode: A flexible editor for complex logic and custom flows. Use the power of JavaScript to configure your rule.
In this tutorial, we’ll focus on Easy Mode, using a practical example from our warehouse environment.
🛠️ Creating an Easy Rule
for this tutorial, we will consider that we want to monitor the temperature levels of our warehouse.
We’ll create a rule that triggers an alarm when the temperature reaches 25°C or more. The alarm message will be: “It’s hot!”
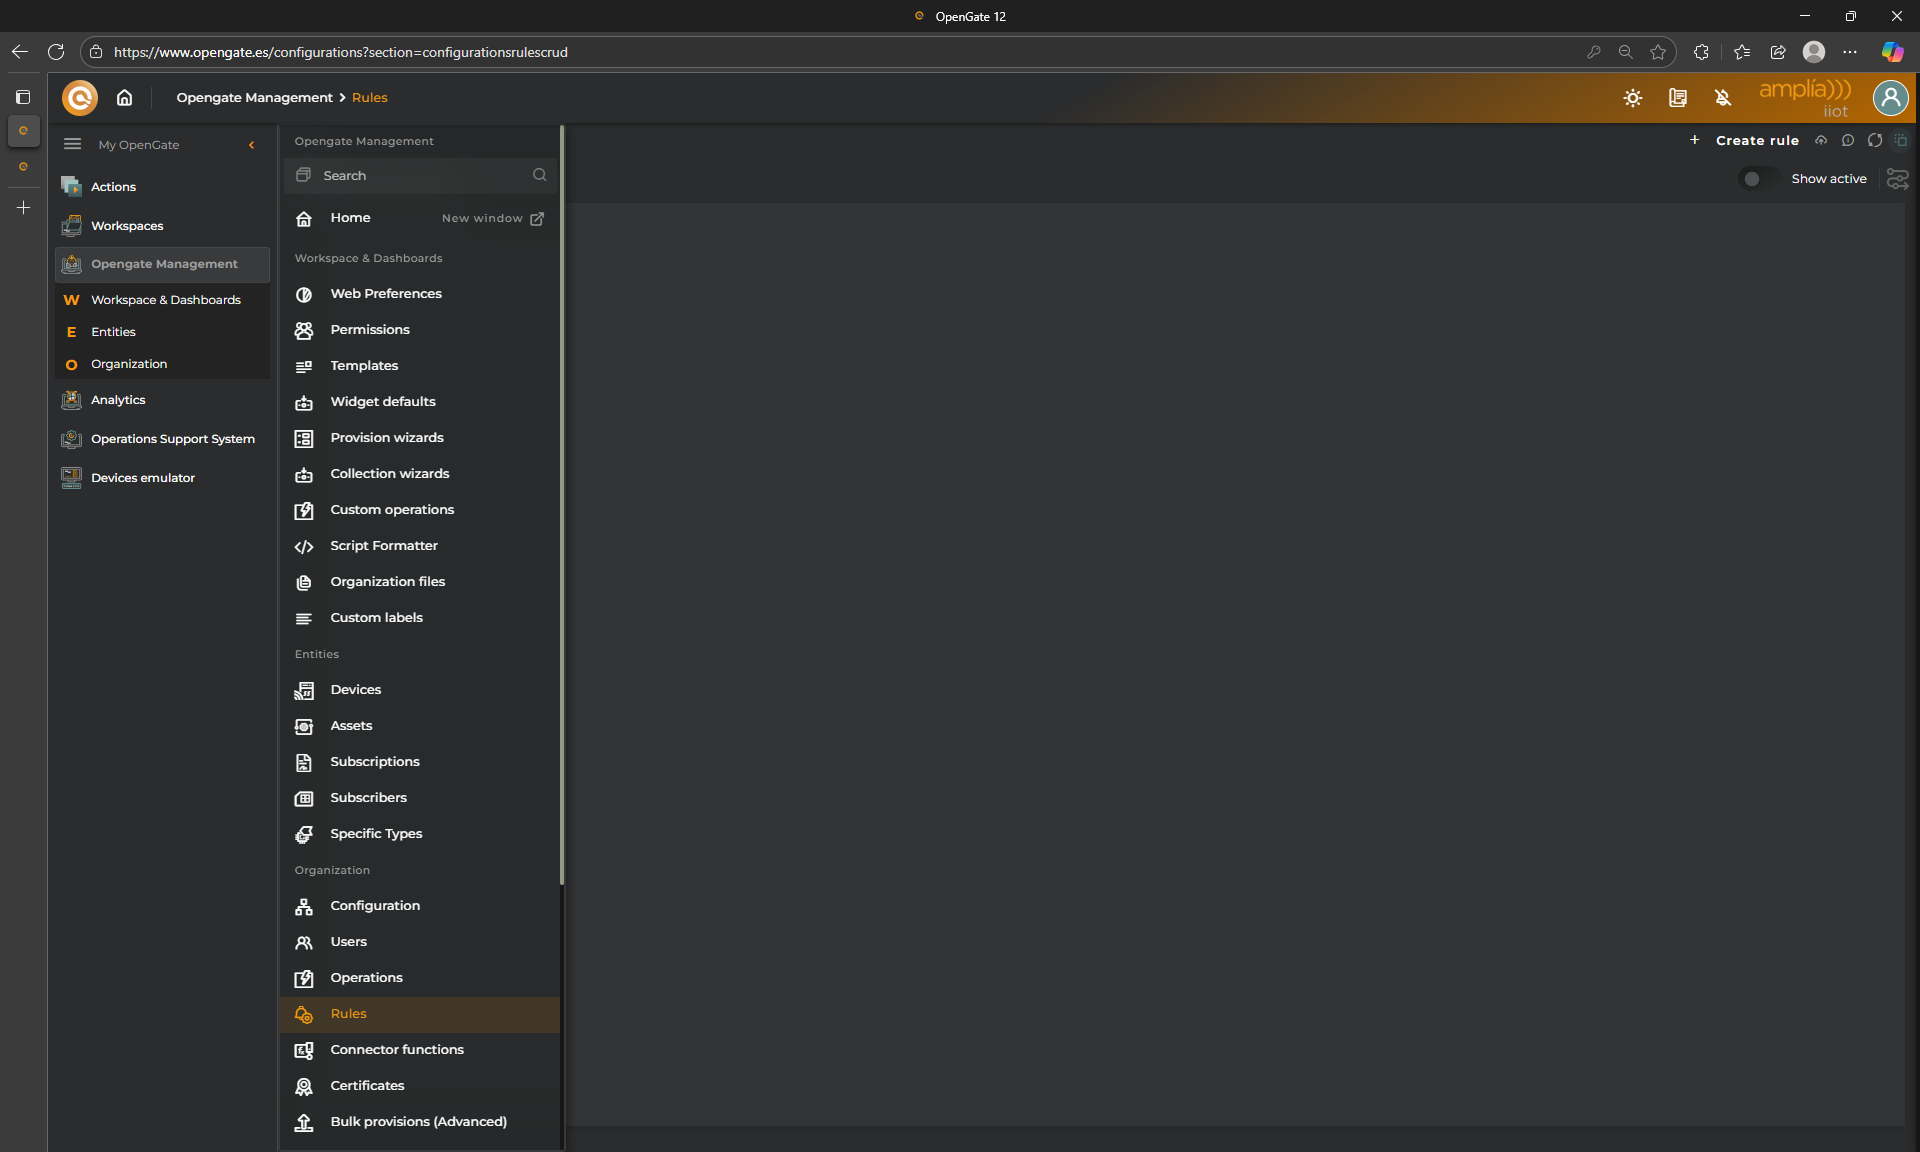
Go to OpenGate Management > Rules and click Create new rule
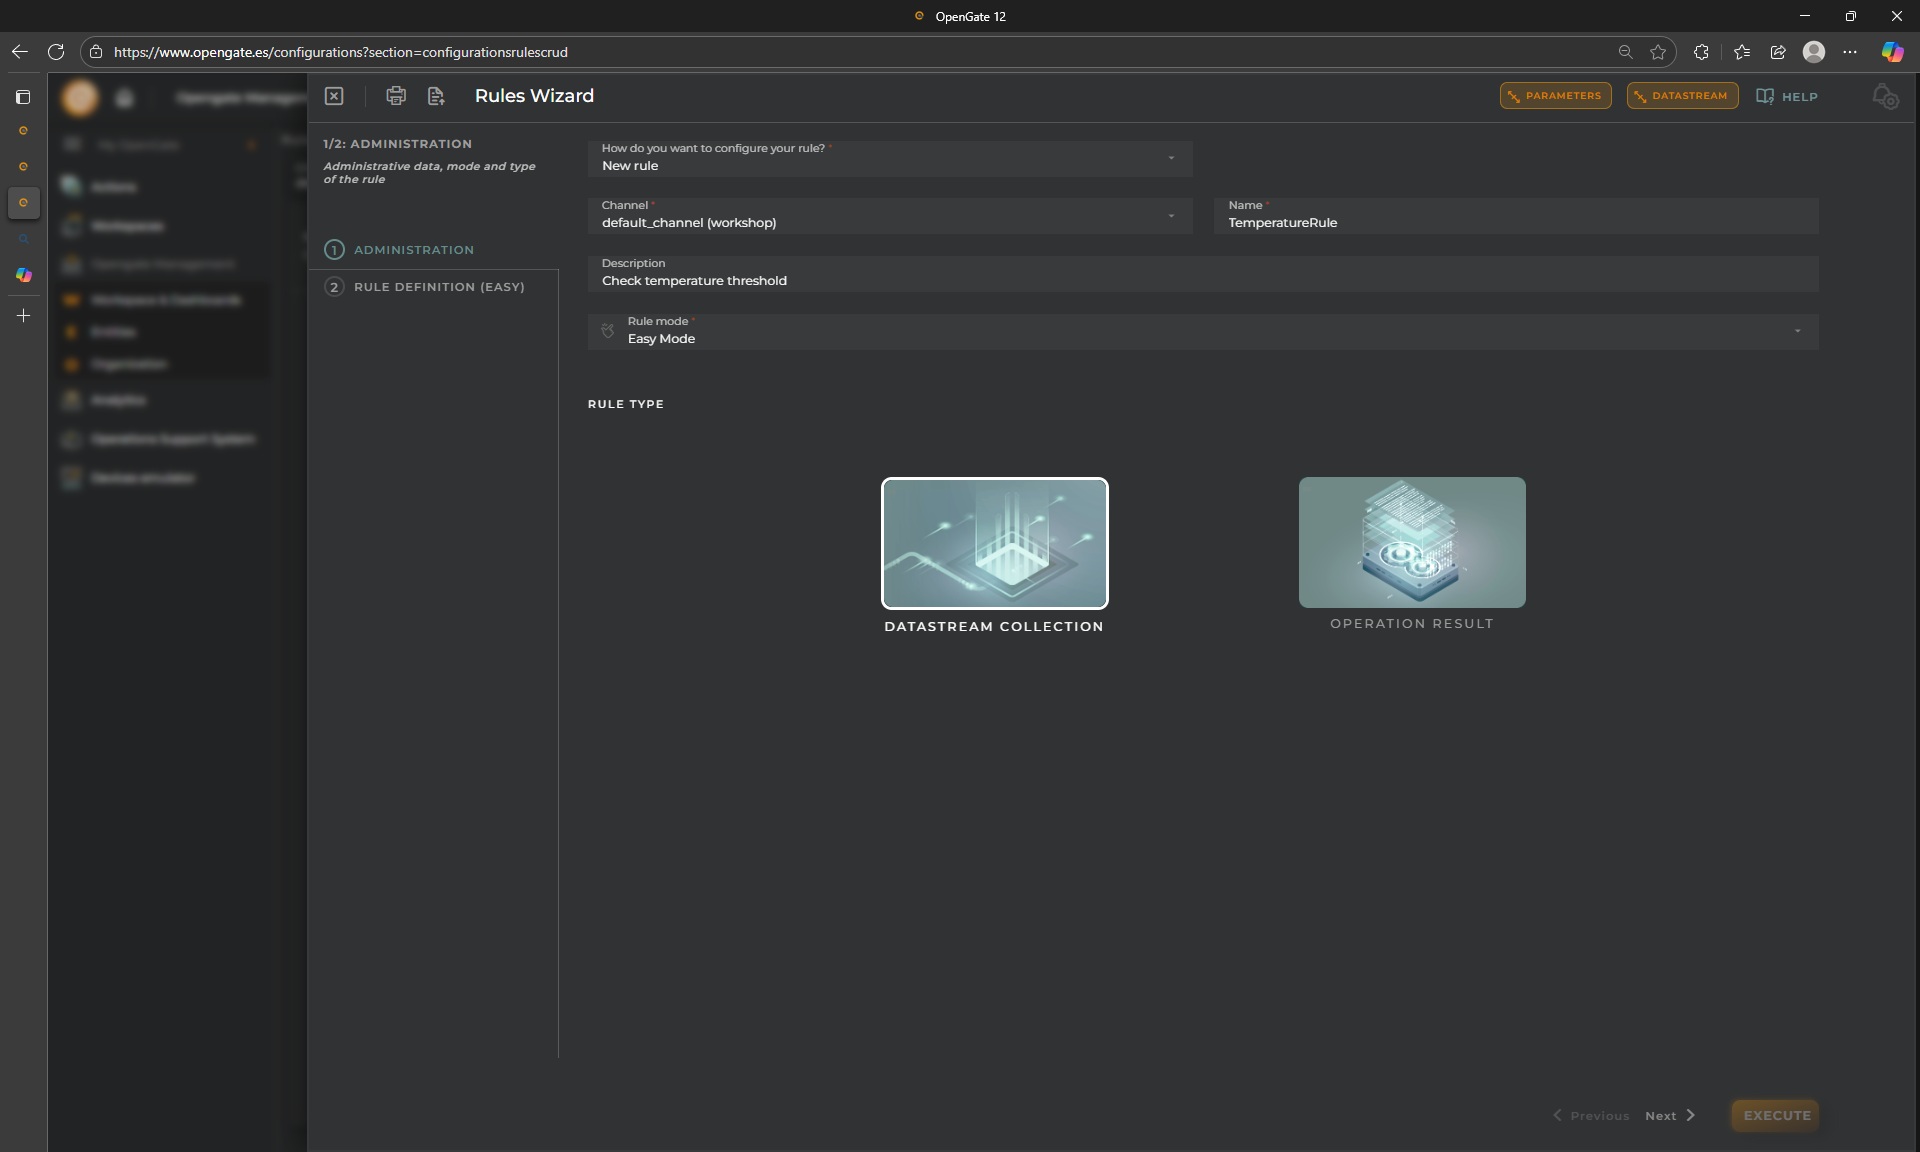
STEP 1: Rule Administration data
This is the first step of the Rules wizard. As the other wizards that we’ve achieve together, the first step allows you to set the basic info of the rule
New Rule: We will choose “NEW RULE” but as with the Operations, OpenGate offers you the possibility to clone an existing rule or use one from the product catalog. Because is our first rule, lets configure a new one together. Choose New Rule
Name: Use TemperatureRule
Description: It is optional but use Check temperature threshold
Rule mode: for this tutorial, we will use Easy Mode
Rule Type: We could configure rules to check “Operation Result” when are collected into de platform after perform any OpenGate Operation. For this tutorial, we are configuring a “Datastream Colection” rule. We want to check the received events. Choose DATASTREAM COLLECTION
STEP 2: Rule Definition
Here we are goint to define some things:
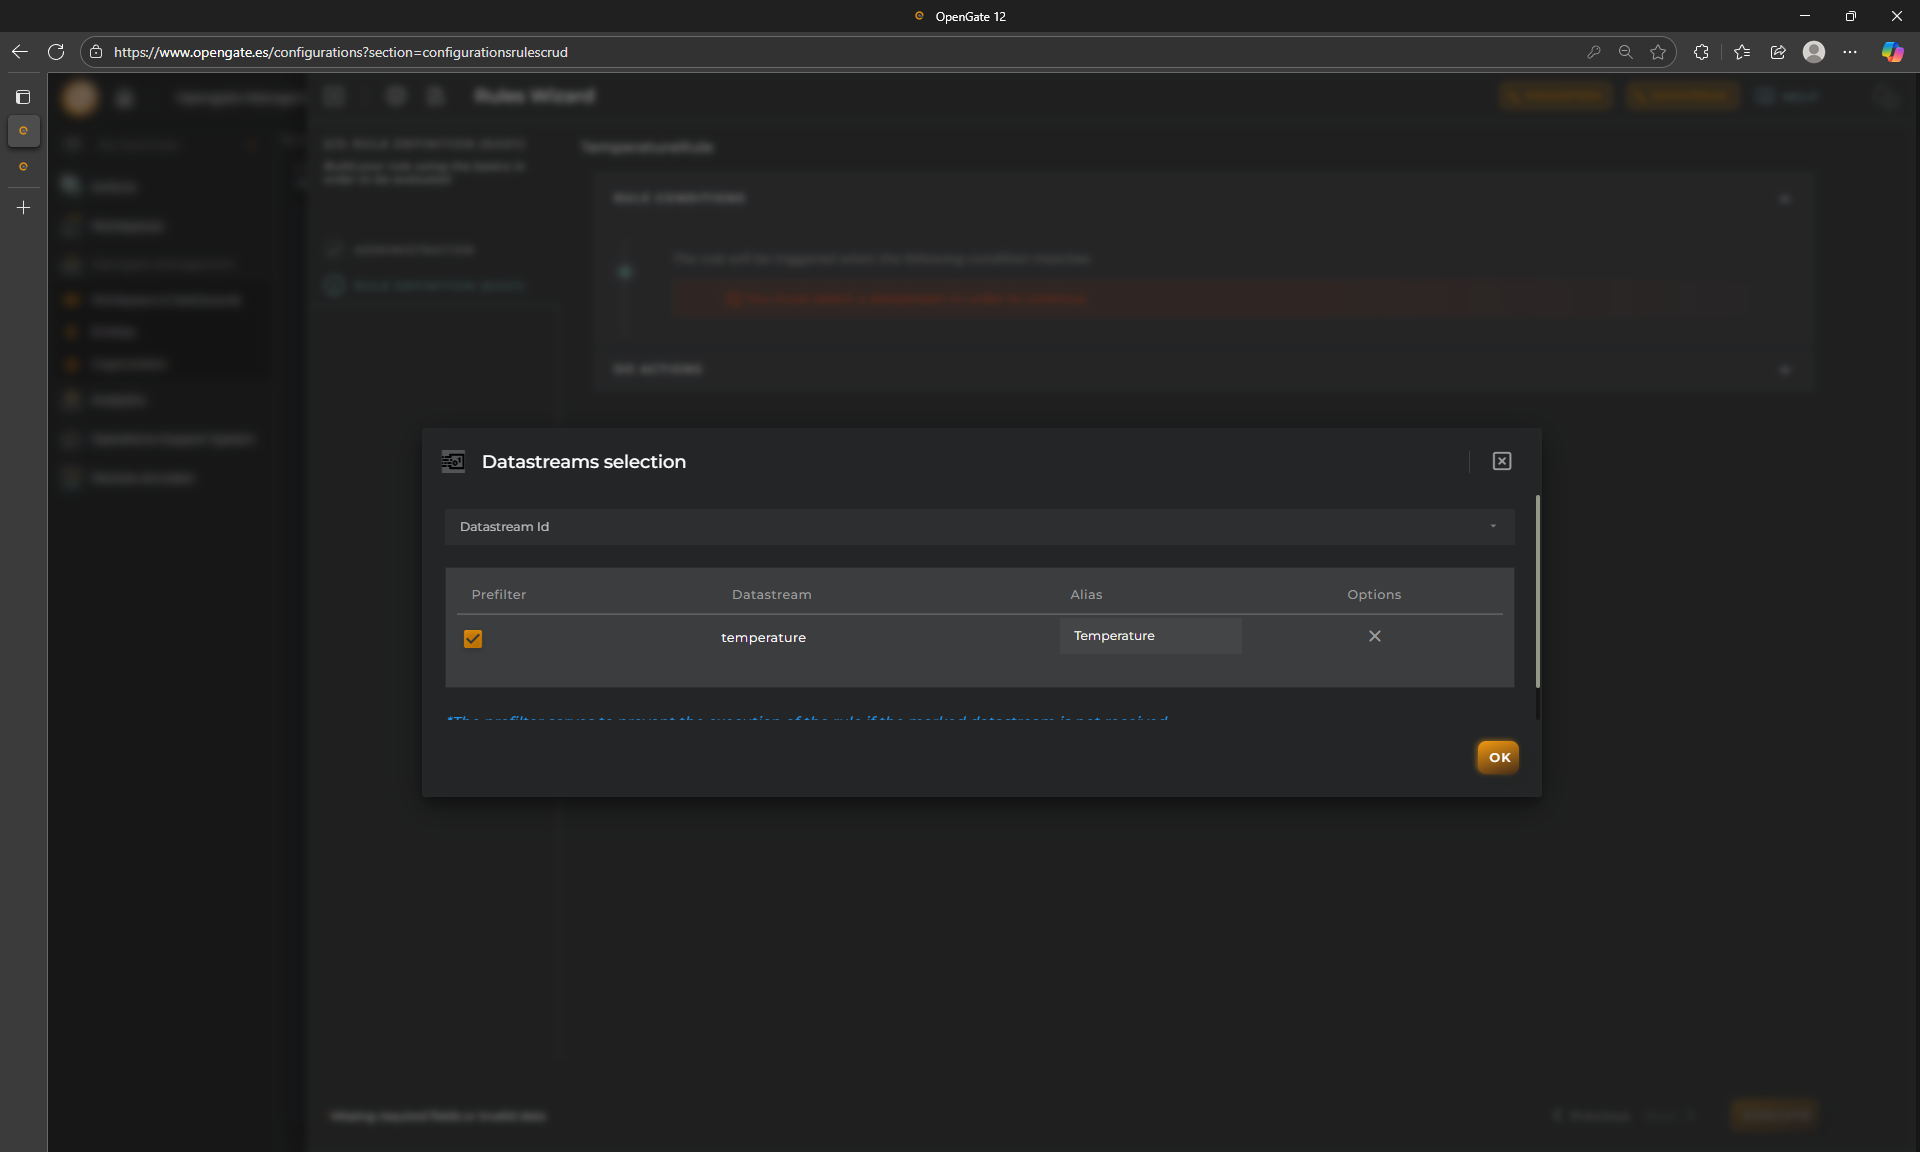
1. DATASTREAMS:
We need to define the datastreams that we use in the rule. Do you see the two buttons on the top part of the wizard?
We will use them to configure our rule basis
Choose temperature from our “warehose” datamodel and check the Prefilter option.
This rule only triggers when this datastream is received in any entity collection envent. This increase performance.
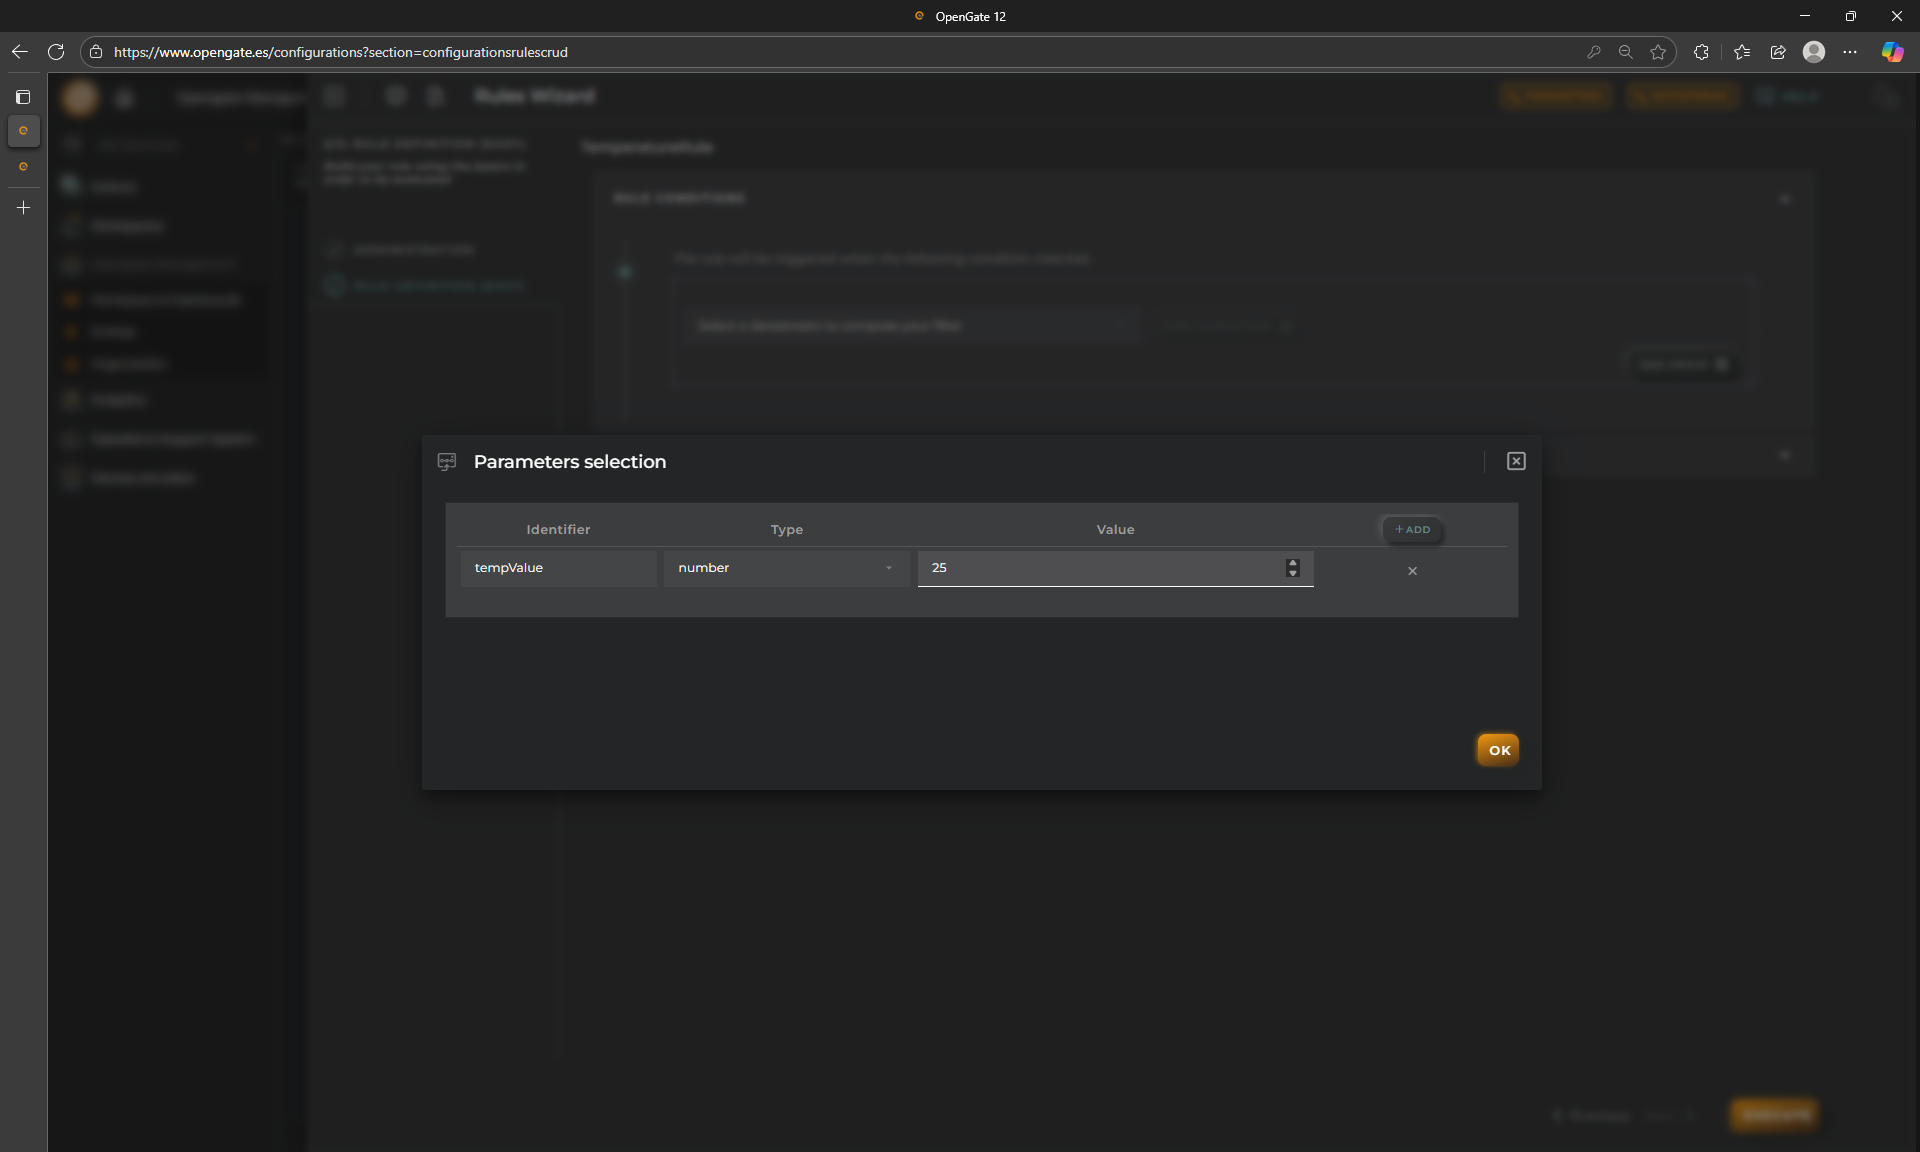
2. PARAMETERS:
This allows you to parametrize de values o the rule. If your rule is so complex, it is usefull to have all parameters together to check or edit them. This is not mandatory, but recommended.
3. RULE CONDITIONS:
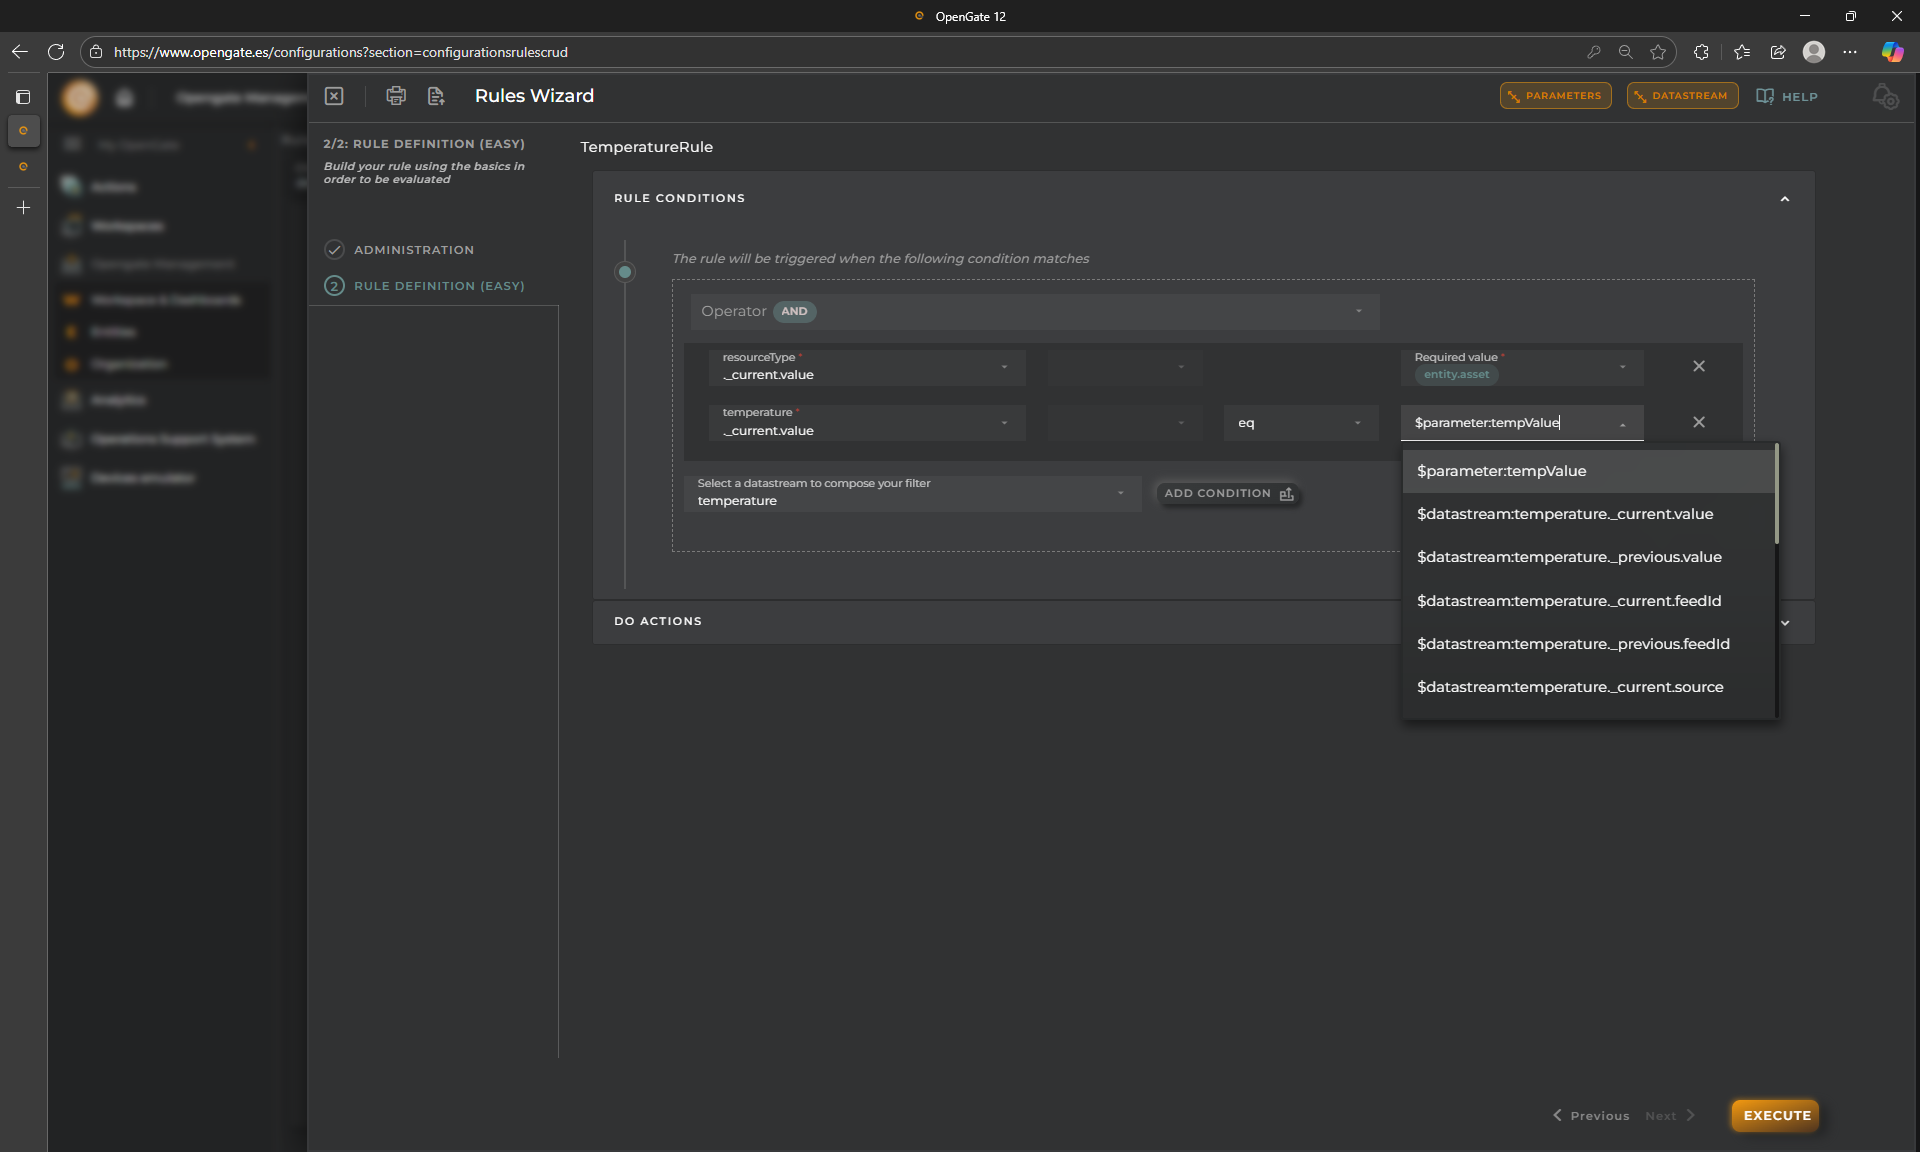
Let’s configure our easy rule. As you can see you have some conditional tools available to configure the logic for the trigger of the rule.
This is the configuration of the condition to the rule results true, and so, execute the actions that we will configure later.
For this demo, we want to triger an alarm when any room facility register a temperature greater or equals 25ºC.
To accomplish this, we need to do the following:
Add a condition for resourceType with the operator eq to asset. This means that we only generate an alarm when the asset receive the value.
Add another condition with our datastream temperature from “warehouse” datamodel, and choose the opreator gte and then, choose our parameter.
Ensure that the GROUP condition is AND
4. DO ACTIONS:
Now we will decide what the rule must do when the condition occurs.
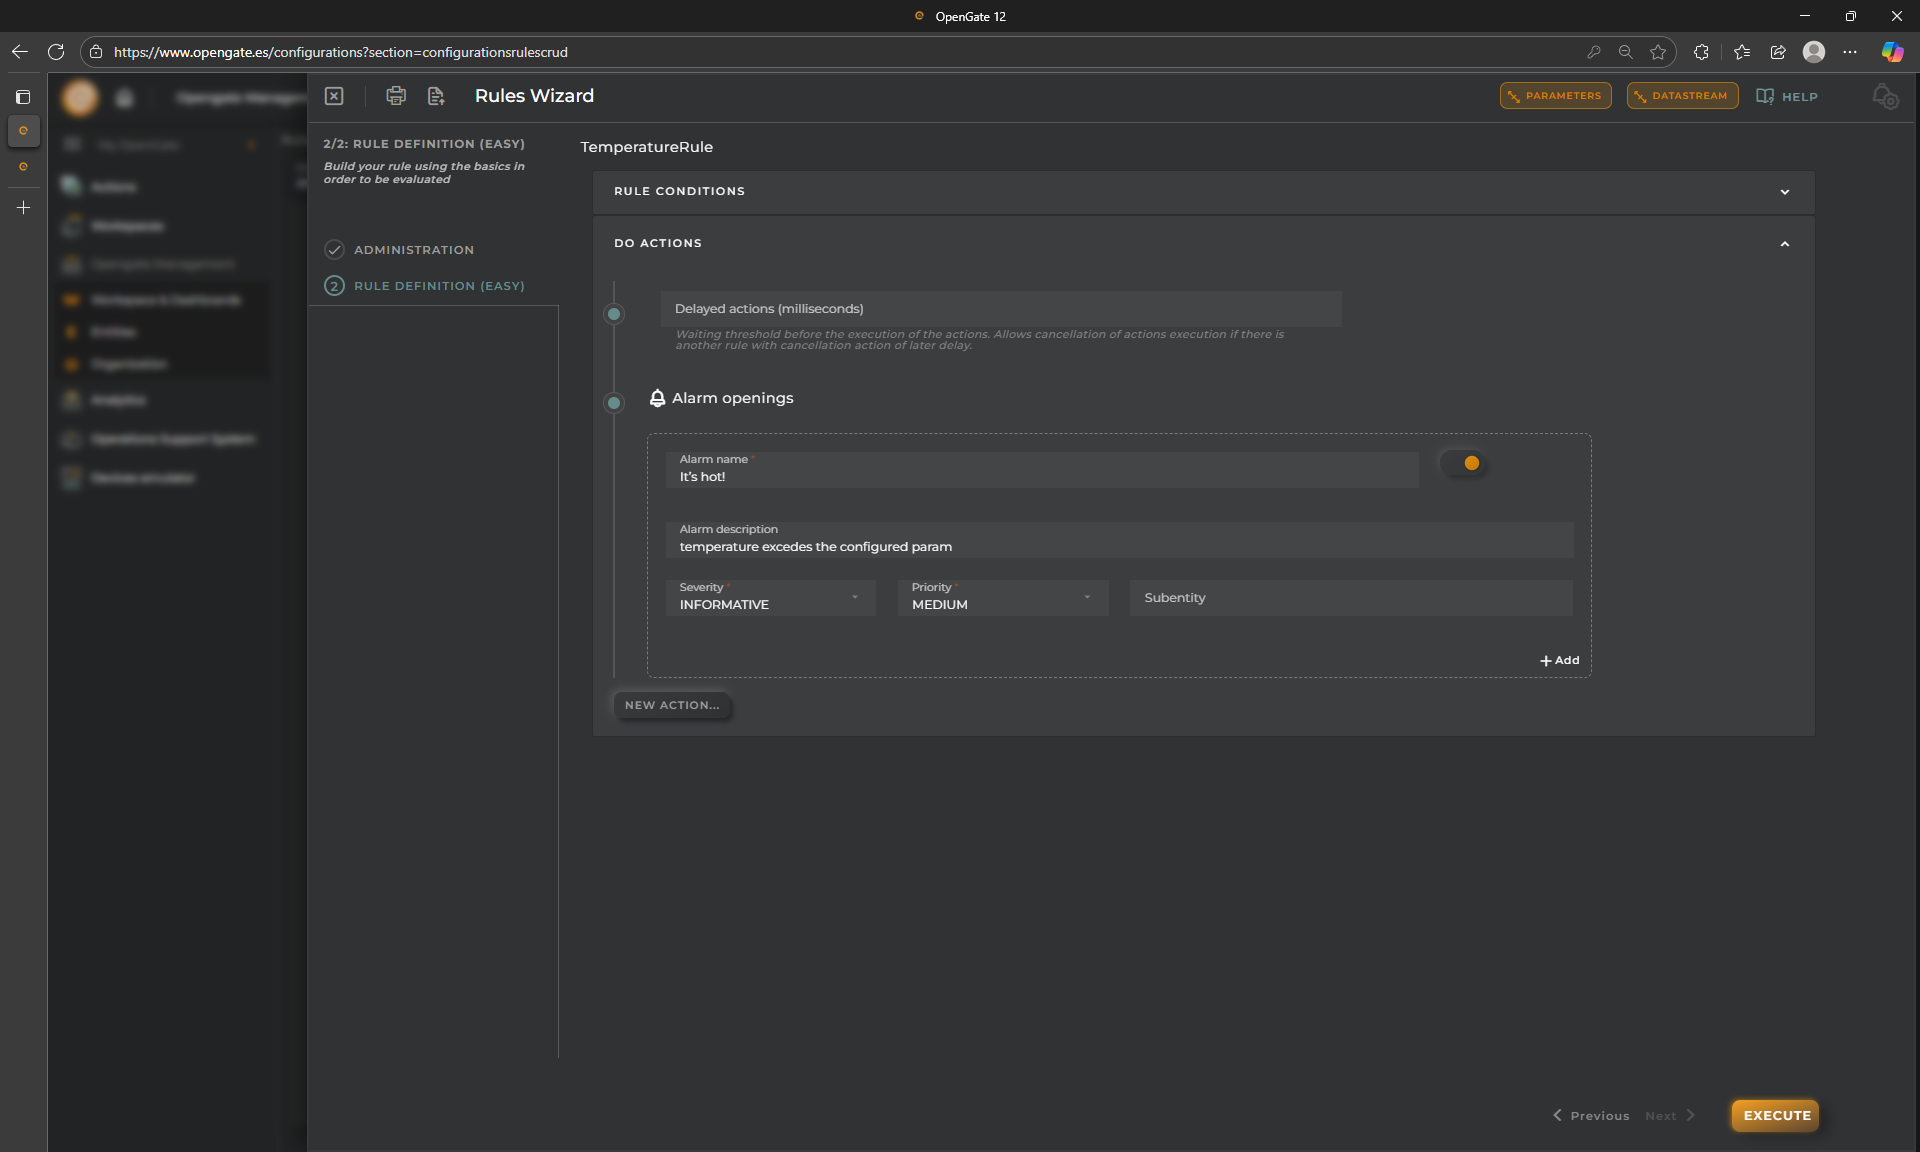
So let’s indicate tha we want to OPEN ALARM by clicking on “NEW ACTION”. Then configure the following:
Alarm name: It’s hot!
Alarm Description: temperature excedes the configured param
Severity: INFORMATIVE
Priority: MEDIUM
Ensures that the check is activated, if not, this action will never execute.
5. Save your changes
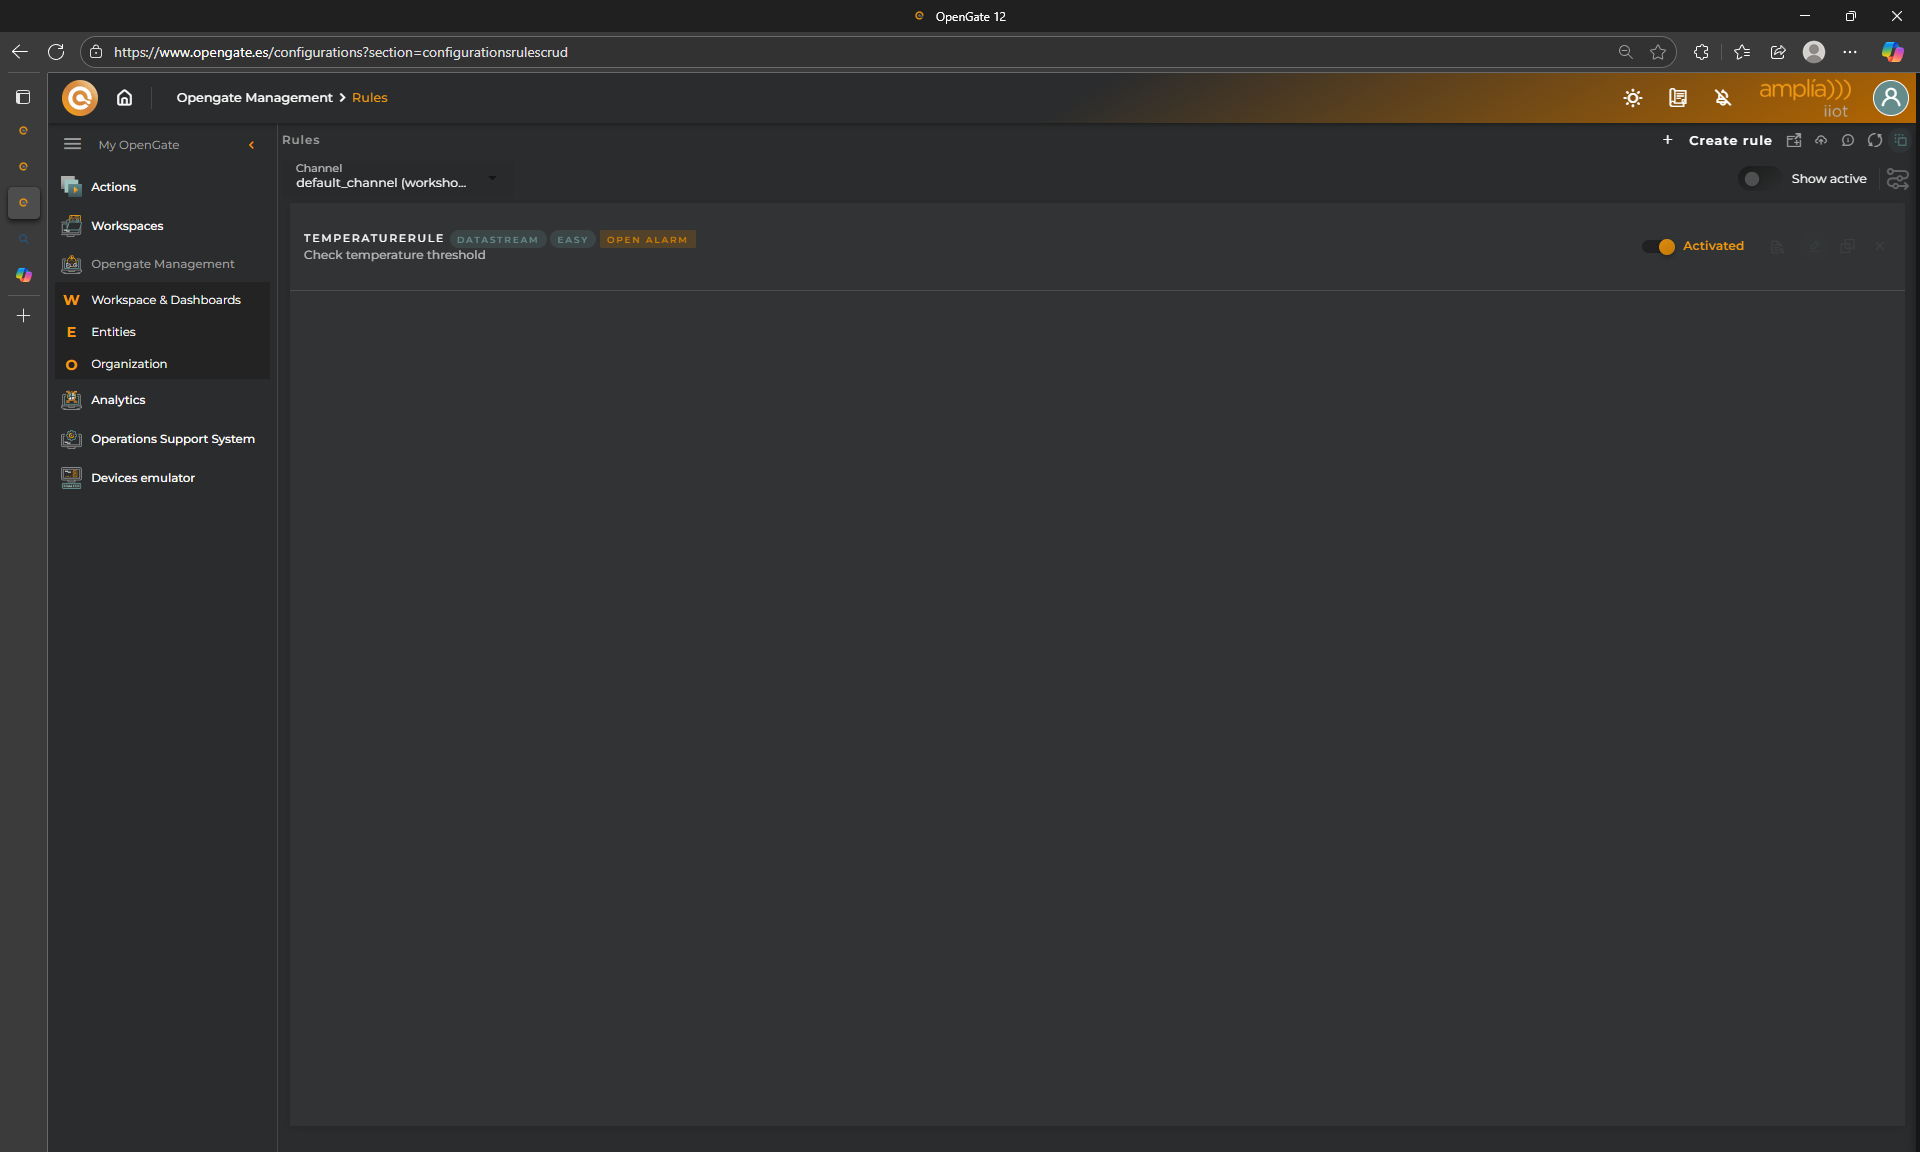
Click on “EXECUTE” to activate the rule
👏 Congratulations, you create your first rule!!
🧪 Testing the Rule
So easy right? Let’s verify that the rule behaves as expected.
Go to the “alarms list”
As always, you have a predefined solution to check your triggered alarms, but you can create your own dasboards.
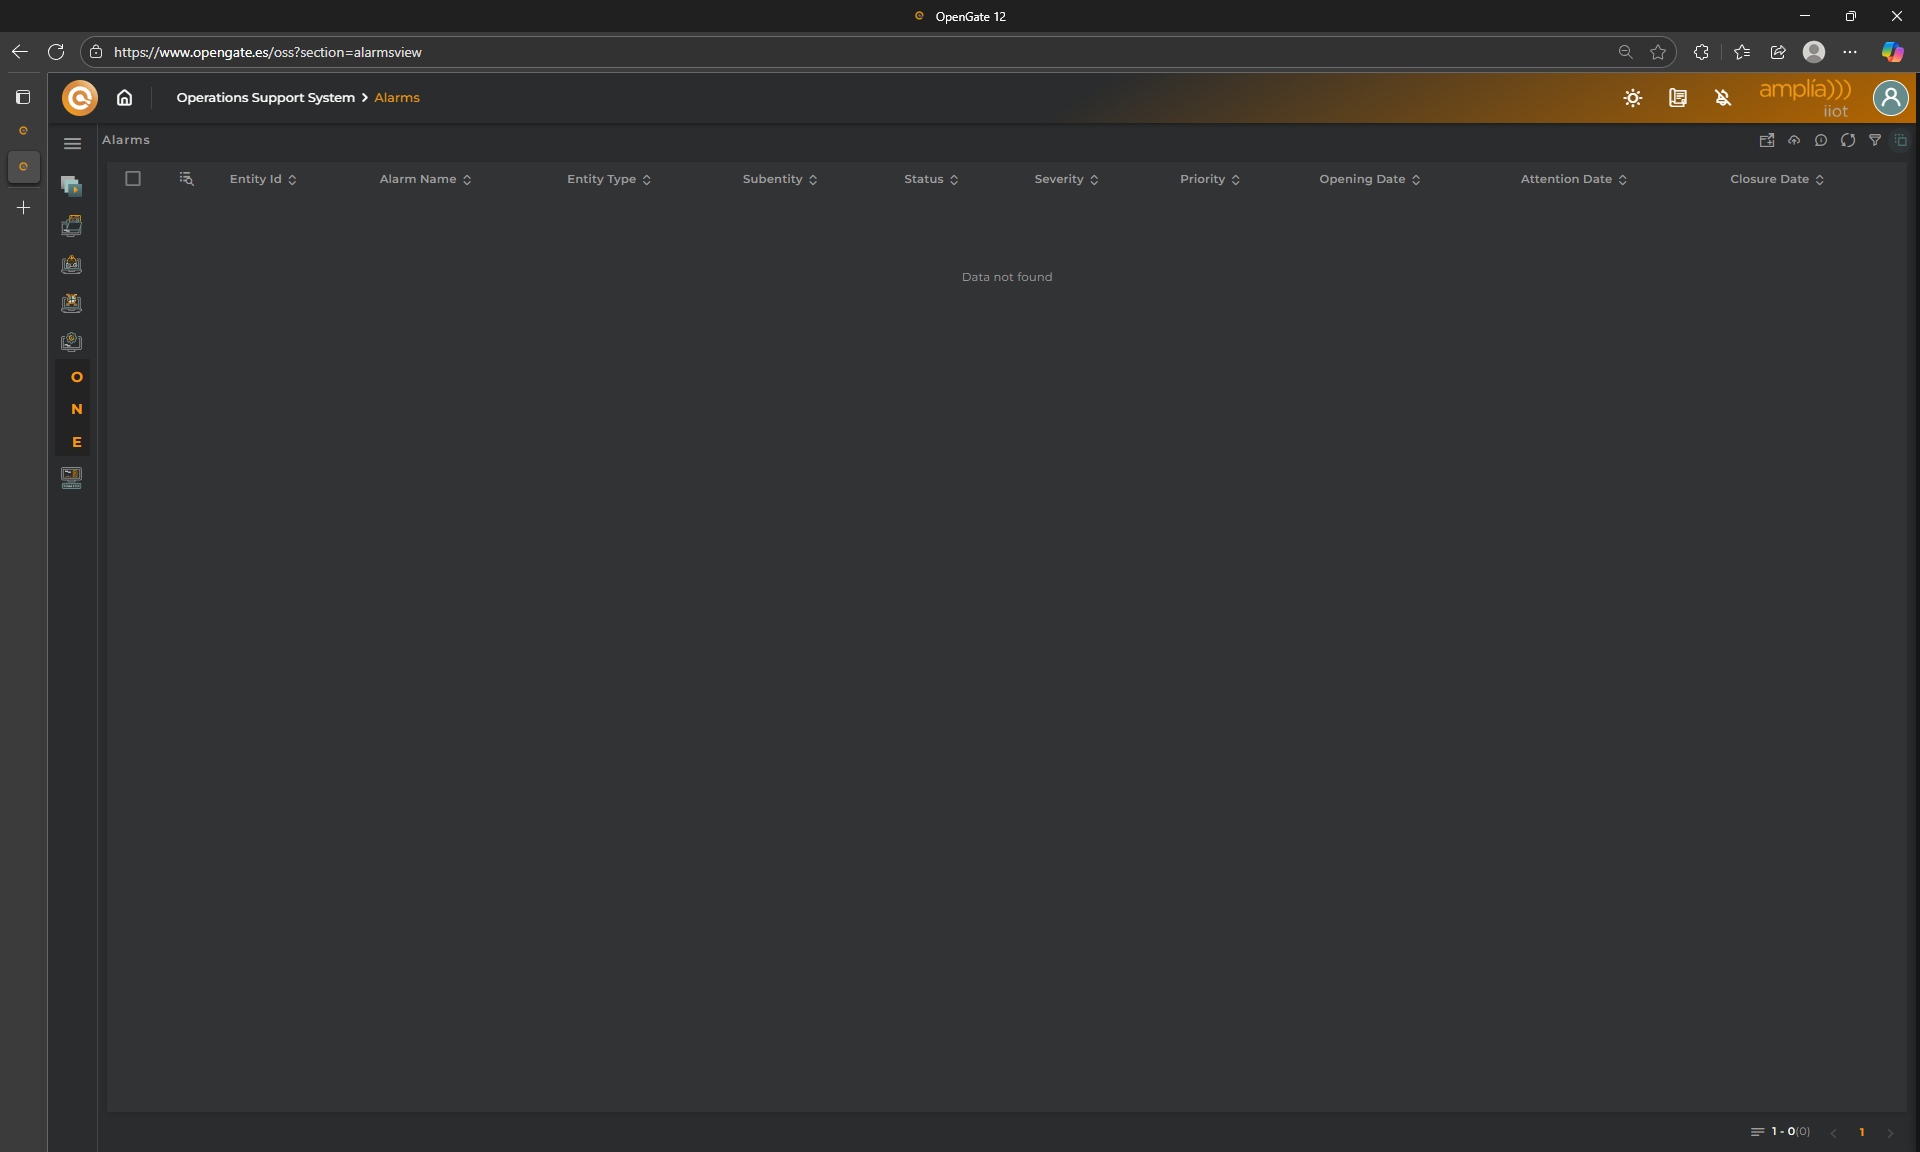
Let’s try the predefined “Alarms List”. Just go to “Operations Support System > Alarms”, and open it in a new window
Send a normal value
Use the OpenGate Device Emulator to send a 21 value for temperature datastream, for the device [YourPrefix]-ws-stemp02, you know how.
Return to the Alarms List. Nothing happens, why? because we are under our threshold
Now enter a value above our threshold
Use again the “Opengate Device Emulator” to collect, this time, a 27 value
Return to the Alarms List and check what happens now
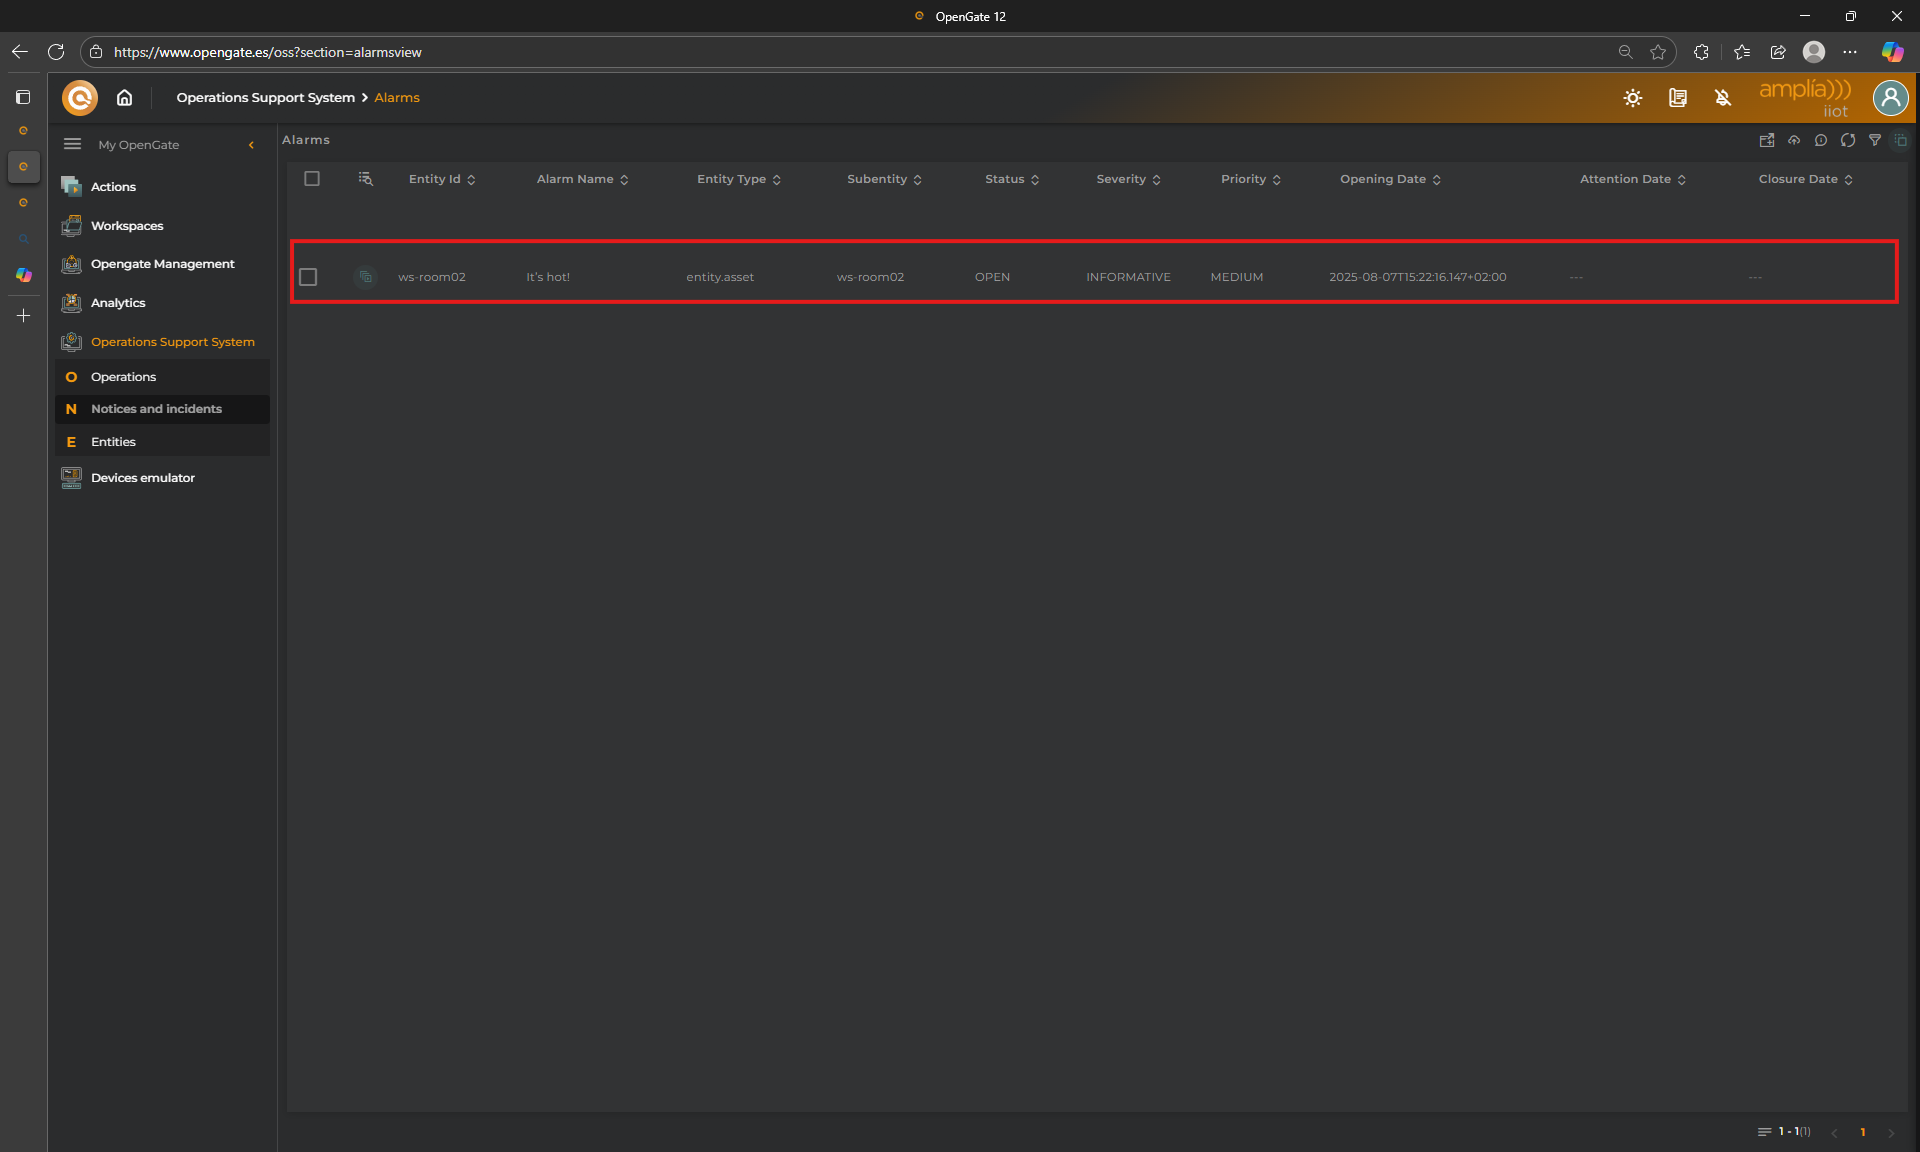
🚨 As you can see a new alarm appears.
This alarm is triggered because when you collected the 27 value for temperature, this value is populated to the asset and is above the alarm configured threshold.
🚨 Managing Alarms
Trigger alarms to aumomatically detect what is happening on your solution is great but if something is detected is for you to do something, right?
Now we understand how alarms works and how are generated, let’s explore the available options using the alarm we just triggered.
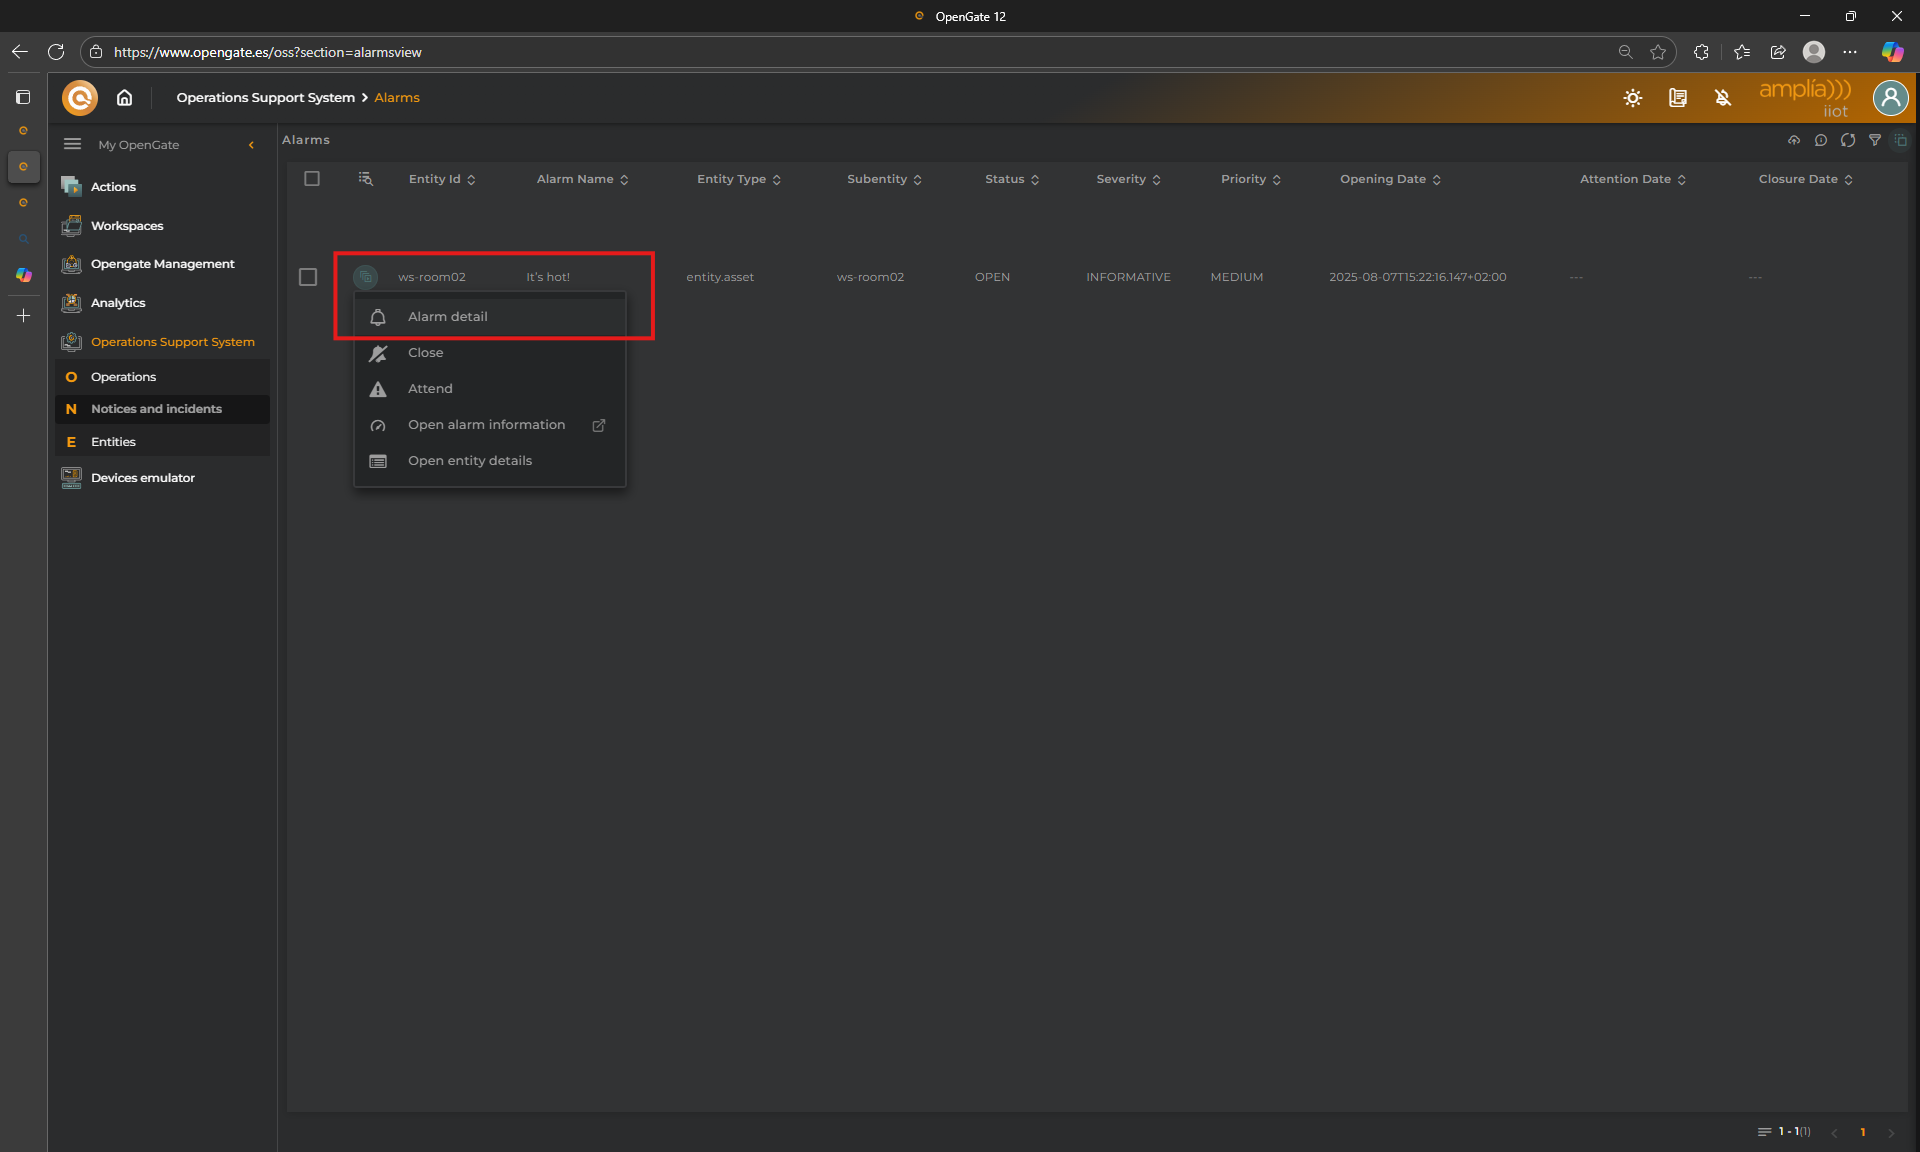
From the alarms list page, each alarm has its own menu to operate with the alarm:
Review the alarm details
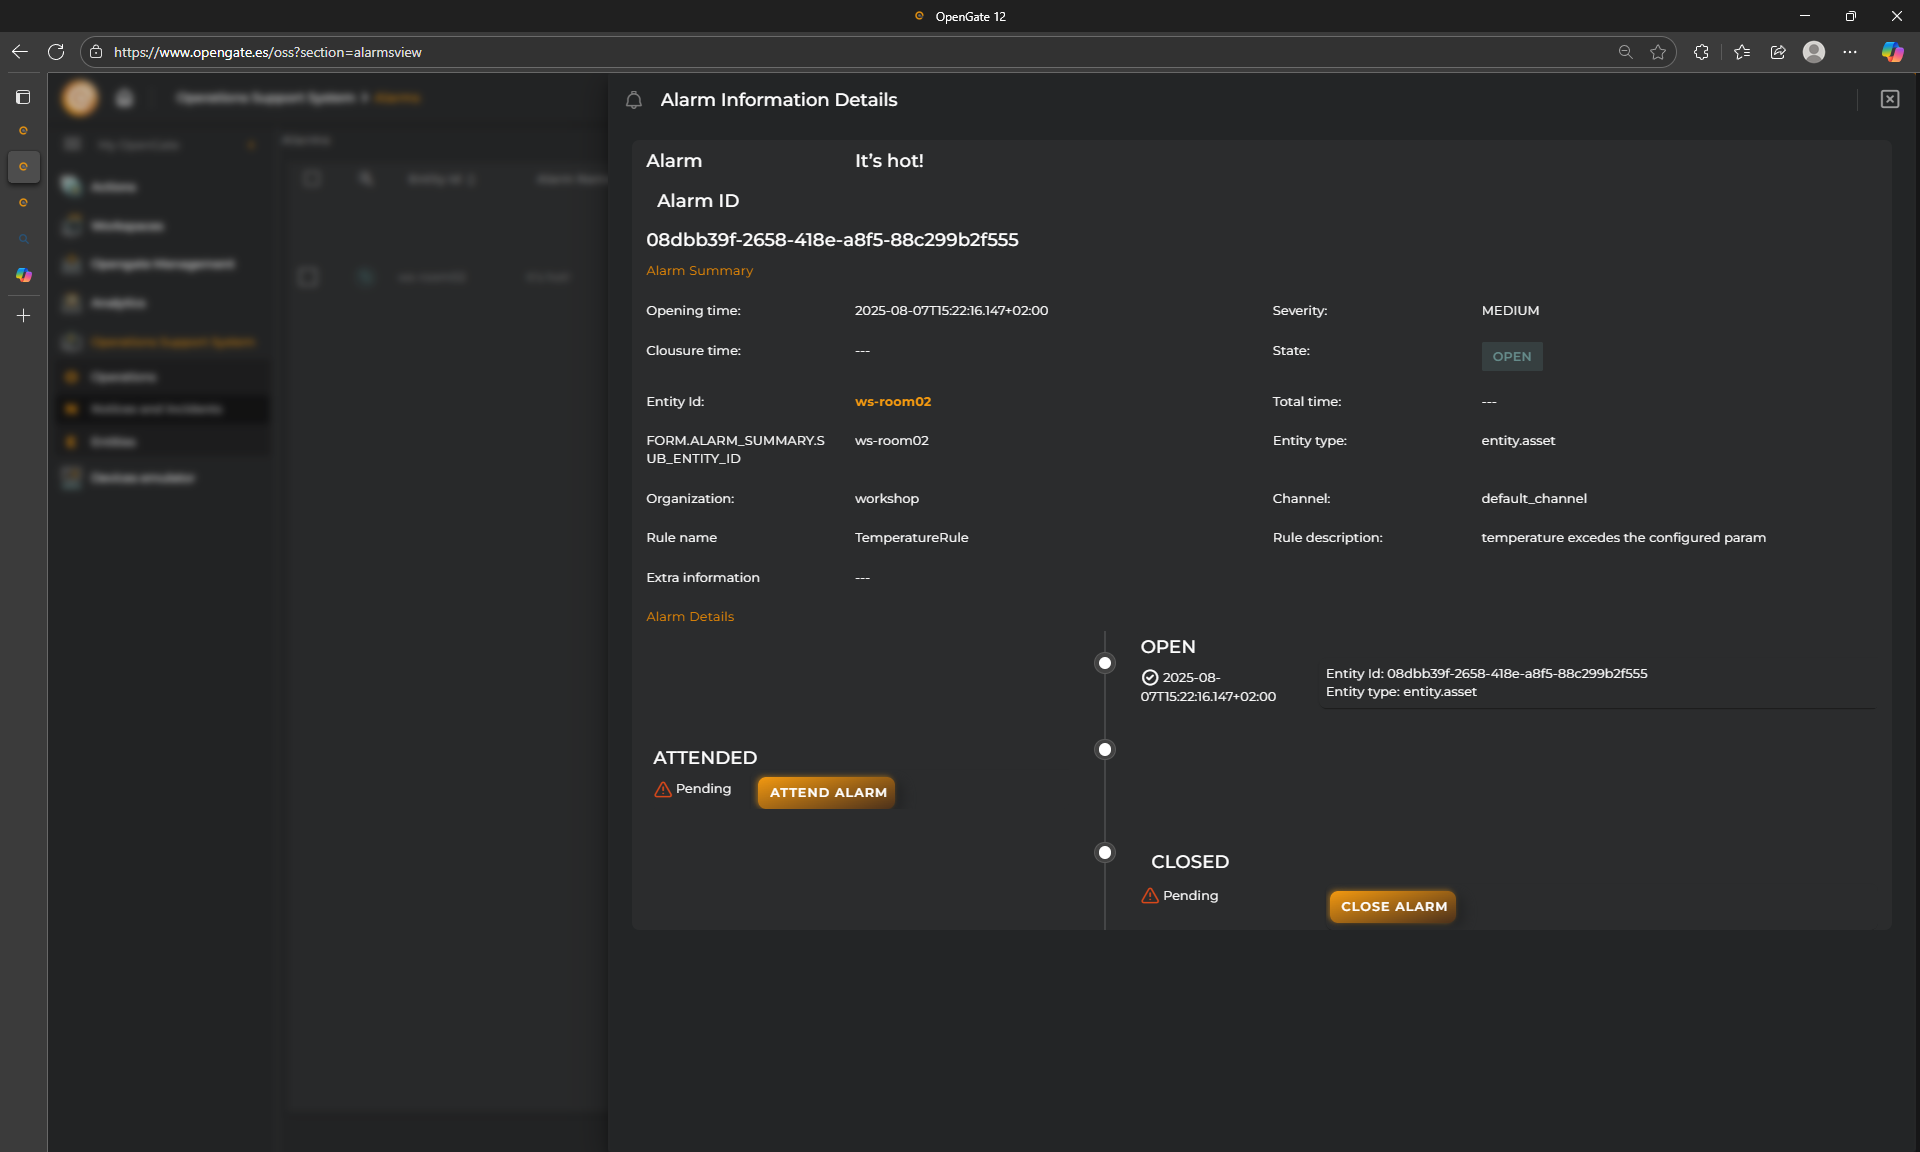
Click on the alarm menu, then “Alarm detail”, to check all the alarm information
Here you can see all the history related with the alarm. The most relevant information is:
Openning time: The timestampt when the alarm is triggered by the rules engine
Status: The current status of the Alarm (OPEN or CLOSED)
Clossure time: Timestampt if the status is CLOSED
EntityID: The entityID that triggers the alarm
Rule Name: The name of the rule that triggers the alarm
Rule Description: The description of the rule. this ussually helps for better understanding
Severity: INFORMATIVE, as configured for this rule’s action
Alarm timeline: This view show different actions (available also from the alarm menu if you look the previous image in detail)
Attend the alarm
It is possible to attend the alarm to register some work by the users. By clicking on “Attend Alarm” option, you will be able to introduce some notes and so it keeps registered with the alarm information.
Close the alarm
You can close directly the alarm without attend it before. In any case, you can add some notes related with the alarm closure proccess.
10. Analytics and Datalab
🧪 Analytics and Datalab
🚀 What is Jupyter Lab and Why Is It Useful?
OpenGate comes with Jupyter Lab pre-installed and ready to use — no setup required.
You can access it directly from the Analytics section in the Web Console.
Jupyter Lab is an interactive development environment that lets you:
Create and run jupyter notebooks with Python code
Visualize data in real time
Document your analysis step by step
Combine text, code, and graphics in a single workspace
It’s perfect for exploratory data analysis, rapid prototyping, and technical documentation.
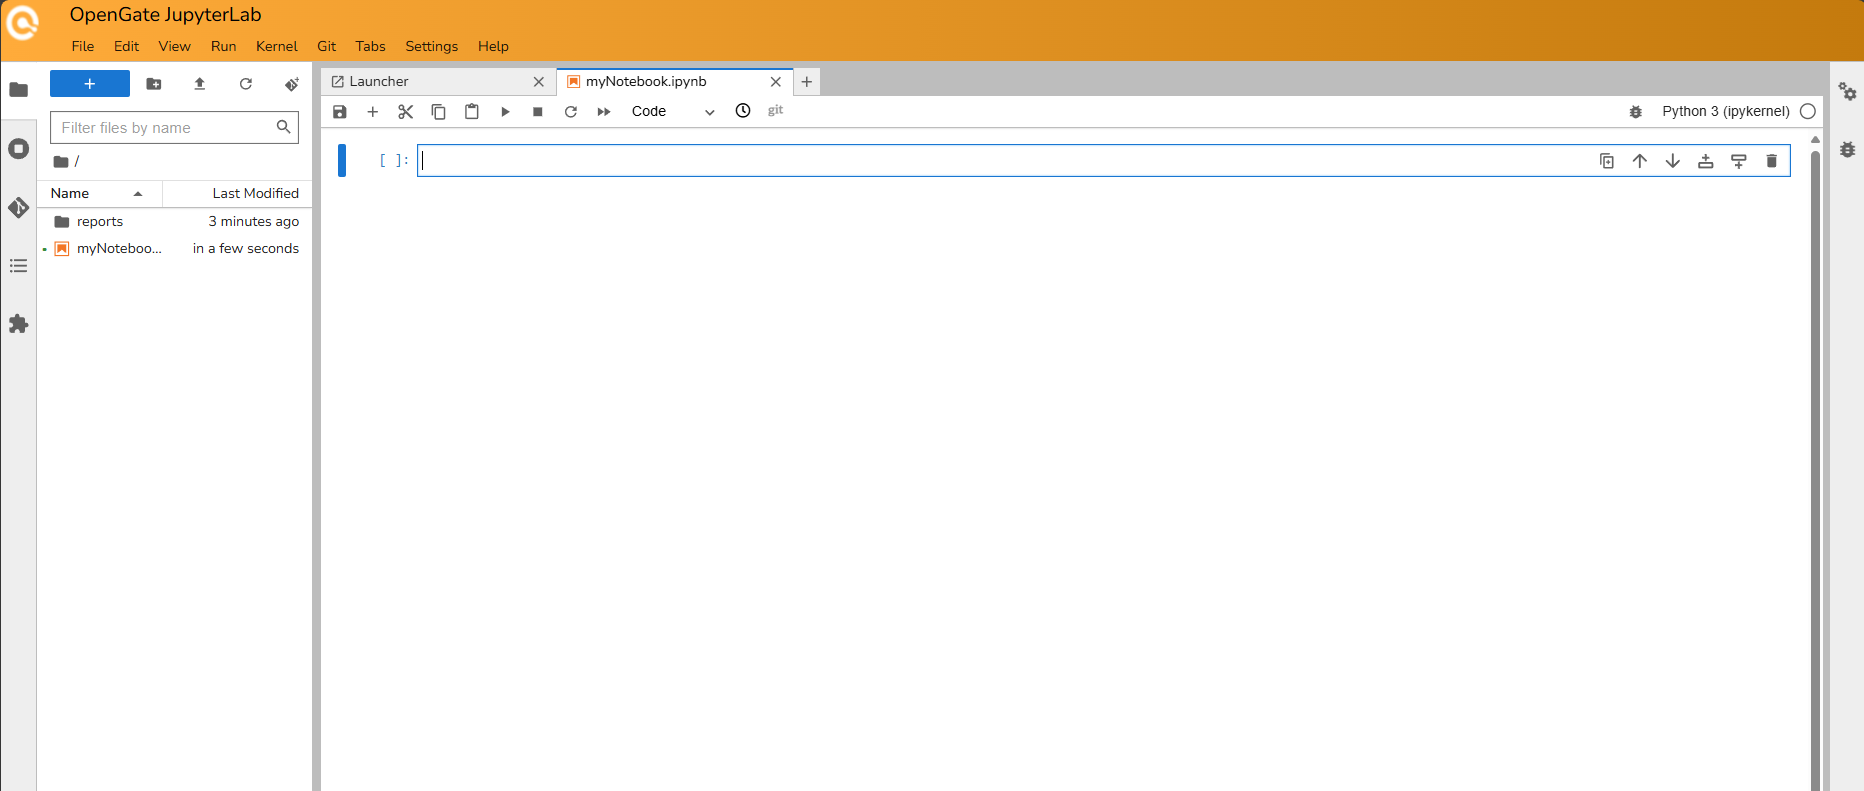
Once it’s open, you will access to the OpenGate Jupyter Lab interface to work with your notebooks:
🛠️ OpenGate Data: Your Python Superpower
The data generated or the results of your experiments with python can be reinjected in OpenGate!! but how? Easy… Using the opengate-data library…
The opengate-data library is a Python package designed to integrate OpenGate into your Python projects which is available by default on your OpenGate Data Lab instance.
It provides tools to interact with OpenGate’s APIs efficiently and intuitively.
Key features include:
🔍 Reading data from OpenGate
✍️ Writing data back to OpenGate
🧬 Automatic conversion to pandas.DataFrame
This means you can leverage the full power of pandas for advanced data manipulation, filtering, and visualization within your notebooks.
🖥️ Install it locally
Do you want to play locally? Installation is simple:
pip install opengate-data
📊 Why Is pandas So Powerful?
pandas is the go-to library for data analysis in Python.
The fact that opengate-data works seamlessly with DataFrame objects unlocks a wide range of possibilities:
Filter data by time, entity, or value
Group and summarize information
Create visualizations using matplotlib, seaborn, or other tools
Export to CSV, Excel, or databases
💡 This transforms OpenGate from a data collection platform into a full-fledged analytics engine.
✅ What You’ve Learned
With this final tutorial, you’ve completed the full journey through OpenGate:
From accessing the platform and navigating the console
To modeling, provisioning, and visualizing data
Through rules, operations, and connectors
And finally, to advanced analytics using notebooks and Python
🎓 You now have everything you need to build end-to-end IoT solutions — from device to insight.