1. Accessing OpenGate
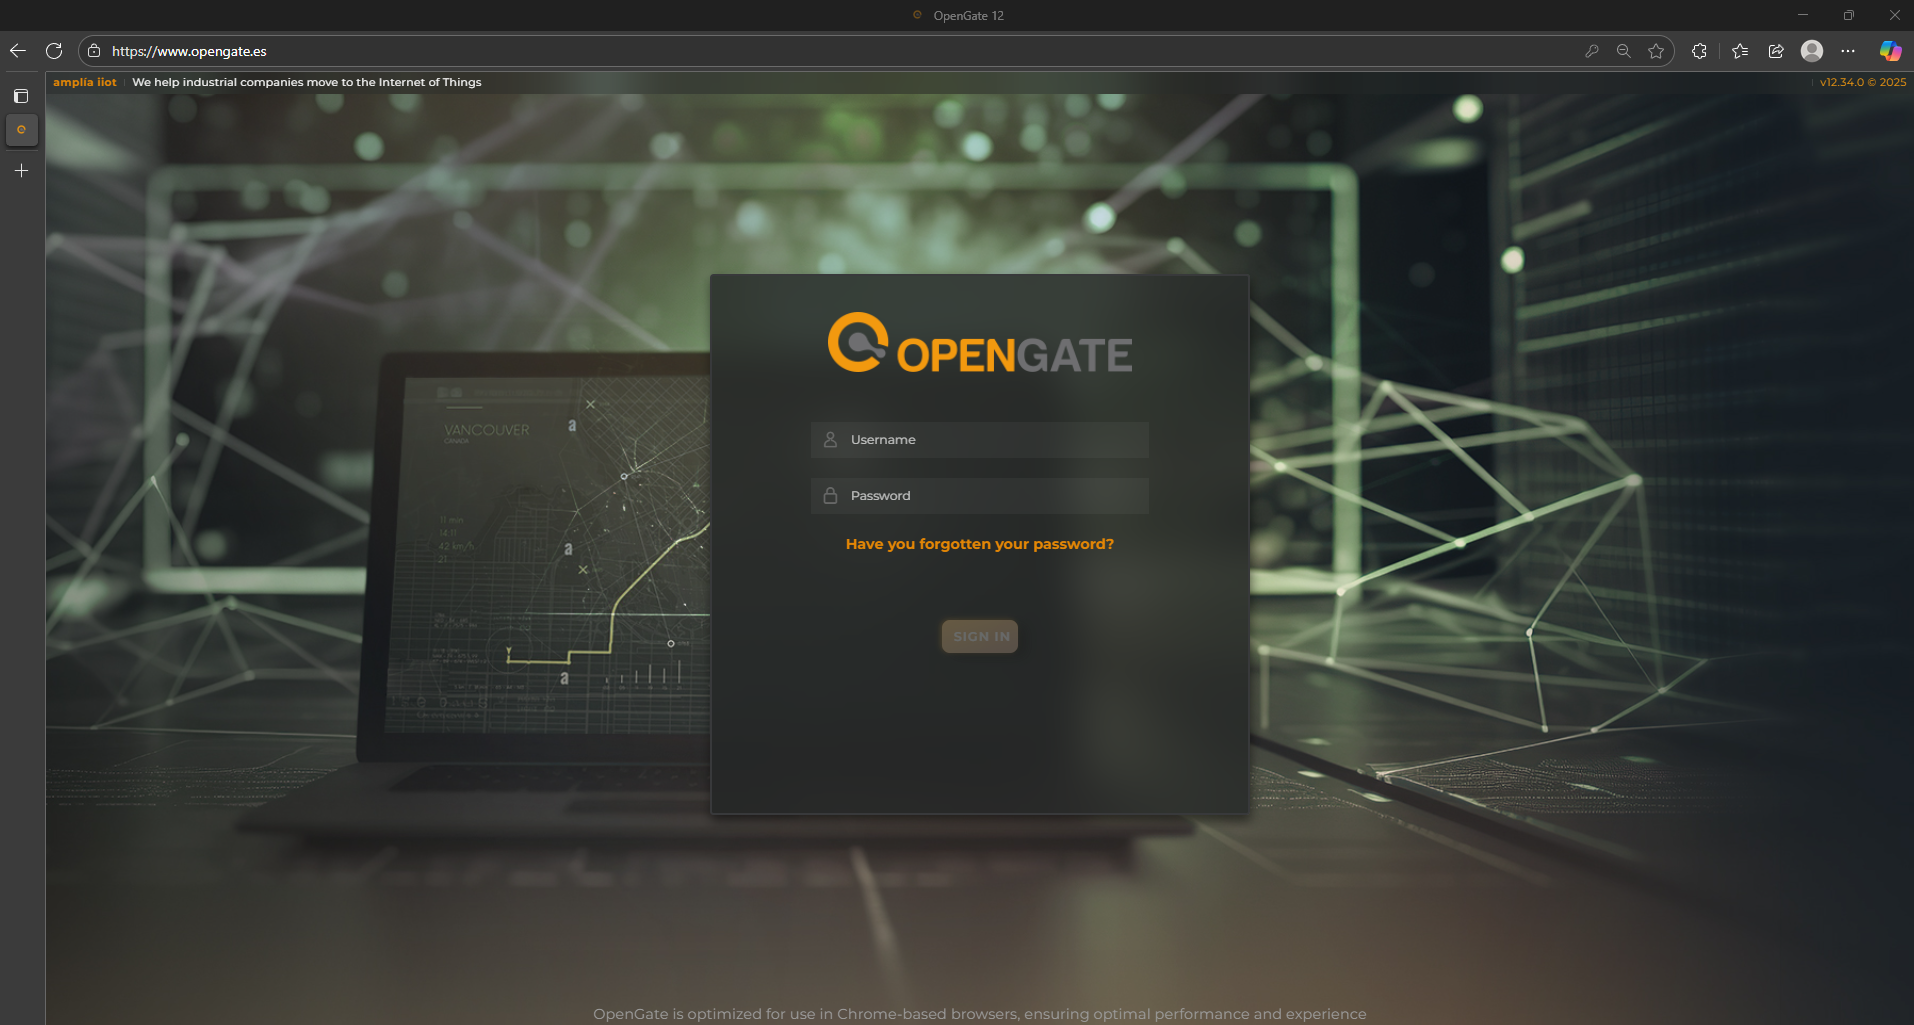
🔐 OpenGate login page
To begin using OpenGate IoT Platform, the first essential step is accessing its Web Console. This interface serves as the GUI control center where users manage devices, define rules, monitor telemetry, and configure their IoT ecosystem.
Users must begin by navigating to the OpenGate Console URL. Upon reaching the login page, access is granted via credentials and TOTP (serving as Two Factor authentication method), depending on the authentication method configured for your organization.
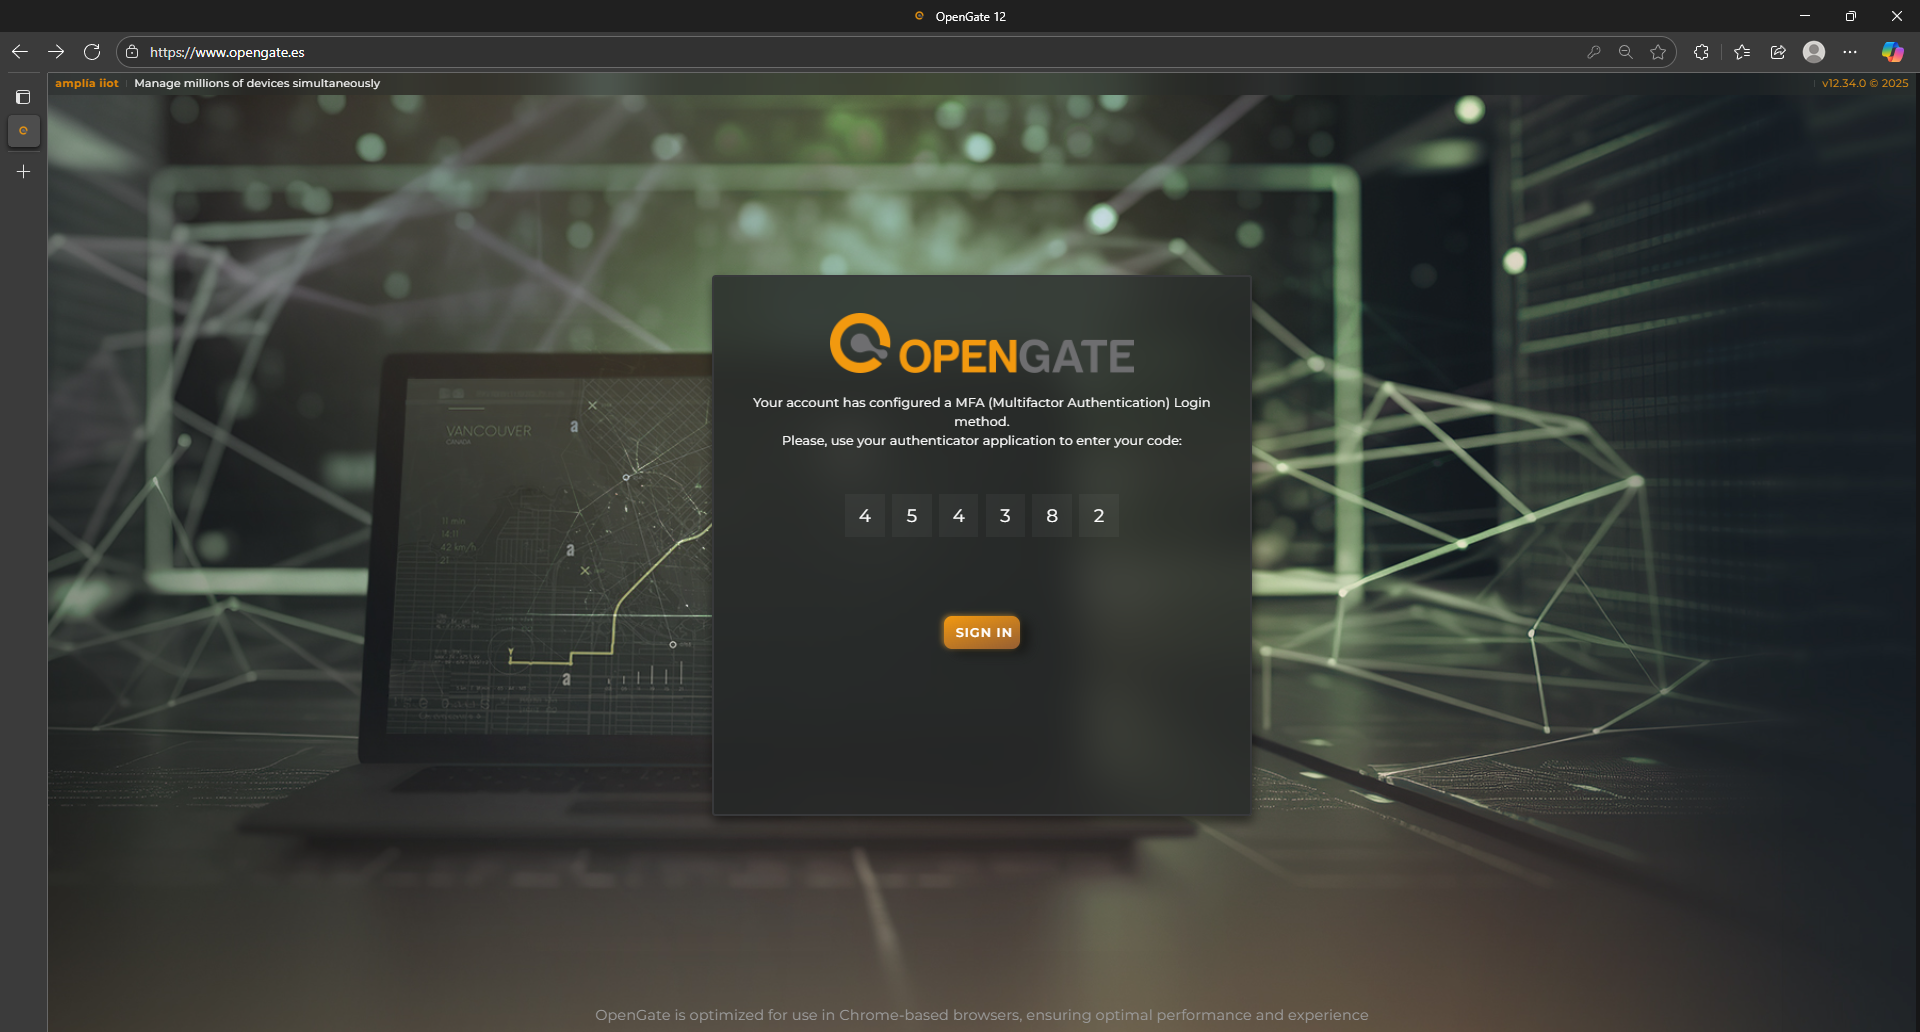
🛡️ TOTP Login
TOTP (Time-based One-Time Password) is a security protocol used in two-factor authentication (2FA) systems. It generates a temporary, one-time code that changes every 30 or 60 seconds, based on the current time and a secret key shared between the user and the service. This ensures that each code is unique and valid only for a short duration, adding an extra layer of protection to user accounts.
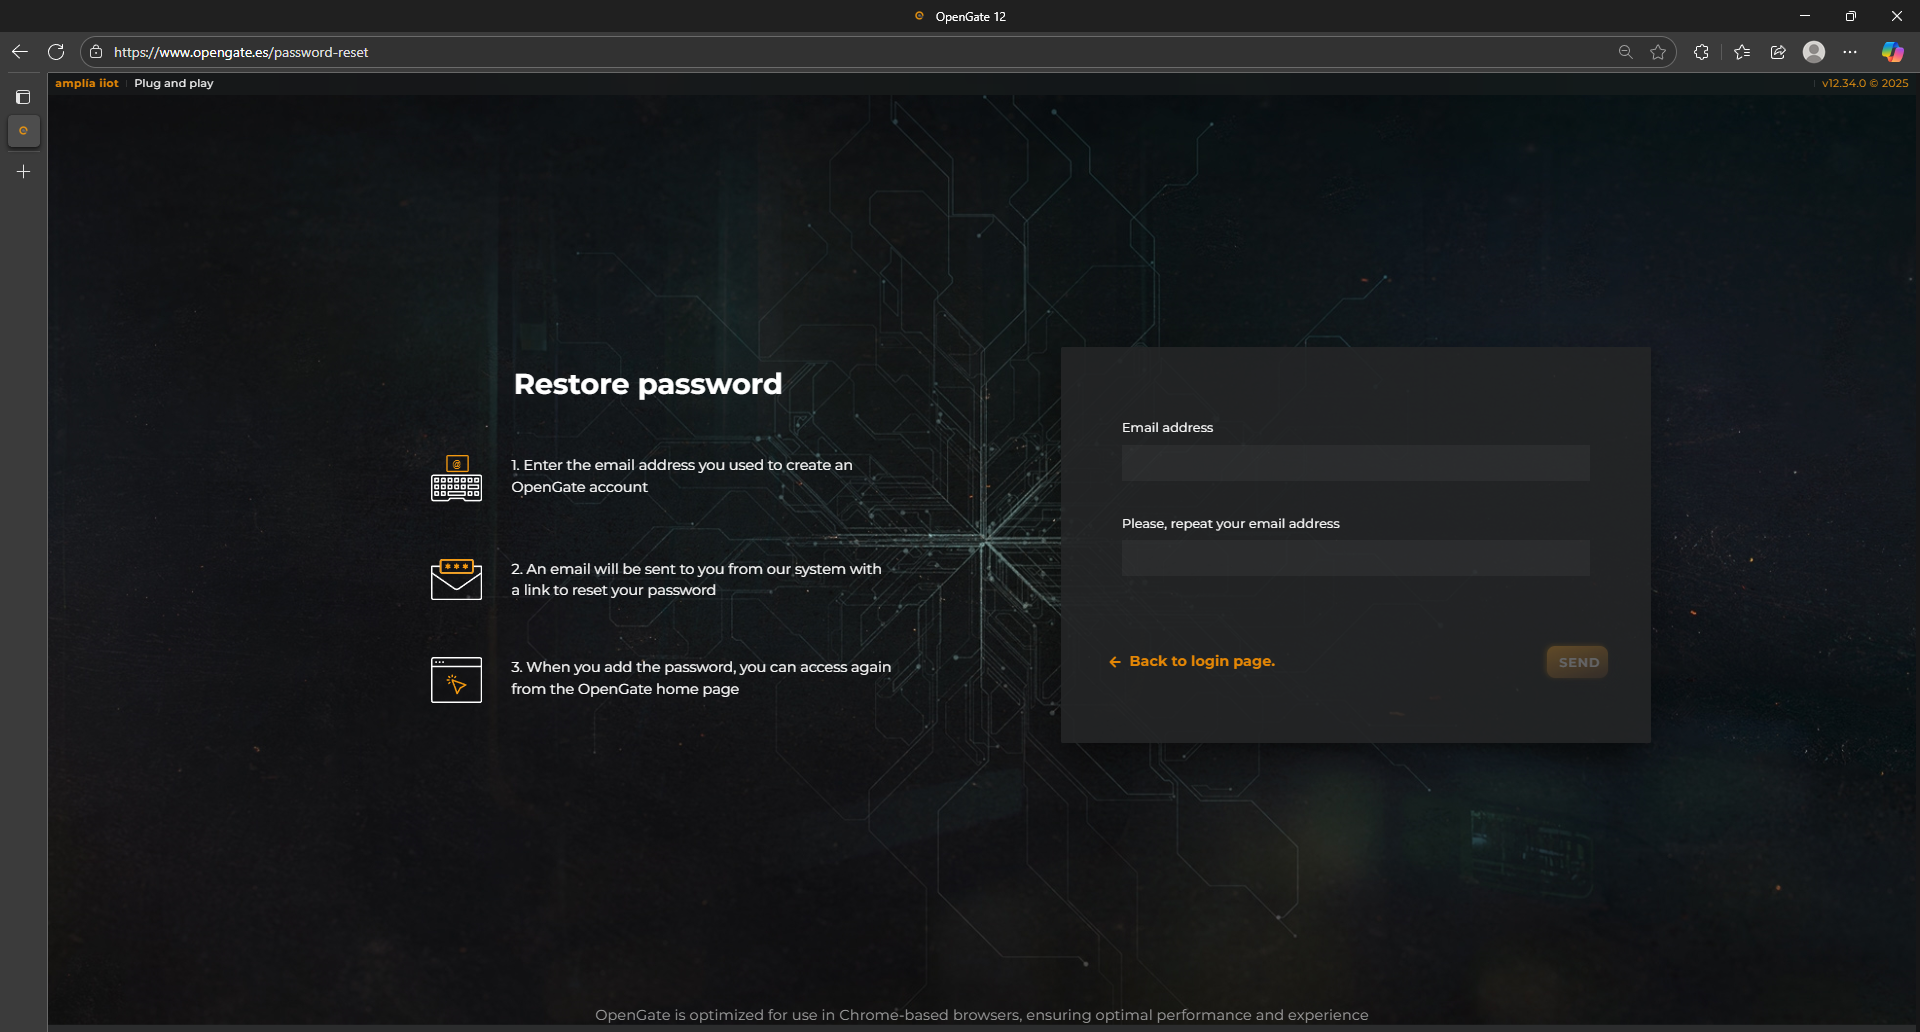
⚠️ Lost Password?
It is possible to regain access to an account when standard authentication fails, such as forgetting your password or losing access to a two-factor authentication app (TOTP). Just click on the link below the login form and then you can retrieve your password
🏰 OpenGate home page
Once authenticated, users arrive at the Home page. This landing view presents the workspaces and dashboards that you have configured or the ones your administrator or some partner share with you.
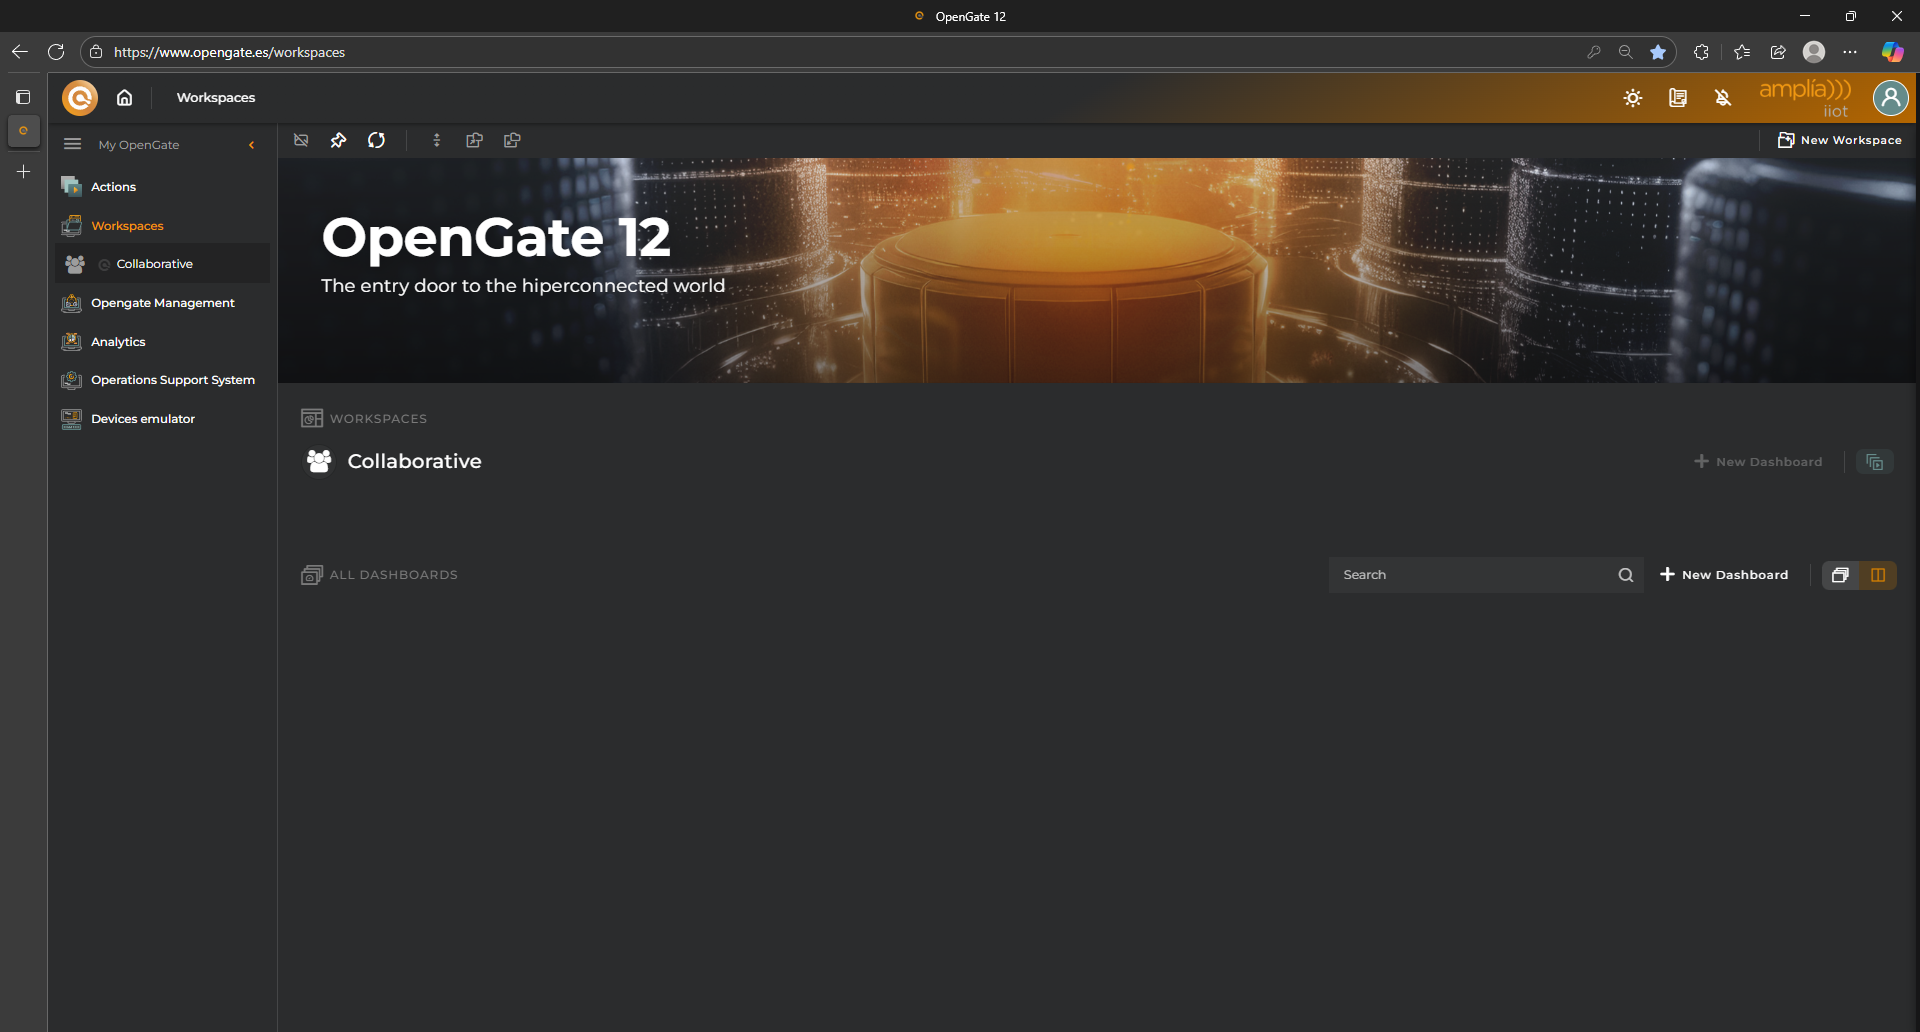
The primary navigation menu is positioned on the left side of the screen. From here, users can enter dedicated sections such as Entities, DataStreams, Provisioning, Functions, Rules, Catalog, and Dashboards. Each section is structured to guide users through specific configuration workflows, offering both summary views and in-depth drilldowns.
The top bar of the console includes access to user settings, notifications, language preferences, and a global search tool. This enables quick access to specific entities, rules, or logs without needing to navigate the interface manually.
📚 OpenGate Sections
Once logged into the OpenGate IoT Platform, you can choose between some different tools among the following:
1. Workspaces and Dashboards
An intuitive, visual interface that centralizes OpenGate operations. Workspaces allow you to organize custom views tailored to their roles or operational needs, while Dashboards provide dynamic panels with charts, key metrics, and real-time KPIs. Perfect for quick monitoring and status analysis of devices and services.
We will cover this in detail in the step 7.Workspaces and Dashboards section.
2. OpenGate Web Administration
The core administrative console of OpenGate. Through this web interface, you can manage all the functionalities of your OpenGate IoT Platform account like provisioning and managing entities and digital assets, creating users and configure different access roles, build connector functions, data models, rules, operations, and so on.
It’s the main hub for fine-grained platform customization and we will use it several times during this tutorials.
3. Operations Support System
You can configure your own dashboards in the Workspaces and Dashboards OpenGate area, but we think that this area facilitates the management of the OpenGate IoT Platform Operations, directly out of the box. It allows you to monitor all the scheduled operations, its executions and details, so it’s a powerful tool for large-scale, real-time operations control.
This tool also offers you the possibility to launch and configure new Operations from wizards that allow you to configure operations for one, tens or millions of devices based on filters.
4. OpenGate Device Emulator
A test environment designed for developers and integrators. It simulates complete device behavior without requiring physical hardware, making it ideal for validating configurations.
You can use the Device Emulator to collect specific data as the same way that the device does, testing through all the workflow of the OpenGate IoT Platform and so, ensure that connector functions, rules and operations perform as expected before deployment.
5. Analytics (OpenGate Data Lab)
The analytical layer of OpenGate IoT Platform. It offers the possibility to work with your datalake, time series and data sets, by using our OpenGate Data Lab. This tool gives you all the powers of Jupyter Notebooks and python to work with your data: create analytics tasks to find patterns, build KPIs, build automated custom reports or periodic custom calculations over your data.
In the near future, we will expand this tool by adding an AI module to work with, directly from OpenGate.