Custom Chart

Custom charts allow for the display of data in graphical format based on user-defined logic.

How it Works

Custom chart widget

Once the logic for data retrieval is entered, the data will be displayed on the widget.

What sets the custom chart apart from others is that the data source can be external, internal, both, or even fabricated. Moreover, multiple charts can be combined within the same widget.

This widget is compatible with eCharts library version 5. Multiple examples can be accessed via the following link: eCharts

Configuration

General

  • Boxed: widget will be displayed with background in dahsboard.
  • About: widget description in Markdown format.
  • Title: widget title. It can be configured to remain fixed in the widget or only be displayed when it receives focus.
  • Toolbar: configures the behavior of the widget bar on the dashboard, allowing you to hide it, hide it when not in use, or leave it always visible.
  • Refresh Frequency: allows configuring the data refresh frequency displayed in the list.
  • Extra actions: allows user to add new specific actions to the widget with your own code.

Extra action config Extra action config

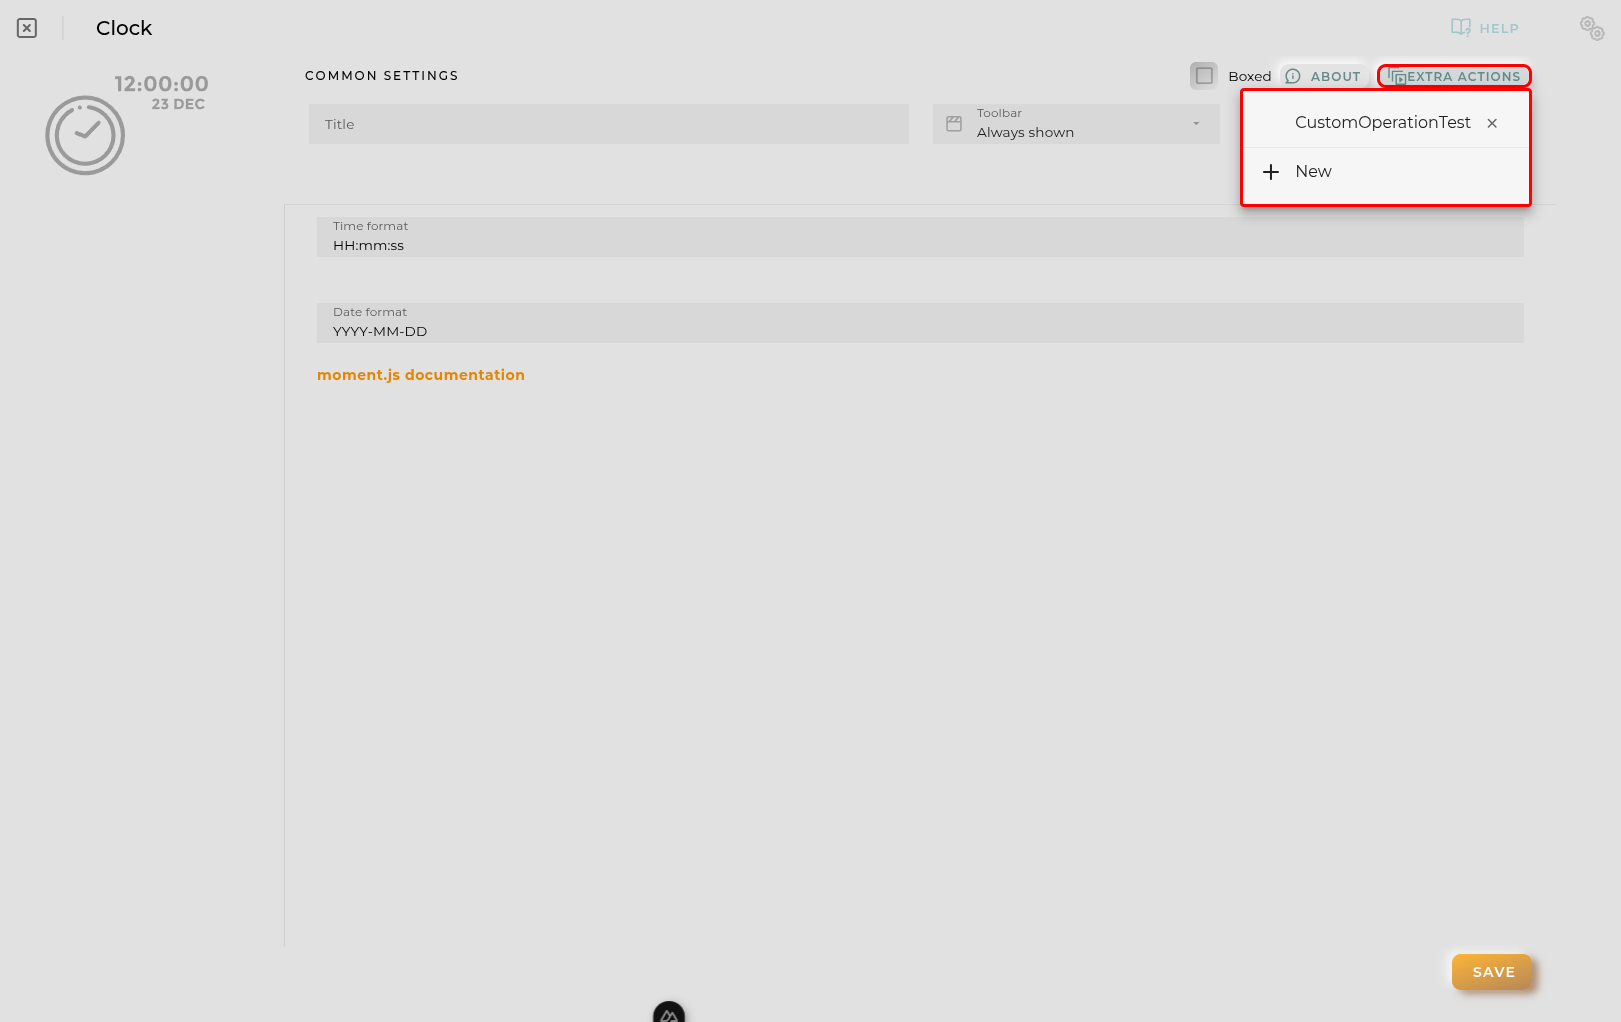
You can add a new one by pressing the New button.

Once you added a custom action it can be modified later by pressing the name in the list.

In order to remove the custom action click the delete icon button on the right.

In extra actions you can write your own code were you can open other dashboards, entities dashboards or execute wizards.

Extra action code Extra action code

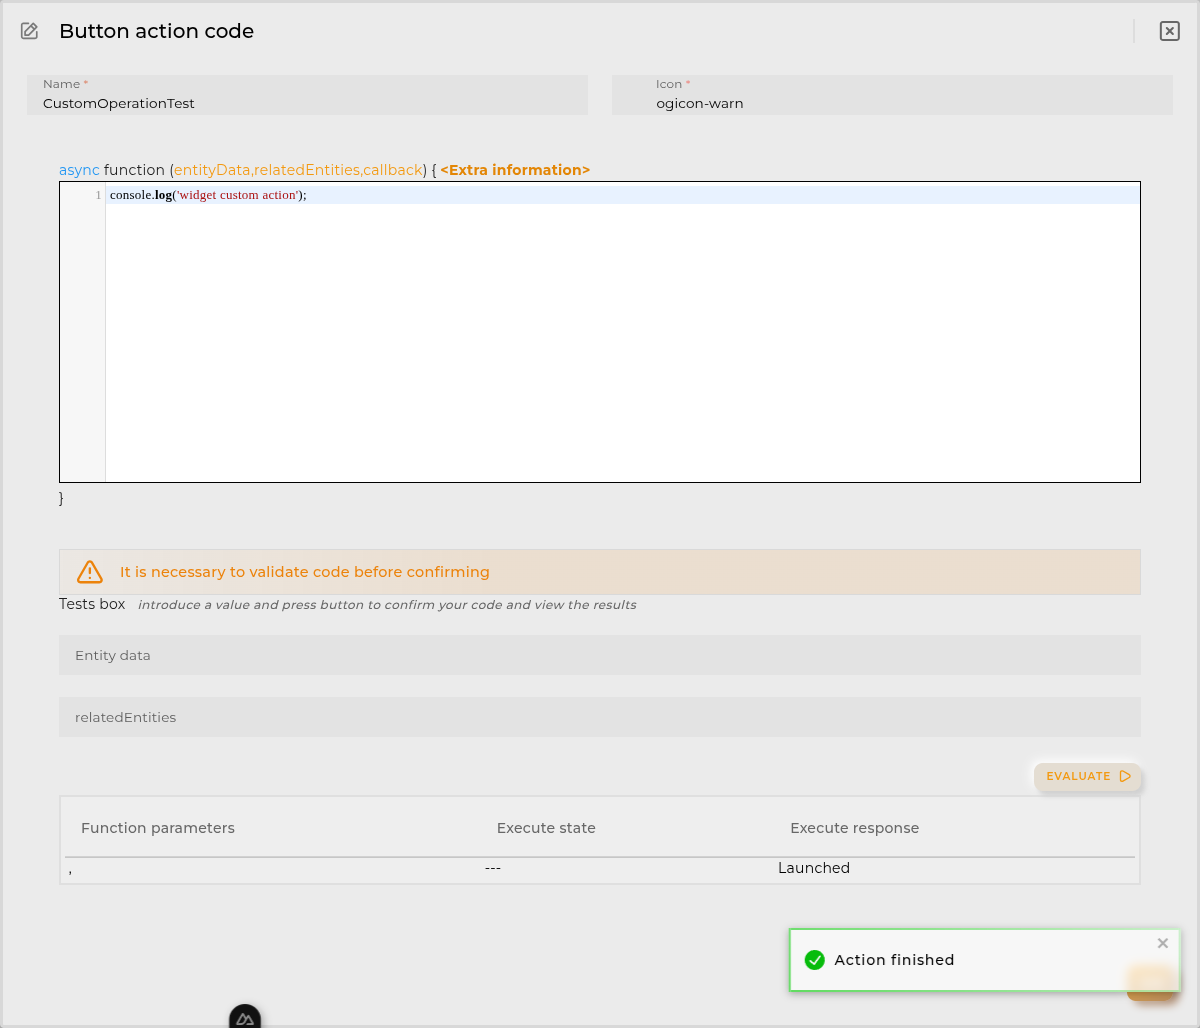
You can find all available functions and methods in Extra parameters

  • Show widget filters instructs the widget to display its filters. These filters will be passed as an additional parameter to the data retrieval function.
Custom chart code configuration

Here, you input the necessary code to obtain the information to be displayed.

Depending on the selected options, the parameters received by the function will be displayed.

The function must always return a JSON object that is compatible with eCharts’ chart configuration.

Every time the code is updated, it must be evaluated where a preview of the result can be seen.

Custom chart code preview

Function

Depending of the configuration receives the following parameters:

  • entityData contains the data of the opened entity NOTE: only available when the user opens an entity dashboard template

Example:

{
  "provision.administration.identifier": {
    "_value": {
      "_current": {
        "value": "device_1"
      }
    }
  },
  "provision.administration.organization": {
    "_value": {
      "_current": {
        "value": "organization_name"
      }
    }
  },
  "provision.administration.channel": {
    "_value": {
      "_current": {
        "value": "channel_name"
      }
    }
  },
  "provision.administration.serviceGroup": {
    "_value": {
      "_current": {
        "value": "service_group_name"
      }
    }
  }
}
  • relatedEntities contains an array of entities related to the entity selected. NOTE: only available when the user opens an entity dashboard template

Example:

[{
  "provision.administration.identifier": {
    "_value": {
      "_current": {
        "value": "related_1"
      }
    }
  },
  "provision.administration.organization": {
    "_value": {
      "_current": {
        "value": "organization_name"
      }
    }
  },
  "provision.administration.channel": {
    "_value": {
      "_current": {
        "value": "channel_name"
      }
    }
  },
  "provision.administration.serviceGroup": {
    "_value": {
      "_current": {
        "value": "service_group_name"
      }
    }
  }
}]
  • timeserieData contains info about the timeserie opened by the user
    • config timeserie configuration
    • data timeserie row selected

NOTE: only available when the user opens an entity dashboard template from timeserie table widget

An example:

{
  "config": {
    "identifier": "69281dc43545e97df66c42a1",
    "name": "Battery charge history",
    "timeBucket": 3600,
    "bucketColumn": "bucketEnd",
    "bucketInitColumn": "bucketInit",
    "identifierColumn": "EntityID",
    "retention": 2592000,
    "origin": "2025-11-26T23:00:00Z",
    "context": [
      {
        "path": "provision.device.administrativeState",
        "name": "Administrative state",
        "sort": "true",
        "filter": "YES",
        "type": "string"
      }
    ],
    "columns": [
      {
        "path": "device.powersupply.battery.charge._current.value",
        "name": "Powersupply battery charge Current Value",
        "filter": "NO",
        "type": "number",
        "sort": false,
        "aggregationFunction": "FIRST"
      }
    ]
  },
  "data": {
    "bucketEnd": "2025-12-11T13:00:00+01:00",
    "bucketInit": "2025-12-11T12:00:00+01:00",
    "EntityID": "entity_1",
    "Powersupply battery charge Current Value": 34
  }
}
  • alarmData contains the data of the alarm opened in template
{
  "identifier": "270dd9f9-1396-4660-bb5f-8d8b471e1dcd",
  "name": "activityForbidden",
  "rule": "activityForbidden",
  "description": "Activity detected for an entity with administrative state disabled",
  "severity": "INFORMATIVE",
  "priority": "LOW",
  "organization": "organization_name",
  "channel": "default_channel",
  "entityIdentifier": "A_WORKER_1",
  "subEntityIdentifier": "A_WORKER_1",
  "resourceType": "ENTITY_ASSET",
  "status": "CLOSED",
  "openingDate": "2019-06-27T08:57:36+02:00",
  "closureDate": "2019-06-27T08:57:51+02:00"
}
  • filters introduced by the user. These filters are:
    • generic widget generic filter
    • period widget date period filter

An example:

{
    "filters": {
        "generic": "filter introduced by the user",
        "period": {"from":"2023-03-27T10:59:27+02:00","to":null}
    }
}
  • callback (optional) function used to send chart data (only when the api/http petitions are promised, use return instead)
callback(chartConfig);

or

callback({
  title: {
    text: 'Referer of a Website',
    subtext: 'Fake Data',
    left: 'center'
  },
  tooltip: {
    trigger: 'item'
  },
  legend: {
    orient: 'vertical',
    left: 'left'
  },
  series: [
    {
      name: 'Access From',
      type: 'pie',
      radius: '50%',
      data: [
        { value: 1048, name: 'Search Engine' },
        { value: 735, name: 'Direct' },
        { value: 580, name: 'Email' },
        { value: 484, name: 'Union Ads' },
        { value: 300, name: 'Video Ads' }
      ]
    }
  ]
});

or

return chartConfig;

Available utils

$api -> use it to create http petitions to OpenGate Api Rest doc

$user -> Logged user

Example:

{
    "email": "email@amplia.es",
    "workgroup": "workgroup",
    "domain": "domain",
    "profile": "profile",
    "countryCode": "ES",
    "langCode": "en",
    "timezone": "Europe/Madrid"
}

$moment -> use it to format date doc

console -> display messages in navigator console

Promise -> allows easy execution of multiple promises

http -> javascript encapsulation of useFetch (Nuxt 4) library doc

echarts -> echarts core library

ecStat -> echarts stats library

addChartEvent -> (event, handler[(event, chartInstance) => {}] [, query]) - adds an event handler doc

Final code structure build by the application

async function main(entityData,timeserieData,filters,page,pageElements,callback) {
  // YOUR CODE HERE WITH RETURN OR CALLBACK
}

Examples