Time Series data timeline
Graphical representation of a time series data timeline.
How it works
This widget facilitates the visualization of value changes in a field over time within a time series.
Each timeline will display the group, the field, and the represented value, arranged as follows:
- Group
- Field
- Value
Grouping
By enabling the grouping of timelines, you can view all represented states on a single timeline (without separation).
When the data is grouped, the representation of the timeline changes, displaying the value on the same timeline, and each bar will contain the following:
- Group
- Field
Resume
With the summary panel, you can observe the total time each value has been maintained.
Widget Menu
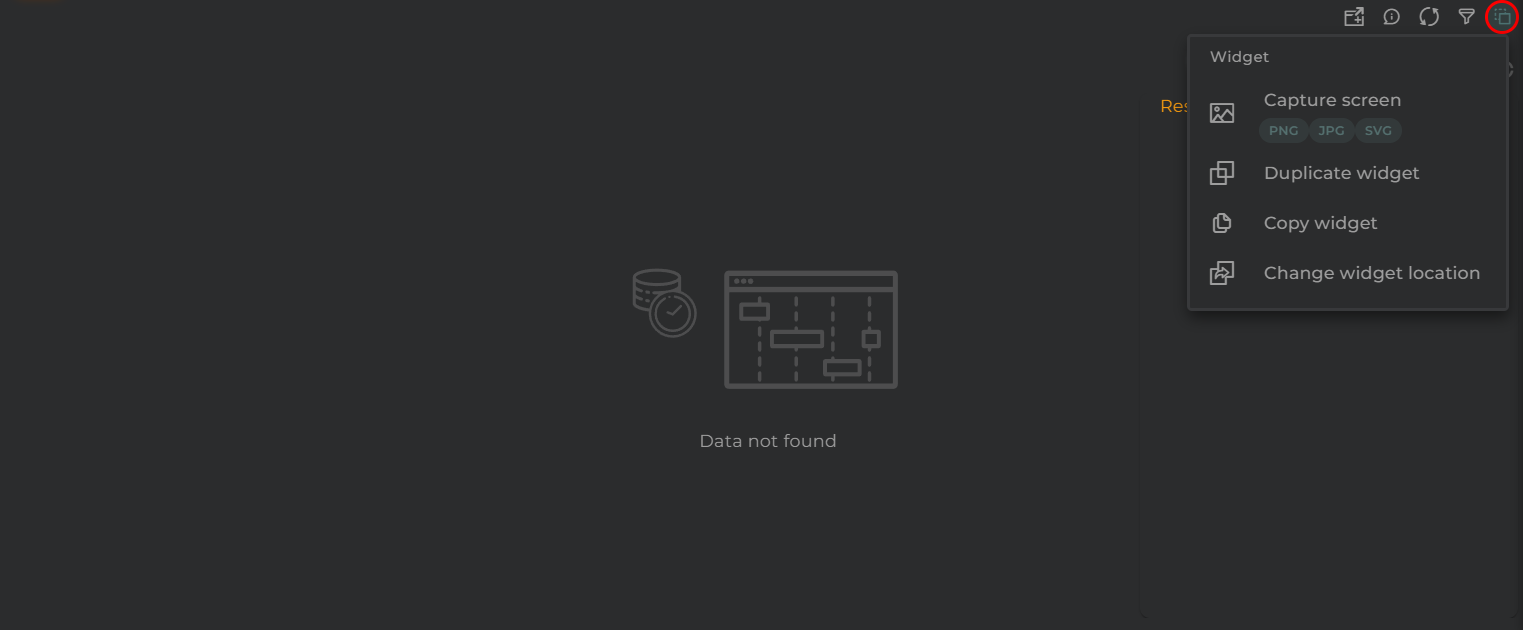
From here, the following actions can be performed:
- Capture screen: Takes a screenshot of the widget.
- Duplicate widget: Creates a duplicate of the widget on the dashboard.
- Copy widget: Copies the widget to another dashboard.
- Change widget location: Moves the widget to another dashboard.
Configuration
General
- Boxed: widget will be displayed with background in dahsboard.
- About: widget description in Markdown format.
- Title: widget title. It can be configured to remain fixed in the widget or only be displayed when it receives focus.
- Toolbar: configures the behavior of the widget bar on the dashboard, allowing you to hide it, hide it when not in use, or leave it always visible.
- Refresh Frequency: allows configuring the data refresh frequency displayed in the list.
- Extra actions: allows user to add new specific actions to the widget with your own code.
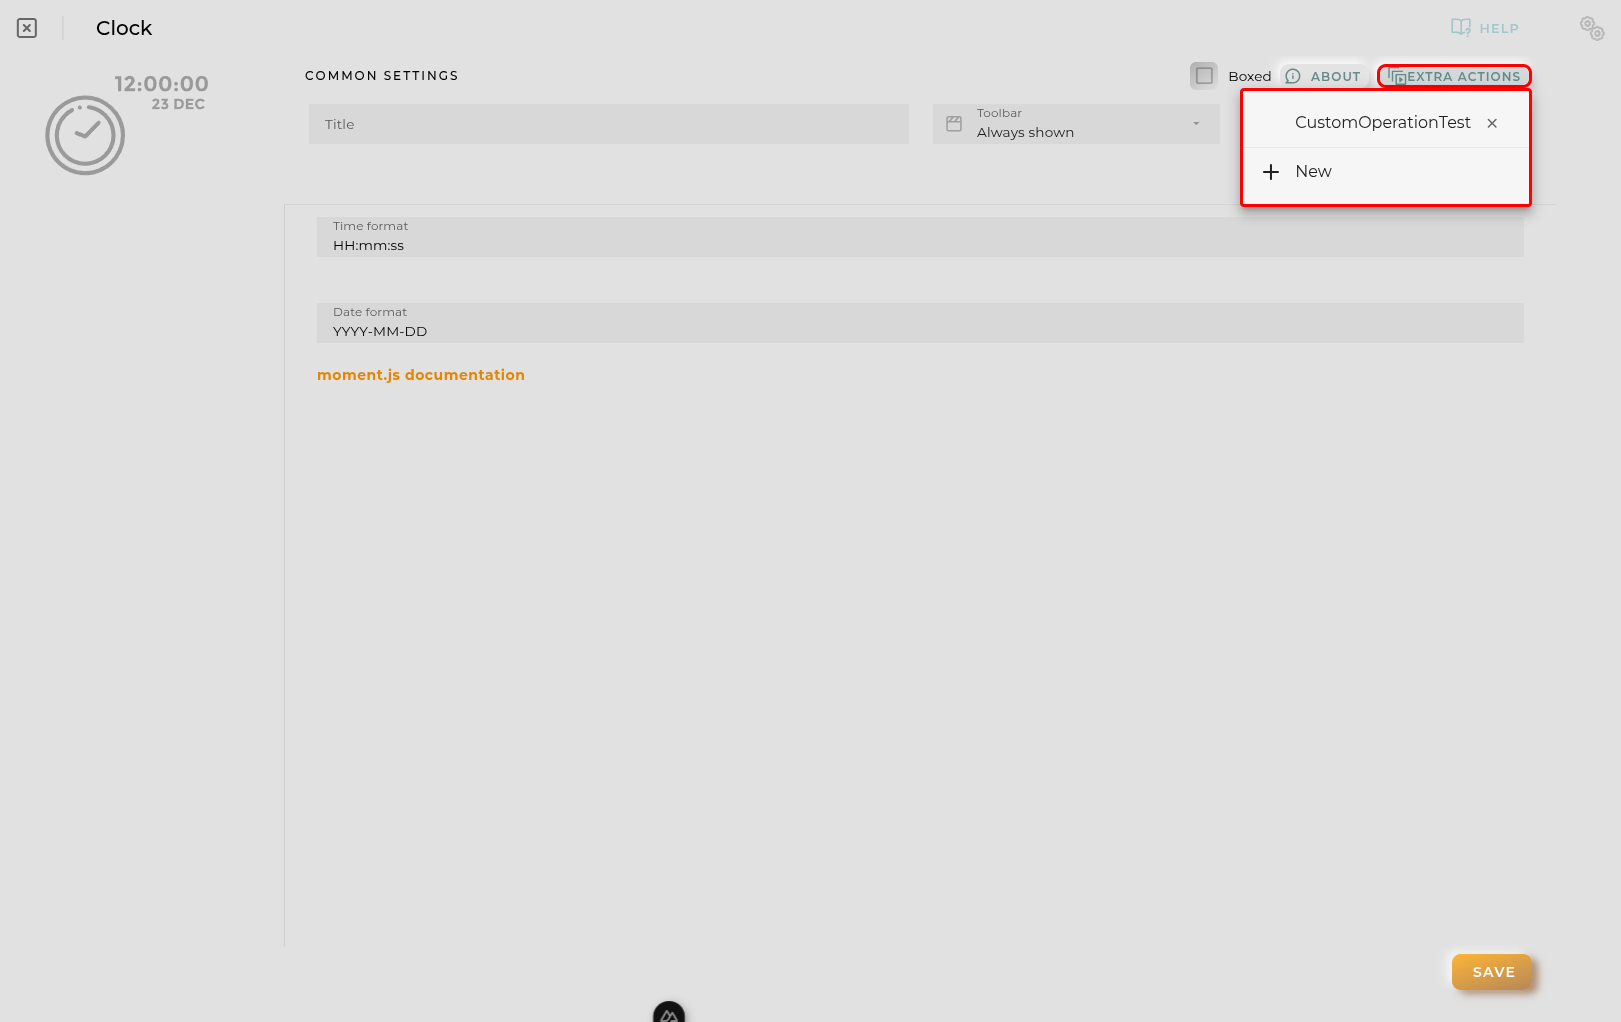
You can add a new one by pressing the New button.
Once you added a custom action it can be modified later by pressing the name in the list.
In order to remove the custom action click the delete icon button on the right.
In extra actions you can write your own code were you can open other dashboards, entities dashboards or execute wizards.
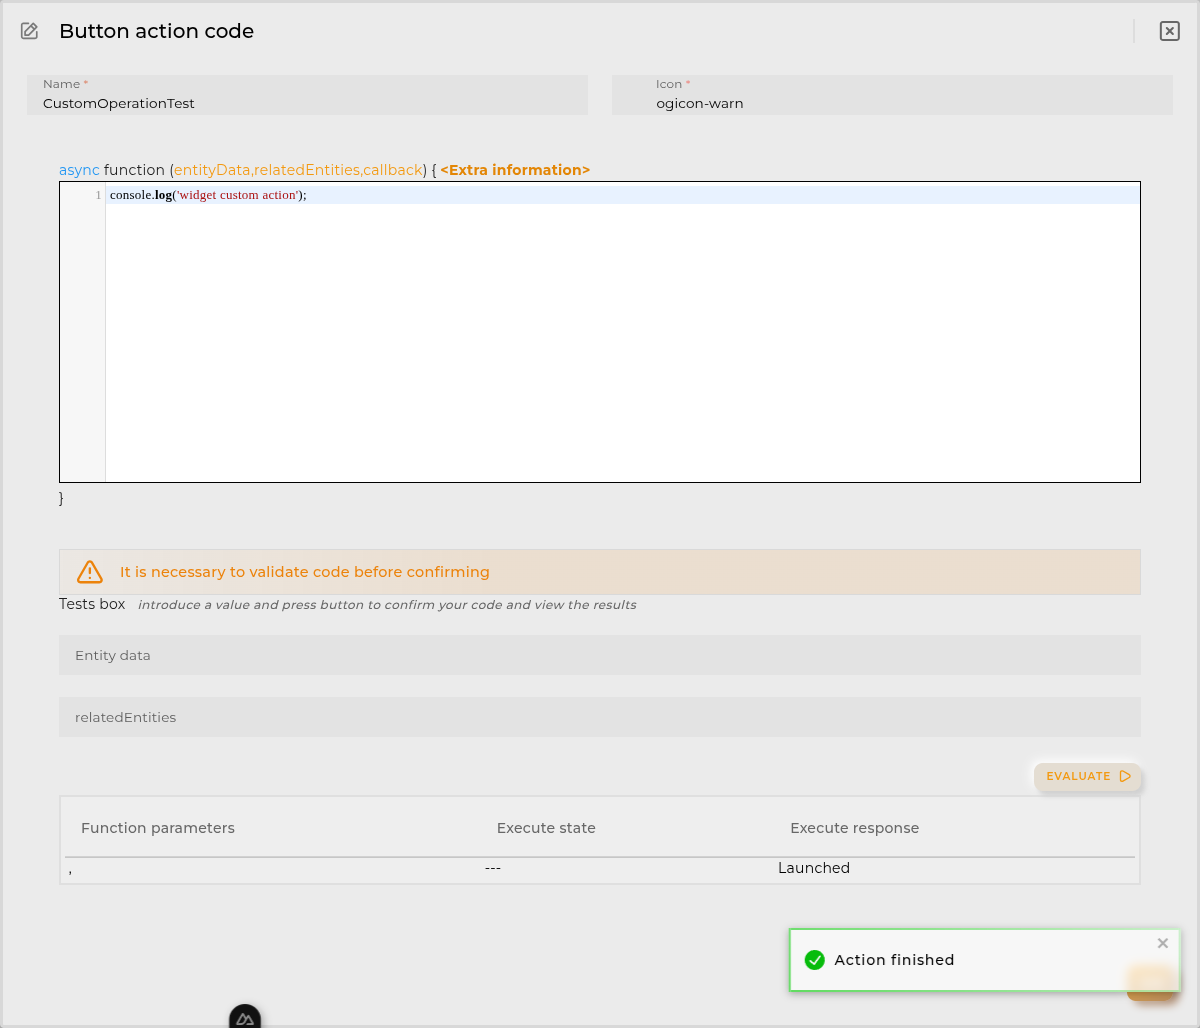
You can find all available functions and methods in Extra parameters
- Organization + Time Series provides data of the time series to be queried.
- Start date field specifies which date-type column should be used to indicate the beginning of the period (*).
- End date field specifies which date-type column should be used to indicate the end of the period (*).
- Identifier field tells the widget which column to use for data grouping.
(*) If both dates use the same field, the start of the next state will be used to calculate the period.
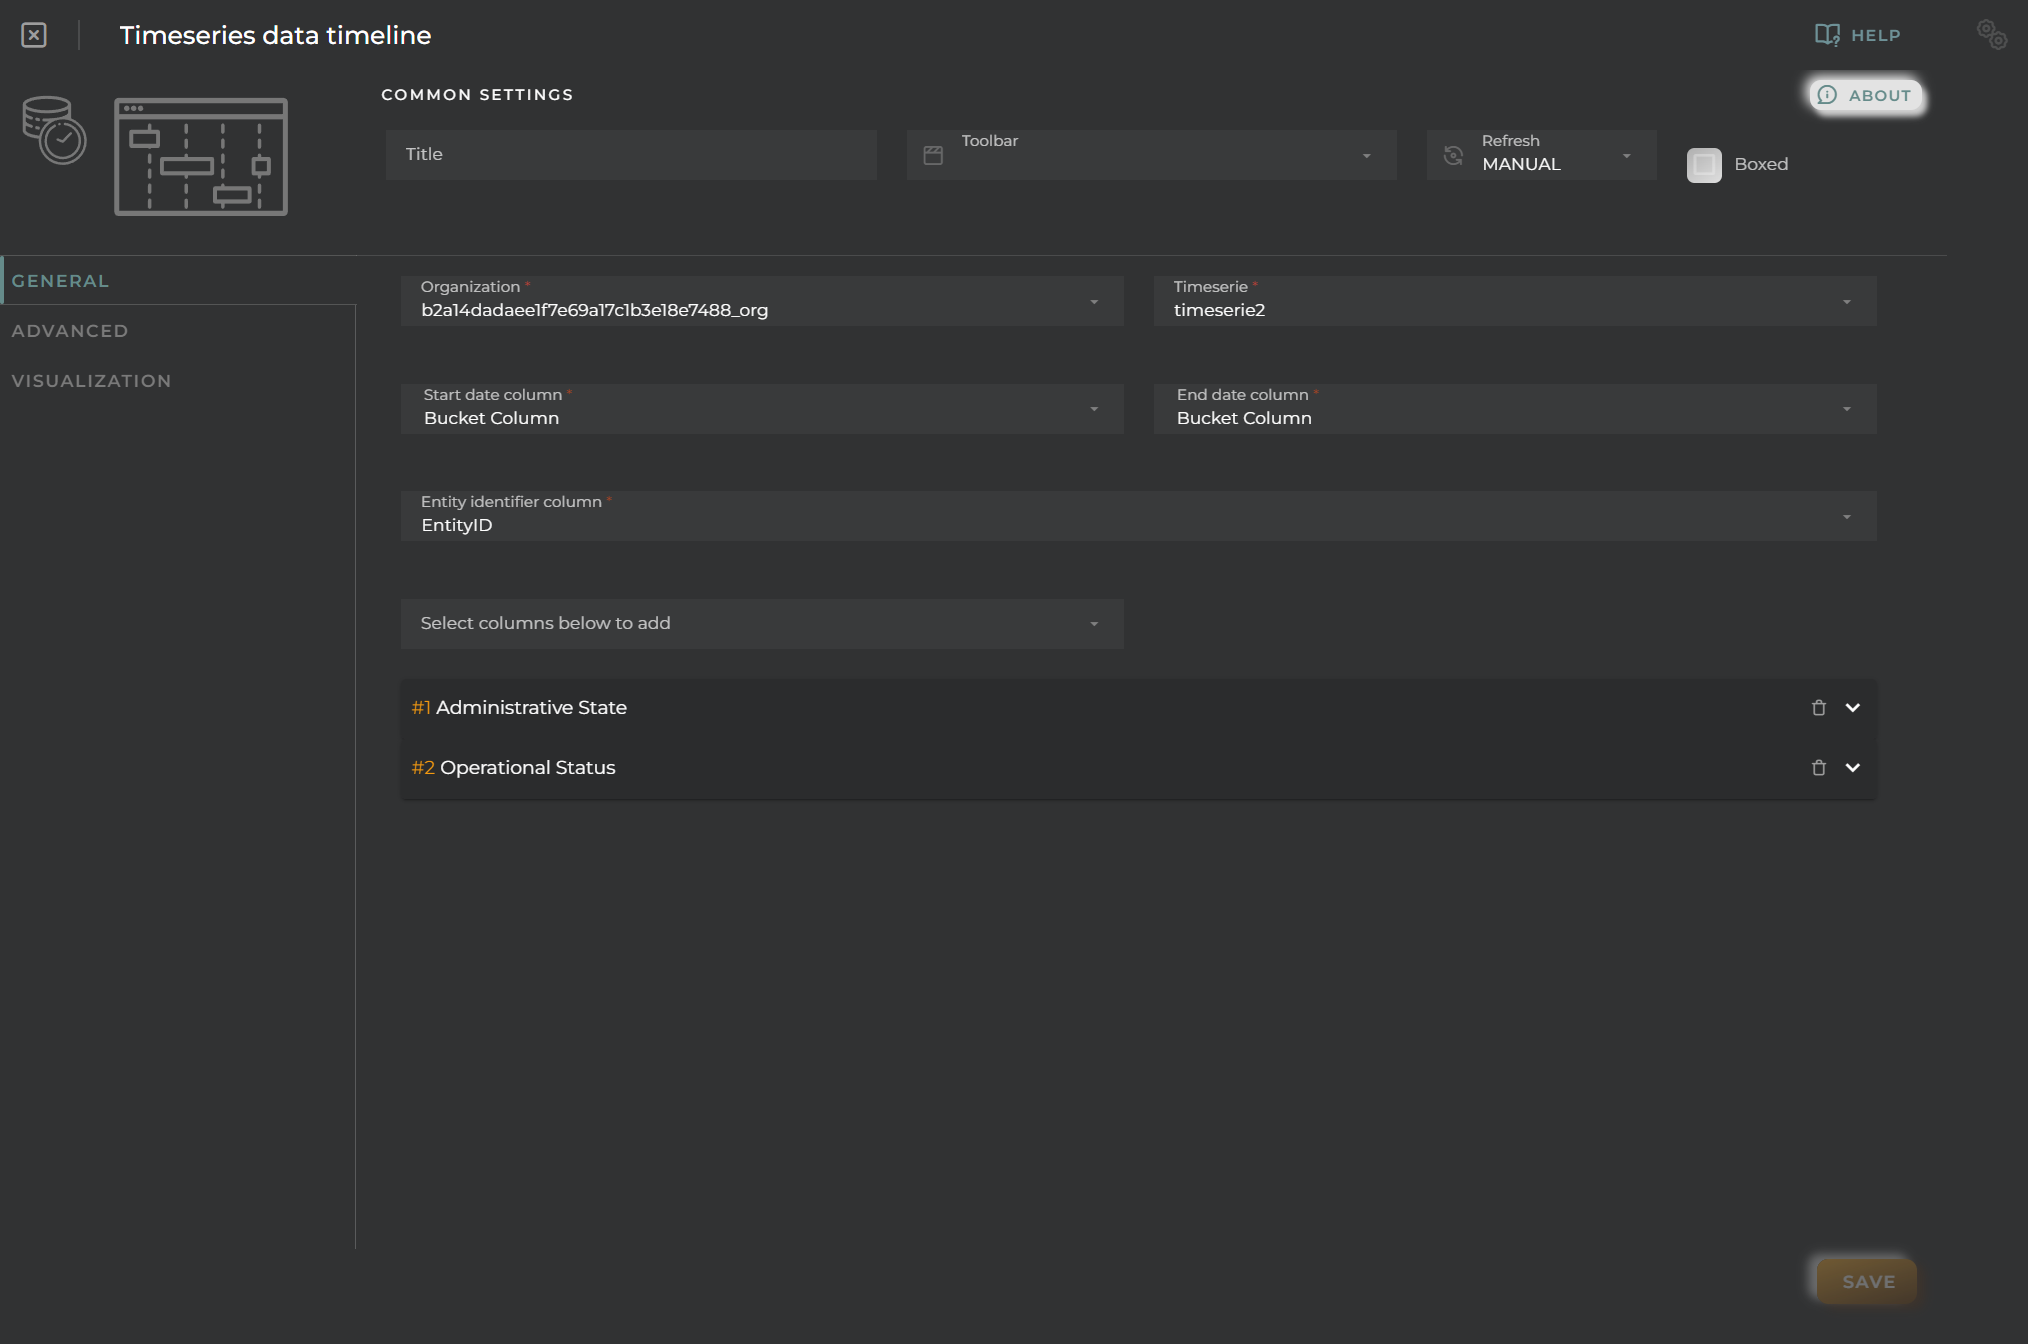
Lastly, columns must be configured to extract data to display on the graph. For each of these and the group/identifier, a graph will be generated.
For each piece of data, the following can be configured:
- Alias specifies a representative name for the column data on the graph.
- Color provides a way to distinguish data within the graph.
- Formatter tool is a tool that treats each piece of data individually, allowing for modifications and/or calculations before displaying it on the graph. For example, you can convert numerical data into discrete data for representation.
- Remove will remove the column from the configuration.
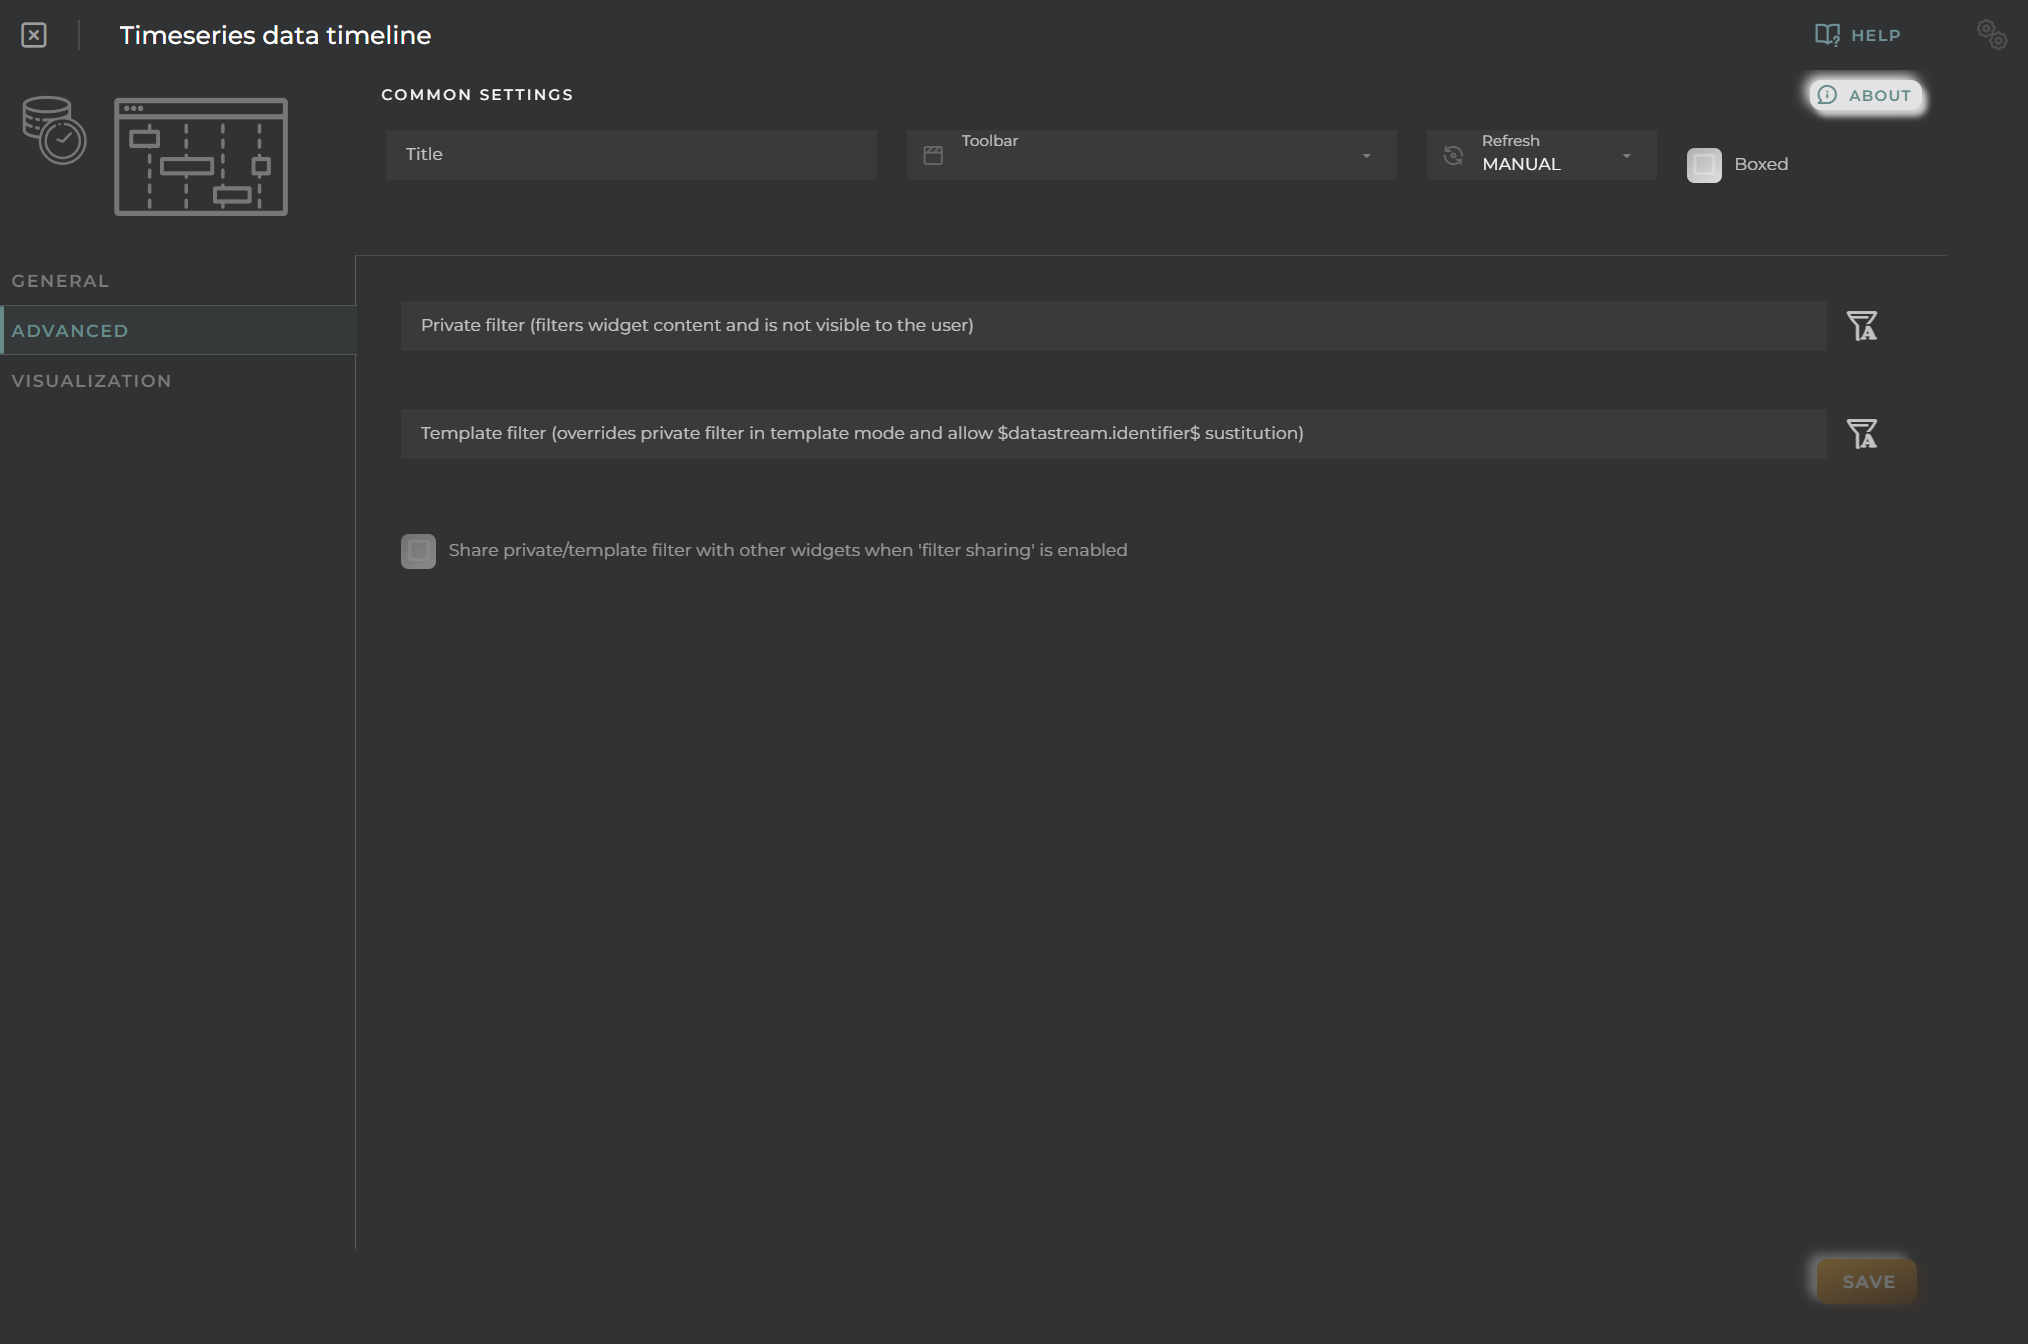
Advanced
In this section, various filters that will be applied to queries will be configured, regardless of what the user may wish to filter subsequently.
Visualization
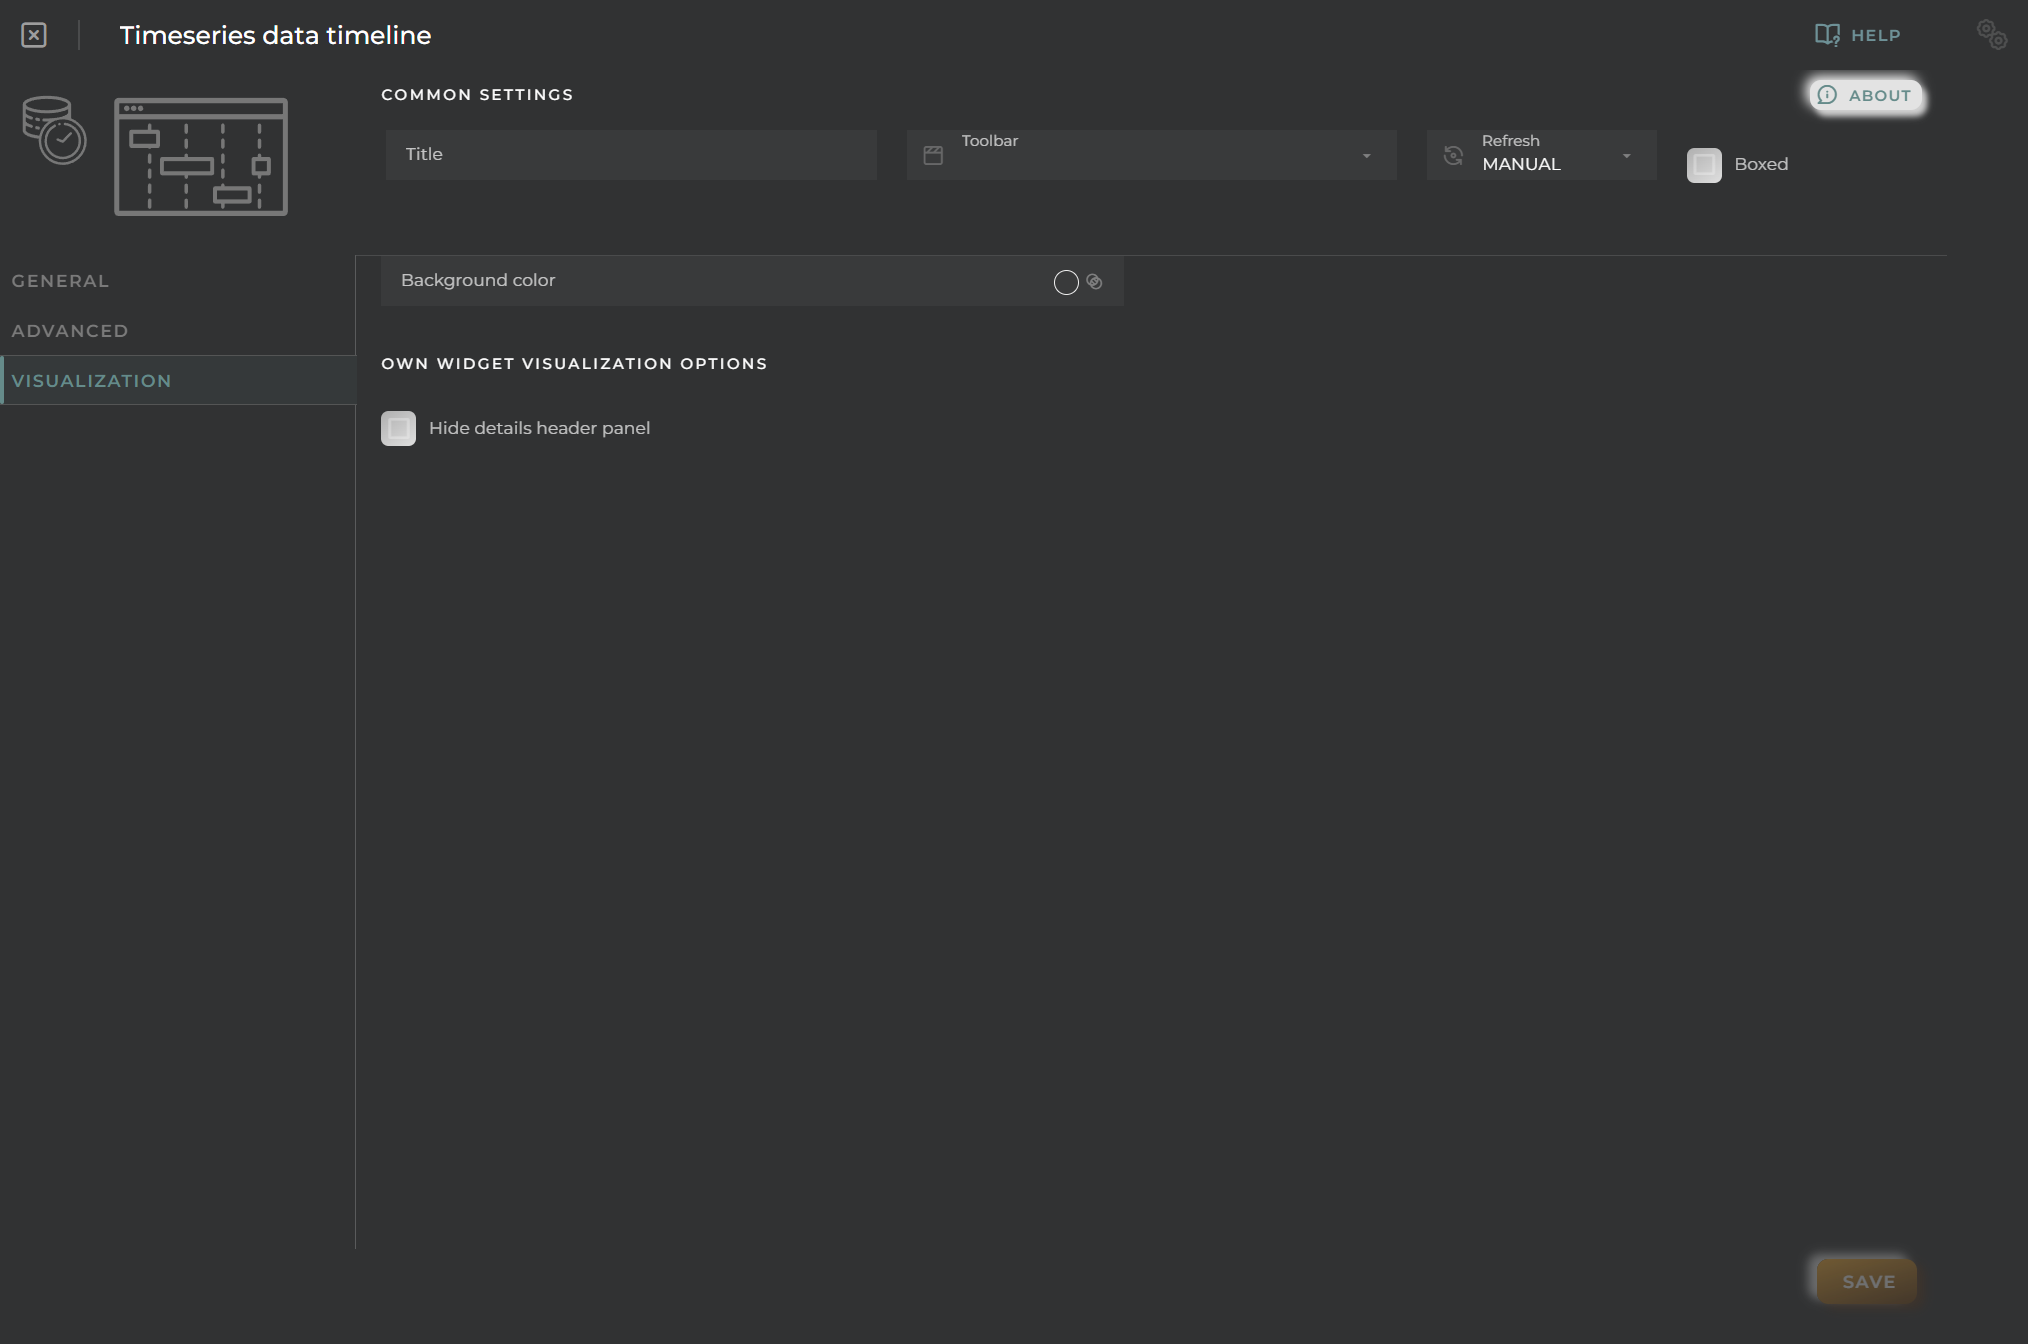
From here, some visual aspects of the widget can be modified.
- Background color allows setting a distinctive color for the widget.
- Hide details header panel hides the top information panel of the widget, freeing up that space.