Summary Chart
This widget displays graphs of summaries provided by the platform.
How it works

This widget facilitates the graphical visualization of summarized data.
Data can be displayed graphically, in table form, or both simultaneously.
Widget Menu
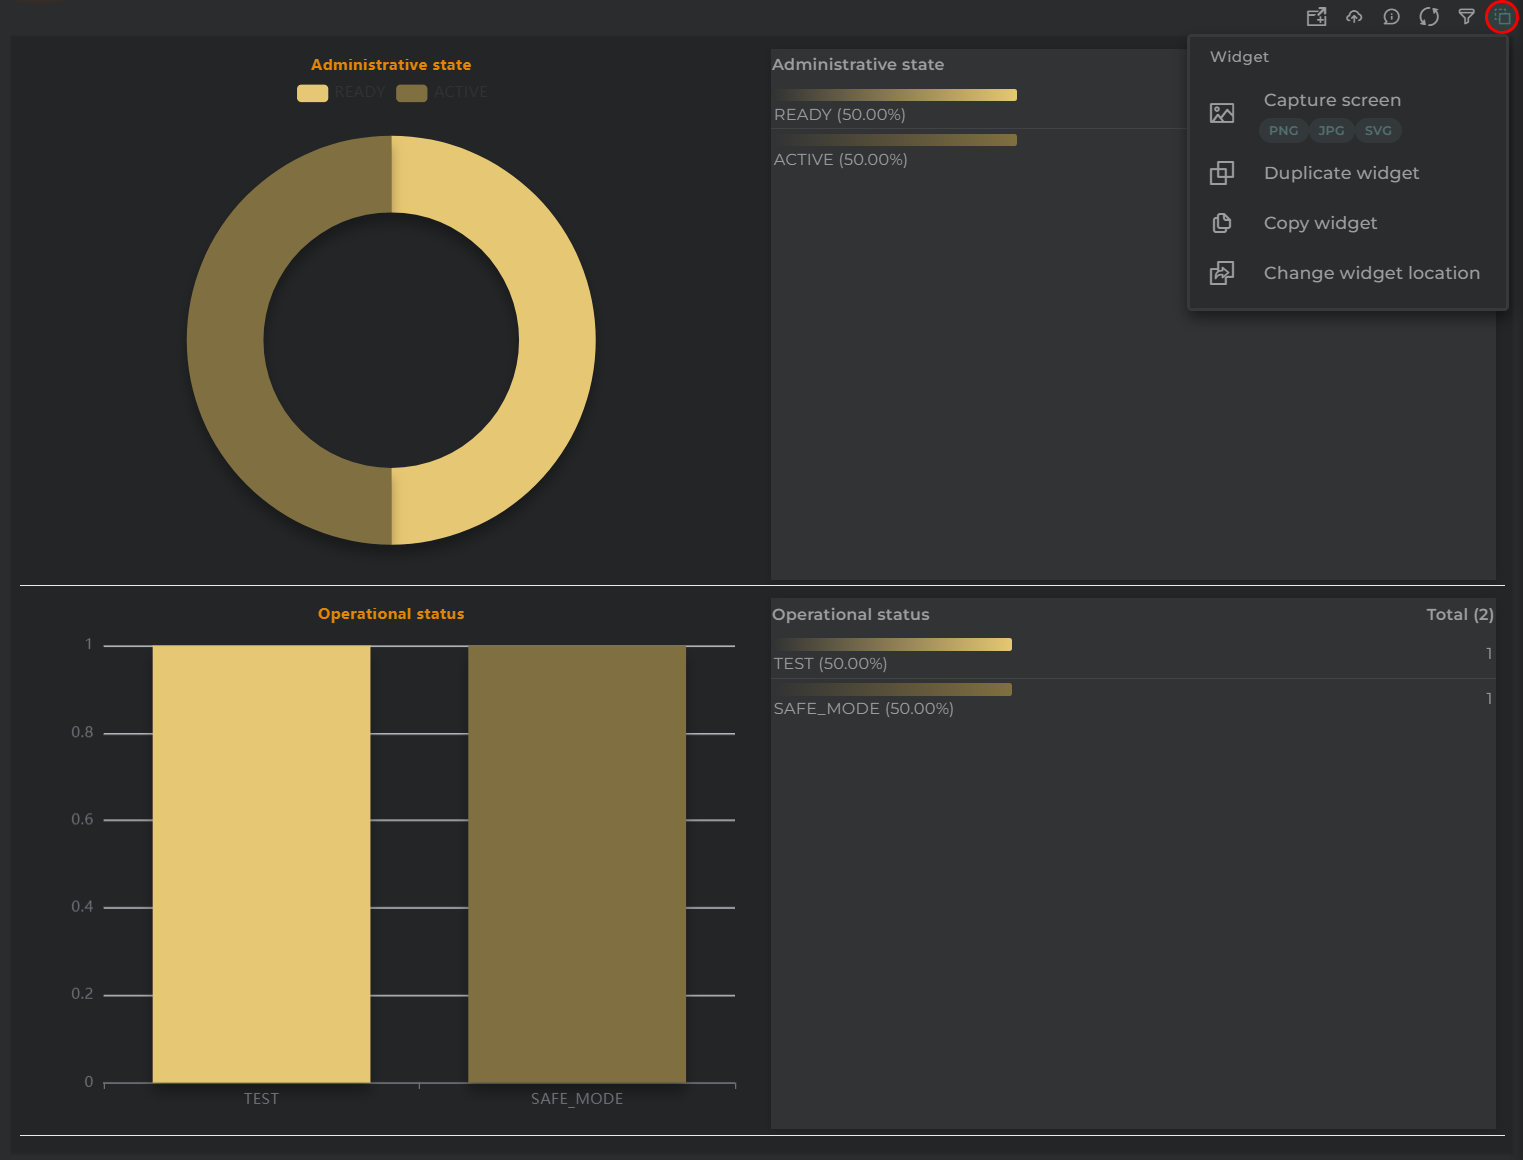
From this section, the following actions can be performed:
- Capture screen: Takes a screenshot of the widget.
- Duplicate widget: Creates a duplicate of the widget on the dashboard.
- Copy widget: Copies the widget to another dashboard.
- Change widget location: Moves the widget to another dashboard.
Widget Filter
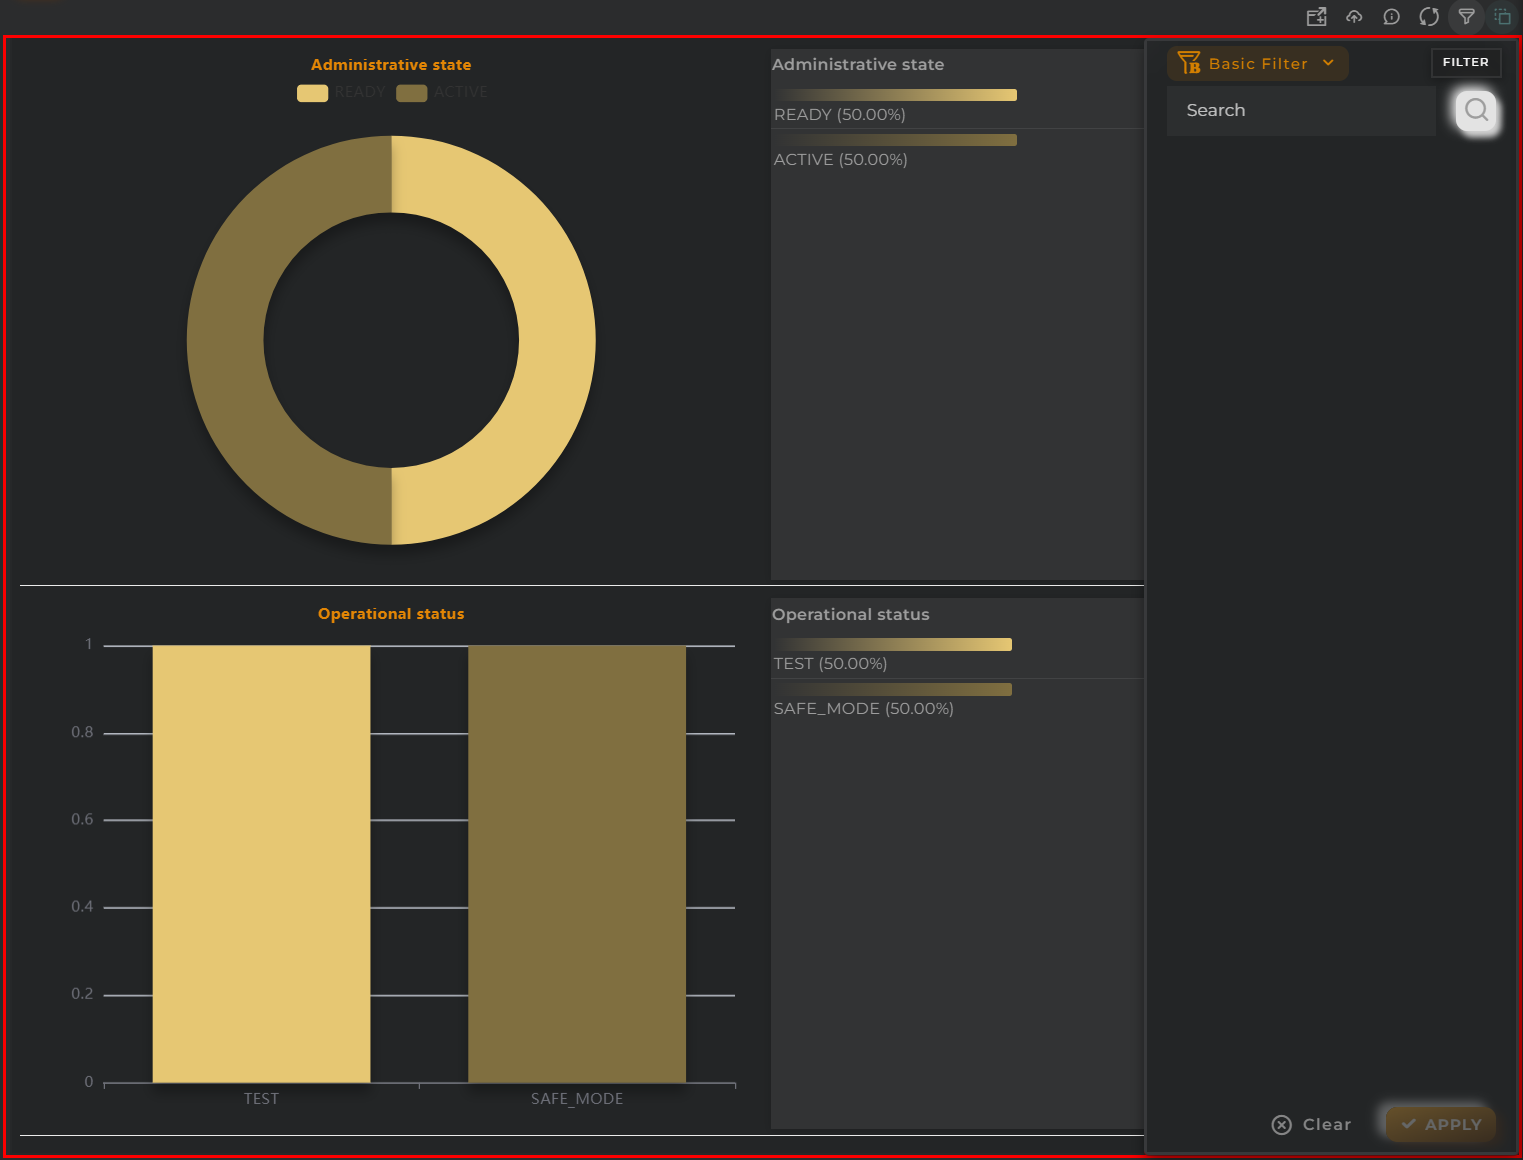
With the filter, one can narrow down the number of results and obtain new metrics.
There are three types of filters: basic, advanced, or linked.
- Basic allows the entry of any text and will filter by predetermined fields.
- Advanced allows configuring a custom filter based on the displayed graph.
- Linked ties the filter with that of another compatible widget, inheriting its query and refreshing both simultaneously.
Configuration
General
- Boxed: widget will be displayed with background in dahsboard.
- About: widget description in Markdown format.
- Title: widget title. It can be configured to remain fixed in the widget or only be displayed when it receives focus.
- Toolbar: configures the behavior of the widget bar on the dashboard, allowing you to hide it, hide it when not in use, or leave it always visible.
- Refresh Frequency: allows configuring the data refresh frequency displayed in the list.
- Extra actions: allows user to add new specific actions to the widget with your own code.
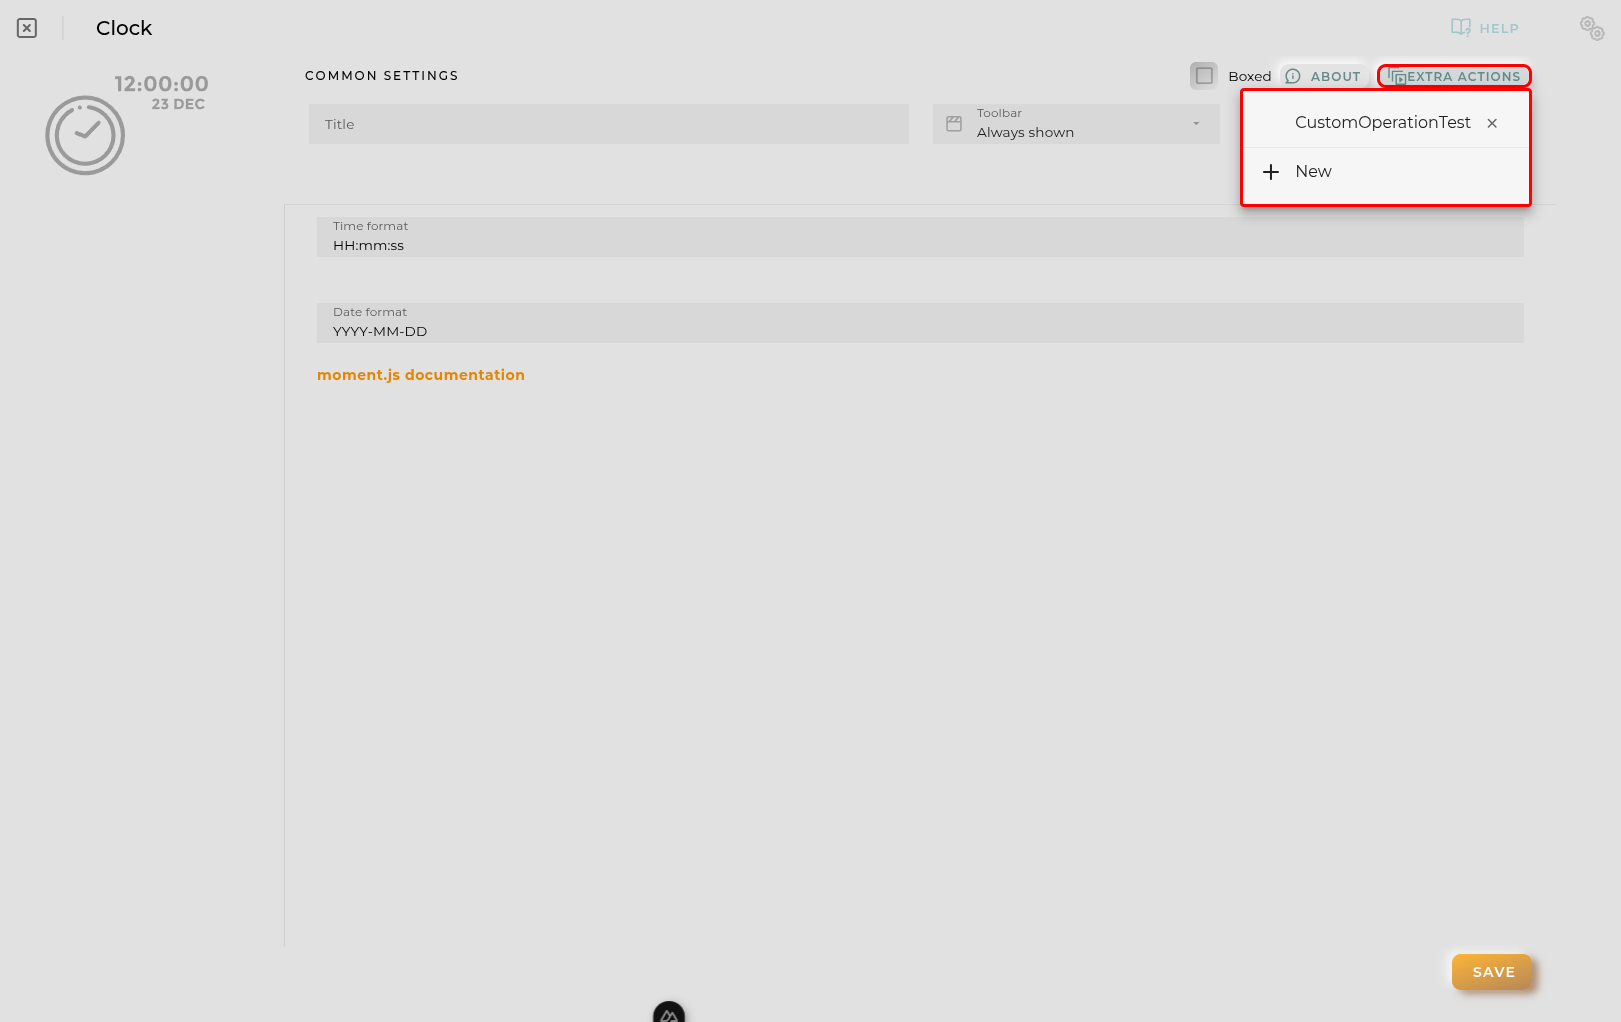
You can add a new one by pressing the New button.
Once you added a custom action it can be modified later by pressing the name in the list.
In order to remove the custom action click the delete icon button on the right.
In extra actions you can write your own code were you can open other dashboards, entities dashboards or execute wizards.
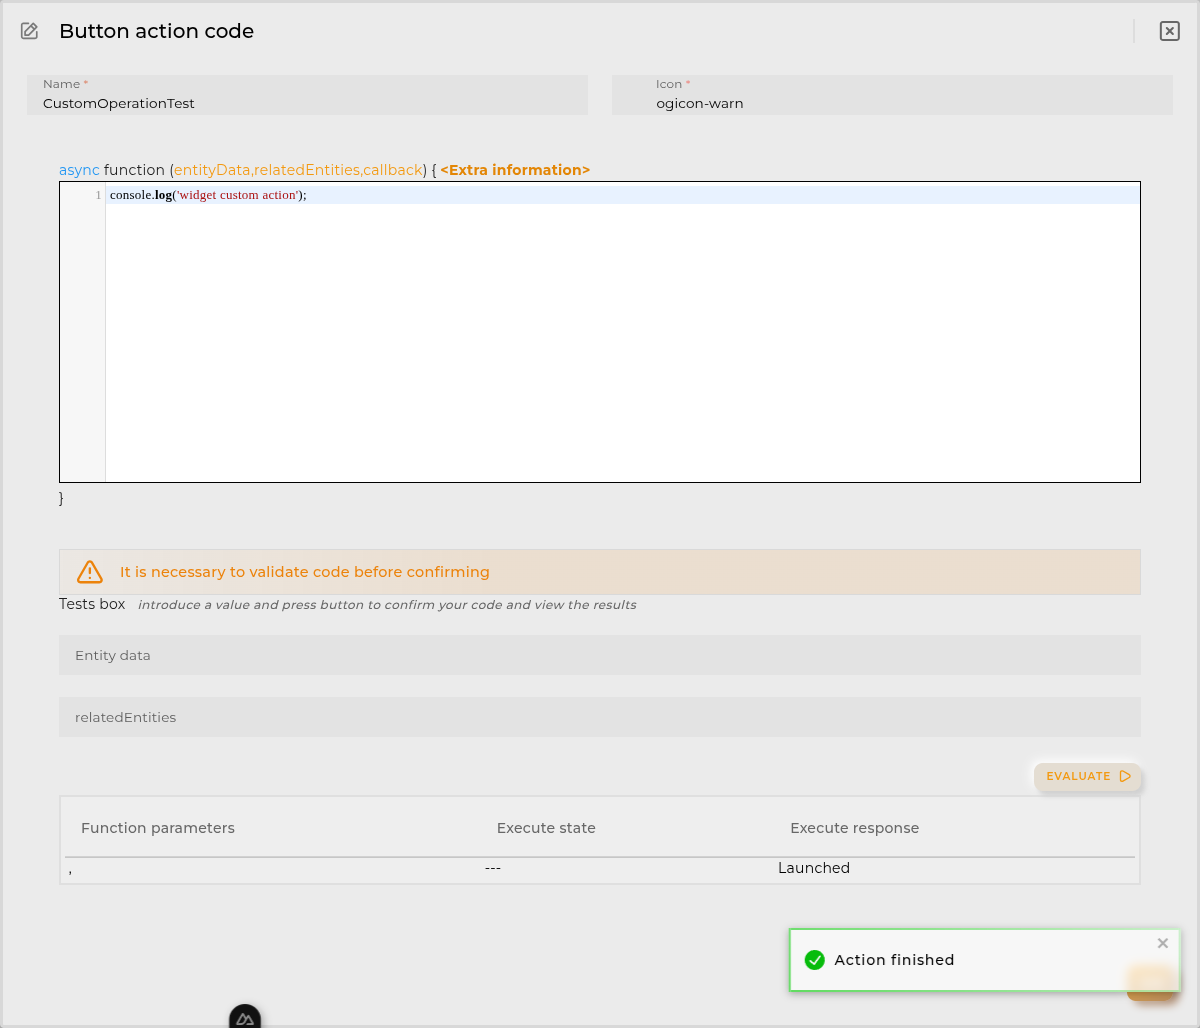
You can find all available functions and methods in Extra parameters
- Summary type allows selection among different types of summaries.
- Summary format specifies the type of representation: graphical, table, or mixed (both simultaneously).
- Table position allows specifying the table’s position in mixed mode.
- Legend enables or disables the display of graph legends and their position.
- Columns number tells the widget into how many columns the graphs should be distributed.
- Style pie chart instructs the widget whether to display pie charts in donut format or regular (no format).
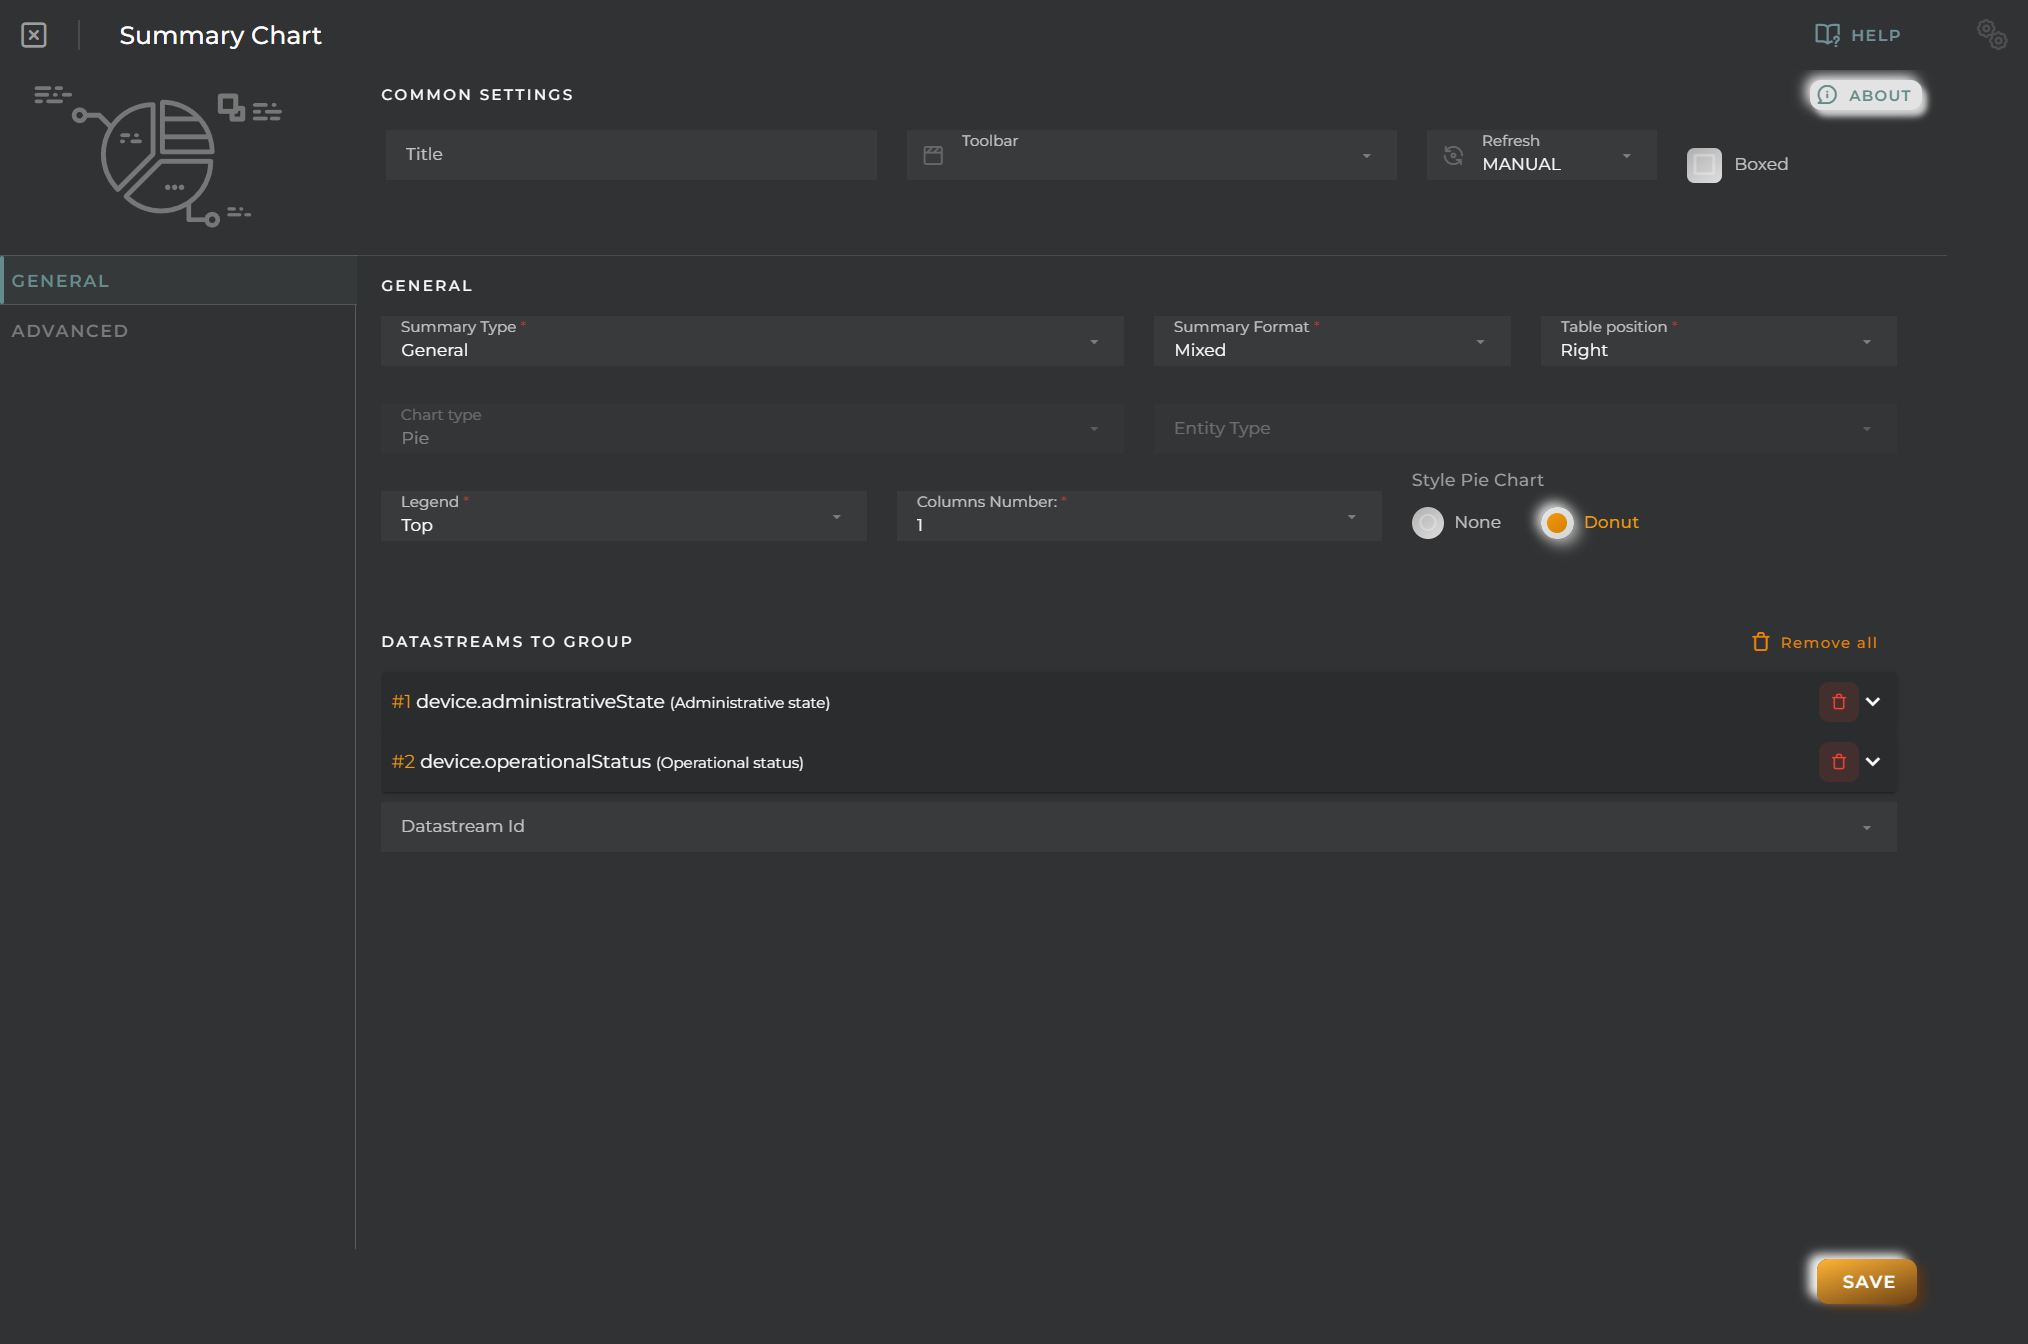
Finally, one must configure the data streams to summarize. The following must be indicated for each:
- Column 1 specifies the type of graph to represent for the selected data stream.
- Column 2, field allows choosing a field within a complex data stream.
- Column 3, alias allows specifying the name of the data stream on the graph.
- Formatter tool is a tool that allows formatting and altering the information returned by the platform to meet specific needs.
- Remove will remove the column from the configuration.
When the summary type is “Entities Values,” additional configuration parameters will be activated. This is because this option calculates graph data based on a sample of the overall entities.
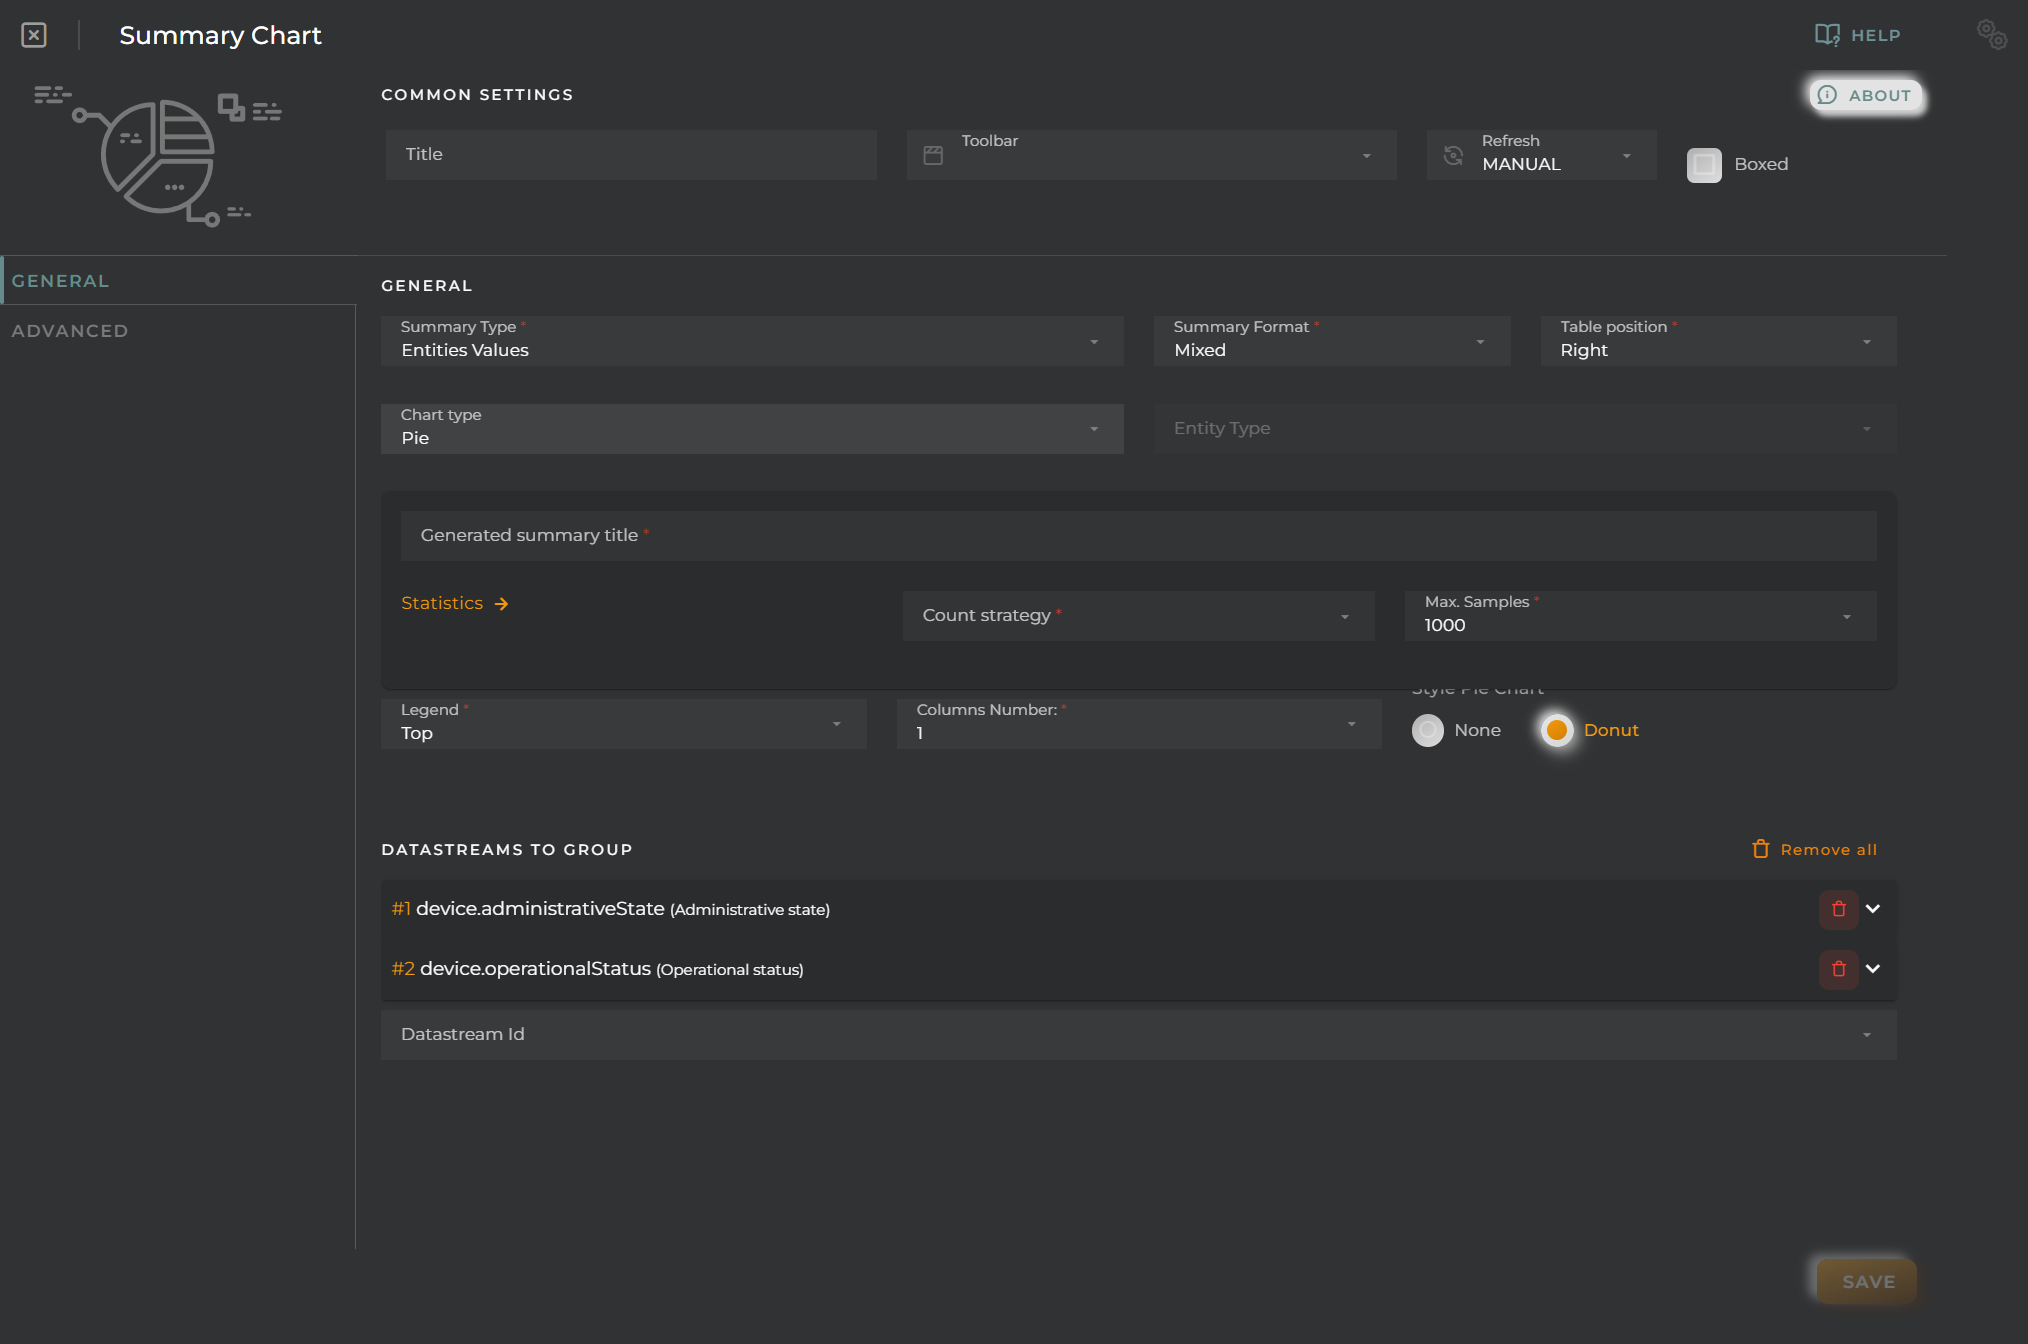
The global chart type field will be activated, and a new panel appears where the following will be configured:
- Generated summary title is the name to display on the generated graph.
- Statistics: count strategy specifies the operation to perform on the read data: total, median, mean, maximum, minimum, variance, and standard deviation.
- Statistics: max samples specifies the number of samples to take for generating the graph.
The list of data streams will indicate on which data the indicated count strategy will act.
Advanced
From here, internal filters that would always apply regardless of user actions can be configured.
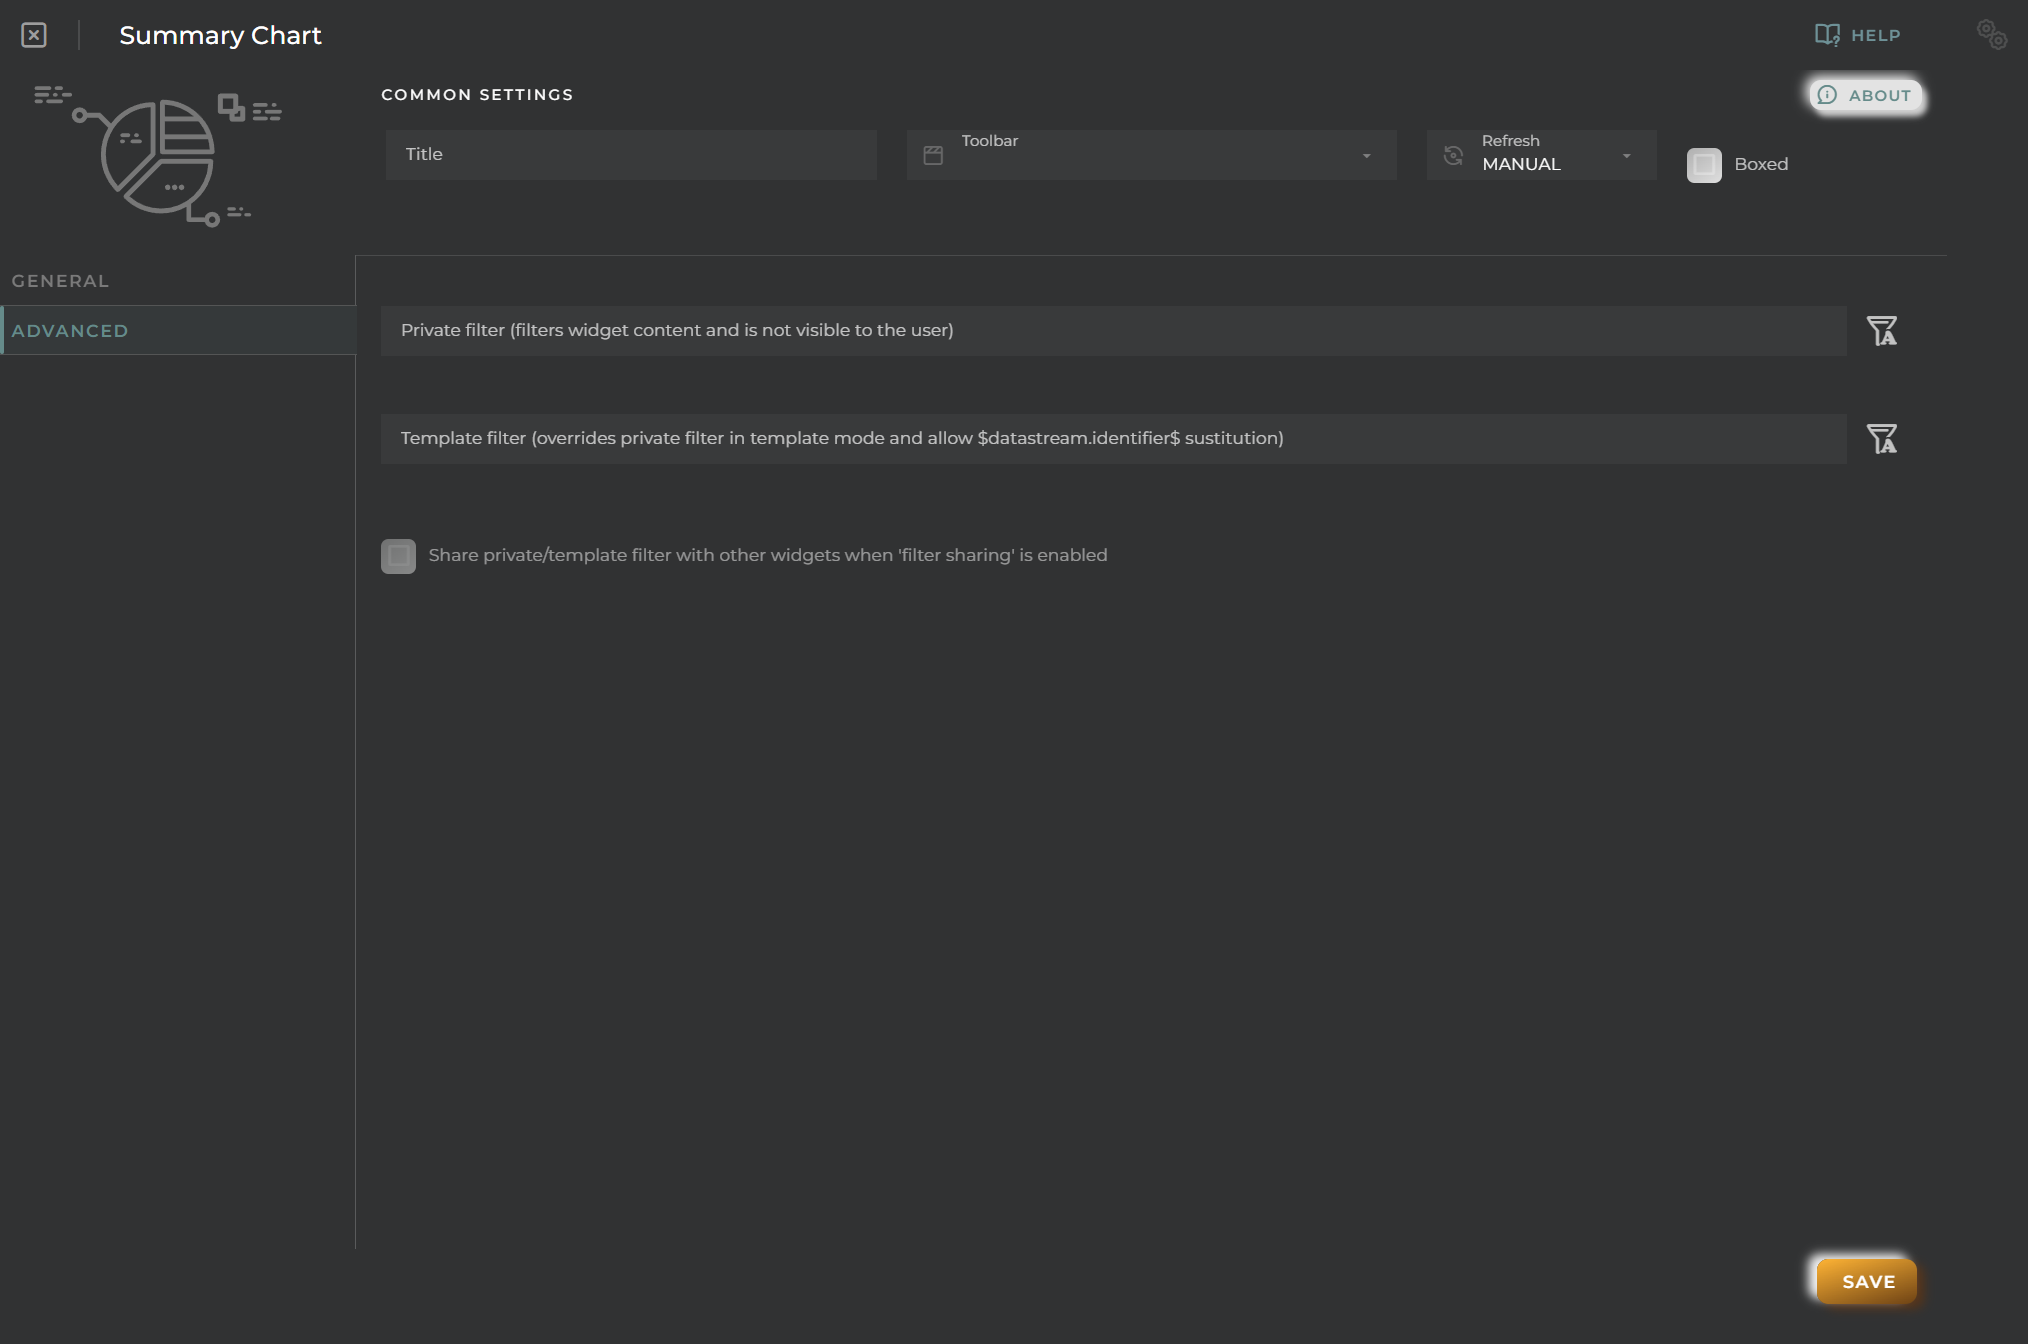
- Private filter will always execute unless there is a template filter.
- Template filter allows configuring a filter that will overwrite the private one when the dashboard opens in a temporary template.
- Share filter tells the widget to share the private/template filter when this widget is selected in another widget via linked filter.