OpenGate is a comprehensive IoT platform designed to enhance the integration and management of your Internet of Things (IoT) infrastructure. IoT infrastructures can include many components, such as sensors, assets, devices, mobile (SIM cards), and non-mobile (LoRa, LoRA WAN) communication subscriptions. OpenGate lets you control your IoT ecosystem by streamlining data delivery to your business processes.
Development Philosophy
The development team behind OpenGate strongly emphasizes providing loosely coupled services with high interoperability. To achieve these objectives, the team has embraced the REST architectural style, complemented by standardized MIME types. This strategic choice ensures that OpenGate’s programming interfaces can easily interact with various programming languages and tools. A prime example of such a tool is the versatile curl, which offers simplicity and power on the command line interface, making it an excellent choice as a playground for interacting with RESTful services.
OpenGate API
At the core of its offering, the OpenGate API is an HTTPS-based service that follows the REST principles. This API facilitates the seamless integration of external applications with the diverse services provided by the OpenGate platform. Doing so extends the platform’s capabilities and enables users to customize and enhance their IoT solutions effectively.
RESTful services are instrumental in this context, providing a flexible and efficient means for systems to communicate, irrespective of the specific programming languages or technologies they utilize. Through this approach, OpenGate ensures that its platform is accessible, versatile, and primed for future expansions and integrations.
Discover the powerful and user-friendly OpenGate UX Web Console, a critical aspect of the OpenGate IoT Platform developed by amplía))) soluciones. Our UX team designed this web console to offer seamless interaction with the OpenGate API and provide an extensive range of features and tools to enhance your IoT experience. The console covers every aspect of IoT management and analysis, from the initial Login to complex Analytics and Device Emulation.
Explore diverse Workspaces with customizable Dashboards featuring a variety of Widgets, from advanced BIM/IFC Widgets to insightful Charts and Maps. Delve into detailed Entity Details, manage multiple entities through comprehensive Listings, and harness the power of Wizards for simplified administration and operations. The console also includes a robust Administration section for efficiently managing entities, organizations, and user settings. Users can simulate real-world scenarios with the device’s emulator and perform analytics for advanced data analysis and predictive modeling. Lastly, ensure optimal system functionality with Operation System Support, keeping track of entities, notices, and incidents.
The OpenGate UX Web Console is your gateway to mastering IoT operations, offering an intuitive and comprehensive environment for managing the full spectrum of IoT tasks and challenges.
OpenGate unifies the entire IoT stack—device management, connectivity, edge processing, automation, security, and analytics—into a single, extensible platform. This means faster deployments, less overhead, and safer operations, especially for heterogeneous, large-scale, or industrial setups.
OpenGate is a comprehensive IoT and IIoT platform developed by amplía))), designed to enable intelligent, secure, and scalable management of connected devices and other entities. Its modular and multiprotocol design allows it to integrate with any type of sensors or entities regardless of the manufacturer and adapt to industries like smart grid, utilities, renewable energy, telecom, manufacturing automation, agriculture, logistics, or smart cities.
🚀 Key Highlights
OpenGate stands out for several cutting-edge features that make it a next-level IoT platform. Here are some highlights:
Multi‑protocol, multi‑vendor architecture: Supports a wide range of technologies (Sigfox, NB‑IoT, LoRa, MQTT, CoAP, Modbus, SCADA) without vendor lock-in
Low-code rules engine: Allows creation of custom workflows and business rules via intuitive GUI, ideal for fast adaptation
Custom dashboards & visual wizards: Users can design interfaces and execute tasks through guided tools
Mass & remote device management: Centralized firmware updates, diagnostics, and bulk operations
Full enterprise integration: RESTful APIs for seamless connection to BI tools, ERPs, CRMs, and core systems
Edge Computing with integrated AI: Enables data processing at the network edge, reducing latency and improving responsiveness, with AI modules for predictive analytics and automation
🌐 Position in the IoT Value Chain
OpenGate covers the complete IoT lifecycle:
At the edge, it ingests data from sensors and gateways and offers its OpenGate Device Agent (ODA)
In connectivity or comms, it manages SIMs and support for LPWAN protocols like NB‑IoT, LoRa, Sigfox and others
In the core Opengate IoT Platform, it handles device lifecycles, rule-based automation, multi-tenant isolation, offers data analysis using AI and is based on robust security
In the business processes, it exposes bidirectional data integration via RESTful APIs for interaction with BI, ERP, CRM, and other systems—enabling intelligent, scalable IoT ecosystems or business processes
🆚 Compared to Other IoT Platforms
Compared to other IoT platforms, OpenGate offers:
A hybrid edge–cloud architecture in one platform for high critical solutions and infrastructures, including advanced analytics capabilities at the edge
Broader protocol support, including LPWAN and industrial protocols that other platforms don’t include by default
A low-code GUI rules engine, versus script-based or function-based. This feature is integrated in the product
Native custom workspaces and dashboards and visual wizards, without needing external tools and allowing to use low-code to fully personalize them
Built-in bulk device management, versus separate modules on other platforms
Multi-tenant microservices, flexible deployment, and strong security—all provided out of the box
Private instance option, it is possible to deploy your own OpenGate cloud instance or even install it on premises on your own infrastructure
Other platforms from high positioned vendors (like AWS or Azure) excel in cloud-native breadth and analytics but generally require more complex assembly (e.g., Lambda, Greengrass, Power BI). OpenGate, by contrast, is optimized for heterogeneous industrial environments with hybrid deployment needs
✅ Why Choose OpenGate?
Modular & future-proof: Vendor-agnostic, edge-ready, adaptable to any industry
Enterprise-grade: Multi-tenancy, security, and lifecycle management ready to deploy tens or millions of devices
Operational efficiency: Bulk provisioning and automated workflows using API connectors reduce manual load
Developer & integrator friendly: REST APIs and JS extensibility, ideal for full-stack integration and customizations
Out-of-the box solution: Predefined sections, widgets, and catalog rules and operations to work with your data and devices from the first login
Low-code friendly: GUI wizards deliver fast configurations for technical and non-technical users
OpenGate architecture
OpenGate Architecture Overview
OpenGate’s architecture is designed to be modular, scalable, and highly interoperable, making it ideal for managing complex IoT and IIoT ecosystems. Here’s a technical breakdown of its core components and how they interact:
From the OpenGate architecture perspective we like to talk about a journey from south to north, where south are devices or monitored entities and where north is the OpenGate IoT Platform and its capabilities. The following sections go deeper in each component
1. Core SBI (Southbound Interface)
This layer comprises sensors, actuators, and gateways in the field or the Edge. Devices communicate via various protocols like: Sigfox, LoRa, NB‑IoT, Modbus, SCADA, or MQTT—feeding data into the platform through the connector factory.
On-site, it is possible to deploy the OpenGate Device Agent (ODA) which runs lightweight edge processing: data collection, normalization, command execution, and optional AI capabilities. This local computation reduces latency and supports autonomy for critical IIoT solutions and also allows communication with non-IP-based protocols like Zigbee, RS-232, RS-485, and other, to OpenGate.
🏗️ Smart Metering devices
As part of the amplía))) commercial strategy, for the last years our tech team works harder to integrate different Smart Metering Manufacturers protocols and devices.
The following table summarizes the currently integrated manufacturers:
⚡Electricity
💧Water
🔥Gas
ELPRO
Amper WM‑Bus Concentrator
Pietro Fiorentini [cf(x)]
ITRON
Hidroconta
SagemCom [cf(x)]
ACTARIS
ContaZara
Watertech [cf(x)]
BAER
Spark [cf(x)]
Spark [cf(x)]
ELSTER
UT‑NOXIUM
SIEMENS
SagemCom
LANDIS‑SIEM_METERING
ORBIS
Xiamen Four‑Faith
SACI
ZIV
USYSCOM
STG Prime
NOTE: cf(x) means that this manufacturer is integrated using OpenGate Connector Functions
IMPORTANT : The devices on the table are the most used devices by our customers and new devices can be integrated using the standard ConnectorFunctions capabilities or through our professional services. You just need to ask us.
2. Connector Factory & Network Connectivity Layer
From the Network connectivity, secure transport of data from edge to cloud is managed here. OpenGate supports multiple network and communication channels including SIM-based networks for NB‑IoT and LTE-M, LPWAN (Sigfox, LoRa), and IP protocols (HTTP, MQTT, CoAP). This layer ensures encrypted, bi-directional connectivity, with VPNs (as special request), firewalling, load balancing, and SIM/LPWAN lifecycle management. This SIM lifecycle management is integrated as part of the OpenGate IoT Platform capabilities thanks to our mobile communications providers connectors like Kite.
🔌 Integration Without Limits
OpenGate’s Connector Factory is a cornerstone feature designed to simplify and accelerate integrations in complex IoT ecosystems. It empowers organizations to seamlessly connect external systems, ML/AI pipelines, device fleets, communications services, and more—without needing extensive coding efforts. This layer offers a Plug and play with pre-built connectors for critical systems and services:
SIM / LPWAN management as mention before, via our mobile communication providers connectors, fully integrated with mobile provider networks—simplifying device provisioning and subscription monitoring
Industrial gateways & protocols, including HTTP, MQTT, CoAP, Modbus, and other protocols, facilitating smooth data ingestion from field hardware
Enterprise visibility through BI, ERP, CRM, and cloud applications, thanks to robust HTTP connectors that break down data siloes instantly and allows you to centralize and enrich data gathered in OpenGate or send to another of your business core services
These connectors guarantee secure, two-way communication and are configured visually via the OpenGate UX layer, GUI Web Console
🛠️ Connector Functions
When out-of-the-box doesn’t cut it, Connector Functions - cf(x) let you tailor data flows in minutes using simple JavaScript:
Define criteria—select which messages should trigger your function.
Write logic—parse, enrich, transform, filter, or redirect data to external systems or devices.
Test & deploy—switch effortlessly between Disabled, Test, or Production modes.
Reuse and evolve—import/export configurations or access centrally managed catalog APIs to clone and maintain across environments
📈 Why this Makes the Difference
Speed-to-market: Achieve real-time integrations in hours, not weeks, using pre-built connectors
Custom-savvy: Craft advanced data workflows and transformations with minimal development effort and directly from web console
Centralized integration management: Visualize and control every connector (both standard integrations and Connector Functions) in a unified admin interface
Reusability & deployment consistency: Enable, disable, clone, or update your connector functions with a few clicks, reducing manual errors and enforcement friction. Ideal for CI/CD pipelines and ensuring replicable, version-controlled deployments
3. Core Platform
The OpenGate Core is the brain of the OpenGate IoT platform, and it’s designed to handle the full lifecycle of connected assets for your solution.
In short, OpenGate Core is particularly well-suited for organizations that need end-to-end control, real-time bidirectional response and broad device compatibility without being locked into a single vendor or cloud provider. Its main capabilities are organized in different areas as the next diagram shows:
📦 Data Modeling & Storage
Your entities, your data and your own way. OpenGate offers the possibility to adjust the data collected to your needs and desirable data structure:
Data Modeling: Design flexible schemas for your devices and assets, defining entity types and specific types, data streams, and metadata ensuring structured, consistent data throughout the lifecycle. Use our predefined catalog or create your own
Collection Data Lake: Ingest high-volume data in real time into a robust Data Lake organized using your data models and work with this raw real-time information to explore your entities data
Time Series and Data Sets: Use built-in tools to filter, aggregate, and construct time bucket based “Time Series” for your entities, and Create “Data Sets” for your entities based on the data collected for a custom data view of your entities status information. Use this data structures to build custom dashboards using the OpenGate widgets catalog
This capabilities enable efficient storage and retrieval of historical data with minimal effort, reducing overhead and enhancing analytics readiness.
⚙️ Provisioning & Entity Identification
Tools to help you to populate your devices and digital assets:
Provision tools & Provision Functions: Quickly onboard devices—individually using guided UI flows or custom JavaScript functions to automate validation, multi-entity creation, and configuration steps using low-code javascript powered capabilities.
Entity Identification Service: Automatically generate and assign unique IDs to each device or entity, ensuring reliable tracking and simplified maintenance and detect differences between provisioned and collected data automatically.
Entity types out-of-the-box: Build relationships and define detailed digital twins of your entities by using our devices and assets, and collect the communication modules information using our subscription and subscriber entity types.
Thanks to these tools, you can reduce manual errors, accelerate deployment, and maintain clean inventories even at industrial scale.
⚙️ Operations Engine
OpenGate’s Operations Engine empowers you to automate essential device and asset unitary or massive operations with full control and visibility:
Schedule remote tasks like firmware updates, diagnostics, and routine checks
Trigger operations on-demand (e.g., reboot a device, collect logs) or schedule them
Coordinate custom multi-step workflows tied to asset lifecycles
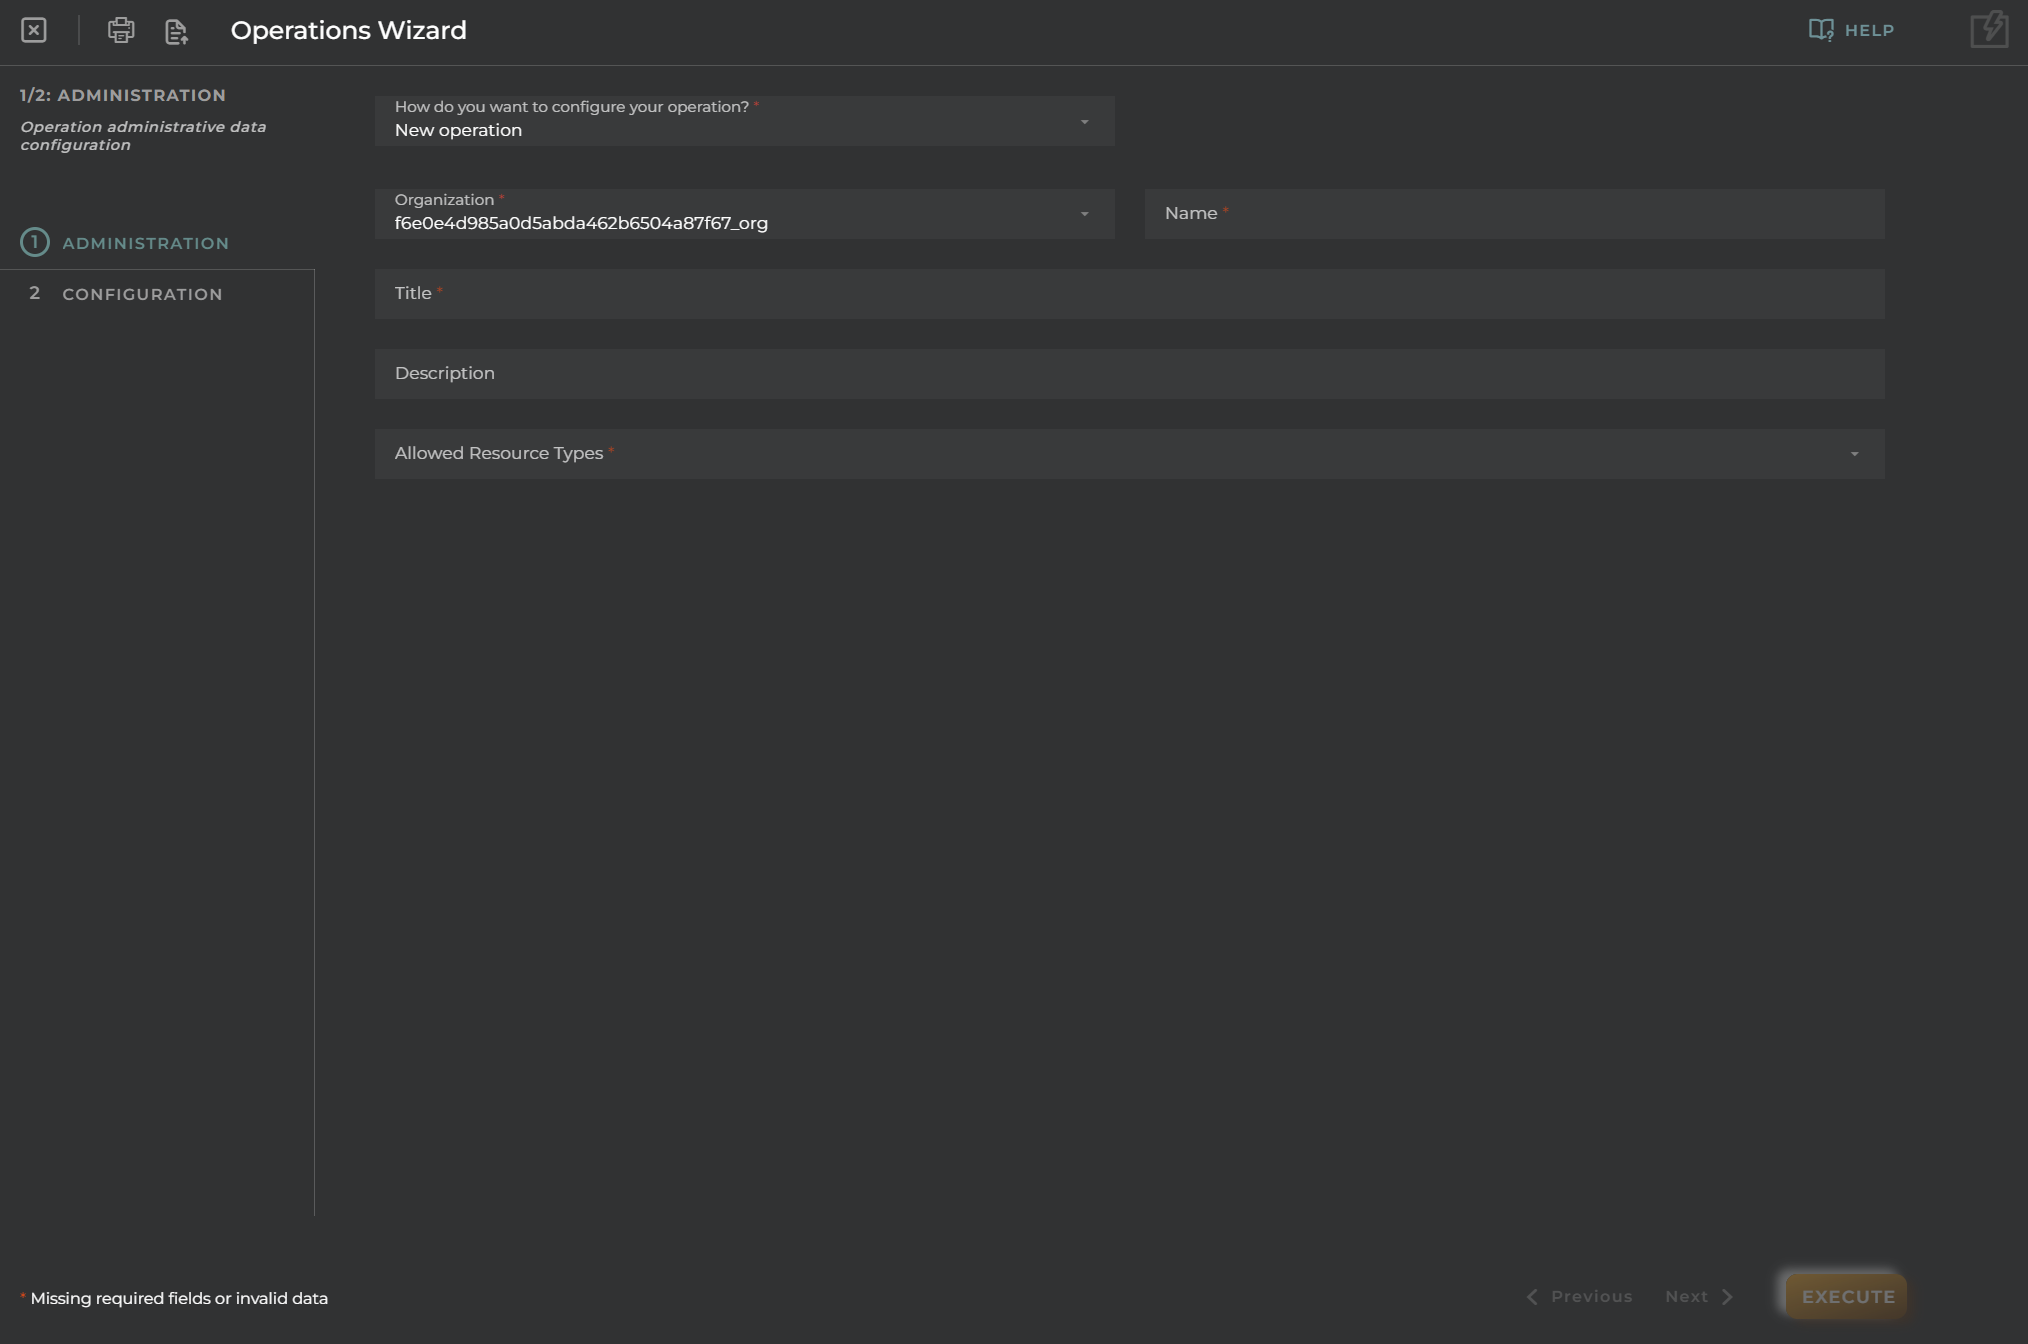
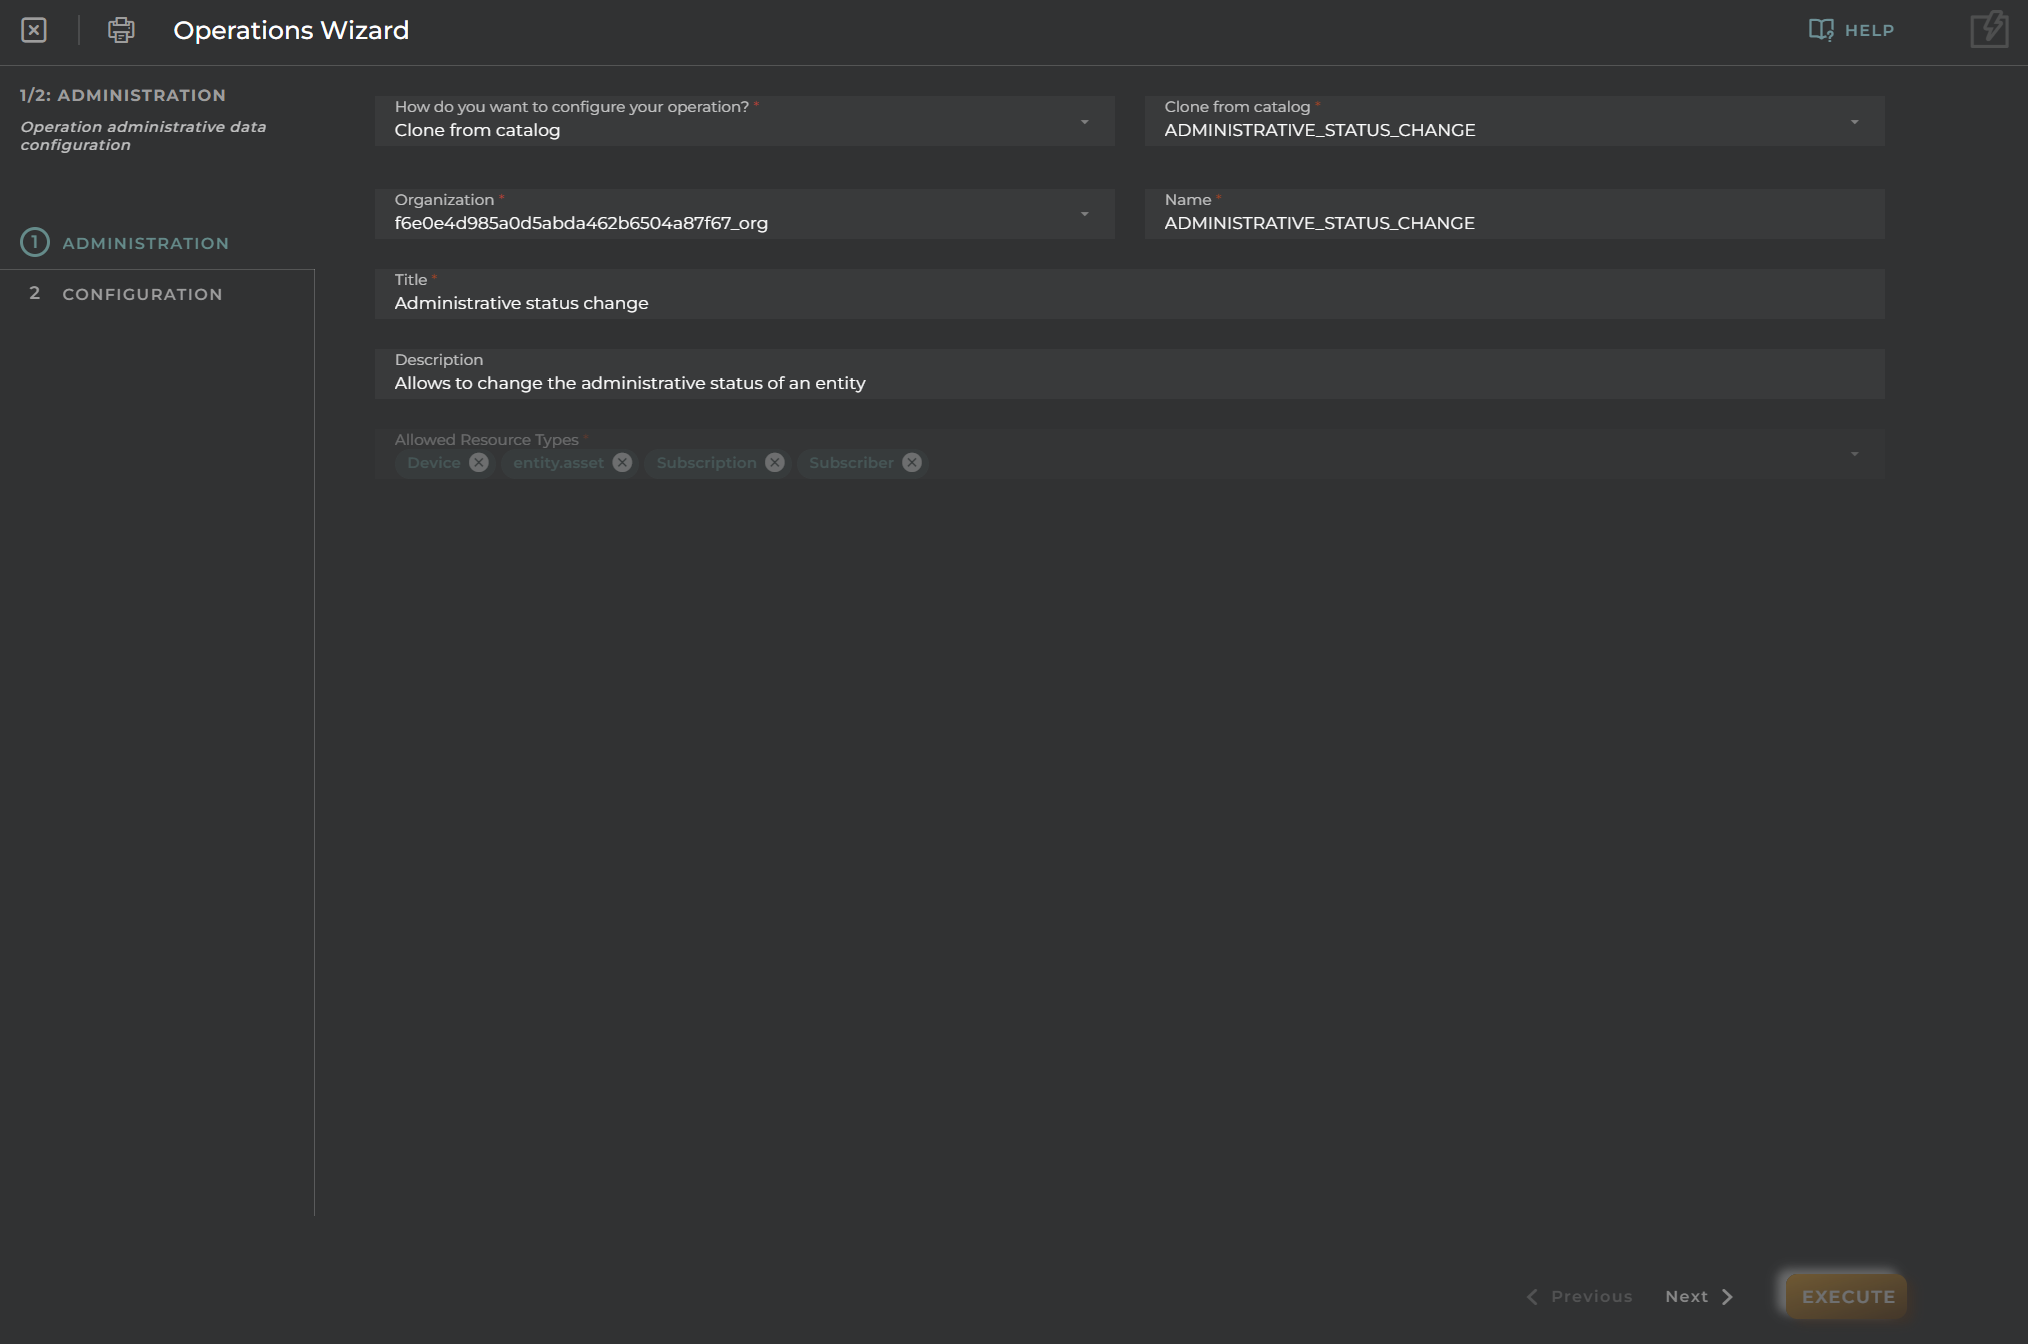
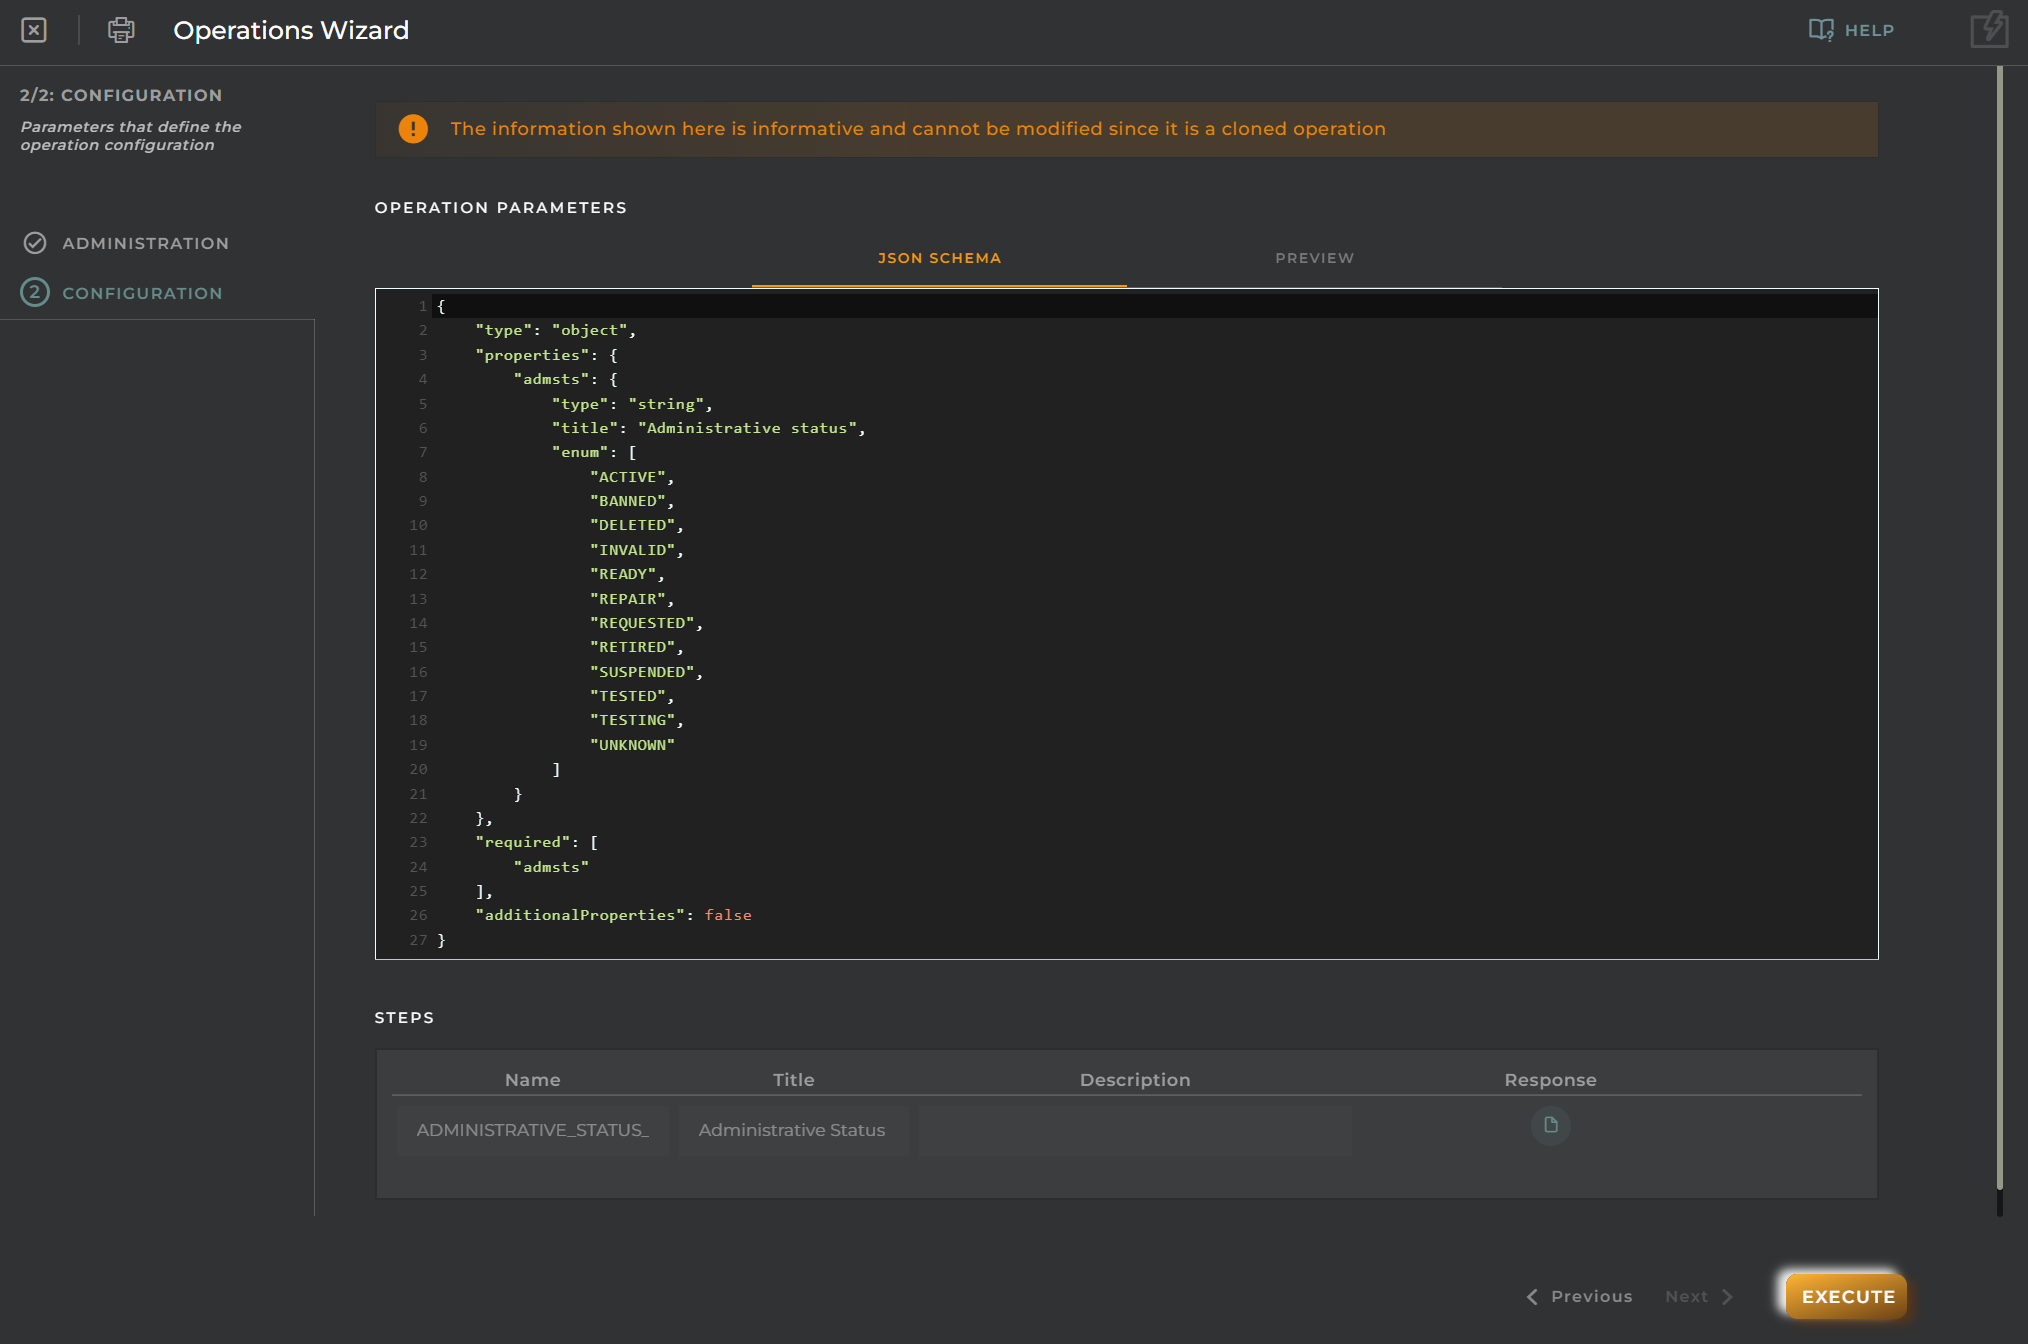
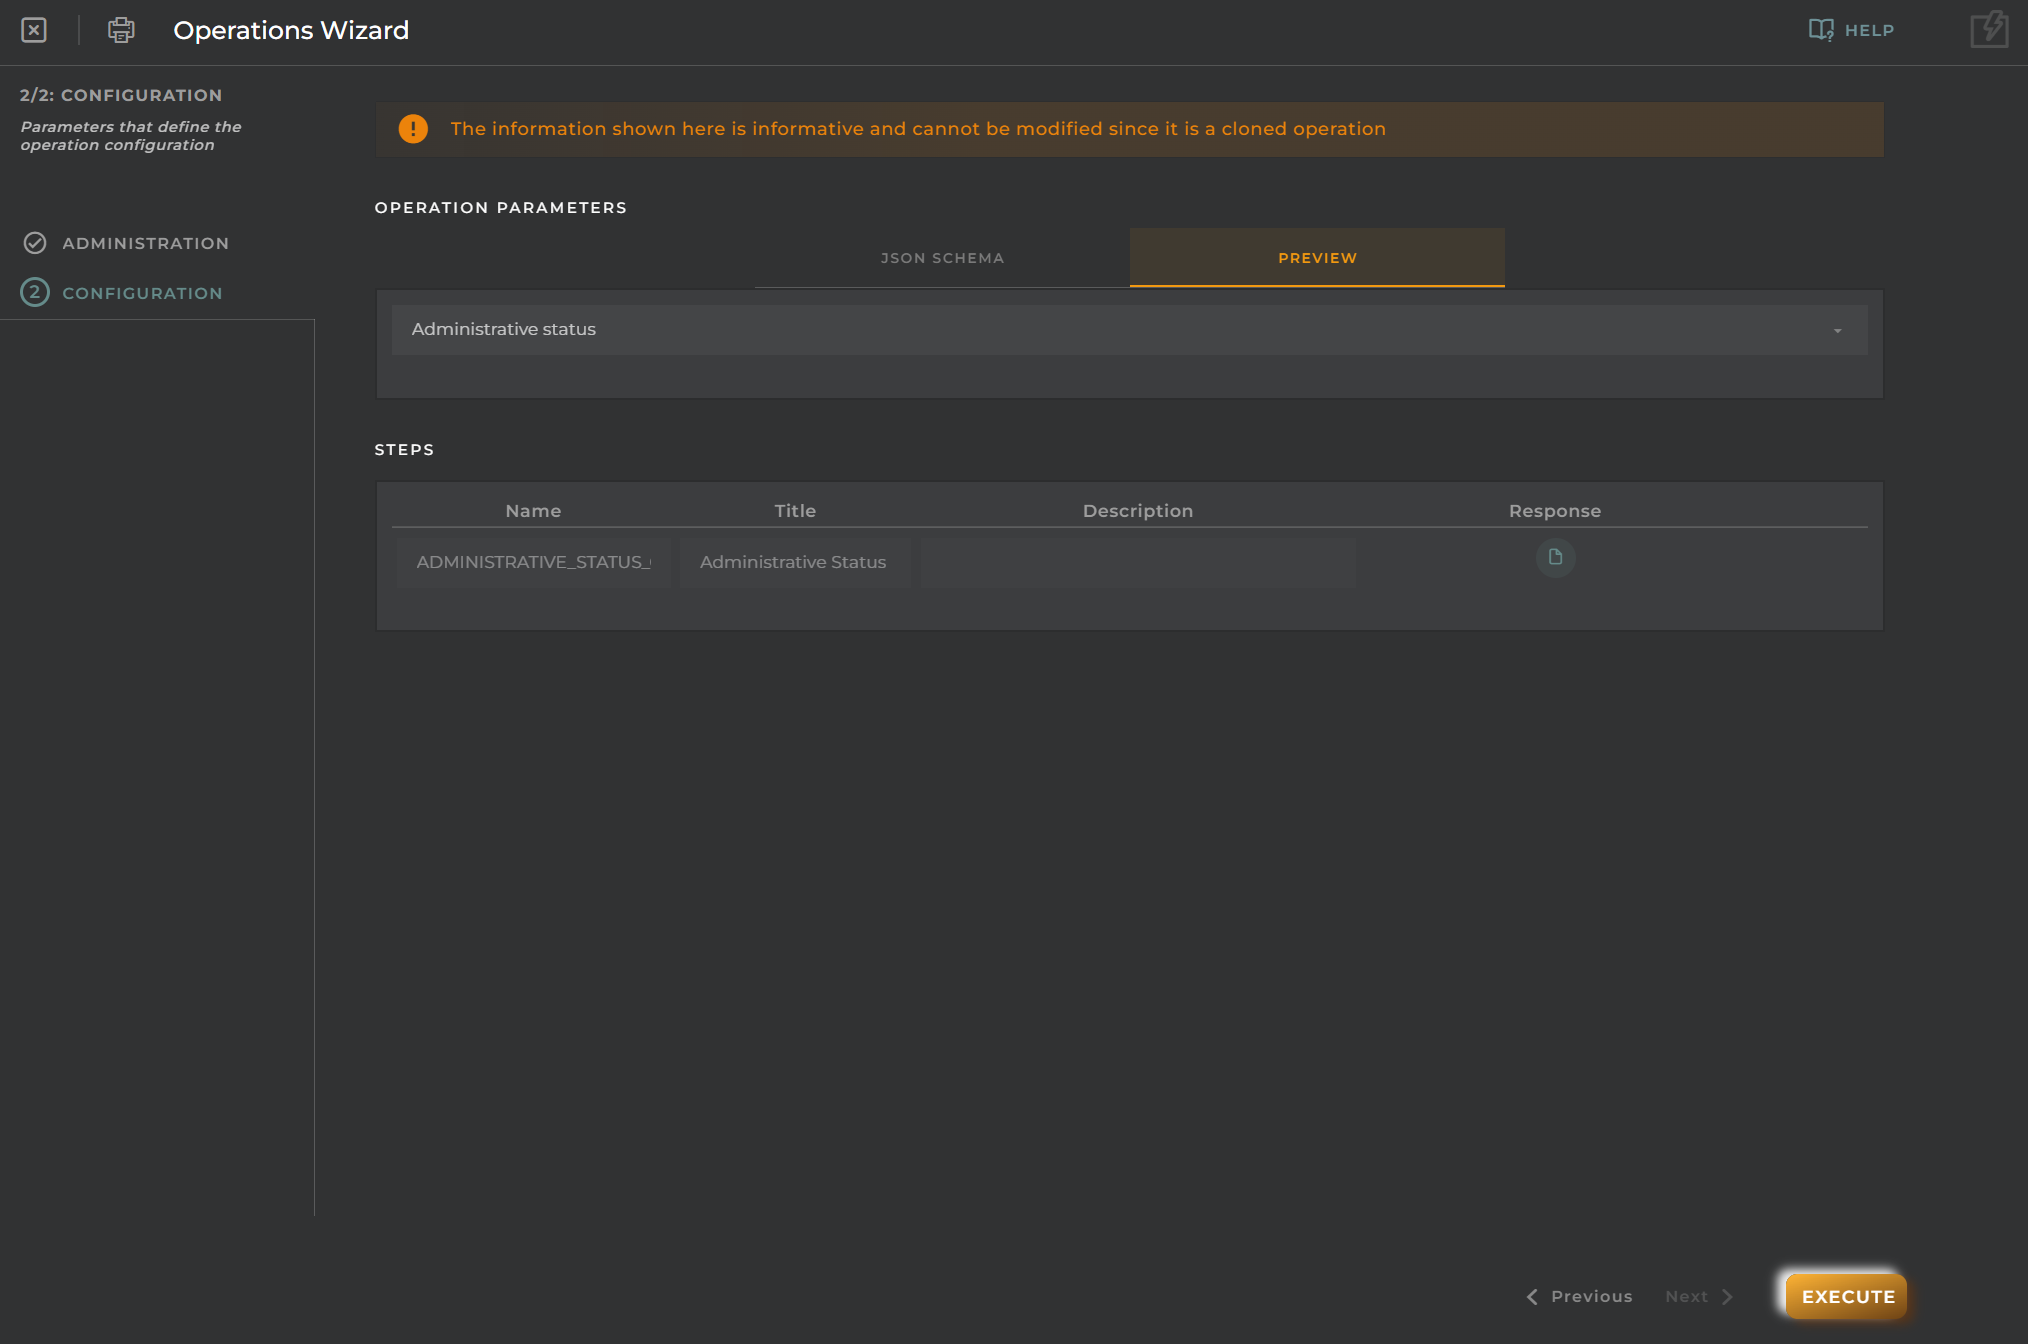
Create your own operations wizards directly from the OpenGate web console using JSON schema forms
The Operations Engine enables safe, repeatable actions across fleets without manual intervention, supported by execution logs and retry mechanisms for unitary or masive operations.
🧩 Rules Engine
Craft intelligent, real-time automation using the powerfull OpenGate Rules Engine:
Easy Mode GUI: Build rules using our conditional logic visually (“if-this-then-that”) without coding expertise
Advances Low-code GUI: Write advanced rules with custom processing, filters, and business logic using our predefined functions catalog or crafting your own. Start from scratch or use a basic catalog rule as template to build your own
Instant triggers and alerts: Respond to anomalies, thresholds, or patterns as they happen and trigger alerts, notifications or operations from the Operations Engine as response
These capabilities offers adaptive, responsive IoT automation, combining ease of use with full developer control for customizations.
🔁 Forwarders
Ensure data, events, and alerts flow seamlessly into your enterprise systems or enrich your OpenGate Data:
Bidirectional communication with third-parties and services
Route information from data streams or rule outputs to external systems (ERP, BI, CRM, custom APIs)
Choose sync or async delivery, including JSON, XML, or custom formats
Configure via GUI or code for flexible integration needs
We want OpenGate to be Your MultiTool but sometimes you need something else, so the forwarders offers you end-to-end operational workflows, eliminating the need for separate middleware and keeping business data in sync.
4. OpenGate UX Web Console
OpenGate’s web console is meticulously crafted to balance simplicity for end-users with depth for technical teams, offering a unified interface to manage devices, data, rules, analytics, and integrations, all without deep technical training and ensuring your User Experience.
Use the powerful tools from the OpenGate’s web console to build your own IIoT solution using a predefined catalog with more than 50 customizable widgets to create the specific views for your users or your needs and take advantage of the following capabilities:
🎛️ Customizable Workspaces & Dashboards
Select from different look and feels, upload your logos and customize the OpenGate appearance to meet your brand requirements
Create your own workspaces tailored for specific needs or roles such as operators, analysts, or admins
Use +50 customizable widgets to build your dashboards like charts, maps, tables, and entity lists to help you visualize the IoT ecosystem
Personalize your dashboards with filters, layouts, refresh intervals, and interactive controls
Use low-code snippets to make visual adjustments and visualization conditional rules depending on data values
Share your workspaces and dashboards within your organization with user groups o specific users
Integrate new features from external resources thanks to the custom menu areas using our secure iFrame functionality
🧭 Guided Wizards & Low-Code Tools
Step-by-step wizards guide users through complex tasks like creating dashboards, provisioning devices, and defining rules—no coding needed
Low-code tools let technical staff to configure advanced tasks, rules and customizations using javascript
🔒 Role-Based Access
Centralized GUI for user & role management, enforcing permissions across the platform
Define access policies for each workspace, feature, or dataset—ensuring data confidentiality and auditability
Create your own roles to define specifically who do what
Create your own multi-tenant organization to manage different levels or verticals from the same OpenGate organization
⚙️ Operational & Provisioning Interfaces
Real-time device inventory with status indicators, clickable controls, and firmware/update scheduling from a unified screen
Bulk operations managed through intuitive panels: filter, select, and apply actions to vast fleets effortlessly
↔️ Integration & Forwarding Configuration
Built-in UI elements to configure Connector Functions, Forwarders, and API endpoints—fully managed via intuitive dialogs
View logs and status of data forwarding and rule executions directly in the console
🧩 Developer-Friendly Debugging & Visualization
Live logs and data previews within each widget and rule/connector configuration
Test and debug Connector Functions or Rules directly in the interface before going to production
🎮 OpenGate Device Emulator
The Device Emulator is an essential tool within the OpenGate UX, enabling you to emulate device behavior instantly. This is a perfect tool for testing integrations, connector functions and rules, or debugging setups, or showcasing the platform without physical hardware and without additional tools. This gives you:
Simulate data flows without connecting real devices which is ideal for development teams, QA, or demos
Validate device provisioning and collection, rule triggers, forwarding logic, and dashboard visualizations
Validate complex workflows and simulate device operation responses
Accelerate your development by eliminating hardware procurement delays and issues by simulating device behavior in the cloud
5. Artificial Intelligence
OpenGate’s AI layer brings advanced analytics and machine learning directly into the platform core, enabling seamless data-driven insights and automated decision-making. It’s designed for both data scientists and developers as well as operations teams. Key components include:
🐍 OpenGate Data Py
Our opengate-data is OpenGate’s official Python client library that simplifies data interaction across the platform:
📦 Data extraction & injection: Pull collections, timeseries data, DataSets, and entities directly into Python workflows and reinyect the result data again in OpenGate
💡 Perfect for notebooks: Integrates with Jupyter (Data Lab) for data exploration, visualization, and other tasks
⚙️ API-first approach: Easy full support for REST-based authentication, querying, and batch operations in Python
📓 OpenGate Data Lab
OpenGate Data Lab embeds Jupyter Notebooks into the platform with features like:
Notebook execution: Run notebooks manually or on a schedule as part of your data pipelines or workflows
Full Python ecosystem: Support for scientific libraries like NumPy or Pandas
Operational workflows: Combine data processing and analytics in a single interface that live within OpenGate using Opengate Data Py library
🏭 AI Model Factory (roadmap)
Our “AI Model Factory” is the next-gen module for end-to-end AI lifecycle within OpenGate featuring:
Pipeline orchestration: Design sequences involving data extraction, transformation, training and inference
Multi-format model support: Deploy and serve models for real-time predictions
Training & retraining: Include model training pipelines to continuously update models with fresh data
Inference services: Deploy models as services callable from the OpenGate Rules Engine for real-time decision-making
This fully integrated setup lets you build, train, serve, and manage AI models (traditional or ML models) directly within your IIoT environment
🔄 Cross-Cutting Concerns
Across all layers, OpenGate enforces:
Security: Encryption at rest/in transit, device integrity checks, tenant isolation, authentication, and auditing.
Monitoring & Logging: Central observability stack with metrics, tracing, alerting, and logs.
Hybrid Deployment: Suitable for fully cloud, fully on-premise, or hybrid edge‑cloud orchestration including AI capabilities.
Main features
🔍 OpenGate Core features
The OpenGate Core is the central engine of the OpenGate IoT platform, and it’s designed to handle the full lifecycle of connected assets. Its key capabilities include:
OpenGate Core stands out in the crowded IoT platform landscape by focusing on flexibility, edge intelligence, and seamless integration, especially for industrial and large-scale deployments.
In short, OpenGate Core is particularly well-suited for organizations that need end-to-end control, real-time responsiveness, and broad device compatibility—without being locked into a single vendor or cloud provider.
In essence, OpenGate Core acts as the brain of the platform—modular, scalable, and built to adapt to complex industrial environments.
🌟 OpenGate Features
OpenGate offers a rich toolbox of capabilities to help you to manage complex IoT ecosystems with security, scalability, and operational intelligence.
🔧 Device & Asset Management
Device inventory & digital assets
Maintain full control over your connected infrastructure, whether it’s a few devices or millions. Manage inventory, configurations, firmware, and real-time status—all from a centralized, secure console.
Mass operations & bulk provisioning
Scale operations effortlessly: onboard devices in bulk via intuitive wizards or Provision Functions, and execute mass firmware updates, diagnostics, or configurations across your fleet.
⚙️ Connectivity & Protocol Support
Vendor-agnostic connectivity
Seamlessly integrate LPWAN technologies like Sigfox, NB‑IoT, LoRa, SIM-based communication, plus IP protocols such as MQTT, CoAP, Modbus, SCADA—without vendor lock-in.
Secure bi-directional communication
Maintain robust, two-way communication between the platform and devices, ensuring status, commands, and updates flow efficiently and securely.
🤖 Edge Computing & Intelligence
Integrated agent (ODA)
Use the lightweight OpenGate Device Agent (ODA) on gateways and edge devices to collect, normalize, and transmit data—and to execute operations locally.
Edge processing & AI readiness(alpha)
Leverage edge computing to reduce cloud dependency and latency. Integrate AI-driven analytics and predictive processing directly at the edge—simplifying real-time decision-making.
📊 Custom Dashboards & Visual Wizards
Tailored workspaces & dashboards
Build visual workspaces with charts, maps, entity views, and more. The drag-and-drop dashboard layout allows non-technical users to craft custom displays easily.
Guided wizards & low-code configuration
Use visual wizards to execute complex tasks, operations, and configurations. The platform’s low-code rules engine enables fast business rule deployment without programming.
🔗 Rules Engine & Operations
Real-time rules & automation
Automate triggers—from simple alerts to complex multi-step operations—based on live data, with full GUI and JavaScript support.
Operations Scheduler
Schedule remote tasks, firmware upgrades, and diagnostics efficiently, using a built-in scheduling engine.
🔐 Security & Multi‑Tenant Support
End-to-end security
Security controls are built across all layers: device, connectivity, and data‑center. Includes encryption, access control, auditing, and secure firmware validation.
Multi‑tenant architecture
Manage multiple organizations, workgroups, and sub-tenants with complete isolation—supporting flexible governance and role-based access control.
🔁 Integration & API Access
Northbound RESTful APIs
Connect with BI tools, ERP/CRM systems, external applications or custom integrations using comprehensive REST APIs for management, data retrieval, analytics, and operations.
Connector module support
Enhance integrations with connector functions that bridge data from external systems or third-party services into OpenGate.
📈 Data Lake & Analytics
Time-series ingestion & visualization
Ingest high‑volume sensor data into a data lake. Use built-in modules to filter, aggregate, and visualize data for insights and trend analysis.
✅ Why These Features Matter
OpenGate unifies the entire IoT stack—device management, connectivity, edge processing, automation, security, and analytics—into a single, extensible platform. This means faster deployments, less overhead, and safer operations, especially for heterogeneous, large-scale, or industrial setups.
How to
📘 How-Tos: Step-by-Step Tutorials for OpenGate
Welcome to the How-Tos section—your hands-on guide to using OpenGate effectively. Whether you’re starting from scratch or building advanced workflows, these tutorials walk you through every step with clear instructions, screenshots, and best practices.
🏗️ Learning by Doing: A Real-World Scenario
To make this tutorial series more approachable and hands-on, we’ll follow a practical story that evolves across the different chapters. Instead of isolated examples, each tutorial will contribute to building a complete and functional solution using OpenGate.
Our story follows an IT team tasked with monitoring a warehouse facility with an adjoining parking area. Their mission is to deploy sensors, collect data, and generate visualizations and alerts to ensure operational efficiency.
Throughout the series, we’ll walk step-by-step through their journey using the OpenGate IoT Platform to implement:
🅿️ Presence sensors for parking slots These will help detect occupancy status in real time for internal logistics or client access.
🌡️💧 Temperature and humidity sensors for the indoor areas Useful for monitoring environmental conditions in storage zones, employee workspaces, or sensitive equipment rooms.
Each one of the next chapters will build on the previous one — creating users, modeling data, provisioning entities, and building dashboards that reflect the real-world scenario of this IT team. By the end, we’ll have a fully functioning digital twin of their facility.
Let’s get started!
🔐 Pre-requisites
To follow these guides, make sure you have:
An active OpenGate account with access to a sandbox or production instance
Reviewed the Introduction, so you’re familiar with key concepts like Entities, DataStreams, Rules, Operations, and the platform architecture
Basic familiarity with REST APIs, JavaScript (for advanced tutorials), and Python (for Data Py integrations)
📚 How-Tos Overview
Each How-To guide is designed as a standalone tutorial but builds on the previous ones. You’ll find clear objectives, prerequisites, step-by-step instructions, and links to deeper documentation.
Users and Roles:
Set up users, define roles, and assign permissions for secure and organized access control.
Data Modelling:
Create Entities and DataStreams to structure your IoT data model.
Entity Provisioning:
Onboard devices one by one or in bulk using wizards or Provision Functions.
Data Collection:
Send entities registered data via the Device Emulator and view data in entity panels.
Connector Functions:
Learn how to transform, enrich, and forward data to external systems.
Workspaces & Dashboards:
Build custom dashboards using widgets like LastValue, Entity Details, DataStream History, and Maps.
Operations:
Execute predefined tasks and operations on your entities from the catalog.
Easy Mode Rules:
Set up alerting and automation rules using the low-code GUI.
Analytics and Datalab:
Explore and work with your data using the OpenGate Data Lab superpowers with Jupyter Notebooks and python.
Advanced tutorials
Extend your OpenGate skills with Dashboard templates, Advanced rules configuration, and more.
🚧 This “Advanced tutorials” section is currently under development 🚧
🤿 Deep diving
Here are a few key links to deepen your understanding:
REST APIs – Southbound & Northbound: Explore endpoints for device/data management and external system integration.
OpenGate Data Py: Pull data into Python notebooks—perfect for analytics and experimentation.
Analytics & AI Module: Learn how to leverage model training, inference pipelines, and integrated Jupyter notebooks.
✅ Next Step
Choose the first tutorial to begin your journey:
New to OpenGate? Start with “1. Accessing OpenGate & Navigating the Console”
Want to start building dashboards or automations? Jump to section 7 or 8
Let’s turn your IoT vision into reality—step by step with OpenGate!
Subsections of How to
1. Accessing OpenGate
🔐 OpenGate login page
To begin using OpenGate IoT Platform, the first essential step is accessing its Web Console. This interface serves as the GUI control center where users manage devices, define rules, monitor telemetry, and configure their IoT ecosystem.
Users must begin by navigating to the OpenGate Console URL. Upon reaching the login page, access is granted via credentials and TOTP (serving as Two Factor authentication method), depending on the authentication method configured for your organization.
🛡️ TOTP Login
TOTP (Time-based One-Time Password) is a security protocol used in two-factor authentication (2FA) systems. It generates a temporary, one-time code that changes every 30 or 60 seconds, based on the current time and a secret key shared between the user and the service. This ensures that each code is unique and valid only for a short duration, adding an extra layer of protection to user accounts.
⚠️ Lost Password?
It is possible to regain access to an account when standard authentication fails, such as forgetting your password or losing access to a two-factor authentication app (TOTP). Just click on the link below the login form and then you can retrieve your password
🏰 OpenGate home page
Once authenticated, users arrive at the Home page. This landing view presents the workspaces and dashboards that you have configured or the ones your administrator or some partner share with you.
The primary navigation menu is positioned on the left side of the screen. From here, users can enter dedicated sections such as Entities, DataStreams, Provisioning, Functions, Rules, Catalog, and Dashboards. Each section is structured to guide users through specific configuration workflows, offering both summary views and in-depth drilldowns.
The top bar of the console includes access to user settings, notifications, language preferences, and a global search tool. This enables quick access to specific entities, rules, or logs without needing to navigate the interface manually.
📚 OpenGate Sections
Once logged into the OpenGate IoT Platform, you can choose between some different tools among the following:
1. Workspaces and Dashboards
An intuitive, visual interface that centralizes OpenGate operations. Workspaces allow you to organize custom views tailored to their roles or operational needs, while Dashboards provide dynamic panels with charts, key metrics, and real-time KPIs. Perfect for quick monitoring and status analysis of devices and services.
The core administrative console of OpenGate. Through this web interface, you can manage all the functionalities of your OpenGate IoT Platform account like provisioning and managing entities and digital assets, creating users and configure different access roles, build connector functions, data models, rules, operations, and so on.
It’s the main hub for fine-grained platform customization and we will use it several times during this tutorials.
3. Operations Support System
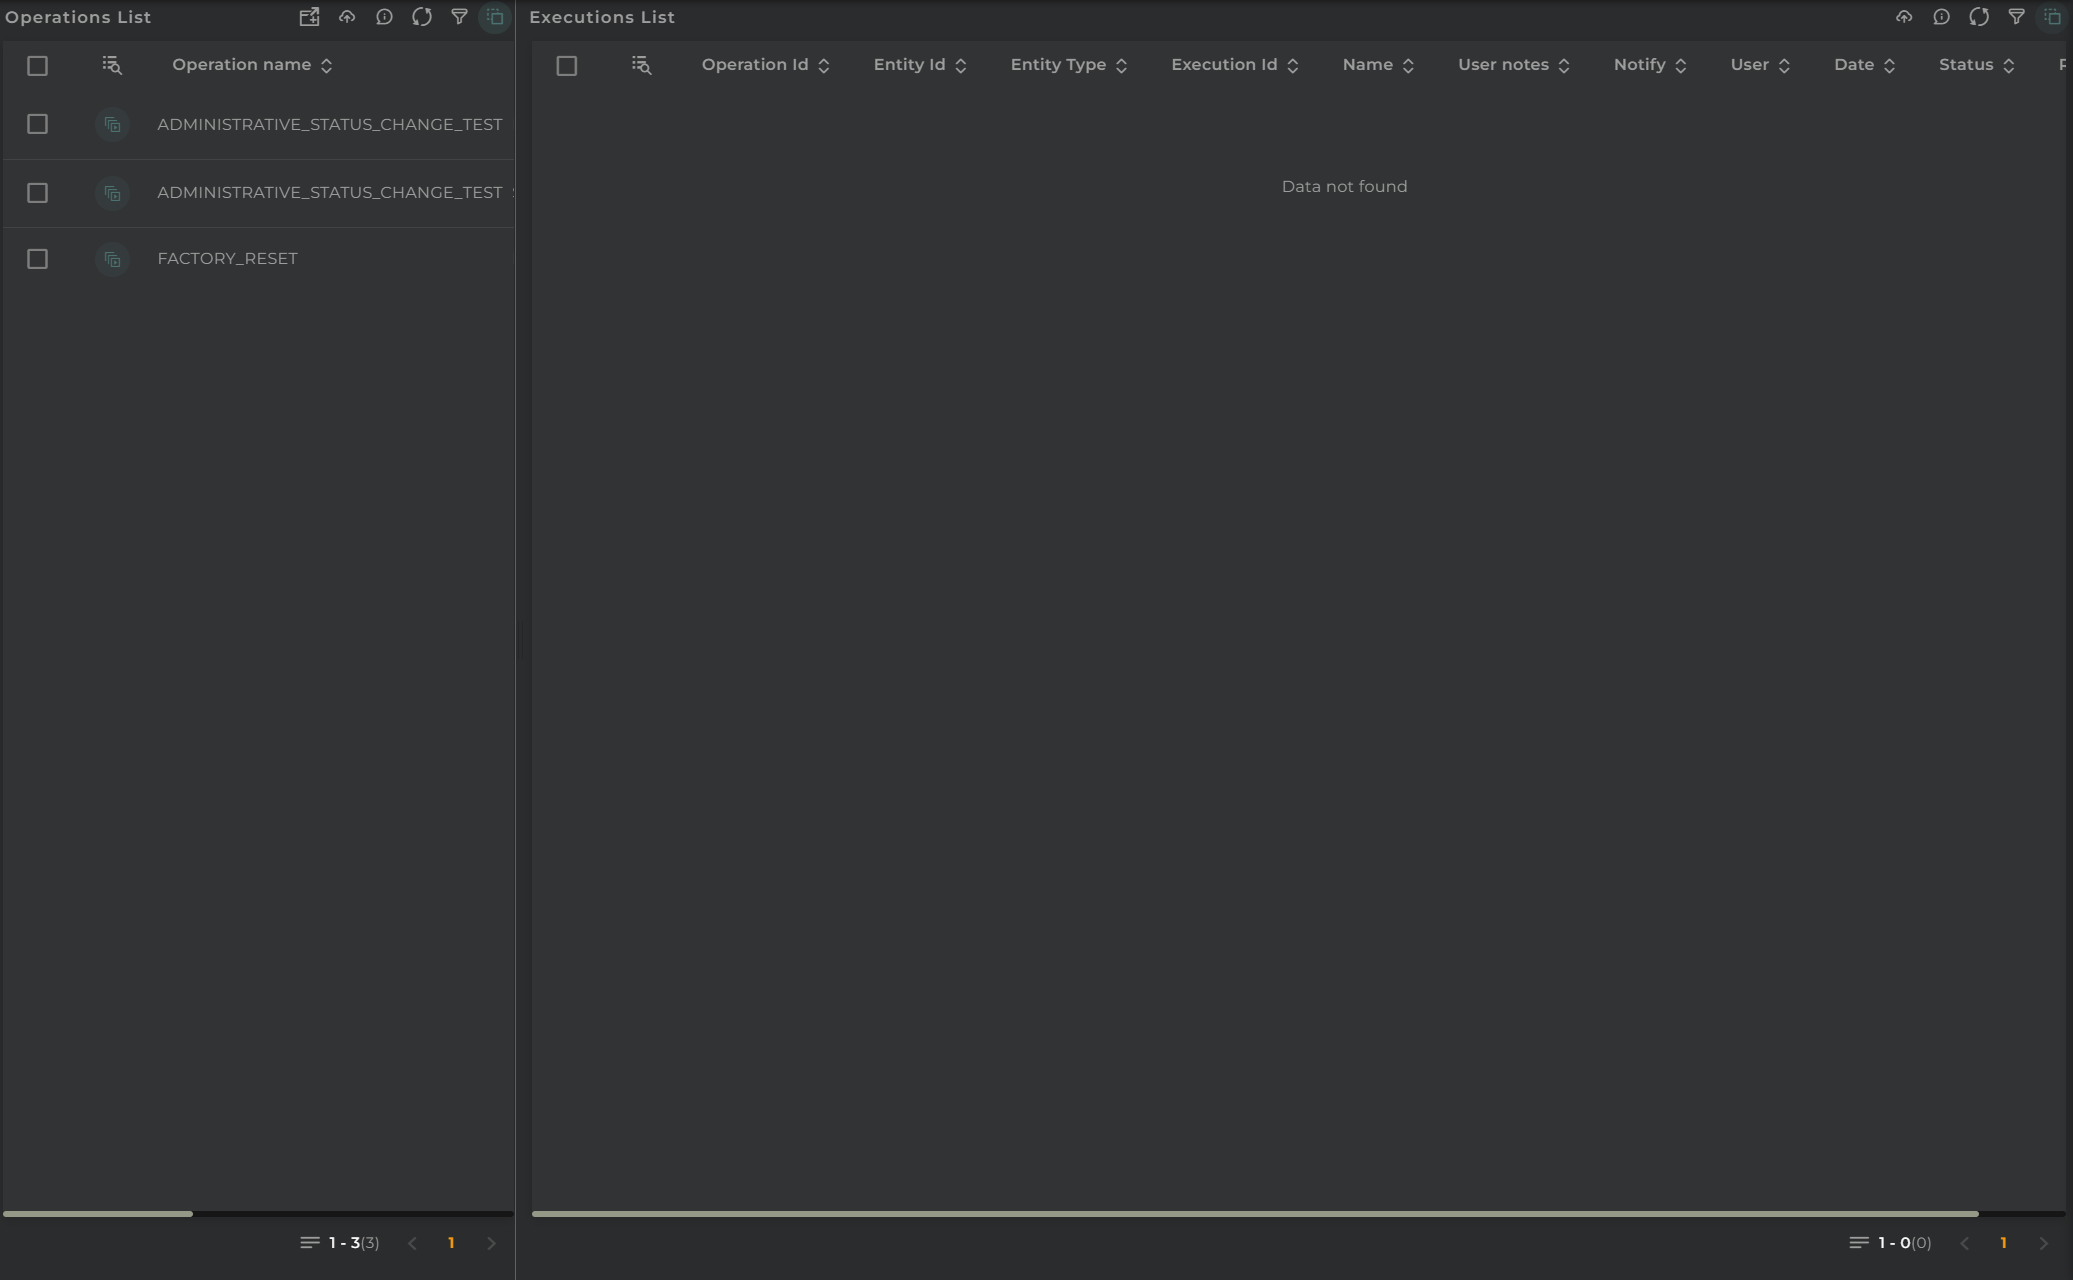
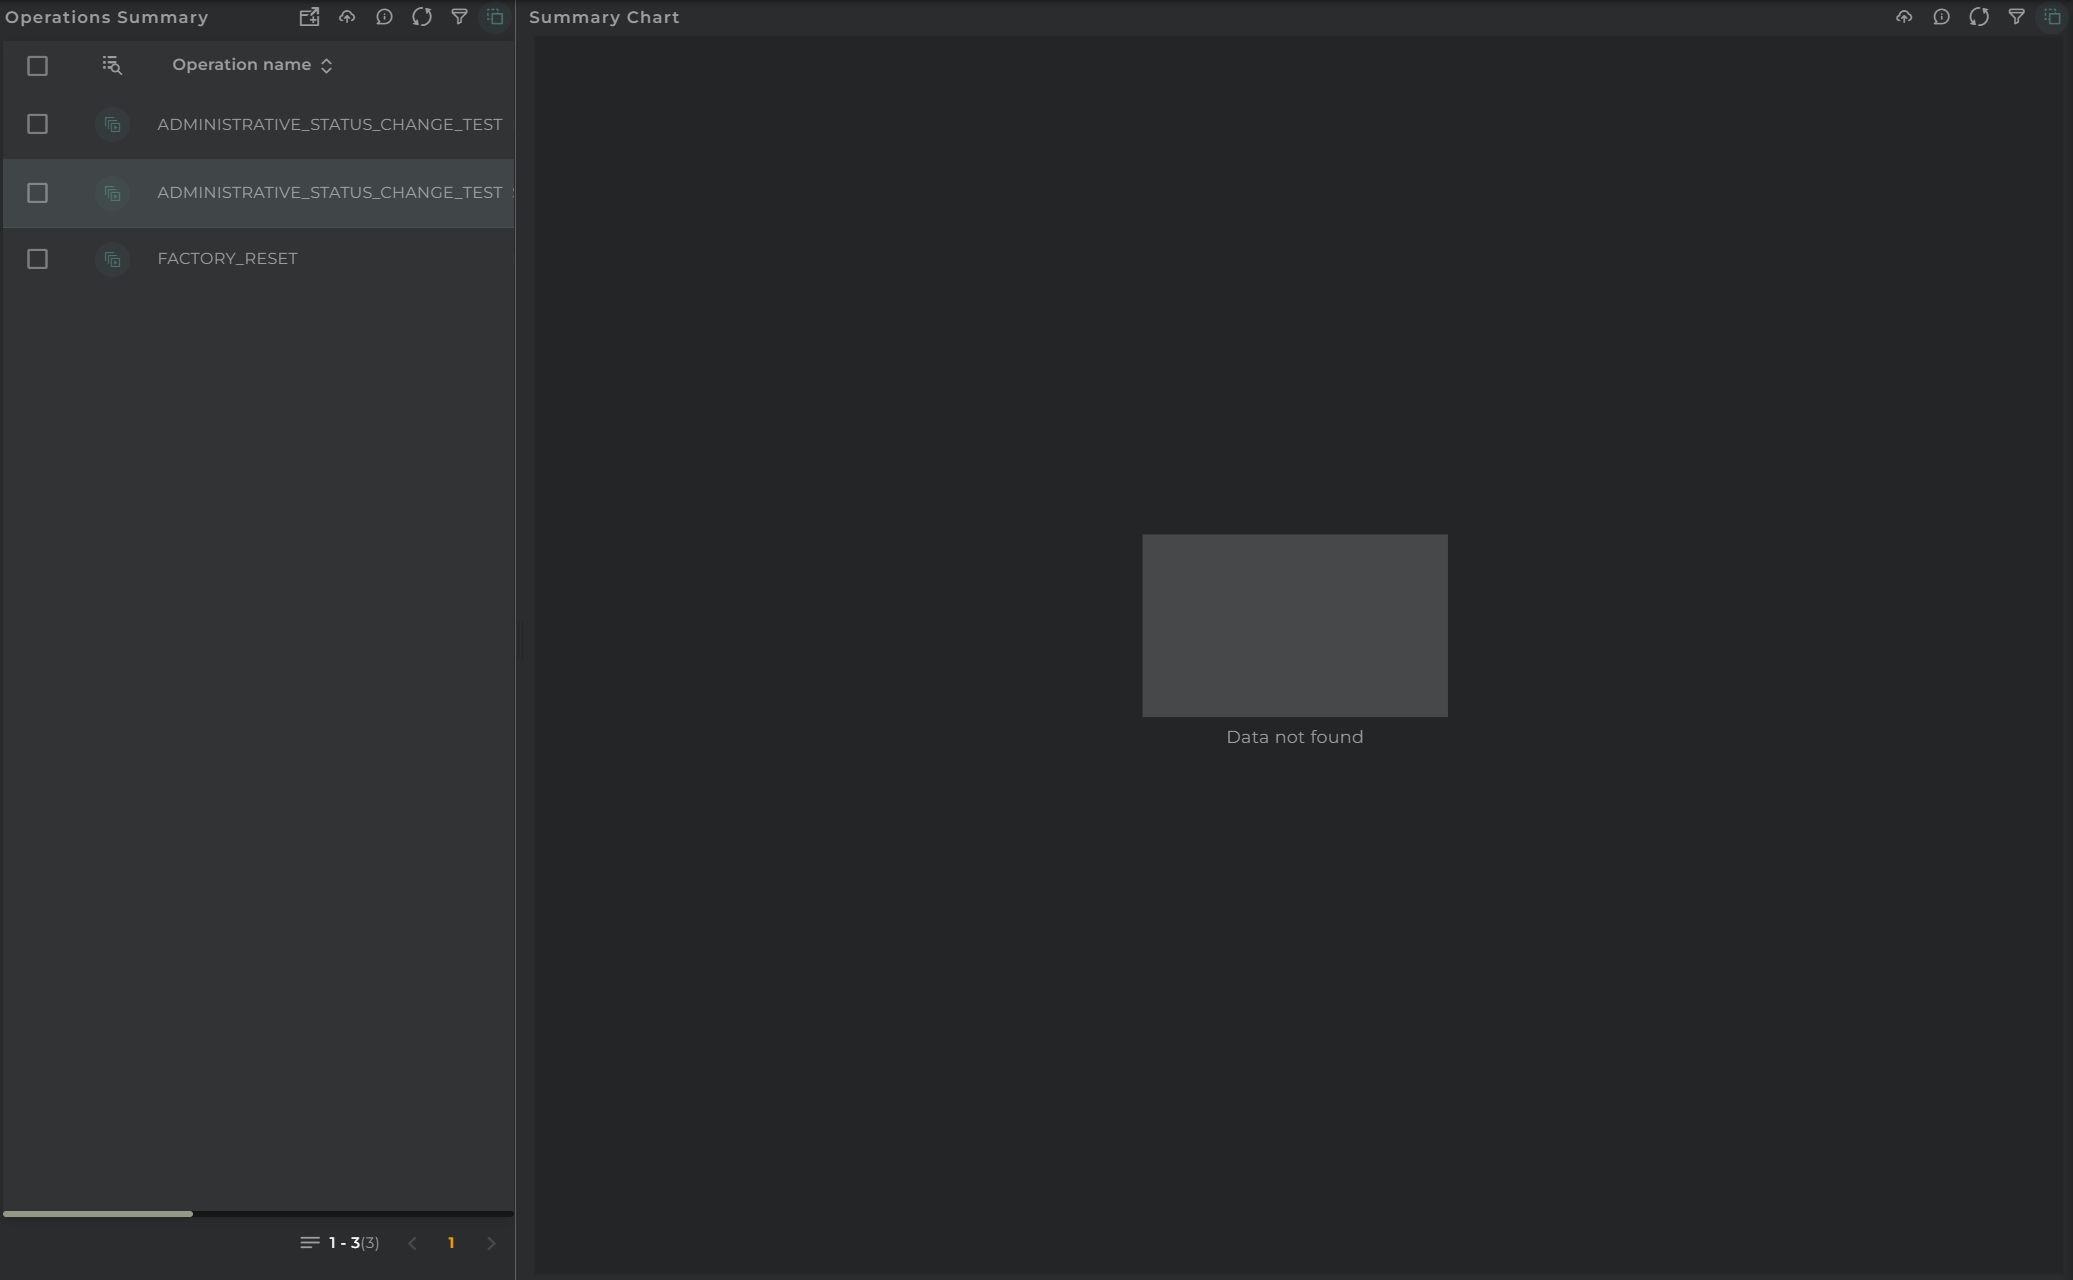
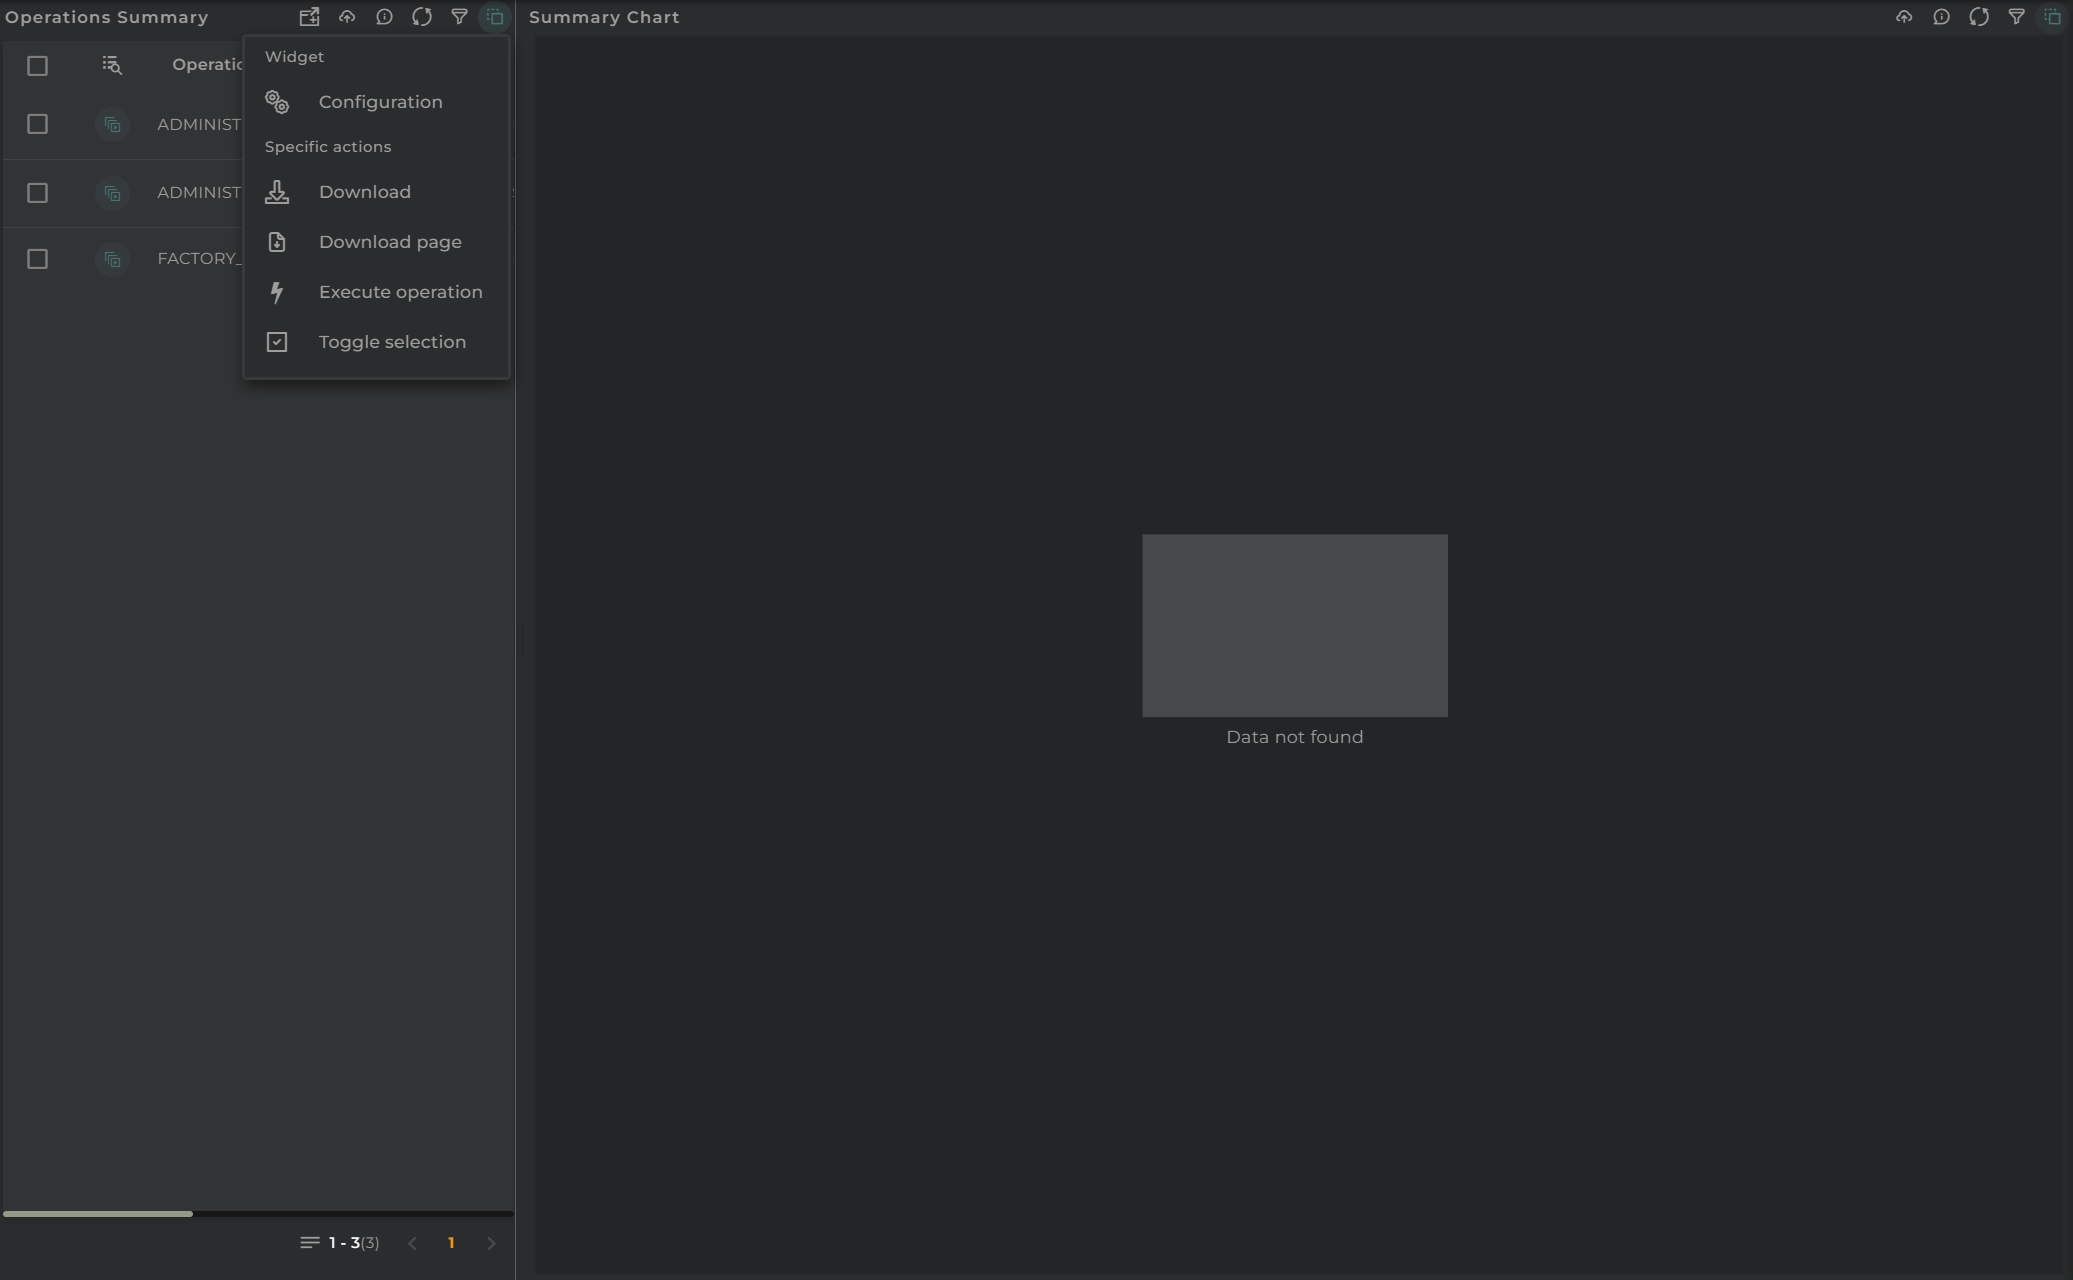
You can configure your own dashboards in the Workspaces and Dashboards OpenGate area, but we think that this area facilitates the management of the OpenGate IoT Platform Operations, directly out of the box. It allows you to monitor all the scheduled operations, its executions and details, so it’s a powerful tool for large-scale, real-time operations control.
This tool also offers you the possibility to launch and configure new Operations from wizards that allow you to configure operations for one, tens or millions of devices based on filters.
4. OpenGate Device Emulator
A test environment designed for developers and integrators. It simulates complete device behavior without requiring physical hardware, making it ideal for validating configurations.
You can use the Device Emulator to collect specific data as the same way that the device does, testing through all the workflow of the OpenGate IoT Platform and so, ensure that connector functions, rules and operations perform as expected before deployment.
5. Analytics (OpenGate Data Lab)
The analytical layer of OpenGate IoT Platform. It offers the possibility to work with your datalake, time series and data sets, by using our OpenGate Data Lab. This tool gives you all the powers of Jupyter Notebooks and python to work with your data: create analytics tasks to find patterns, build KPIs, build automated custom reports or periodic custom calculations over your data.
In the near future, we will expand this tool by adding an AI module to work with, directly from OpenGate.
2. Users and Roles
OpenGate Users and roles
OpenGate offers a flexible system for user and role management. The platform primarily distinguishes between administrators and regular users.
🛠️ Administrators: Users with the highest level of access and permissions. They can manage key account settings, such as organization structure, user provisioning, datamodel and datastream configuration, and the creation of time series and datasets. Administrators are typically responsible for modeling the collected data, defining a structured environment through workspaces and dashboards, and sharing them with other users.
👥 Platform Users: Users with more limited roles, focusing on solution operations. They interact with entities and digital assets, oversee values, manage rules, alarms, tickets, and more. Administrators may create specific dashboards and workspaces for these users, or they can build their own based on their access level.
Additionally, all roles are fully customizable, allowing fine-grained control over access and actions across the platform. While the deeper logic and configuration of roles is explored in the complete OpenGate API documentation, this guide focuses on user creation and role assignment via the built-in wizard.
👤 Creating a new user
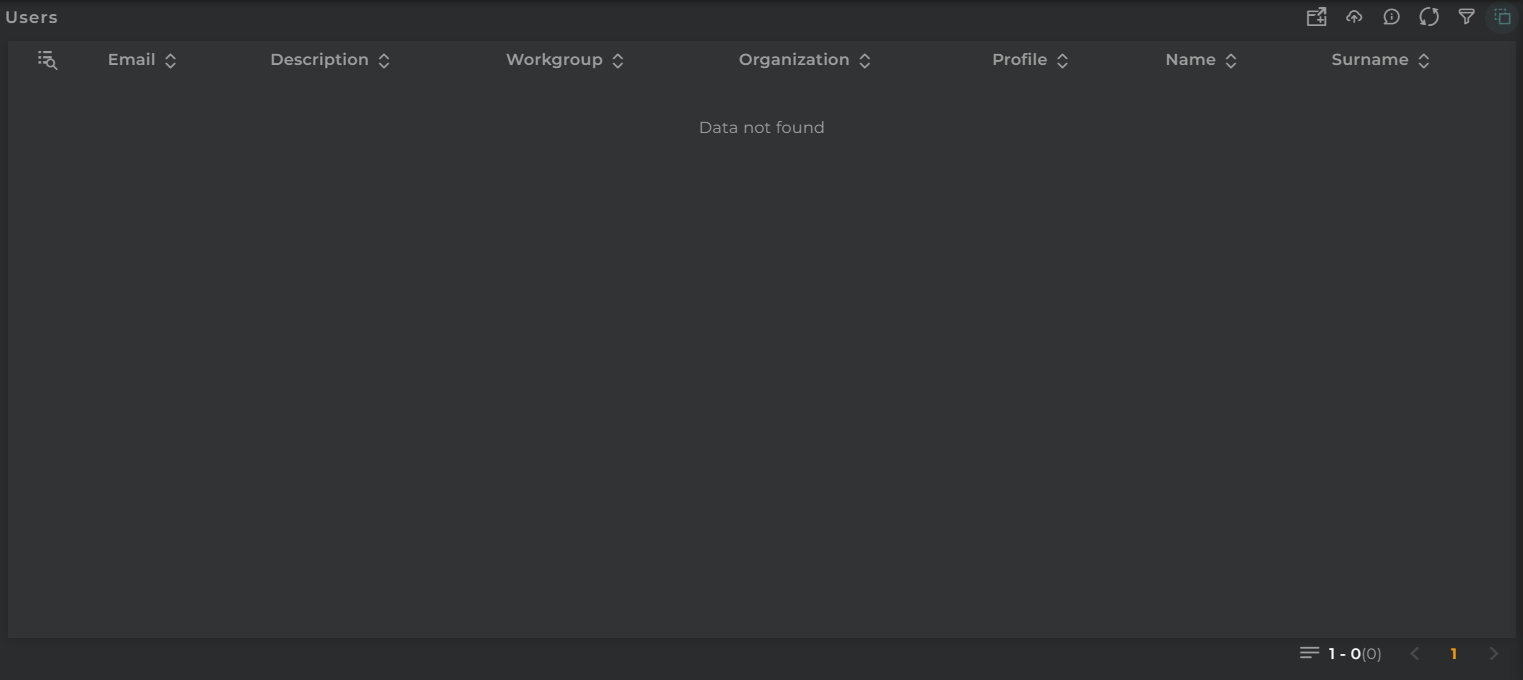
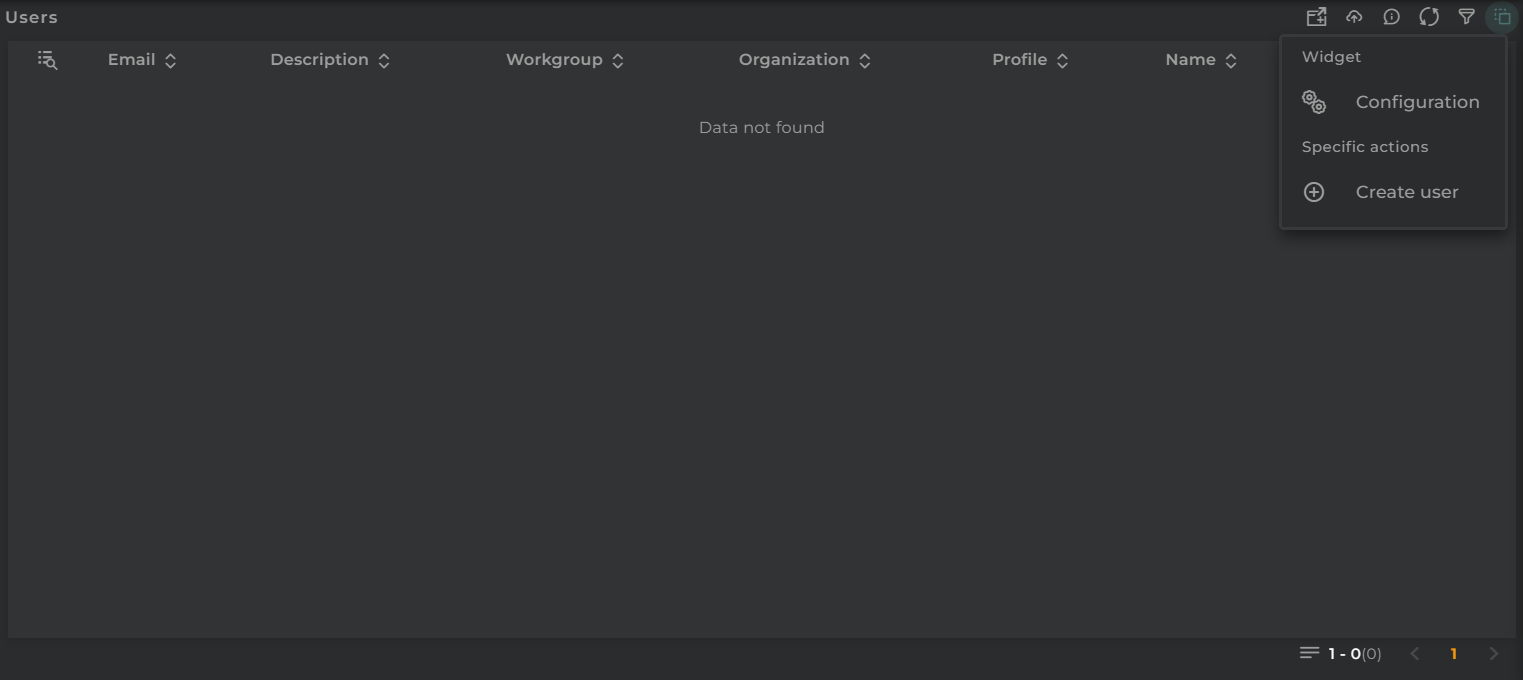
Administrators can onboard users using a step-by-step wizard located in the “Users” section of the “Opengate Management” web console.
Click on “+ Create user” within the users table to begin.
Once selected, the wizard guides you through the essential onboarding fields:
User’s full name and email address: The email address will serve as the username and is required for password recovery.
Organization: Indicates where the user belongs. This could be a suborganization if multiple levels exist within your OpenGate account.
Role selection: Choose from predefined or custom roles.
Password setup: You can define an initial password, enforce a password change on first login, and configure TOTP (Time-Based One-Time Password).
⚠️ IMPORTANT: Passwords must contain at least 12 characters, including uppercase letters, lowercase letters, numbers, and symbols.
After completing the form, the user is registered immediately and can log in with the provided credentials. Permissions are granted based on the assigned role, determining their access scope and allowed actions.
🎭 Creating a custom role
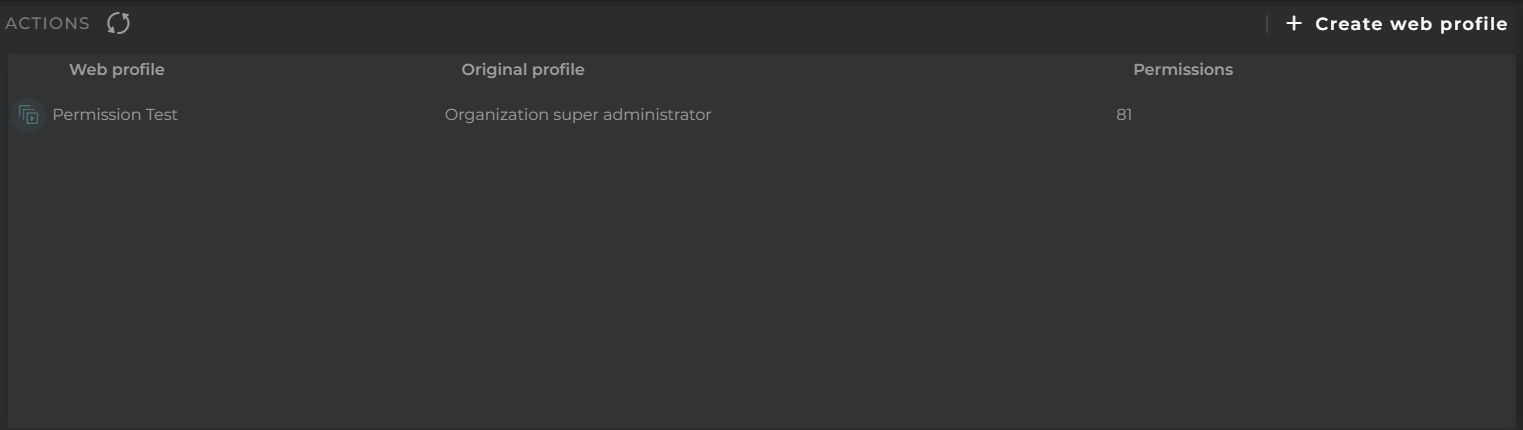
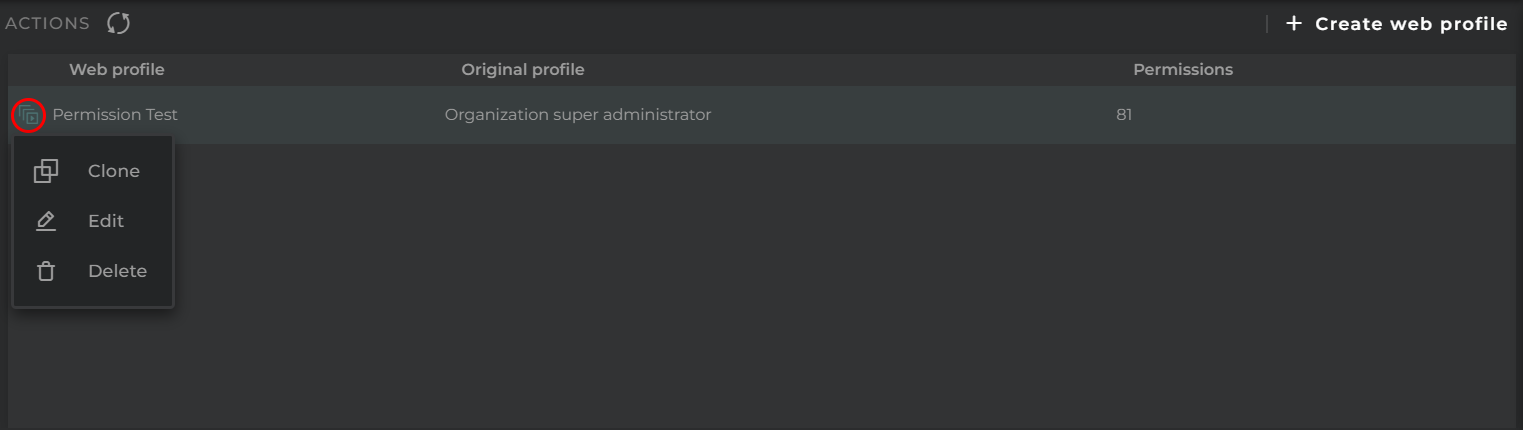
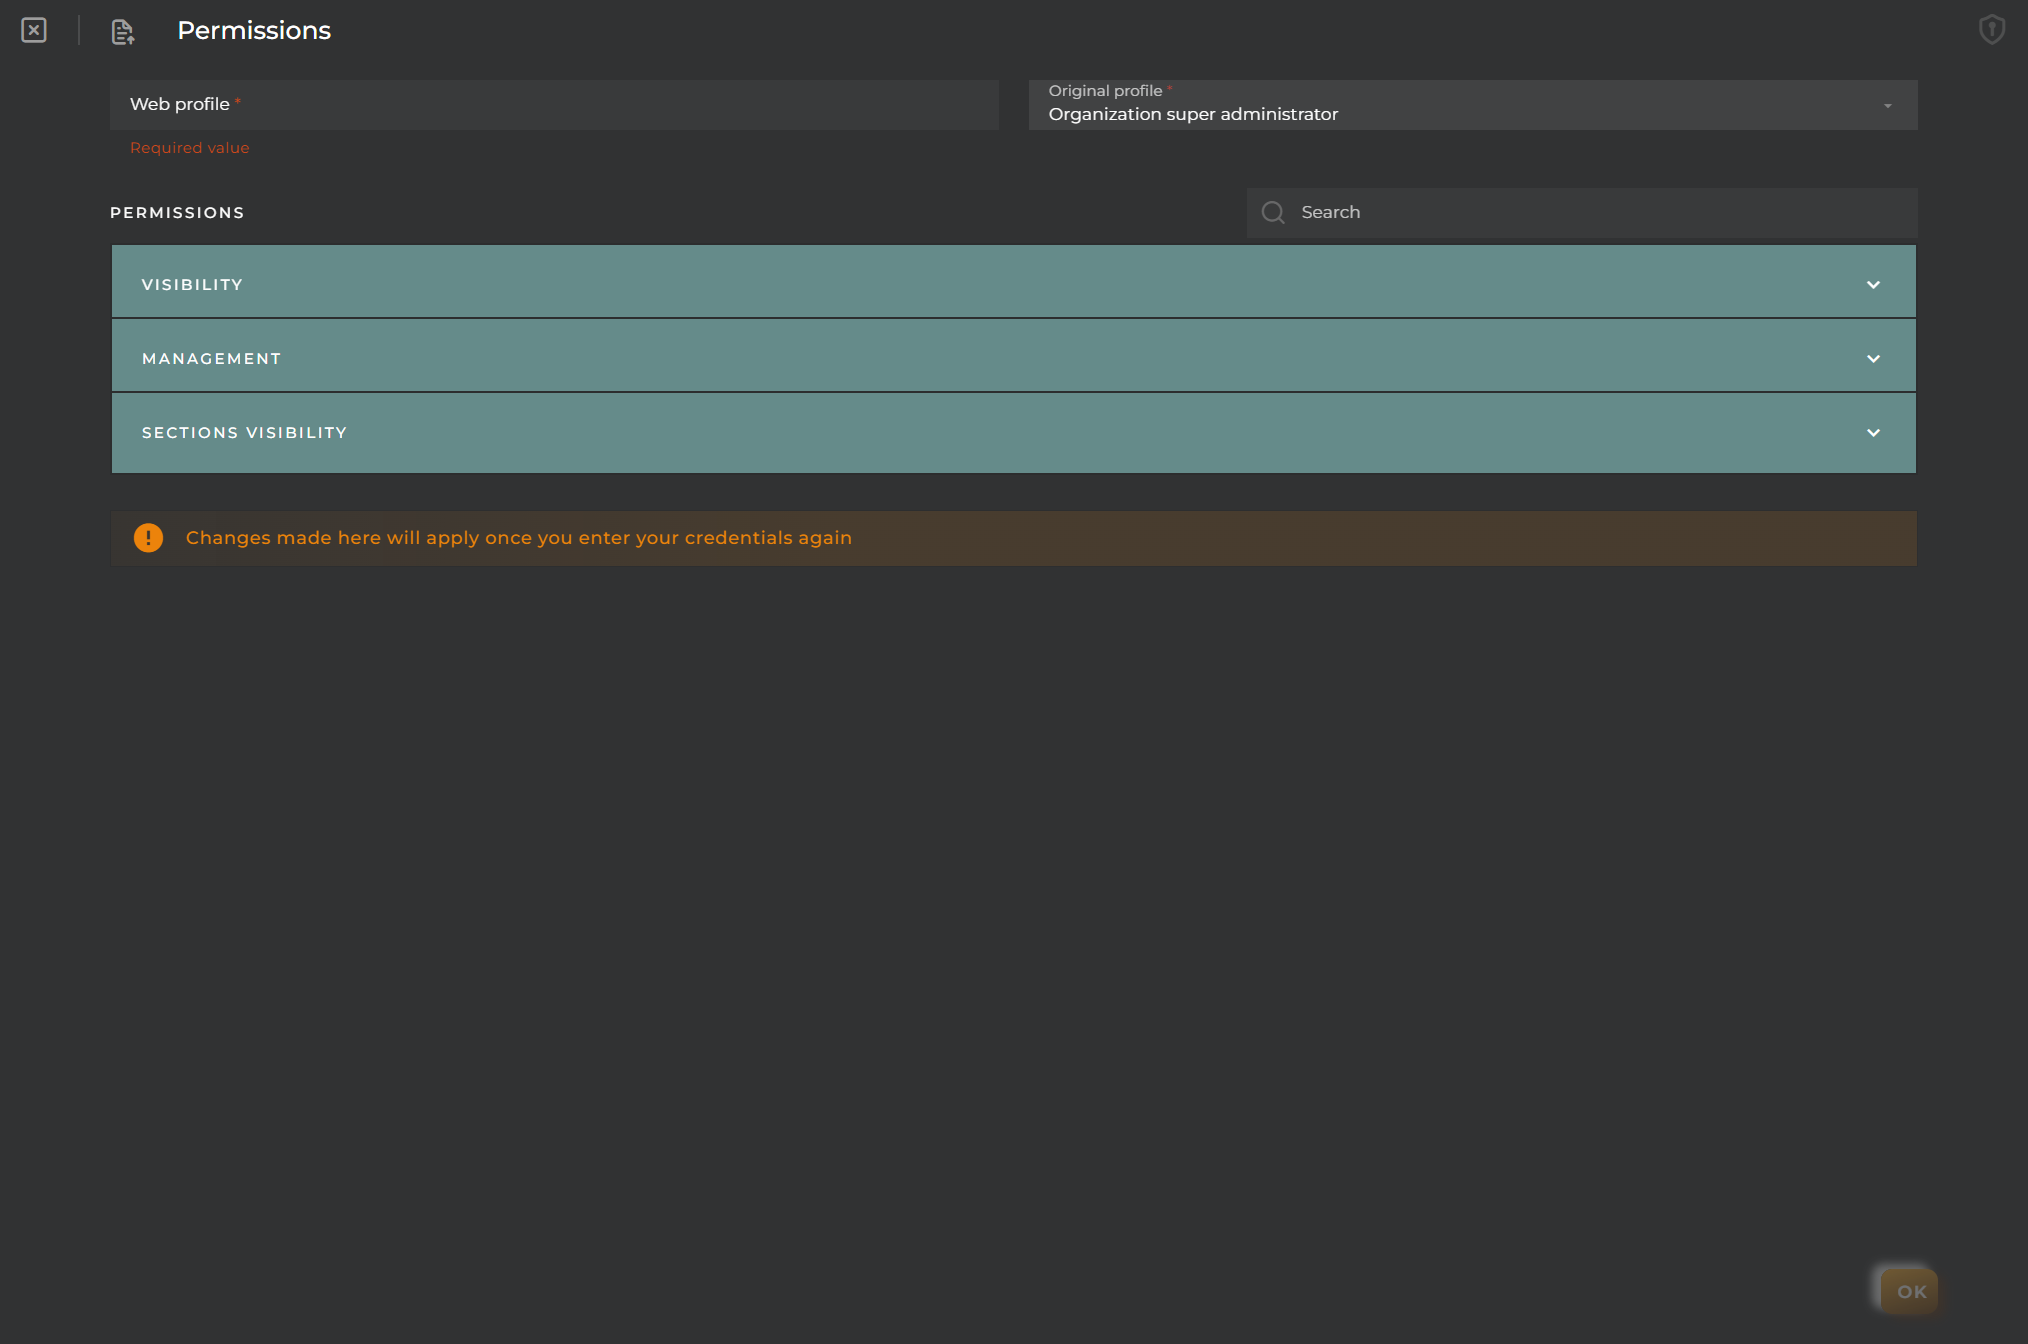
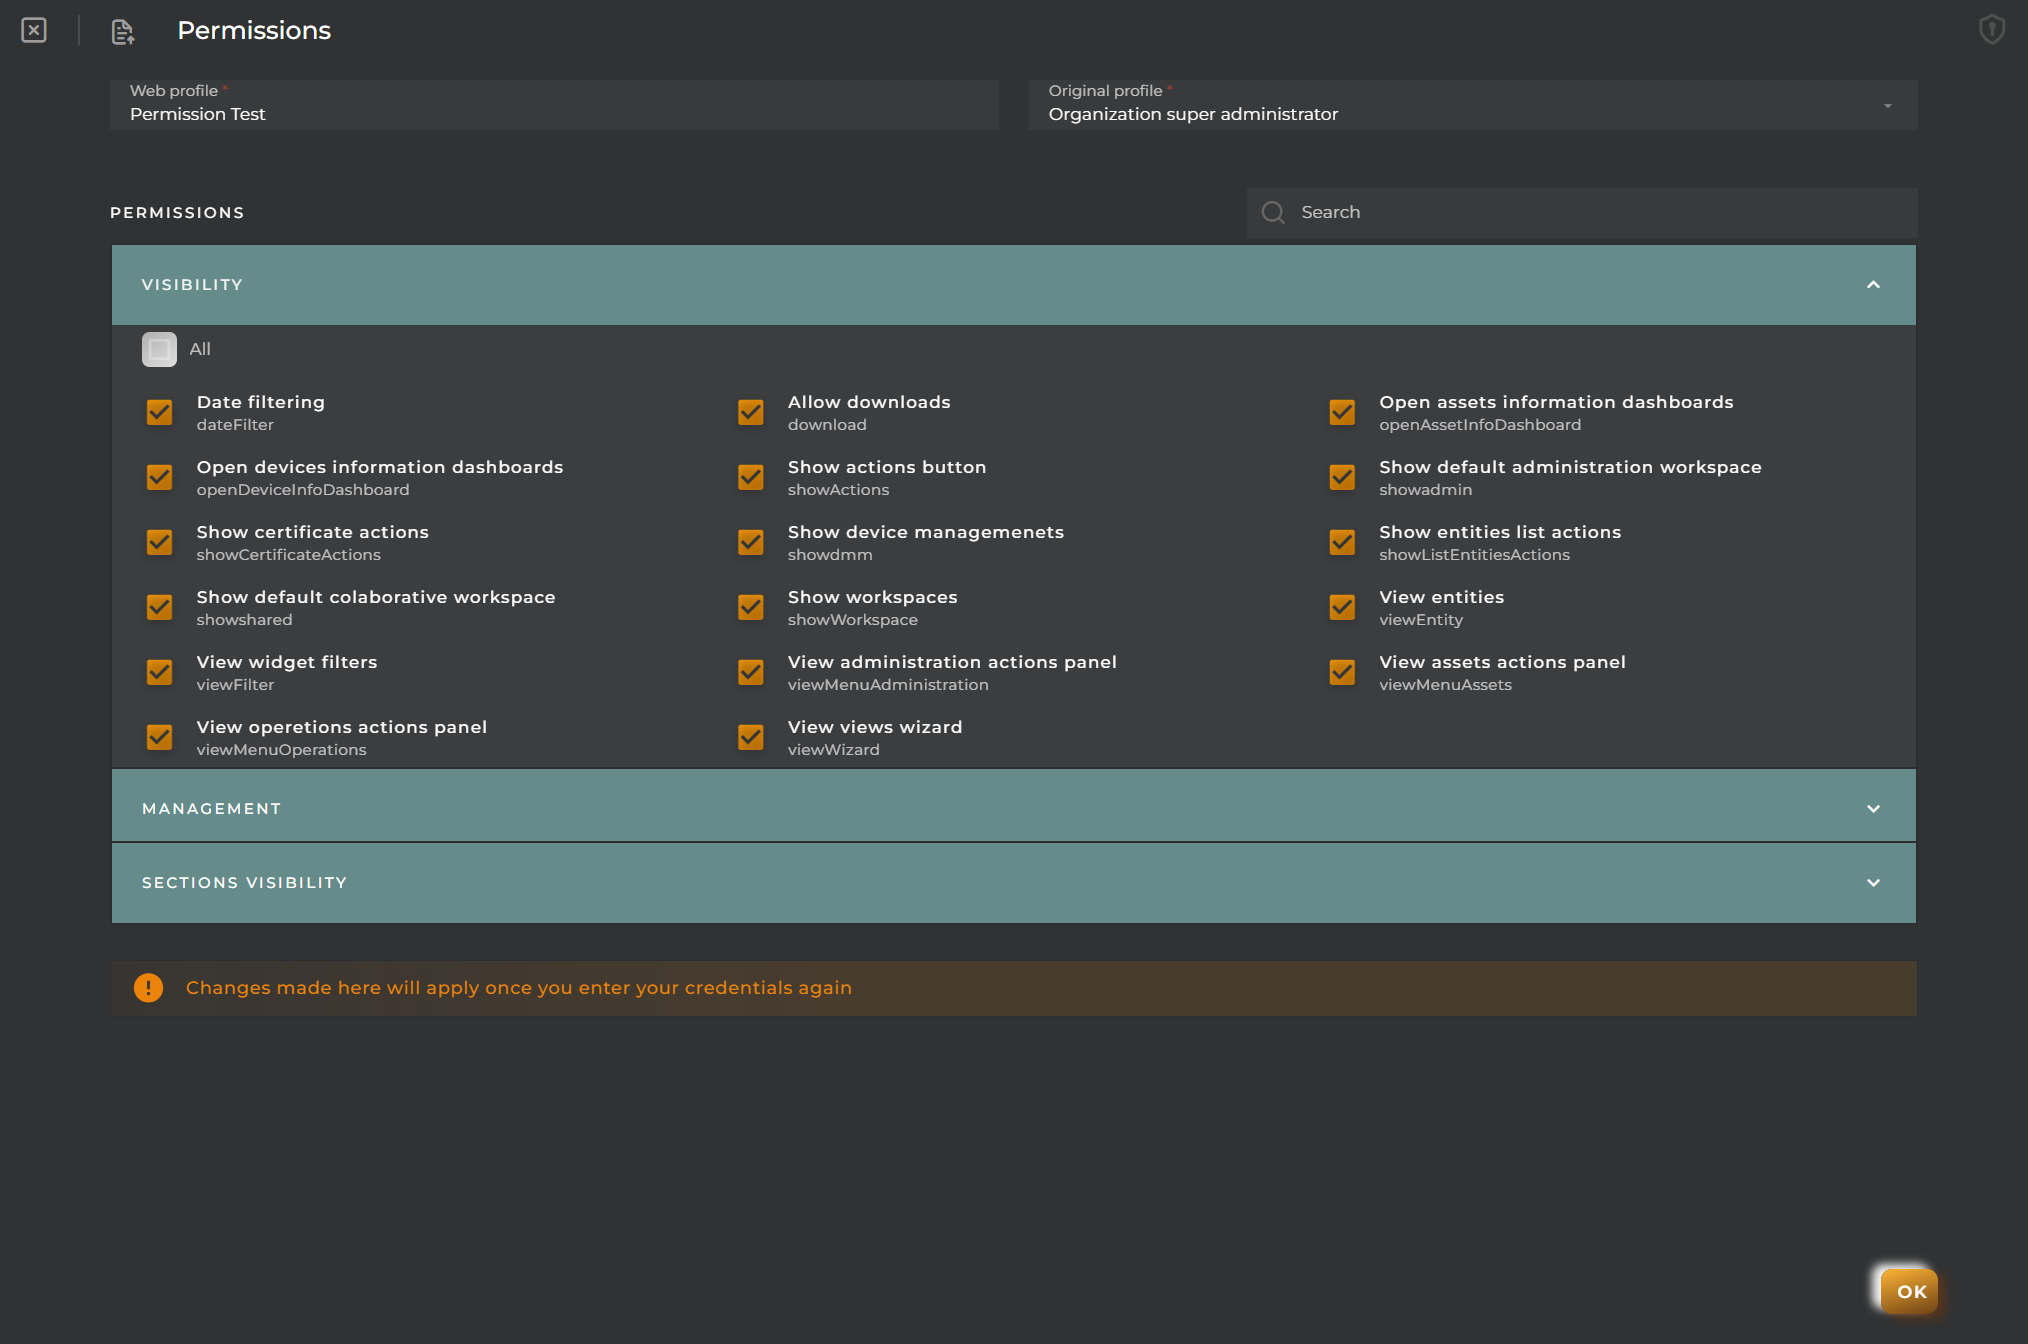
Let’s take a quick view of this functionality. It is possible to create custom roles if you login as an Administrator user and go to “Opengate Management > Permissions”, then click on “+ Create web profile”.
This opens a wizard to help you define a new role with tailored permissions:
📌 IMPORTANT: Custom roles apply only to the OpenGate GUI. If your users need API access, remember that only the predefined OpenGate roles are supported at the API level.
3. Data Modeling
📦 Data Modelling in OpenGate
OpenGate provides you powerful tools to create and manage data models that define how information flows through the platform. This includes setting up entities, digital assets, and the structure used to monitor, analyze, and act upon collected data.
A well-defined data model allows you to:
Represent real-world objects (devices, vehicles, installations, etc.) as entities or digital assets
Define its properties, attributes or collected data as datastreams to capture metrics, behaviors, and status information
Enable visualizations creating dashboards and templates for your entities
Create rules that respond to data values or changes over time
Manage the entities creating operations
Data models, are organized into groups or Categories and, each category contains one or more datastreams, that are the representation of each entity data or property. The platform enables administrators to build these structures manually using the OpenGate web interface (or programmatically via the API).
For a hands-on guide to building your data model and so, your data structure, let’s continue with the Datamodel configuration.
🏗️ Create your first Datamodel
We are going to create our first Datamodel in our OpenGate IoT Platform account (We assume that you have an OpenGate user with “admin” role).
Following our story regarding the warehouse facility, we are going to create this structure where the intention is to represent parking slots and its status (the parking slot occupation) and facility rooms and its status (temperature, humidity and presence):
Data Model
ID: warehouse
Name: Warehouse
Description: Warehouse datamodel for parking and facilities
Category 1
ID: parking
Name: ParkingData Stream 1
Data Stream ID: occupation
Data Stream Name: Parking Space Occupation
Data Stream Description: Parking space occupation detected
JSON schema: boolean
Category 2
ID: facility
Name: Facility
Data Stream 1
Data Stream ID: temperature
Data Stream Name: Temperature
Data Stream Description: Ambient temperature registered
JSON schema: number
Data Stream 2
Data Stream ID: humidity
Data Stream Name: Humidity
Data Stream Description: Humidity registered
JSON schema: number
Data Stream 3
Data Stream ID: presence
Data Stream Name: Presence
Data Stream Description: Presence detected
JSON schema: boolean
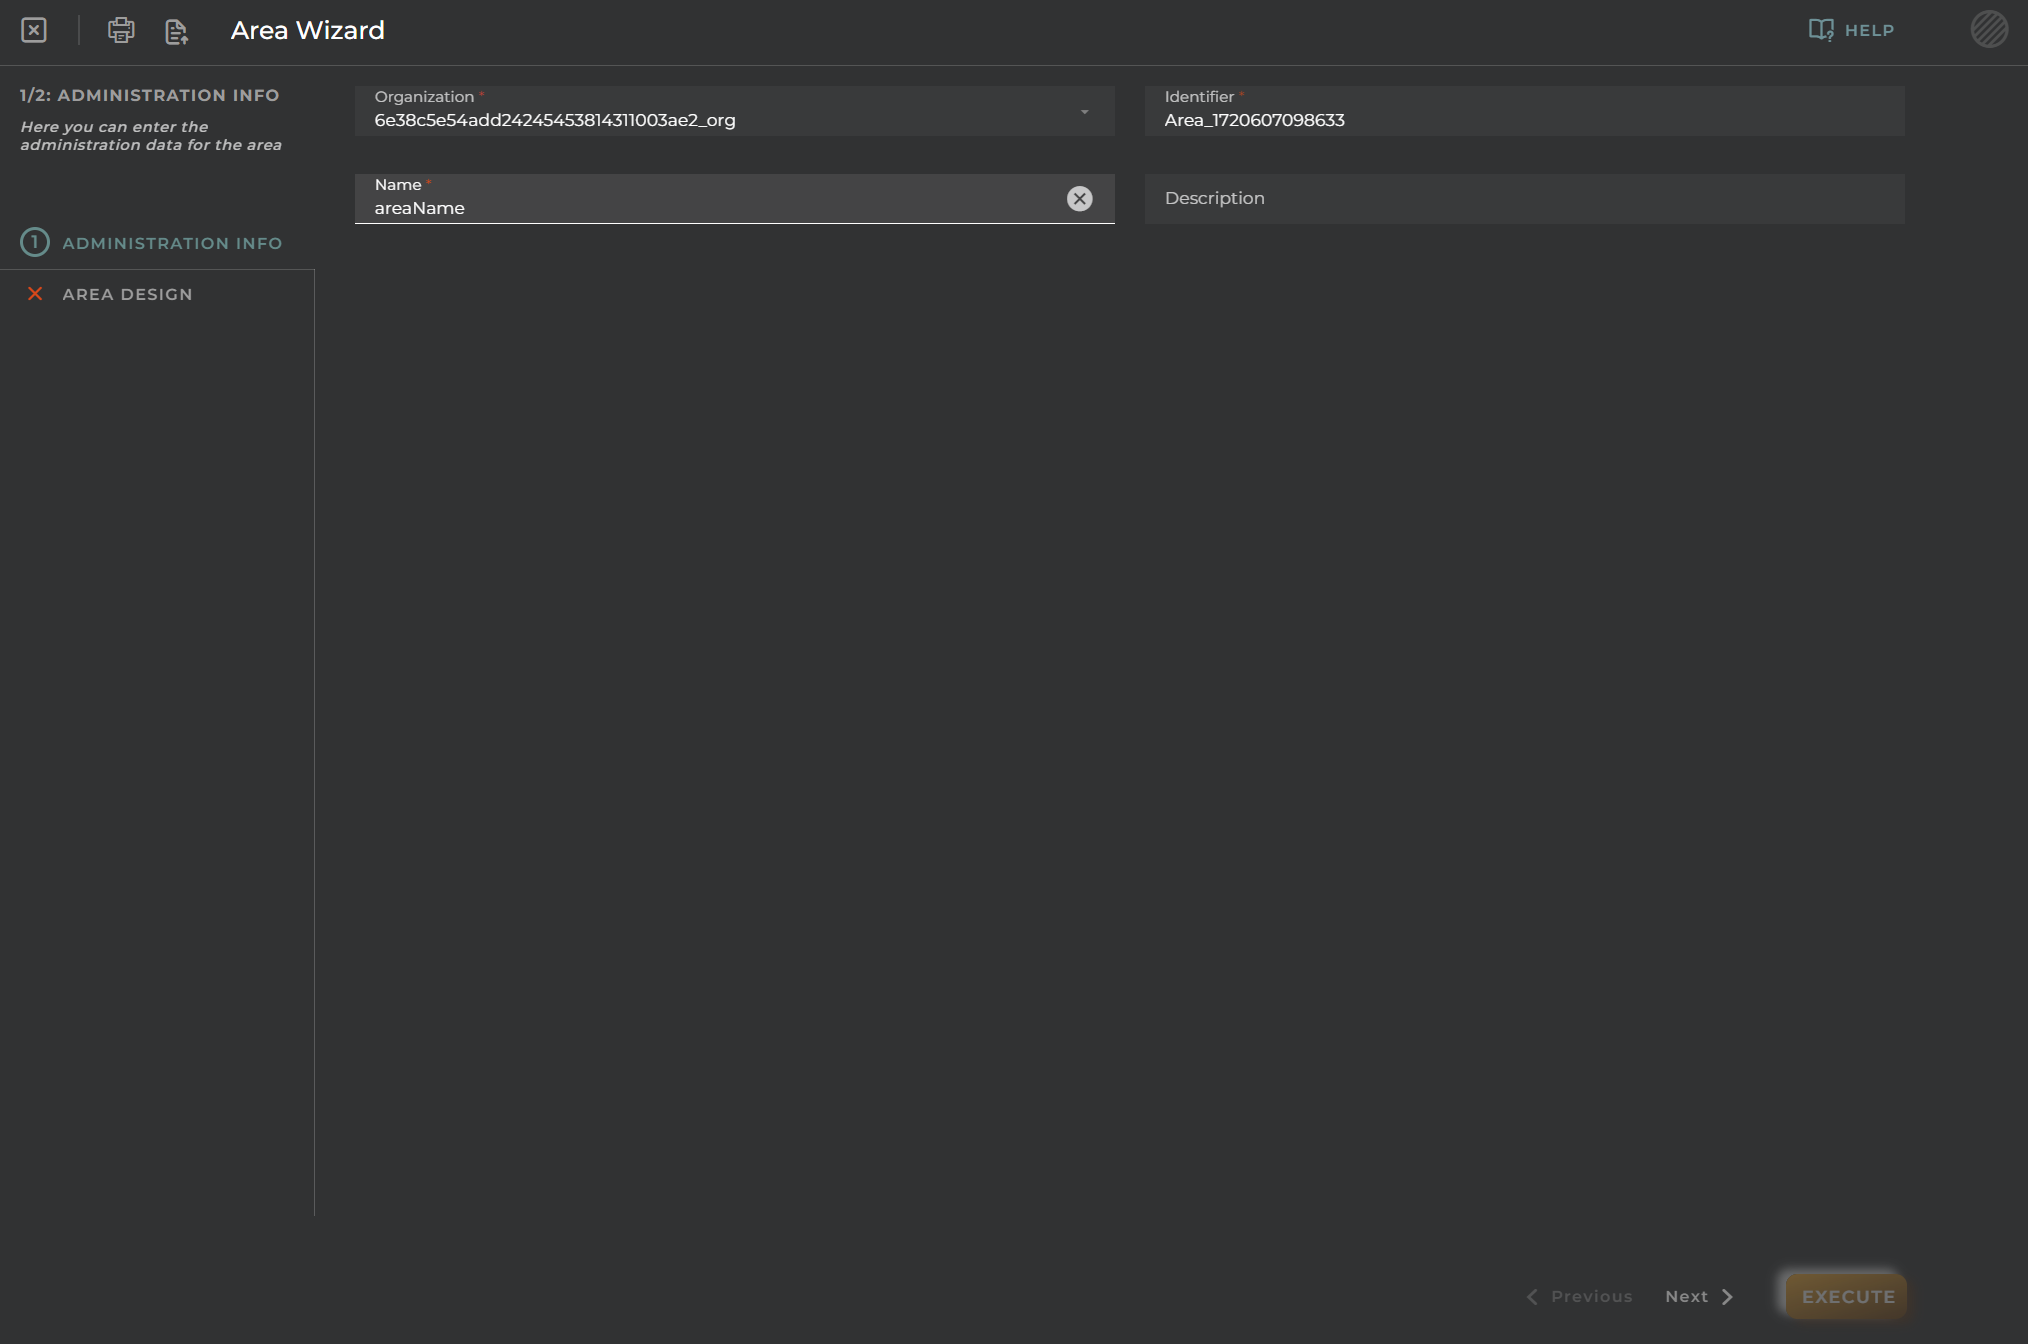
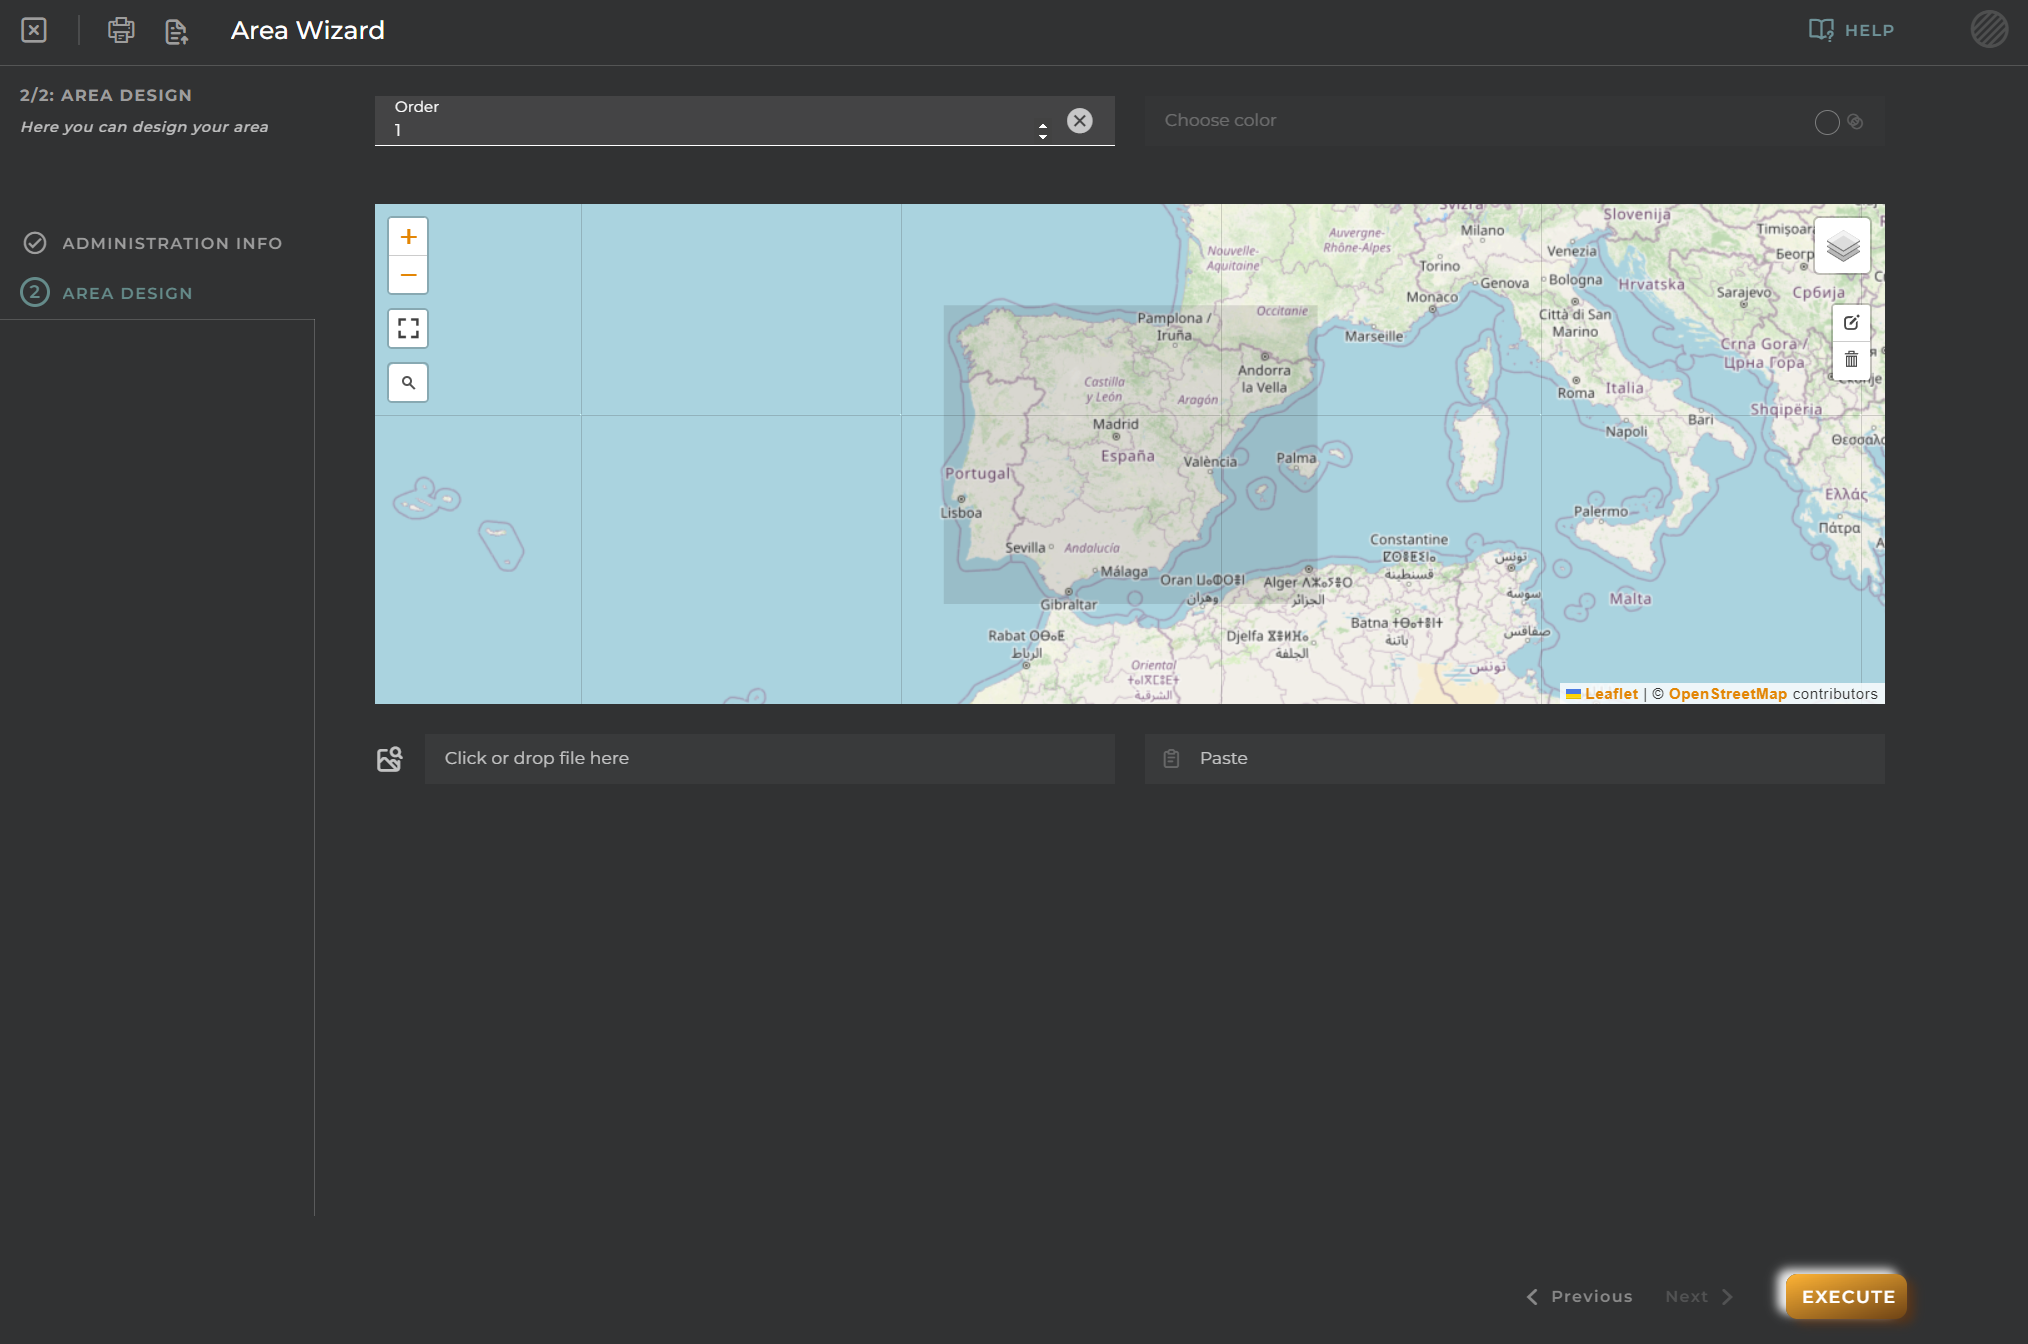
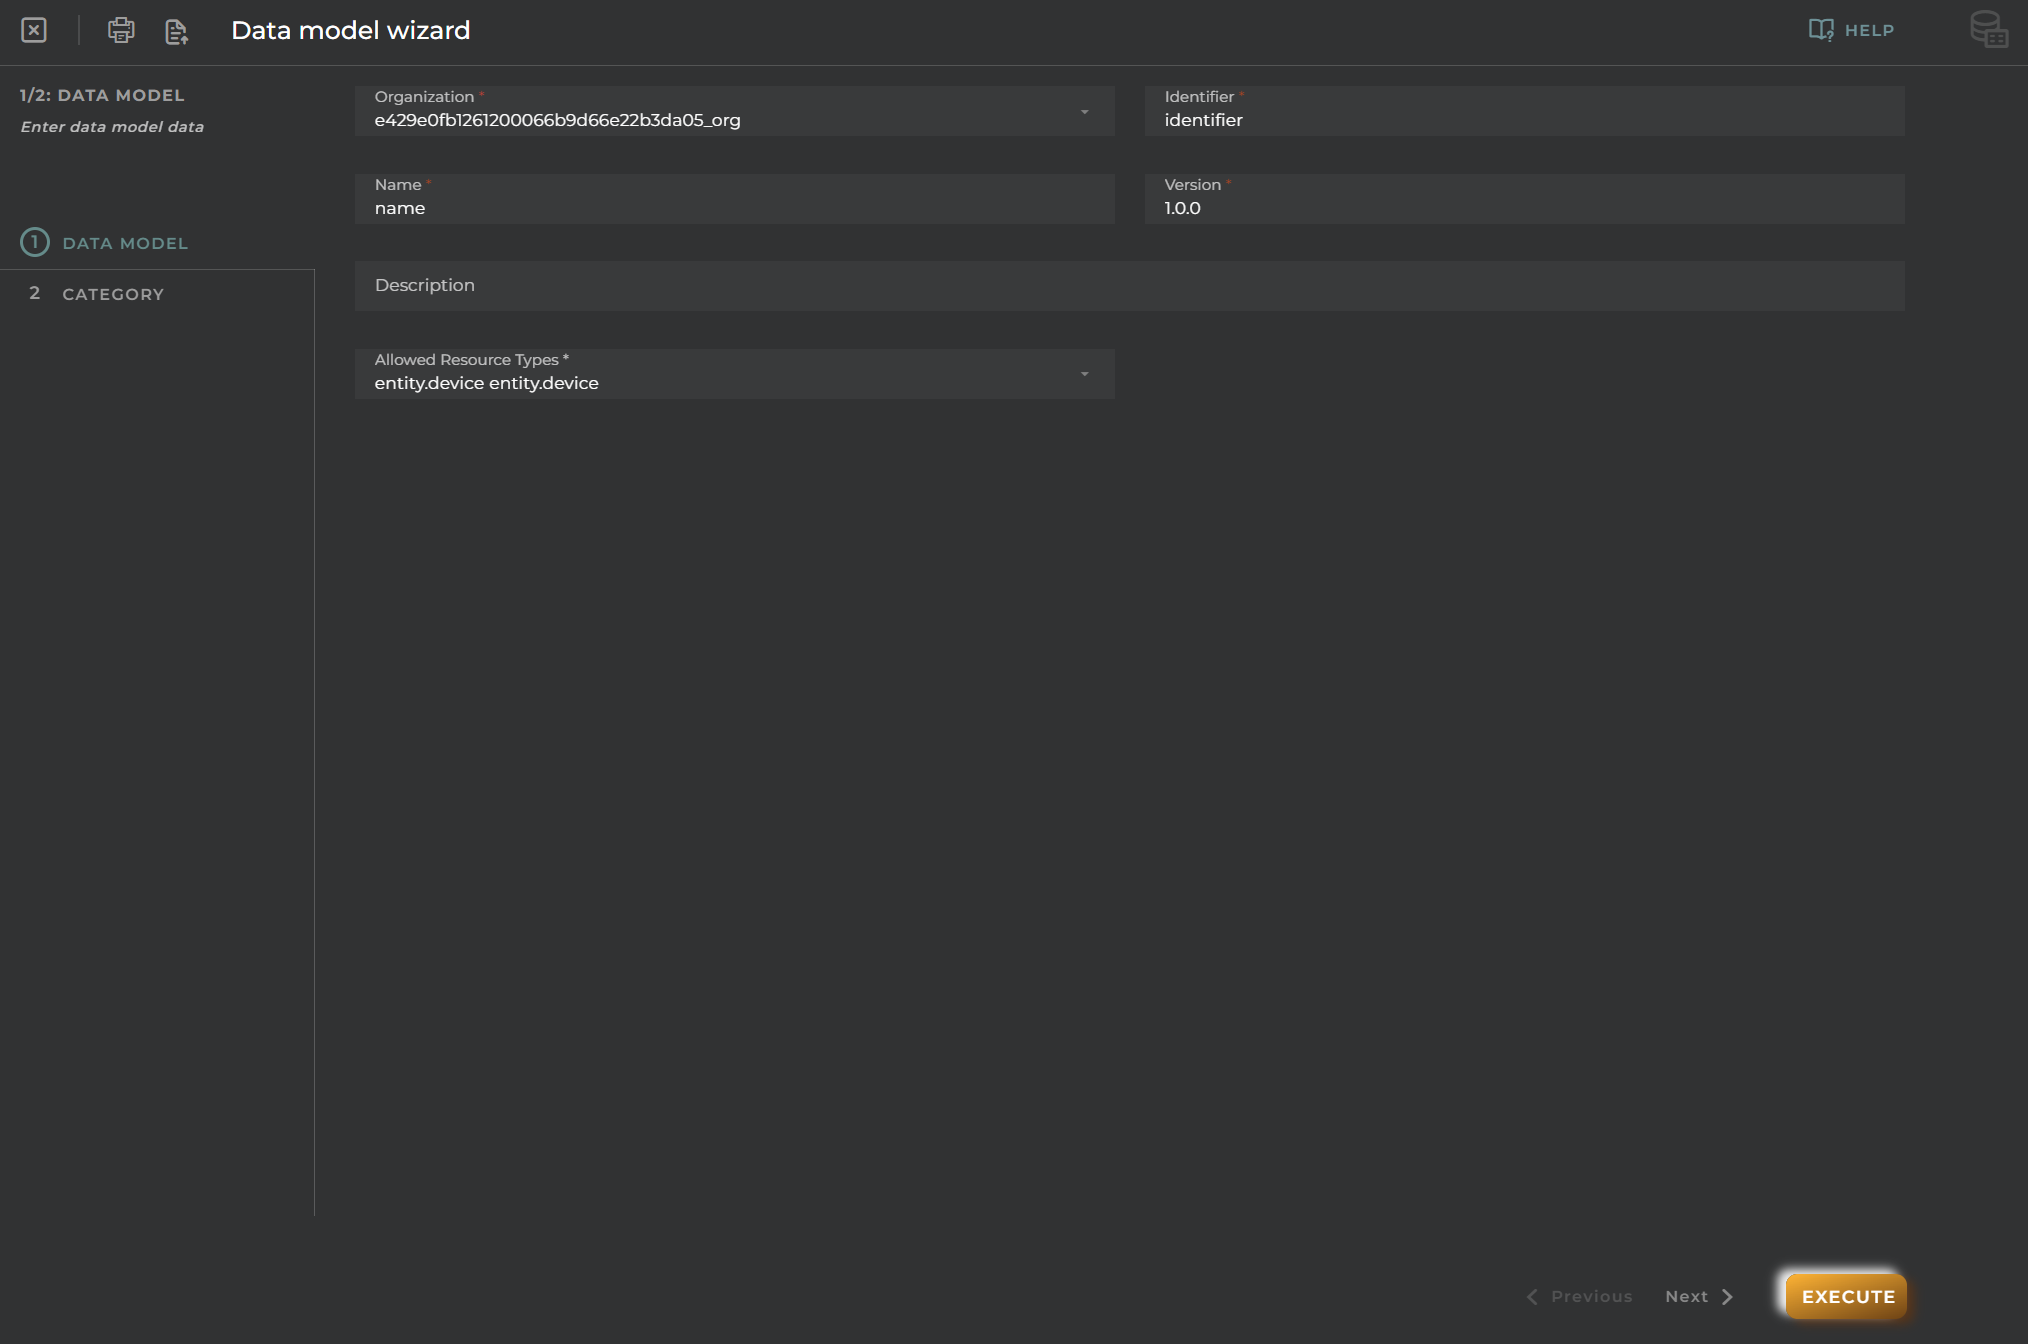
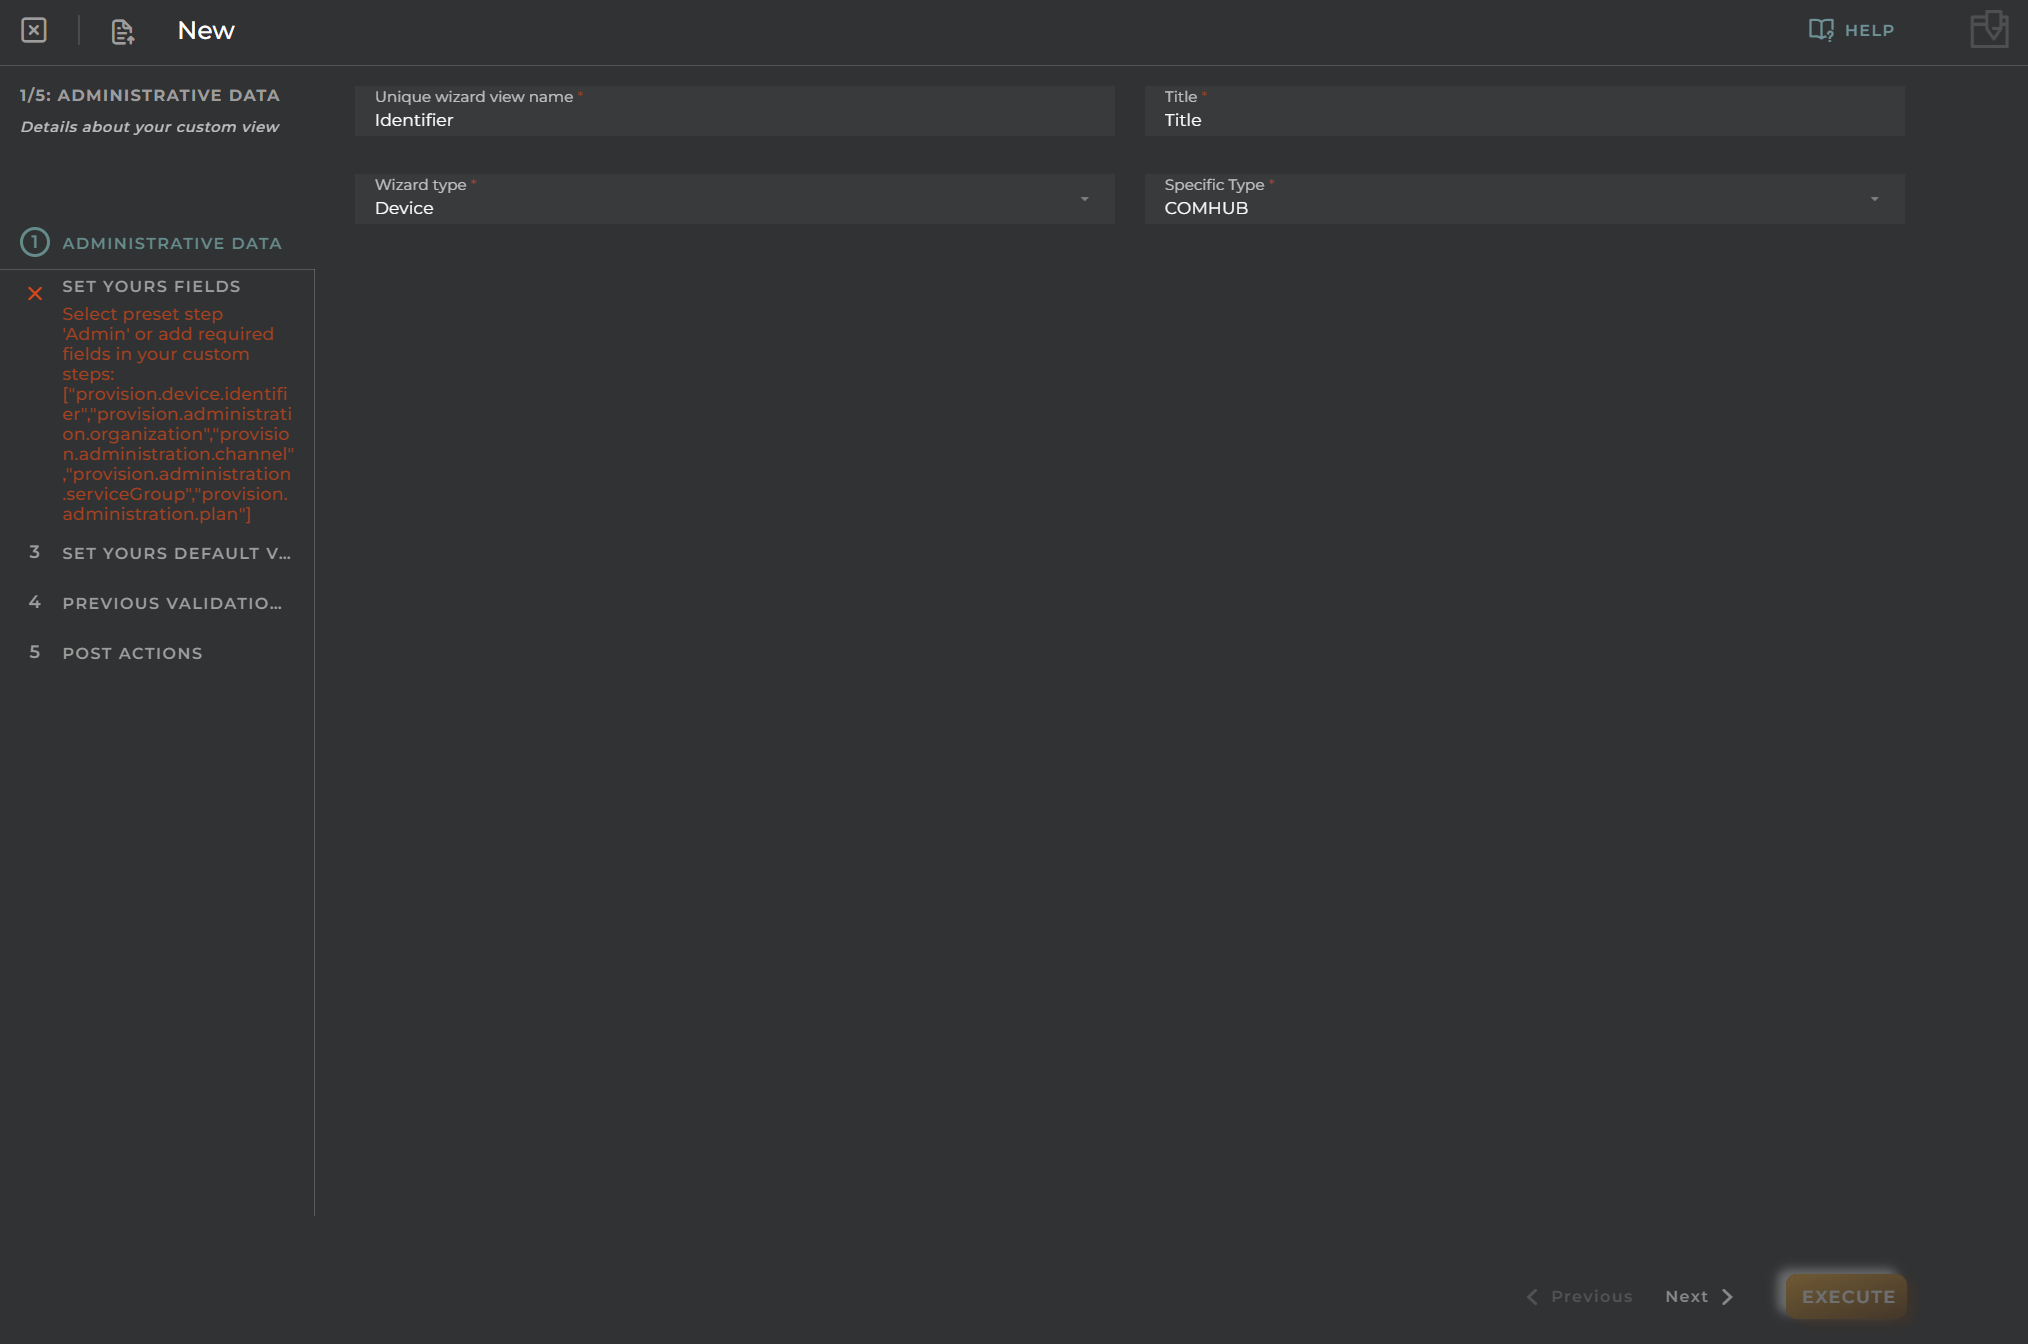
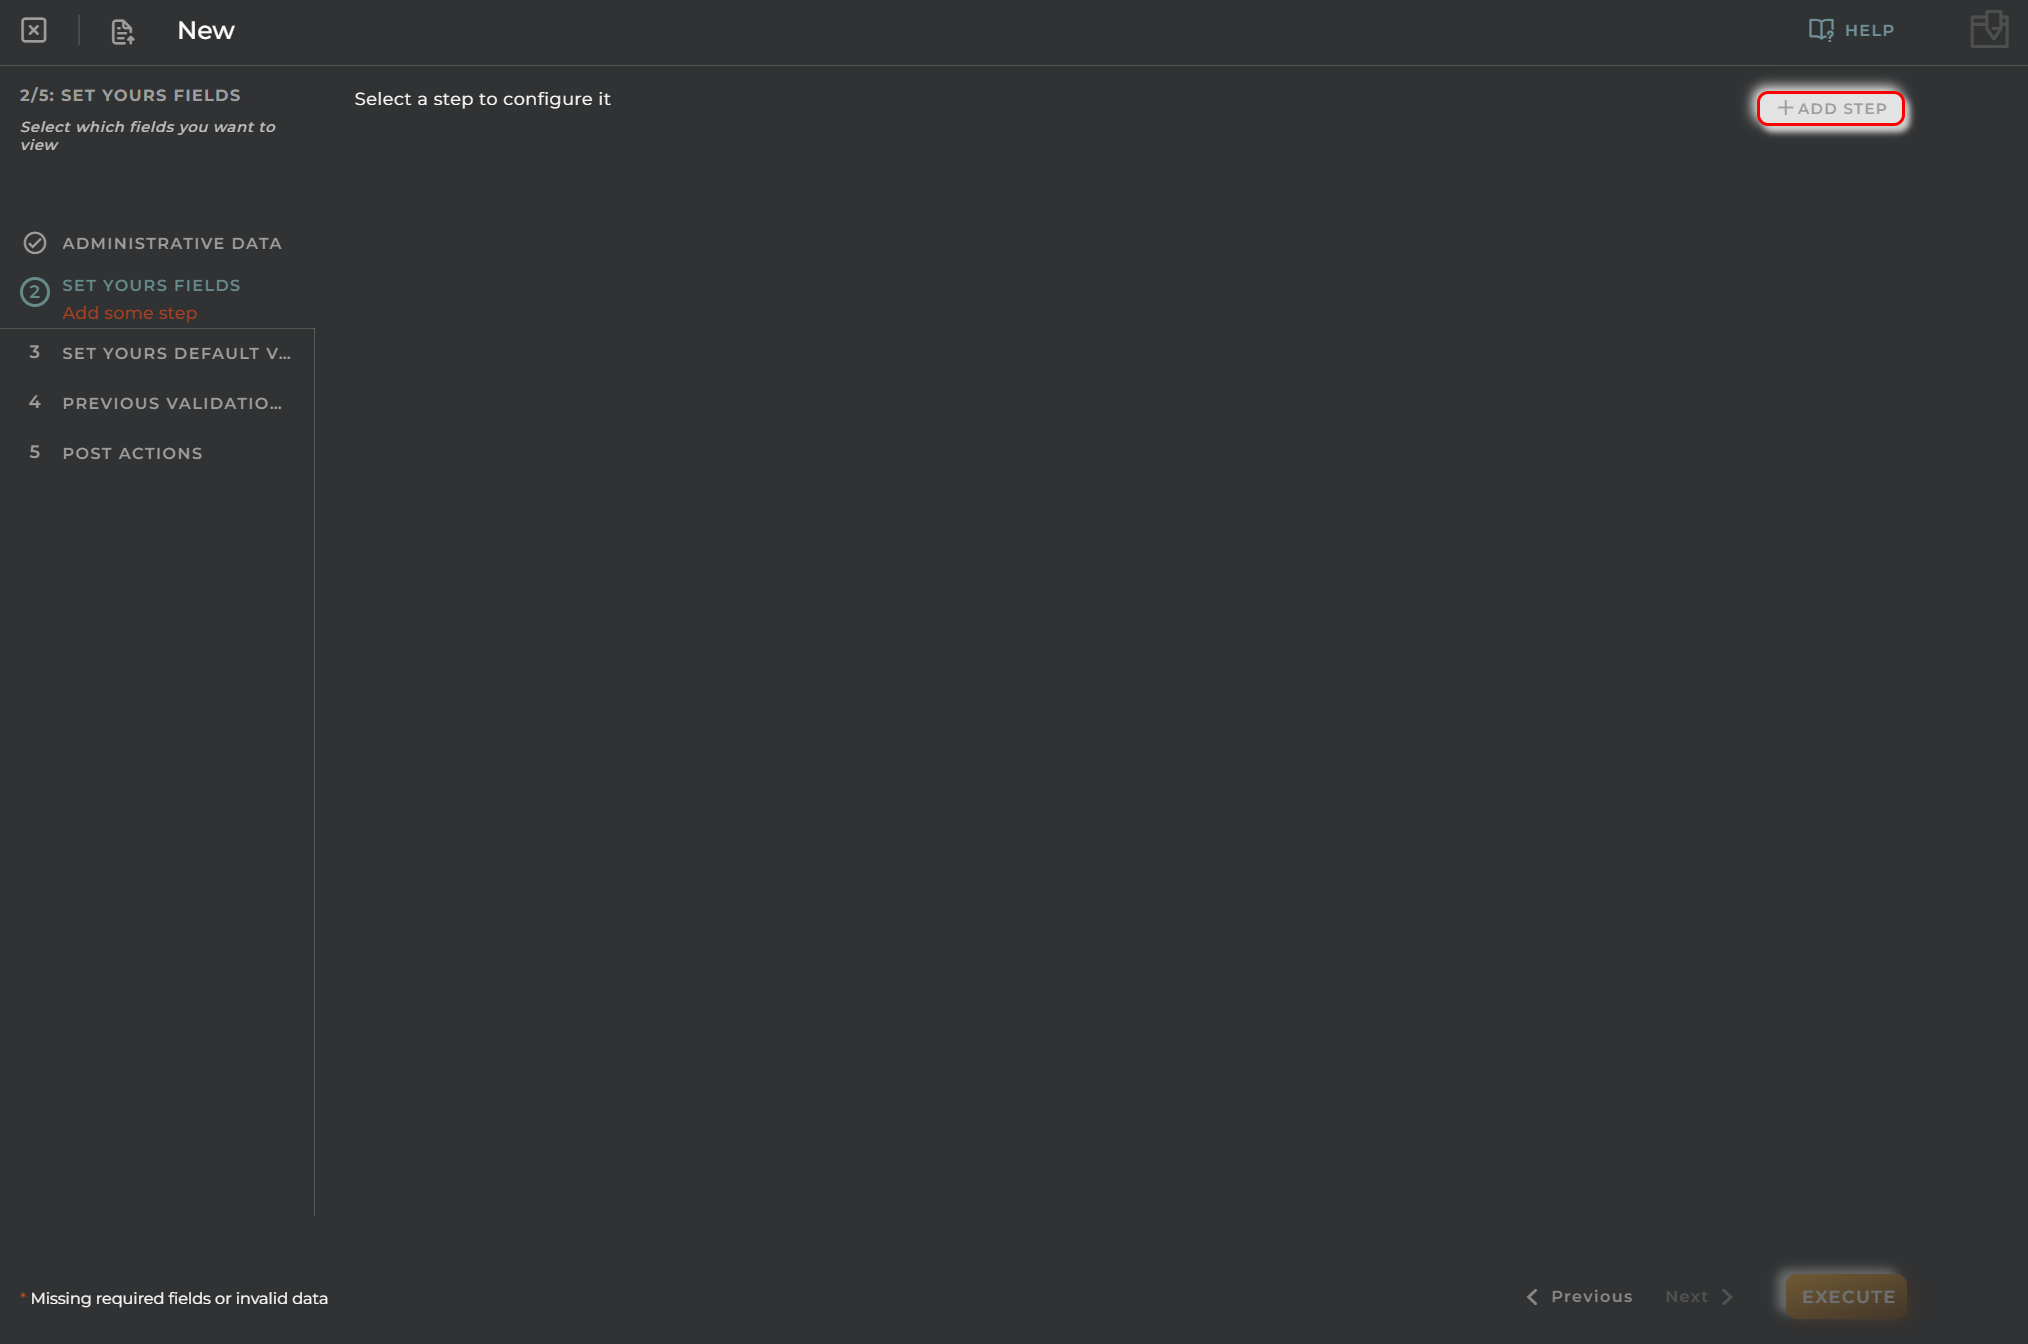
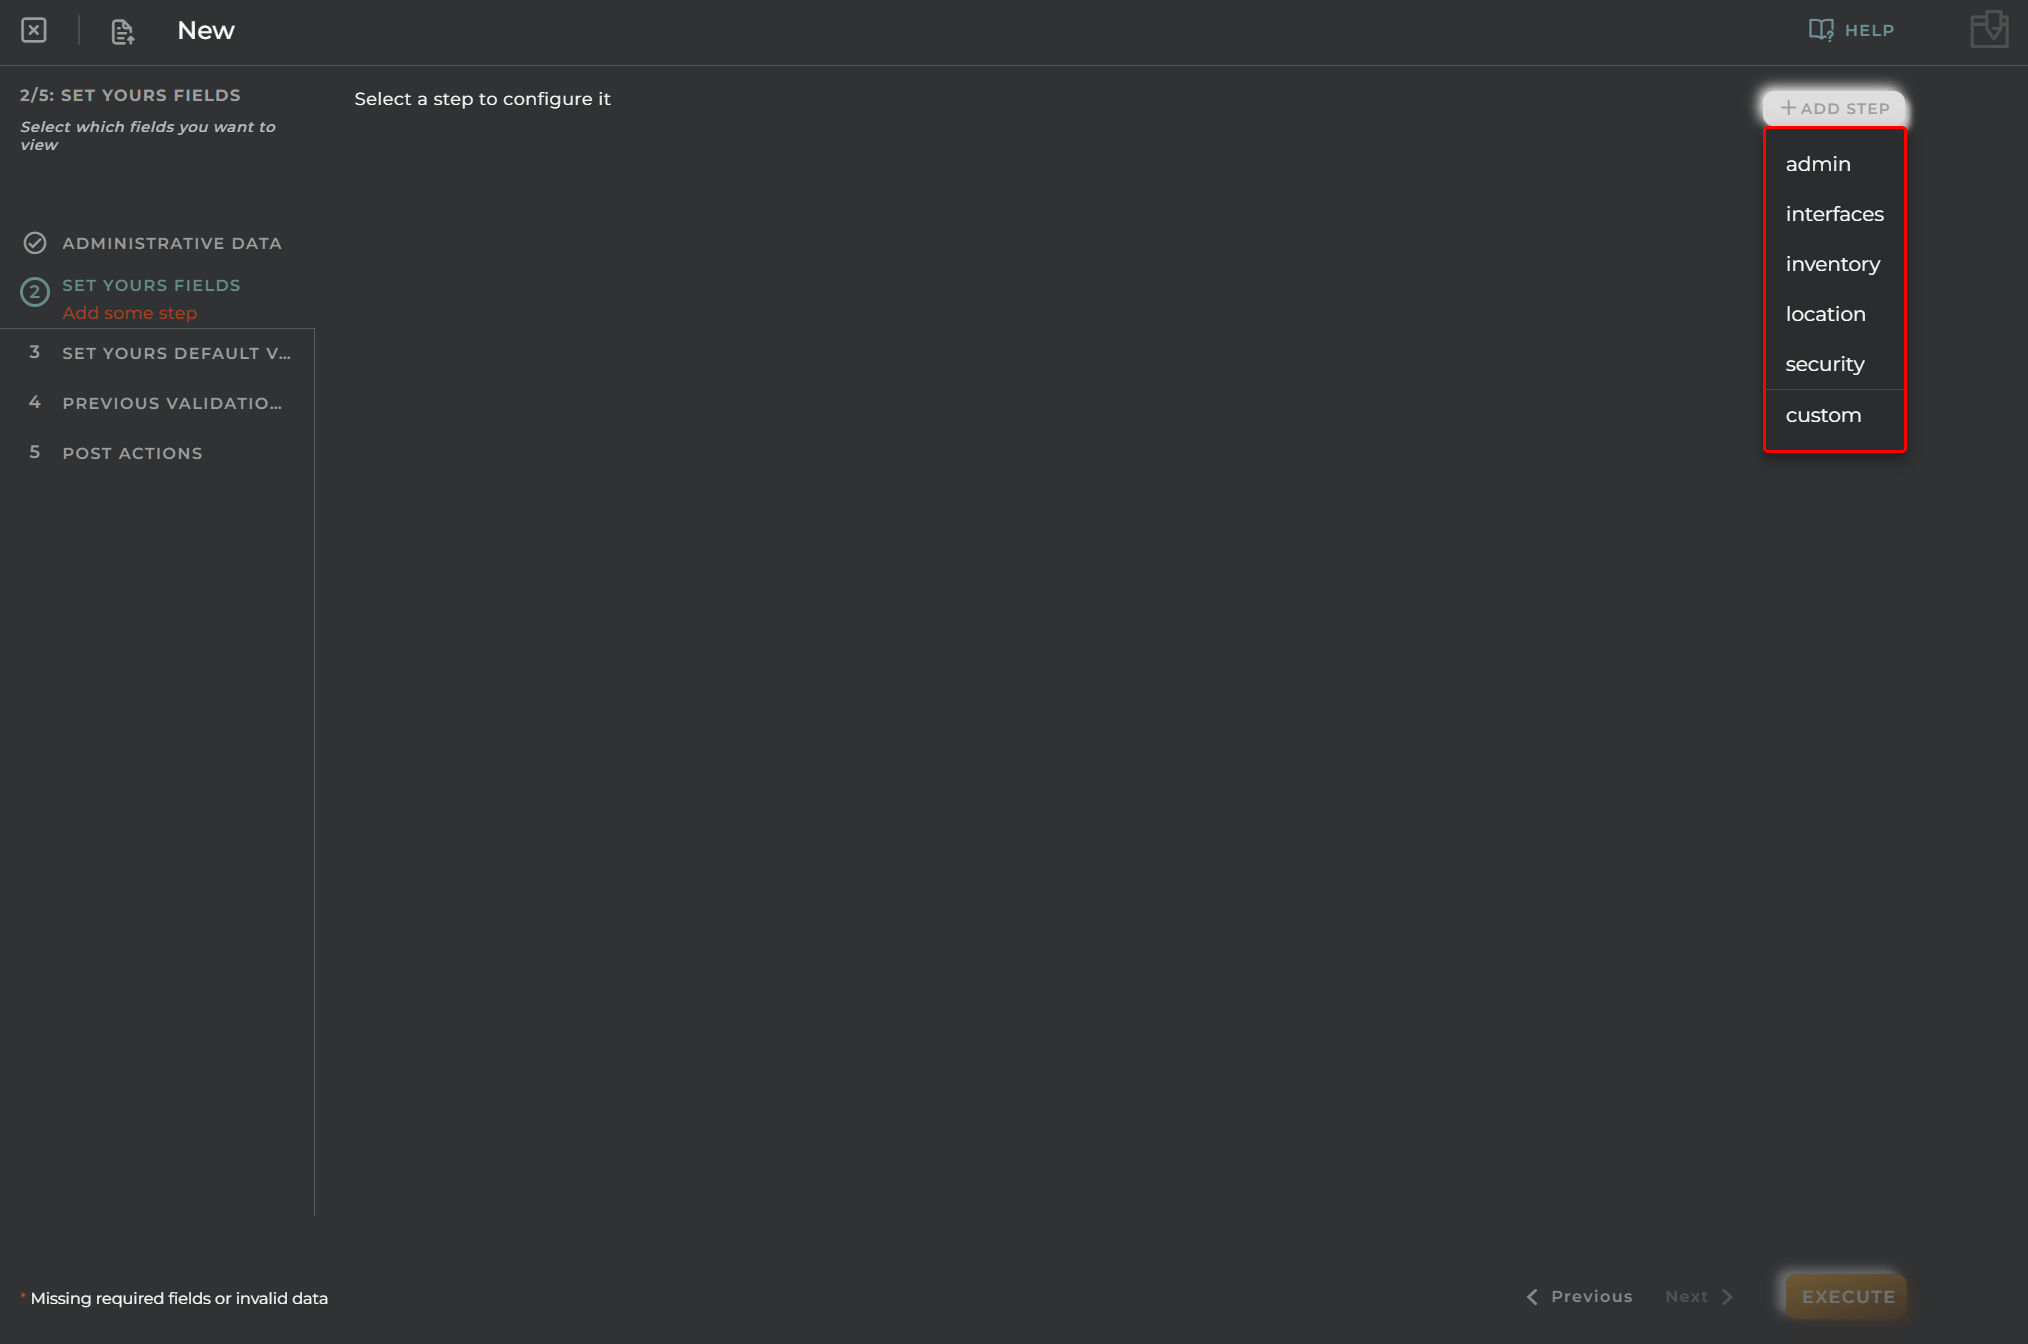
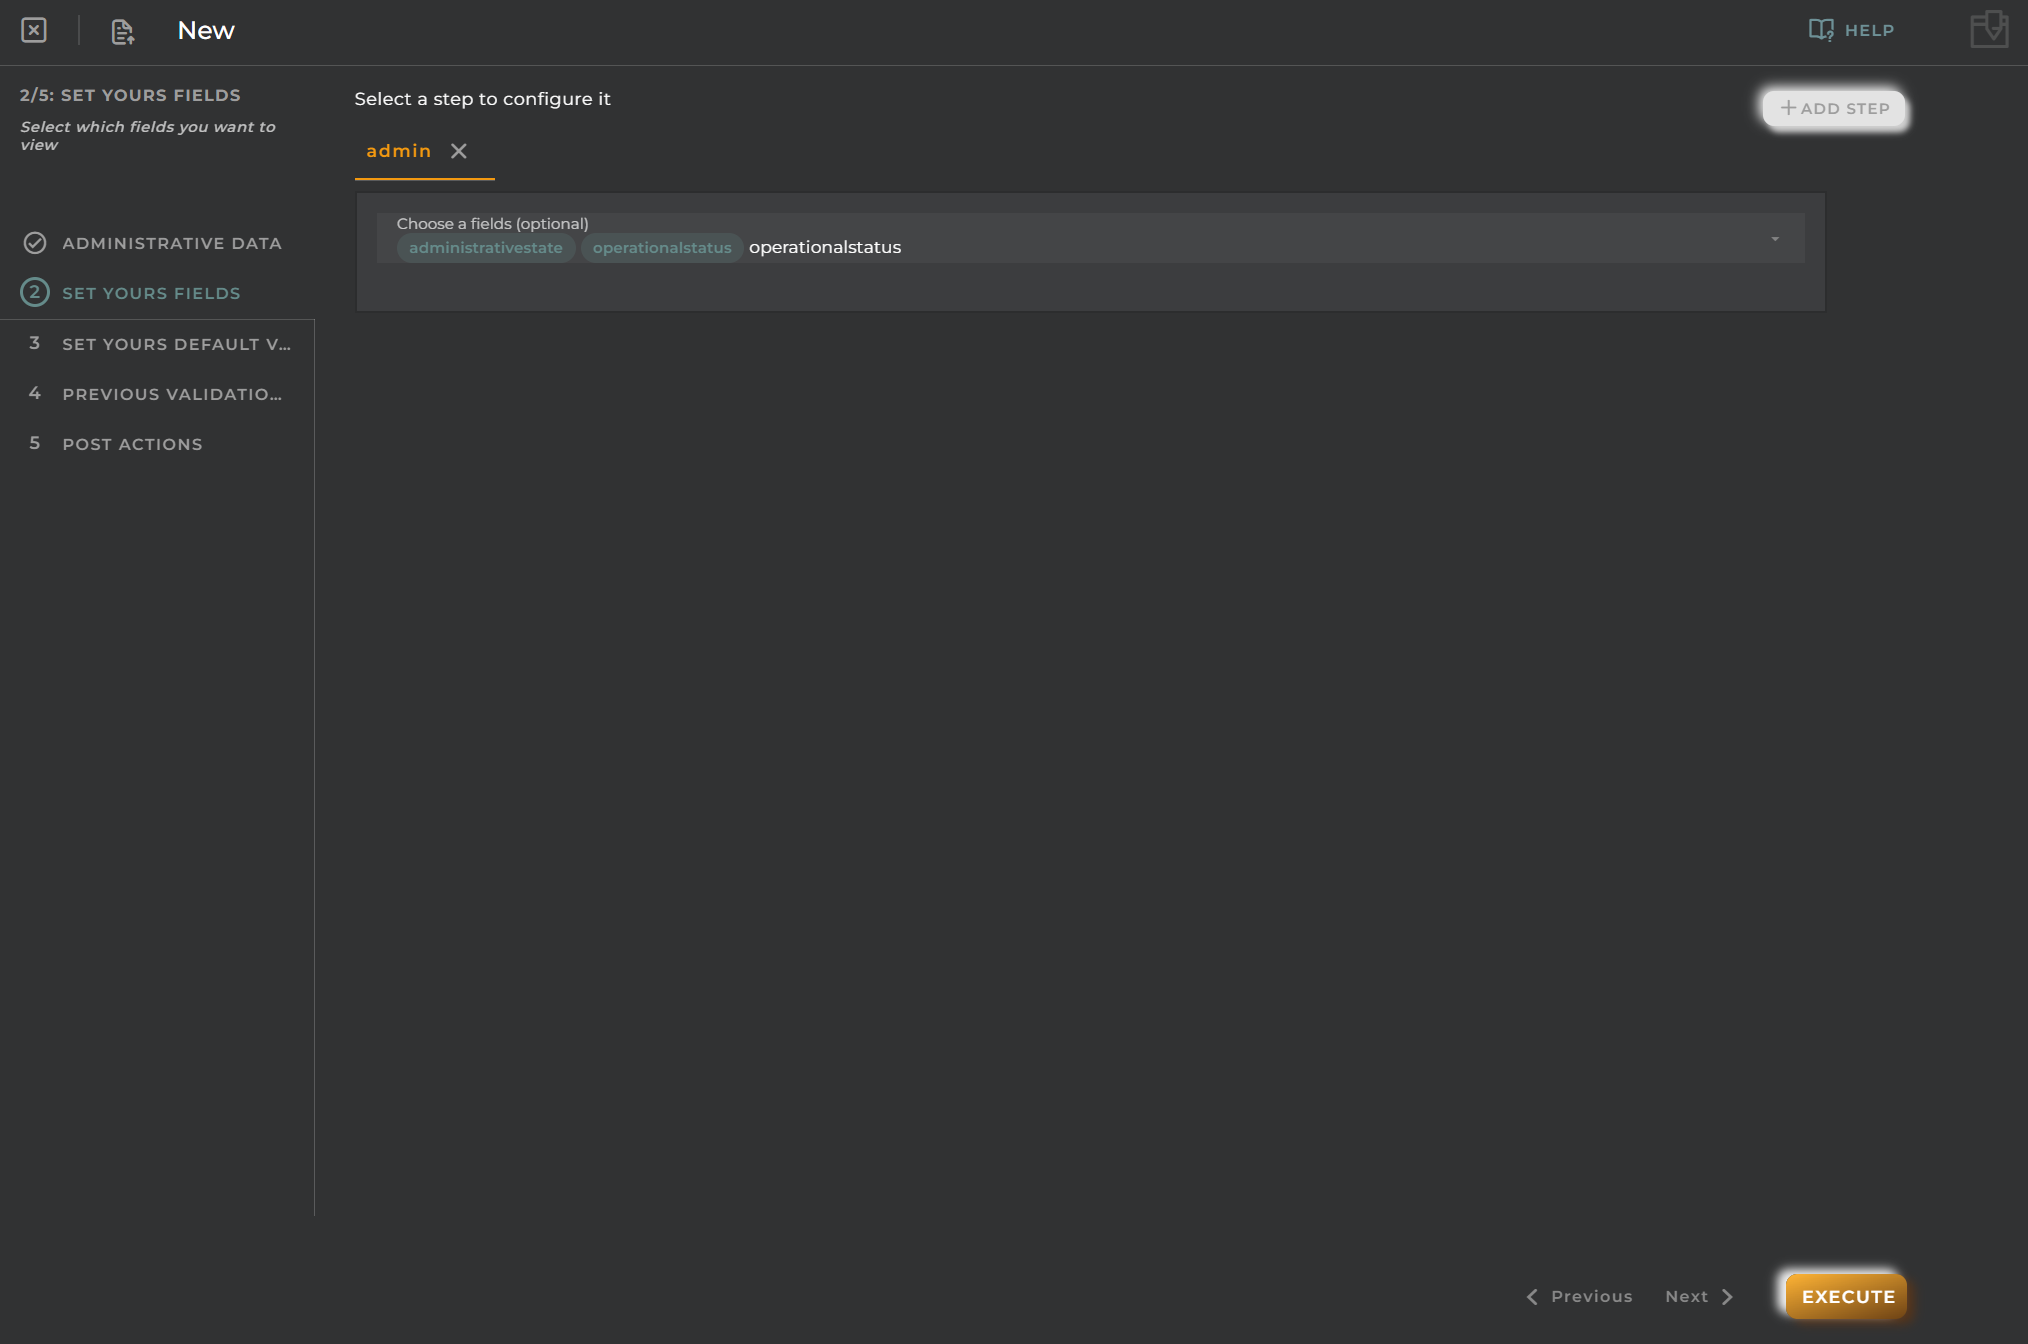
1. Open the Data model wizard
To do that, go to “OpenGate Management > Data Models” and click on “+ Create Datamodel”. This opens the wizard to create your new datamodel.
2. Create the new Data Model
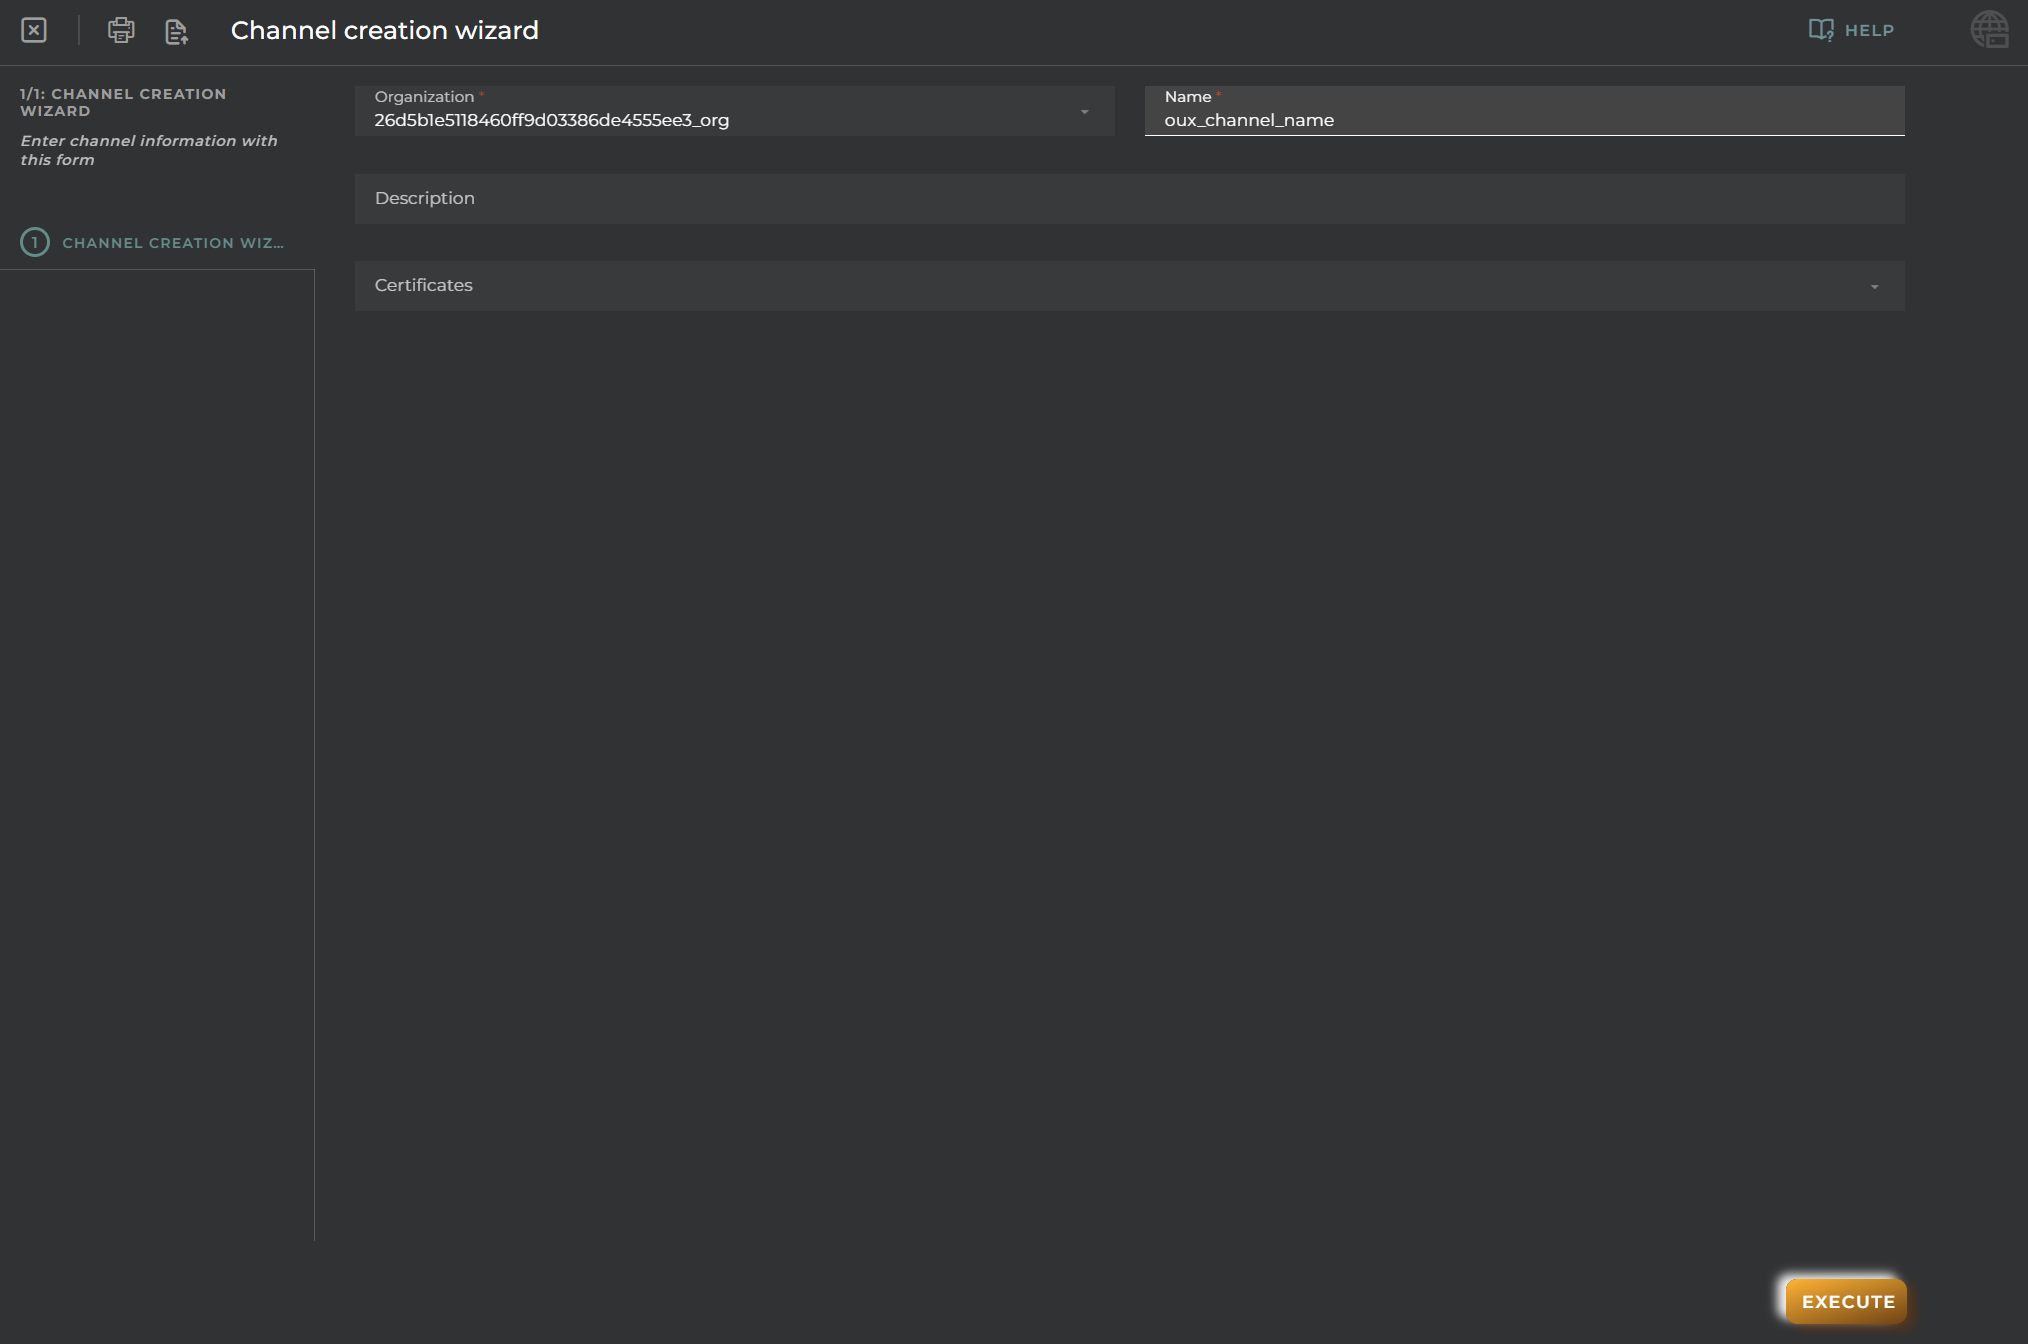
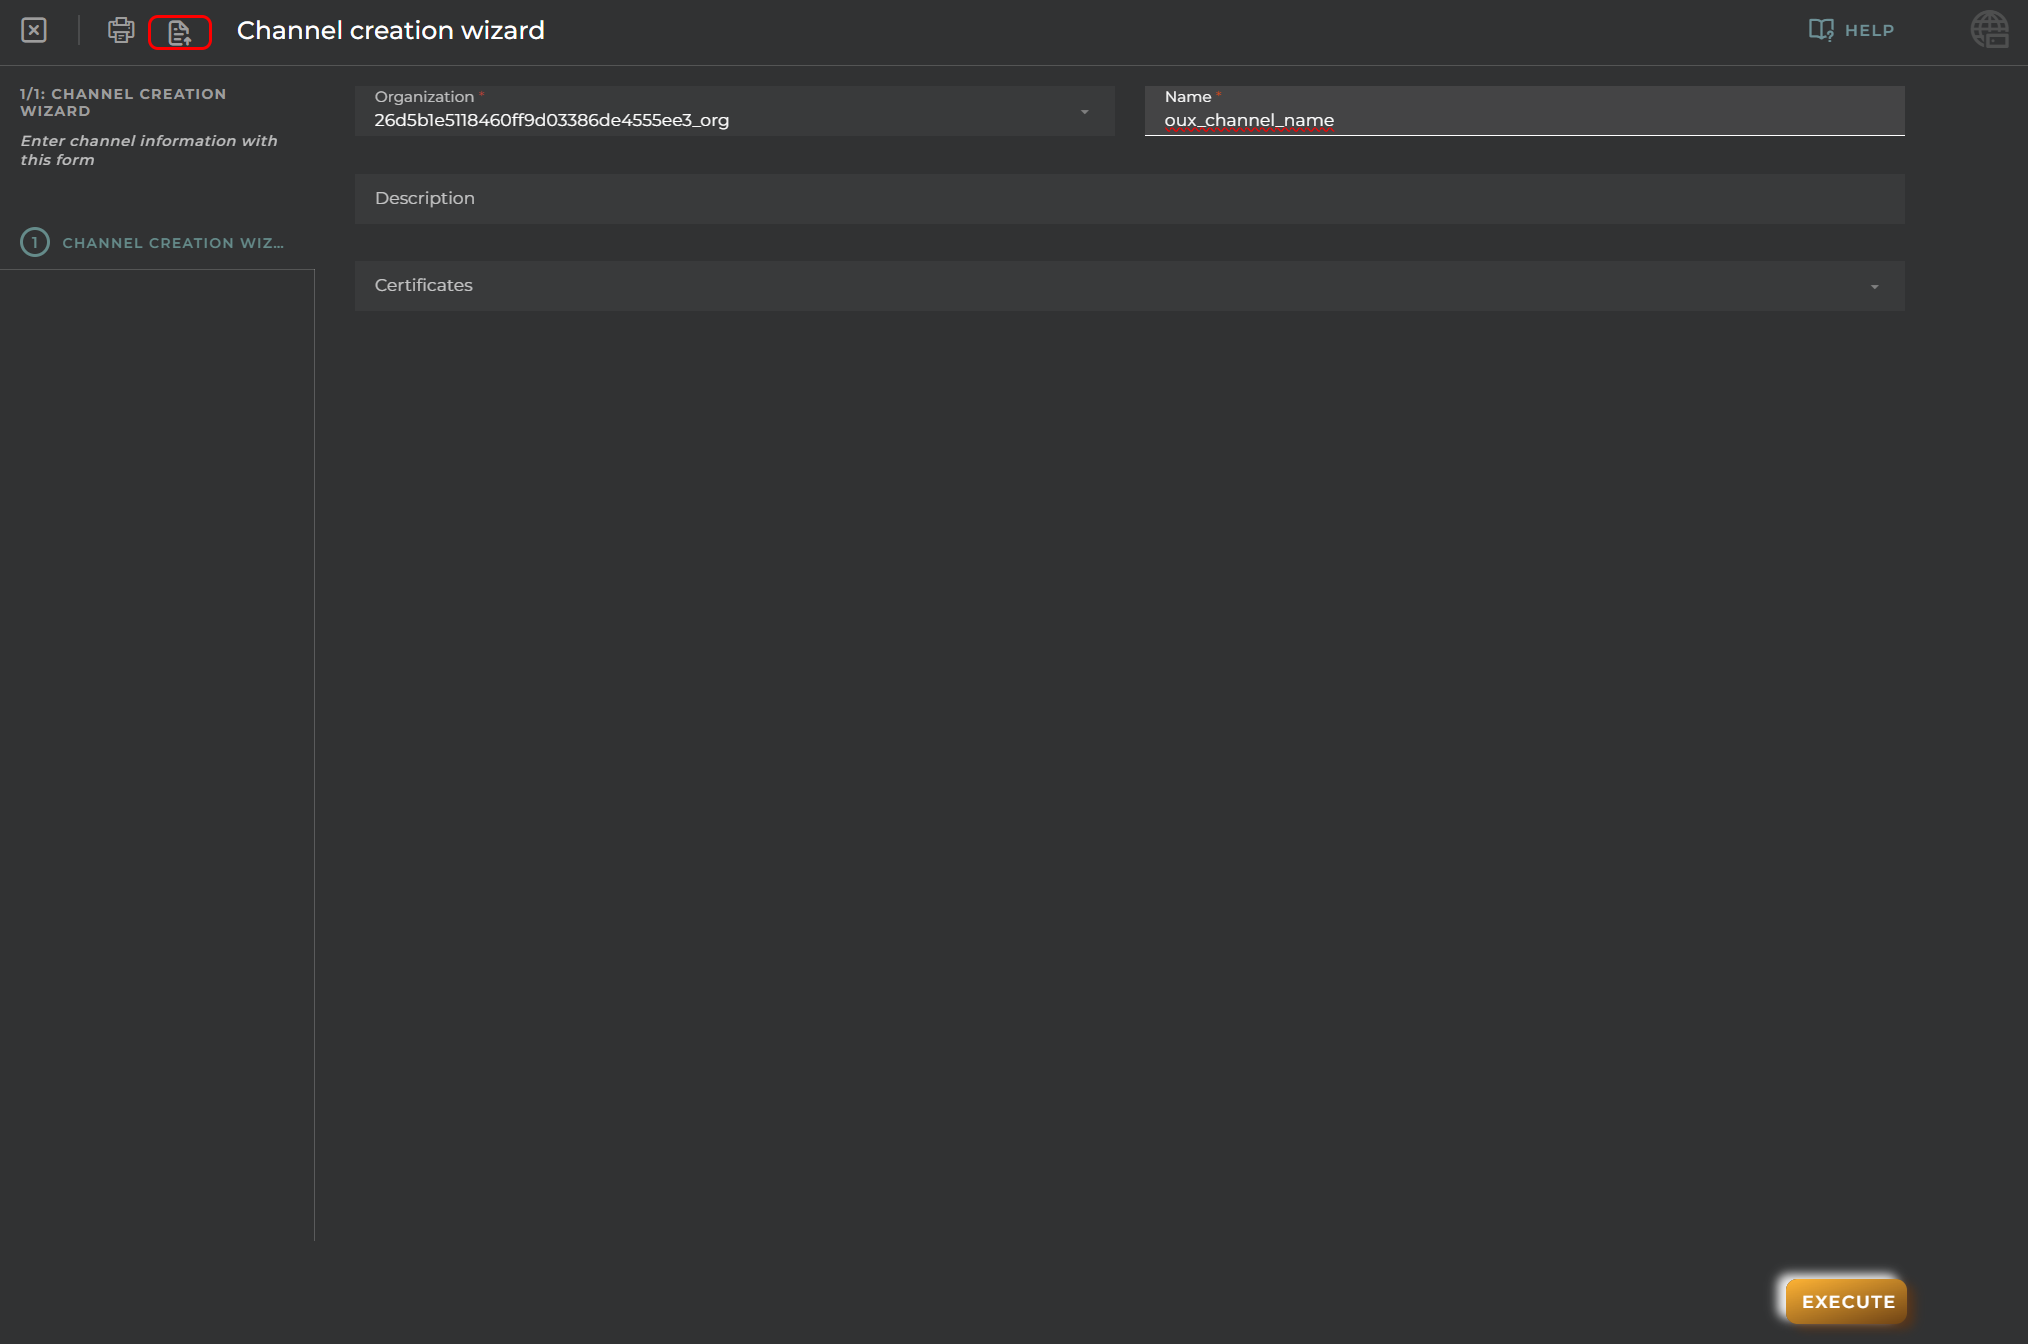
It is possible to import a JSON file to fill the form (this will be provided bellow), or to follow the wizard to fill the data model information. Because is your first datamodel, we recommend you to fill it manually to fully understand each step, so let’s create the data model “warehouse”:
Allowed Resource Types: This field indicates to what type of entities this datamodel applies. For this demo, we will choose device and asset (We detailed the different entity types in the next section: 4-Entity Provisioning).
For this tutorial, we will create later the assets to represent parking slots and facility rooms and some devices for the different sensors that each asset has.
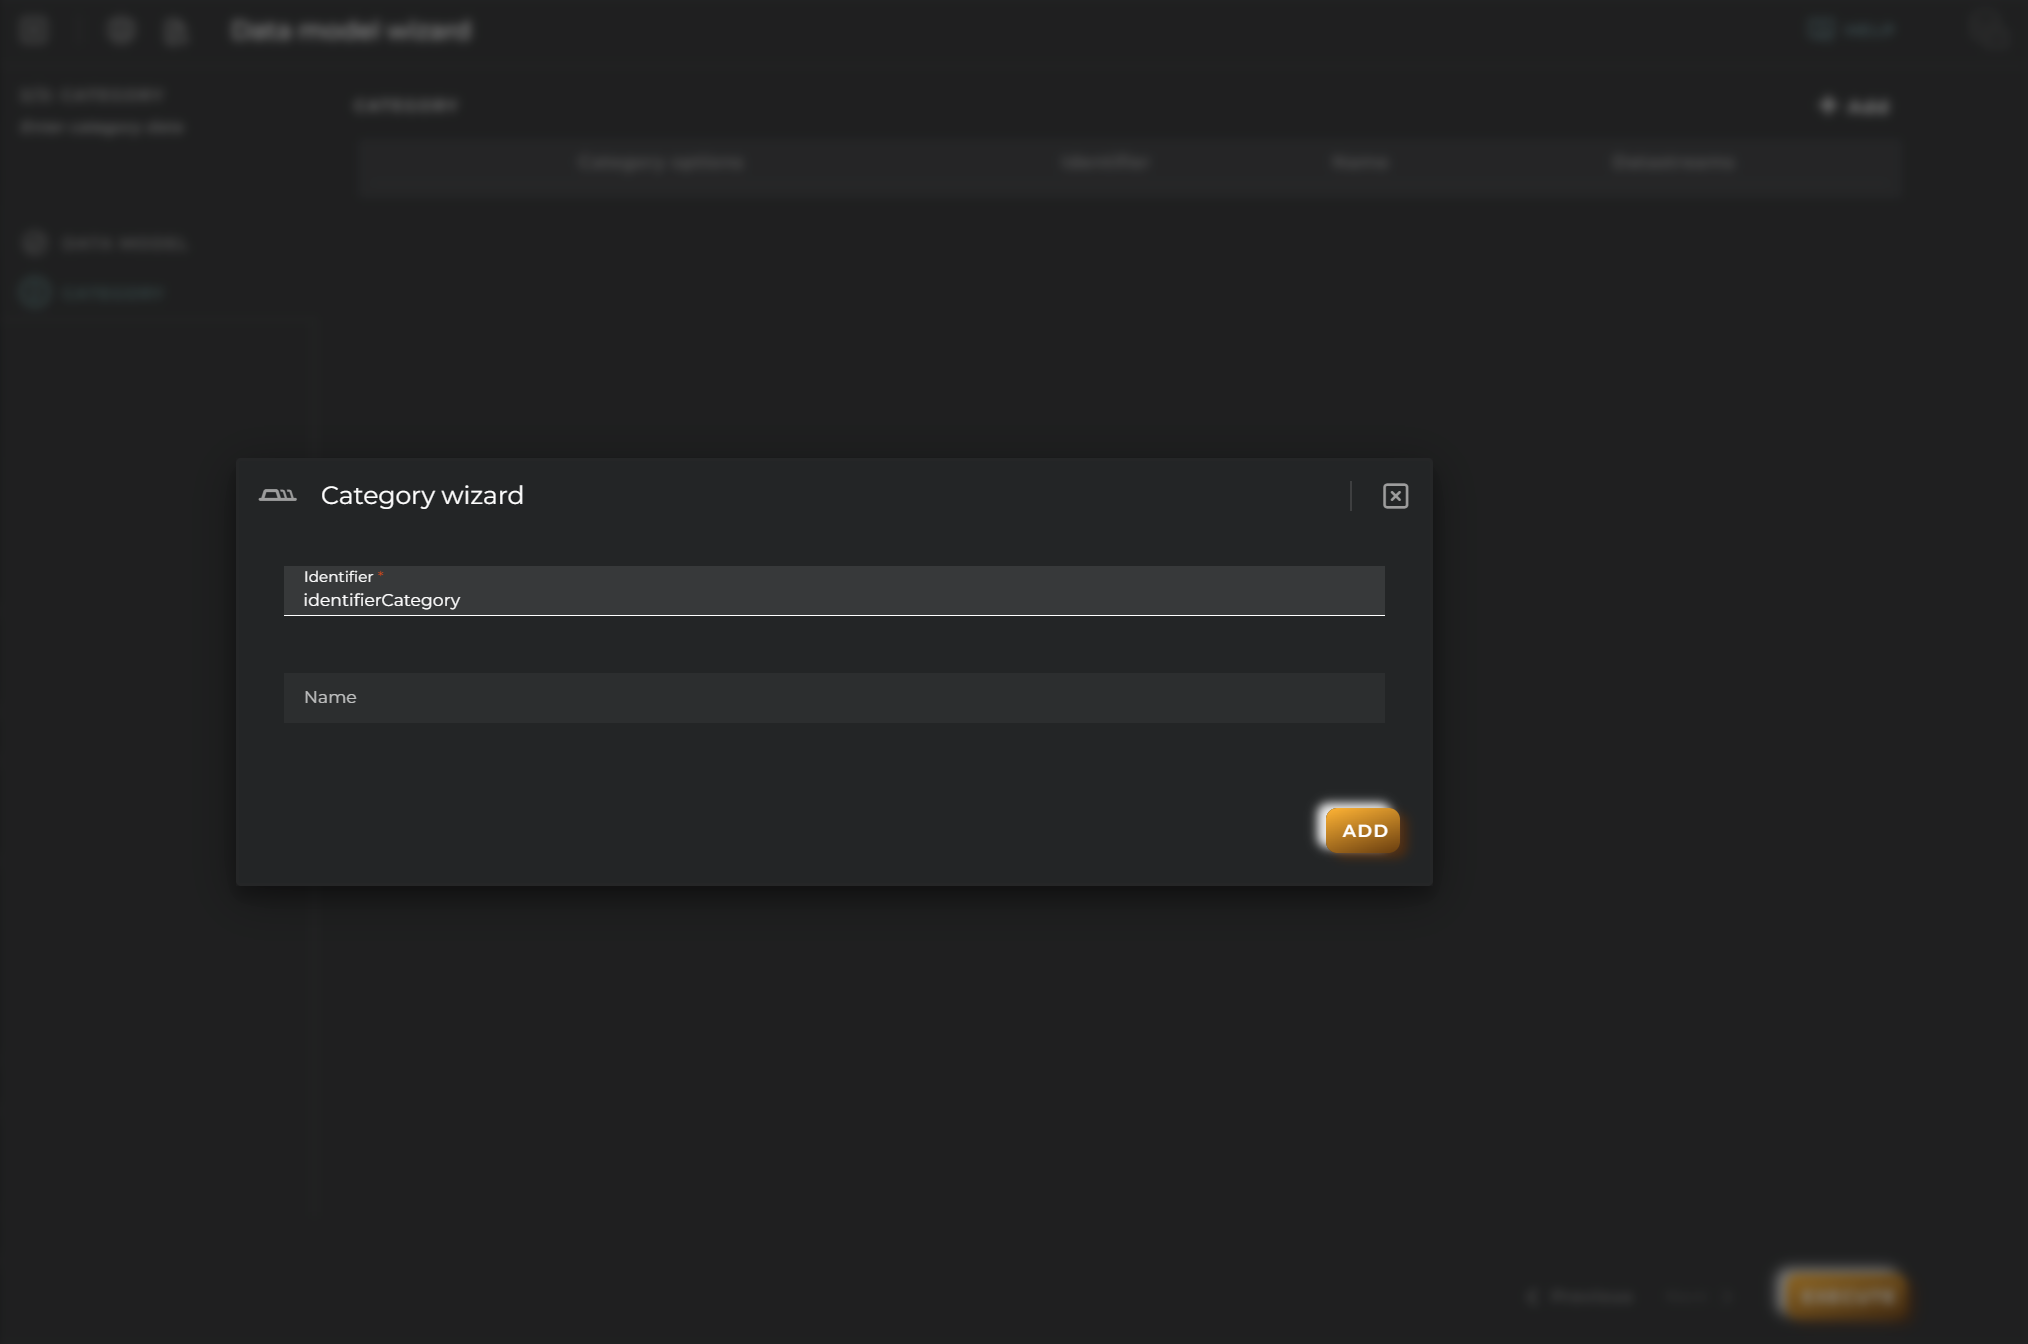
3. Create the first category
So, next step, we are going to create the category “parking”:
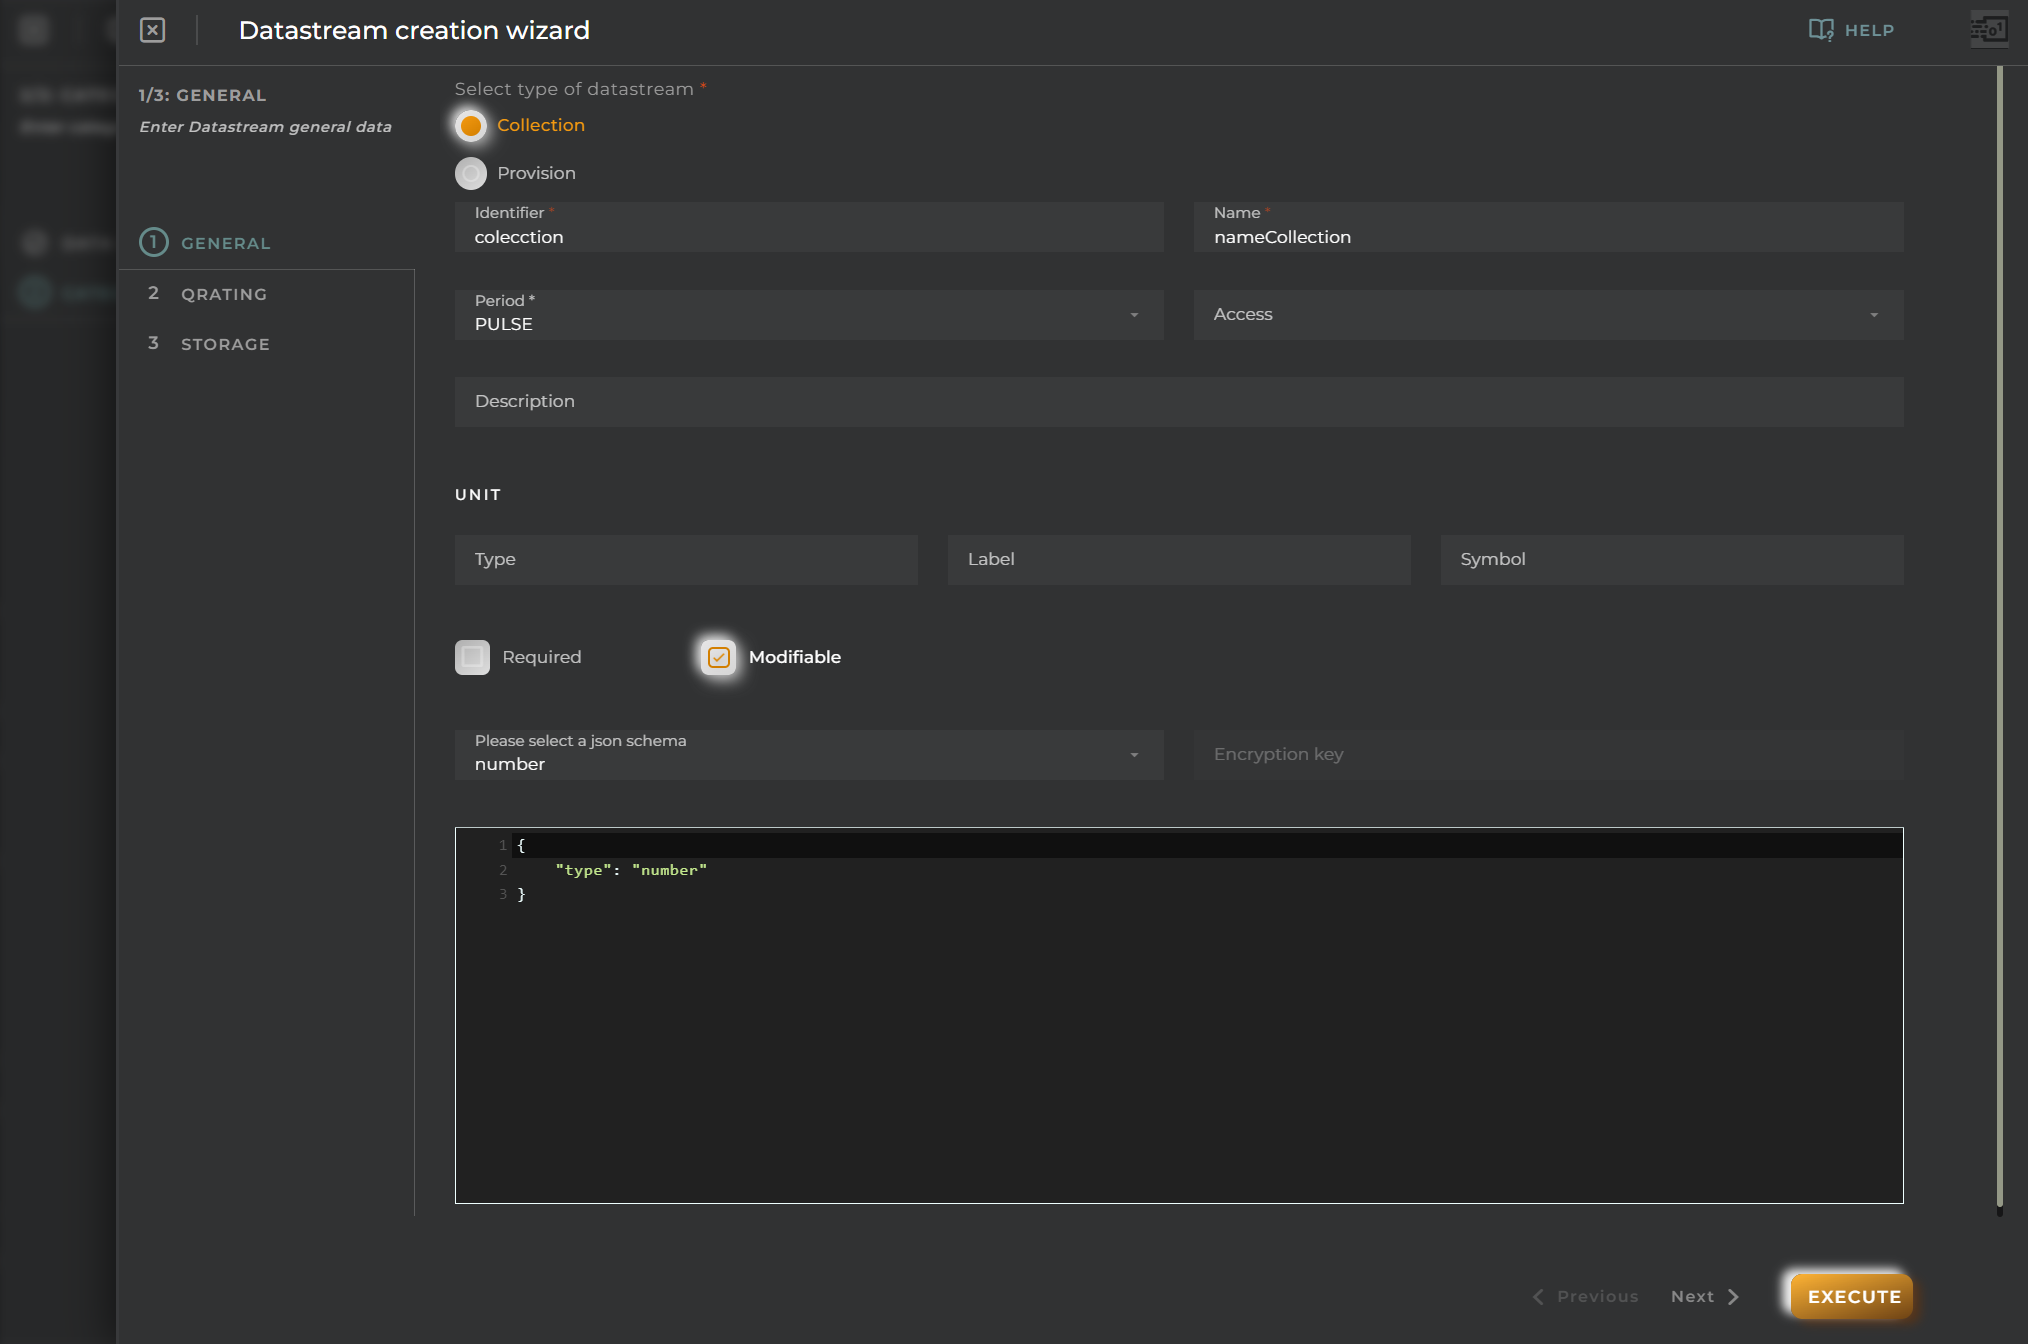
4. Create the first data stream
And then, create the datastreams from “+ ADD DATASTREAMS” button
Lets start with the first datastream “occupation”:
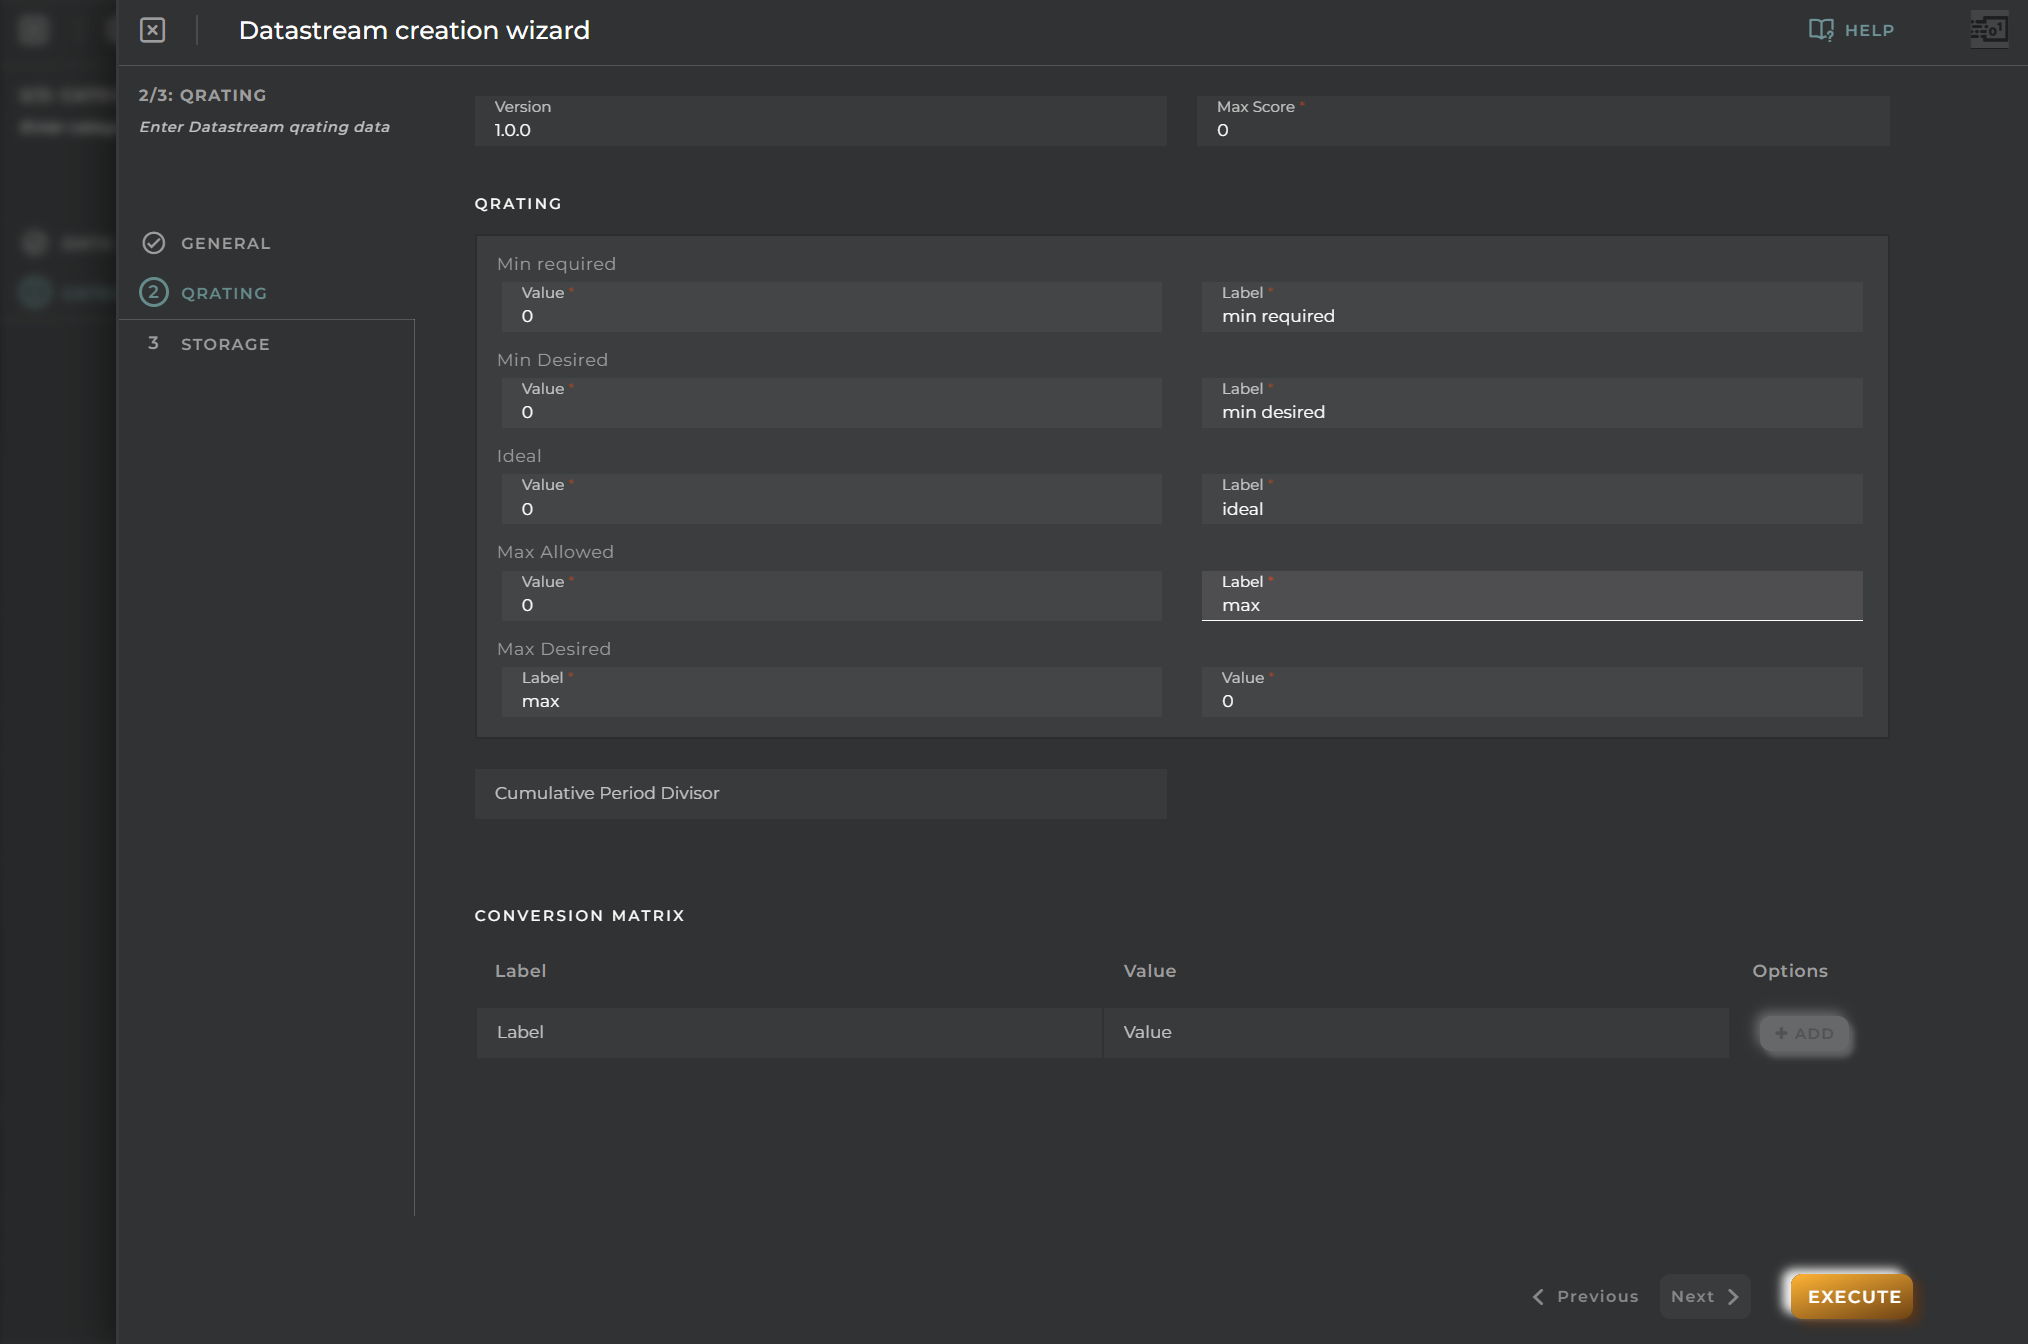
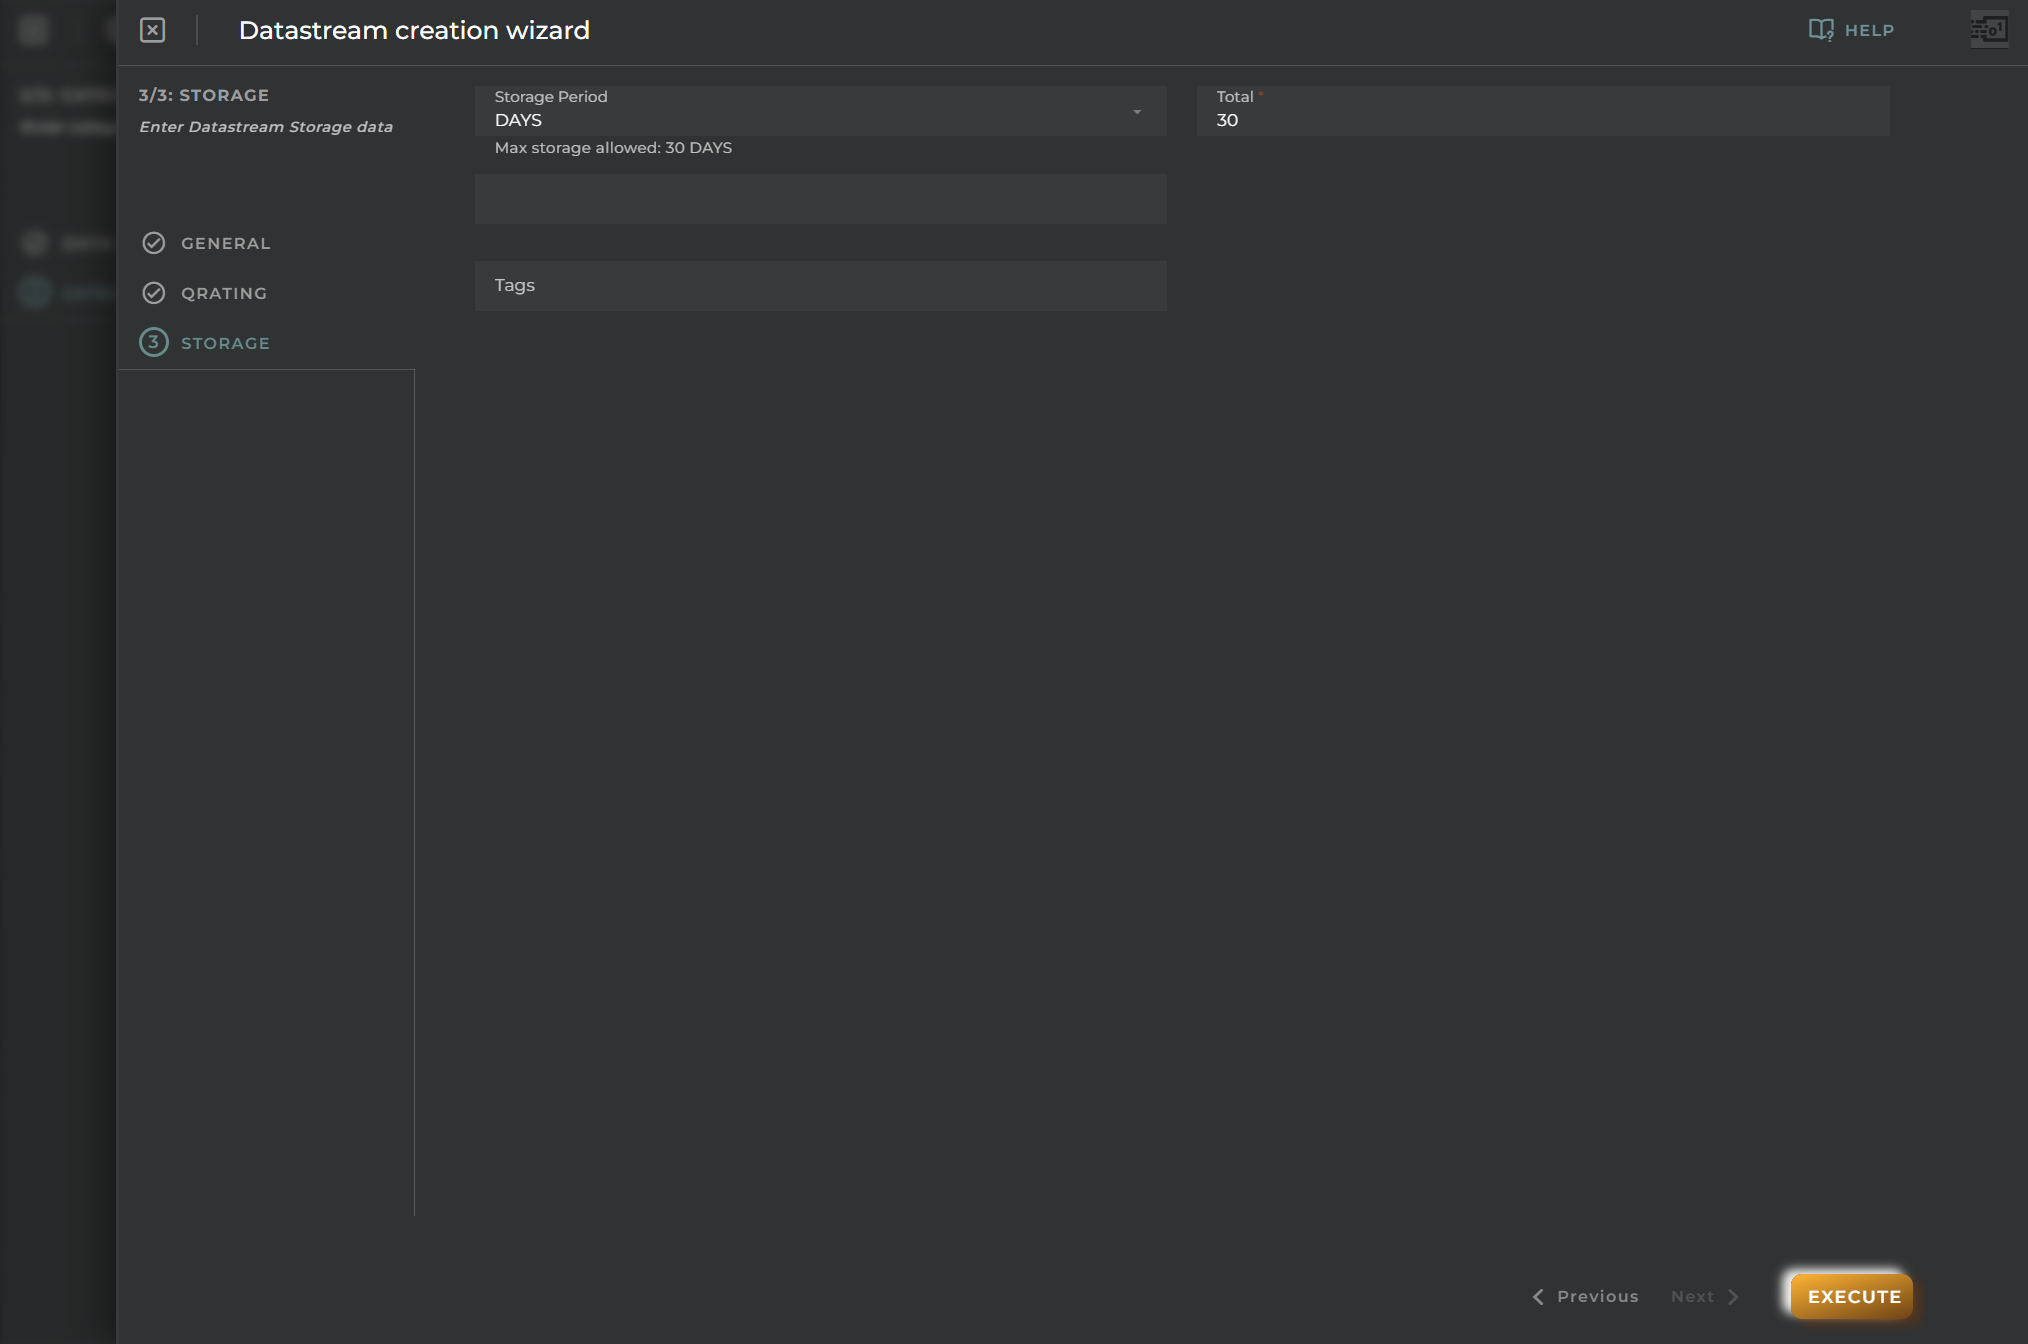
For this demo, just fill the first step and click on “EXECUTE”. Then our new datastream occupation is added to the parking category:
5. Finish your work:
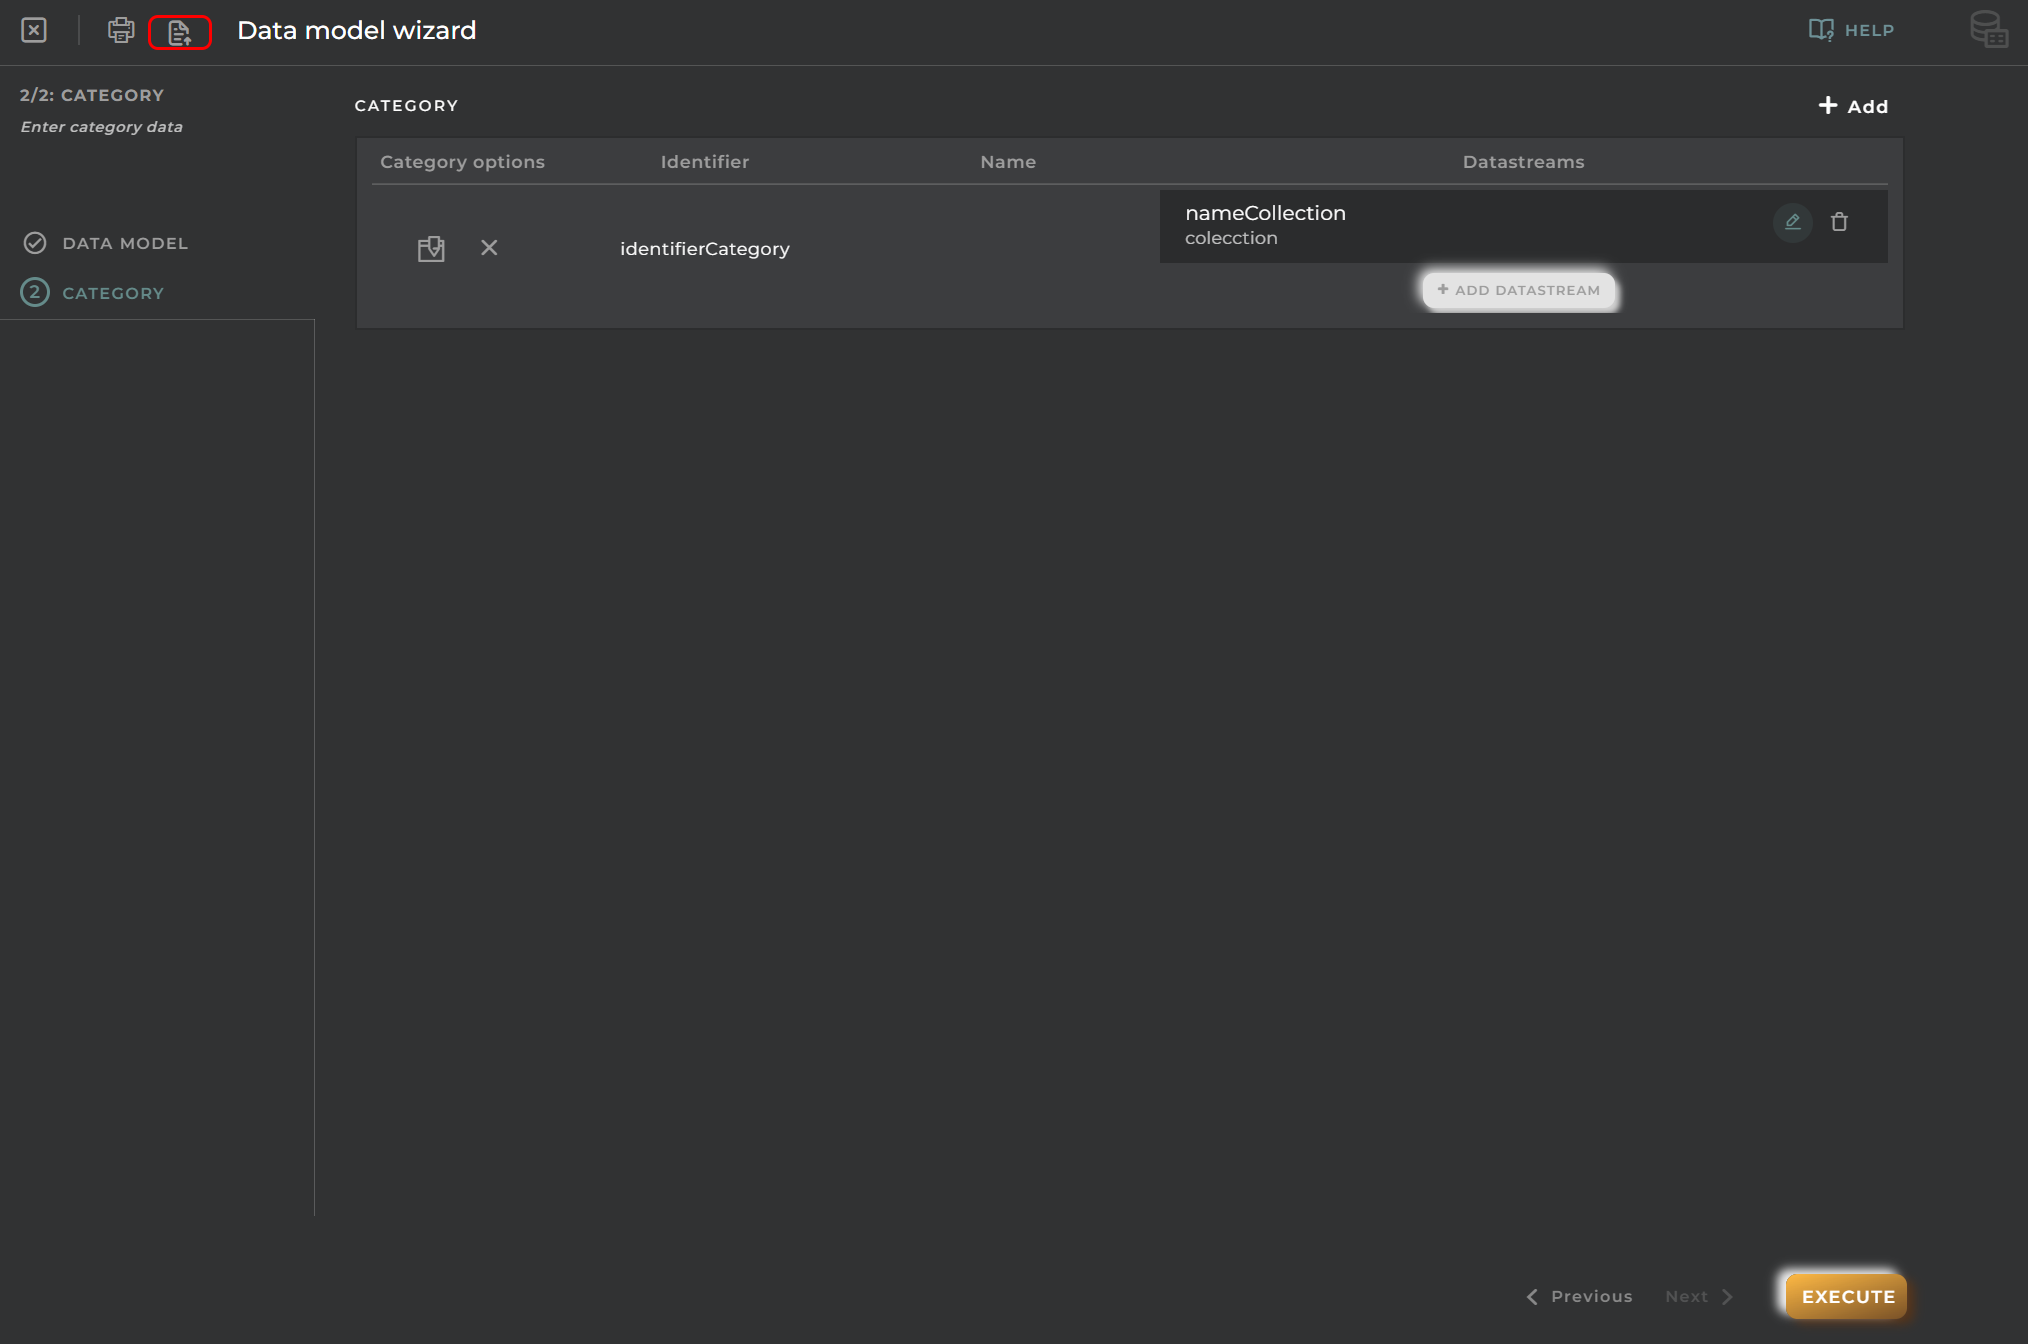
Continue at your own and add the other category and its datastreams. At the end, you should have the following:
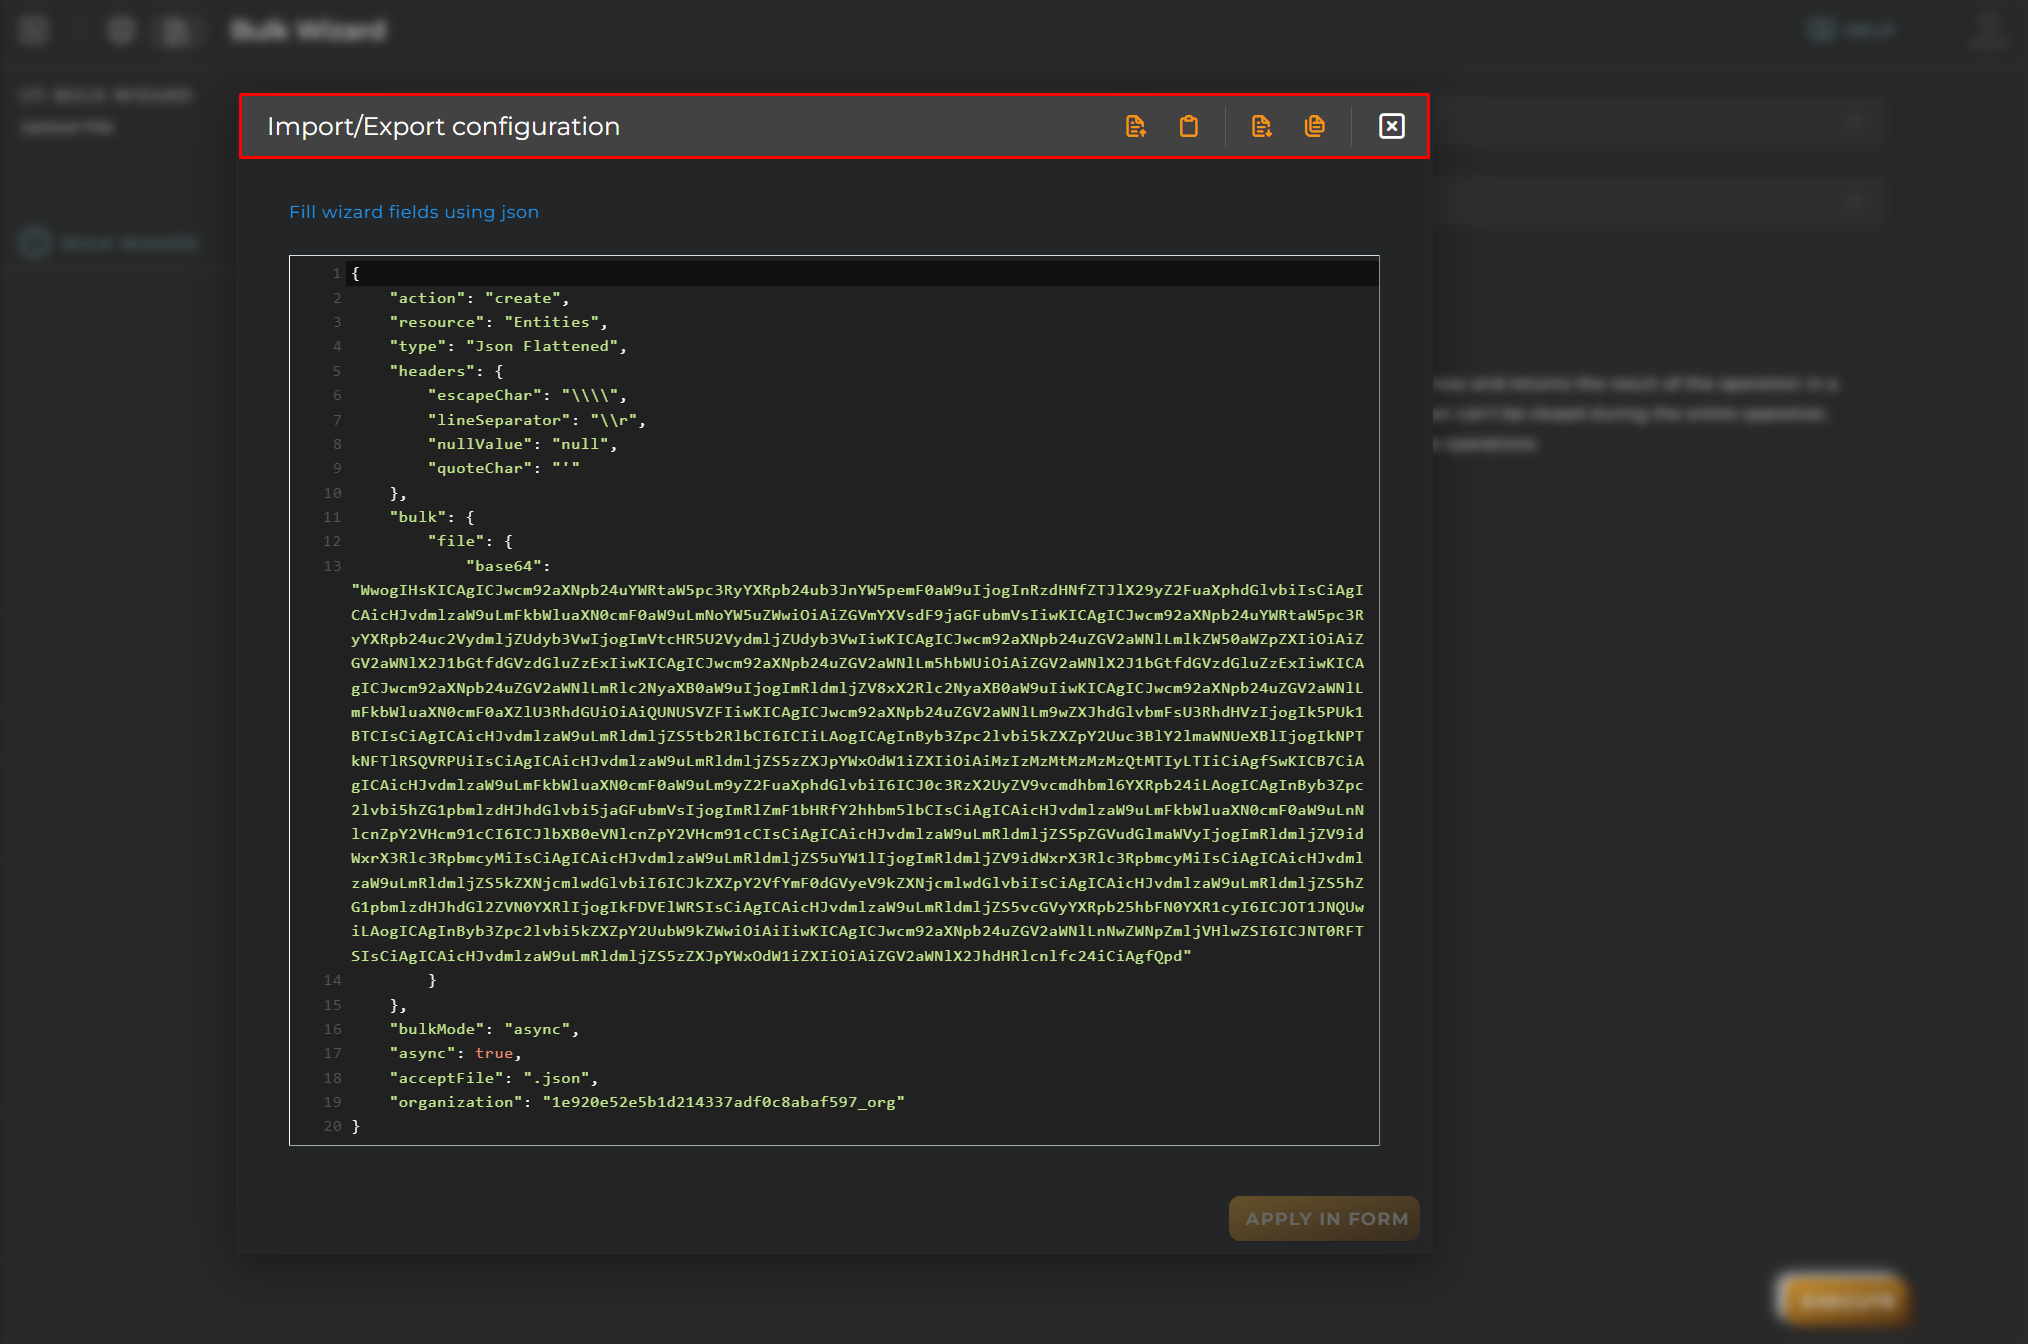
If all the information is correct, click on “EXECUTE” to create the datamodel, you will receive the following message:
🎉 Congratulations you create your first datamodel successfully.
🗒️ Advanced tips
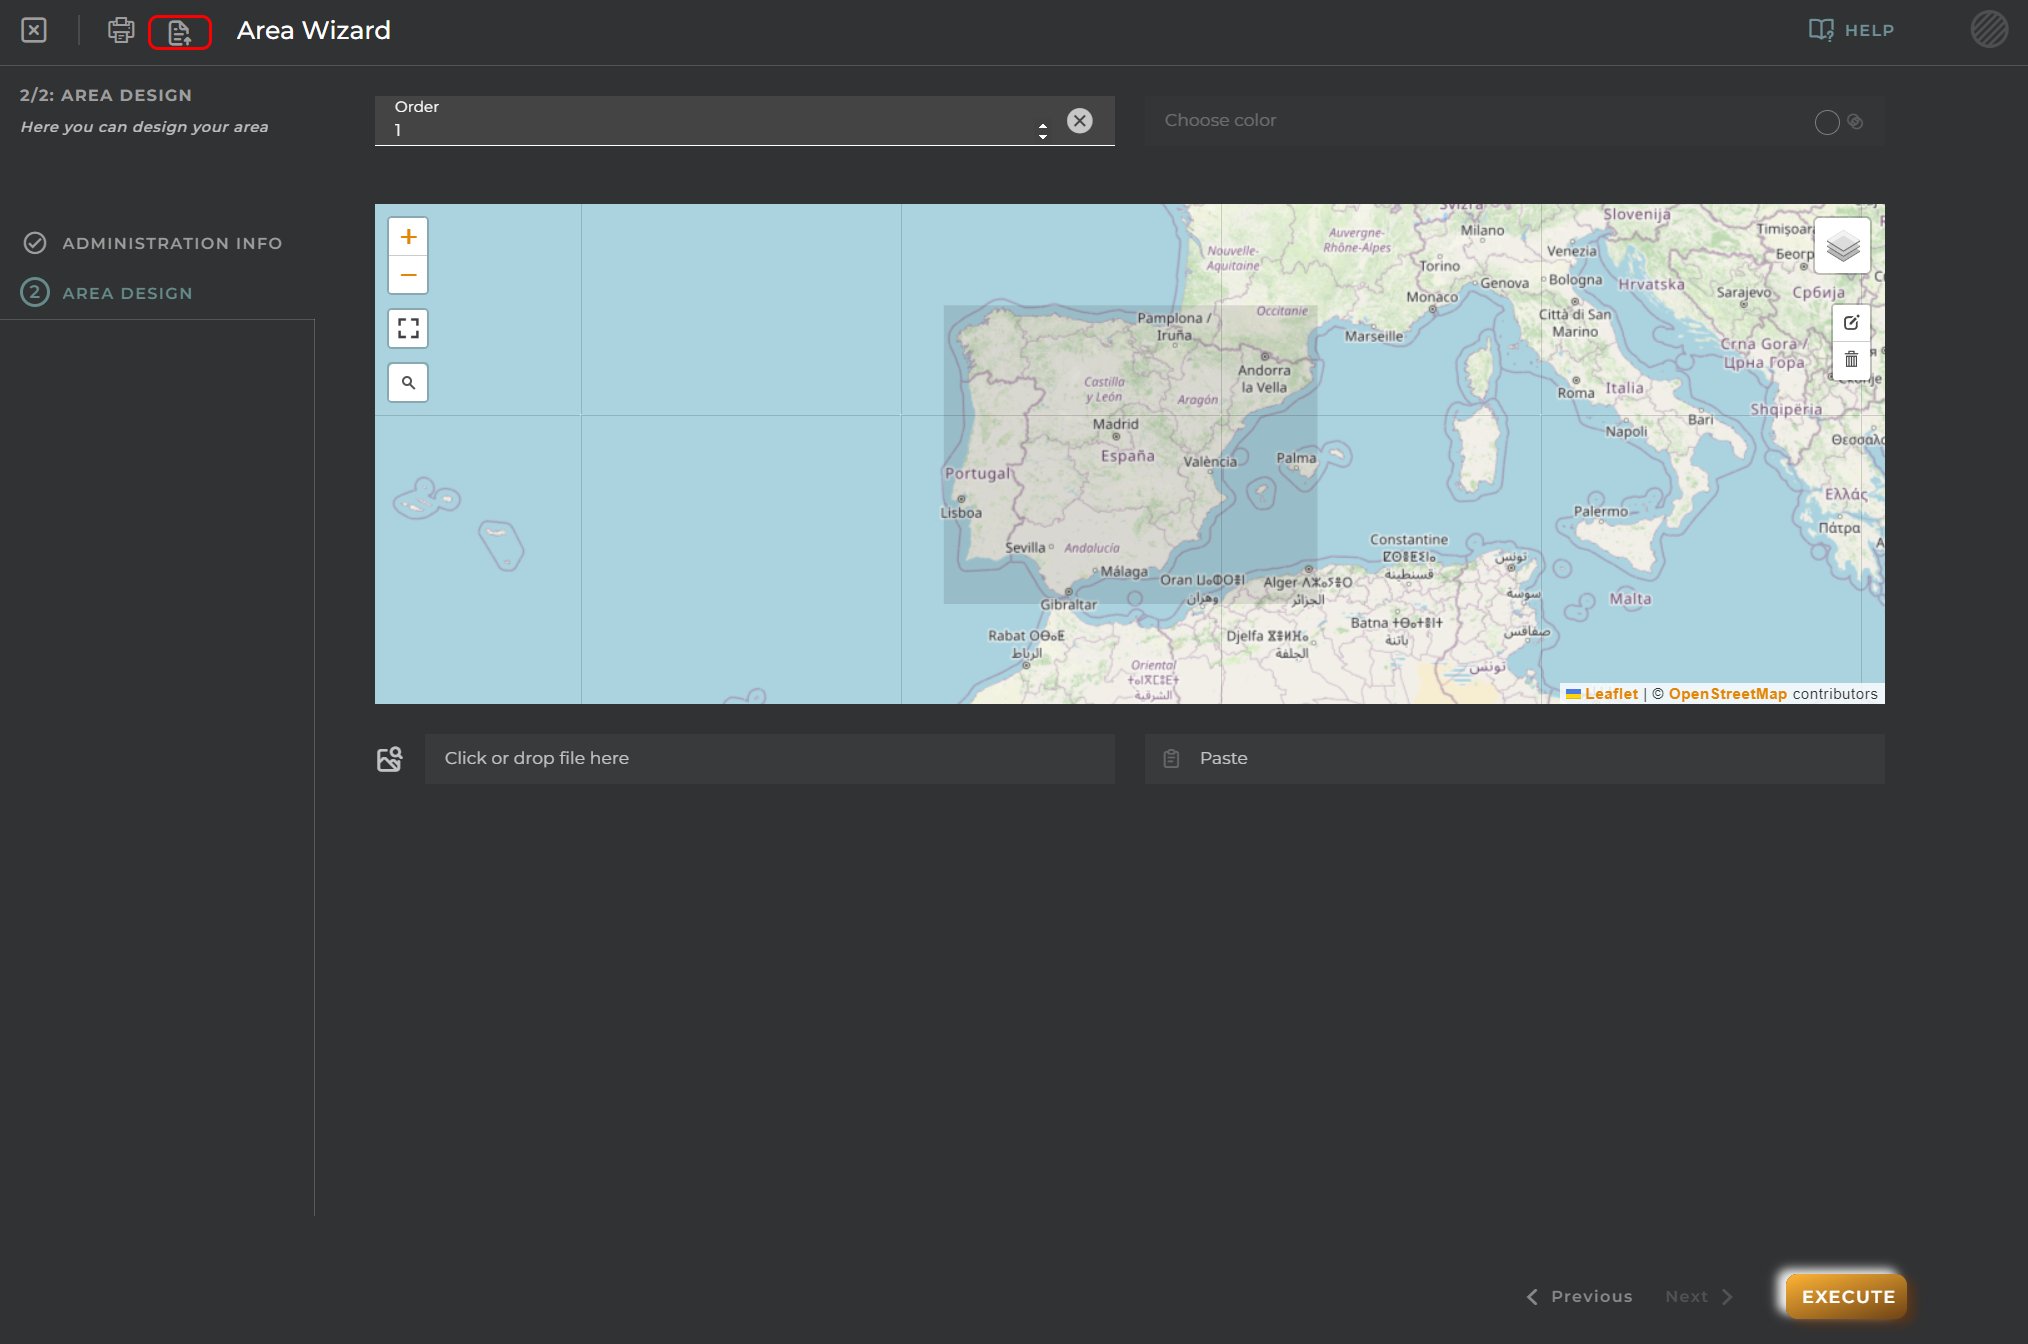
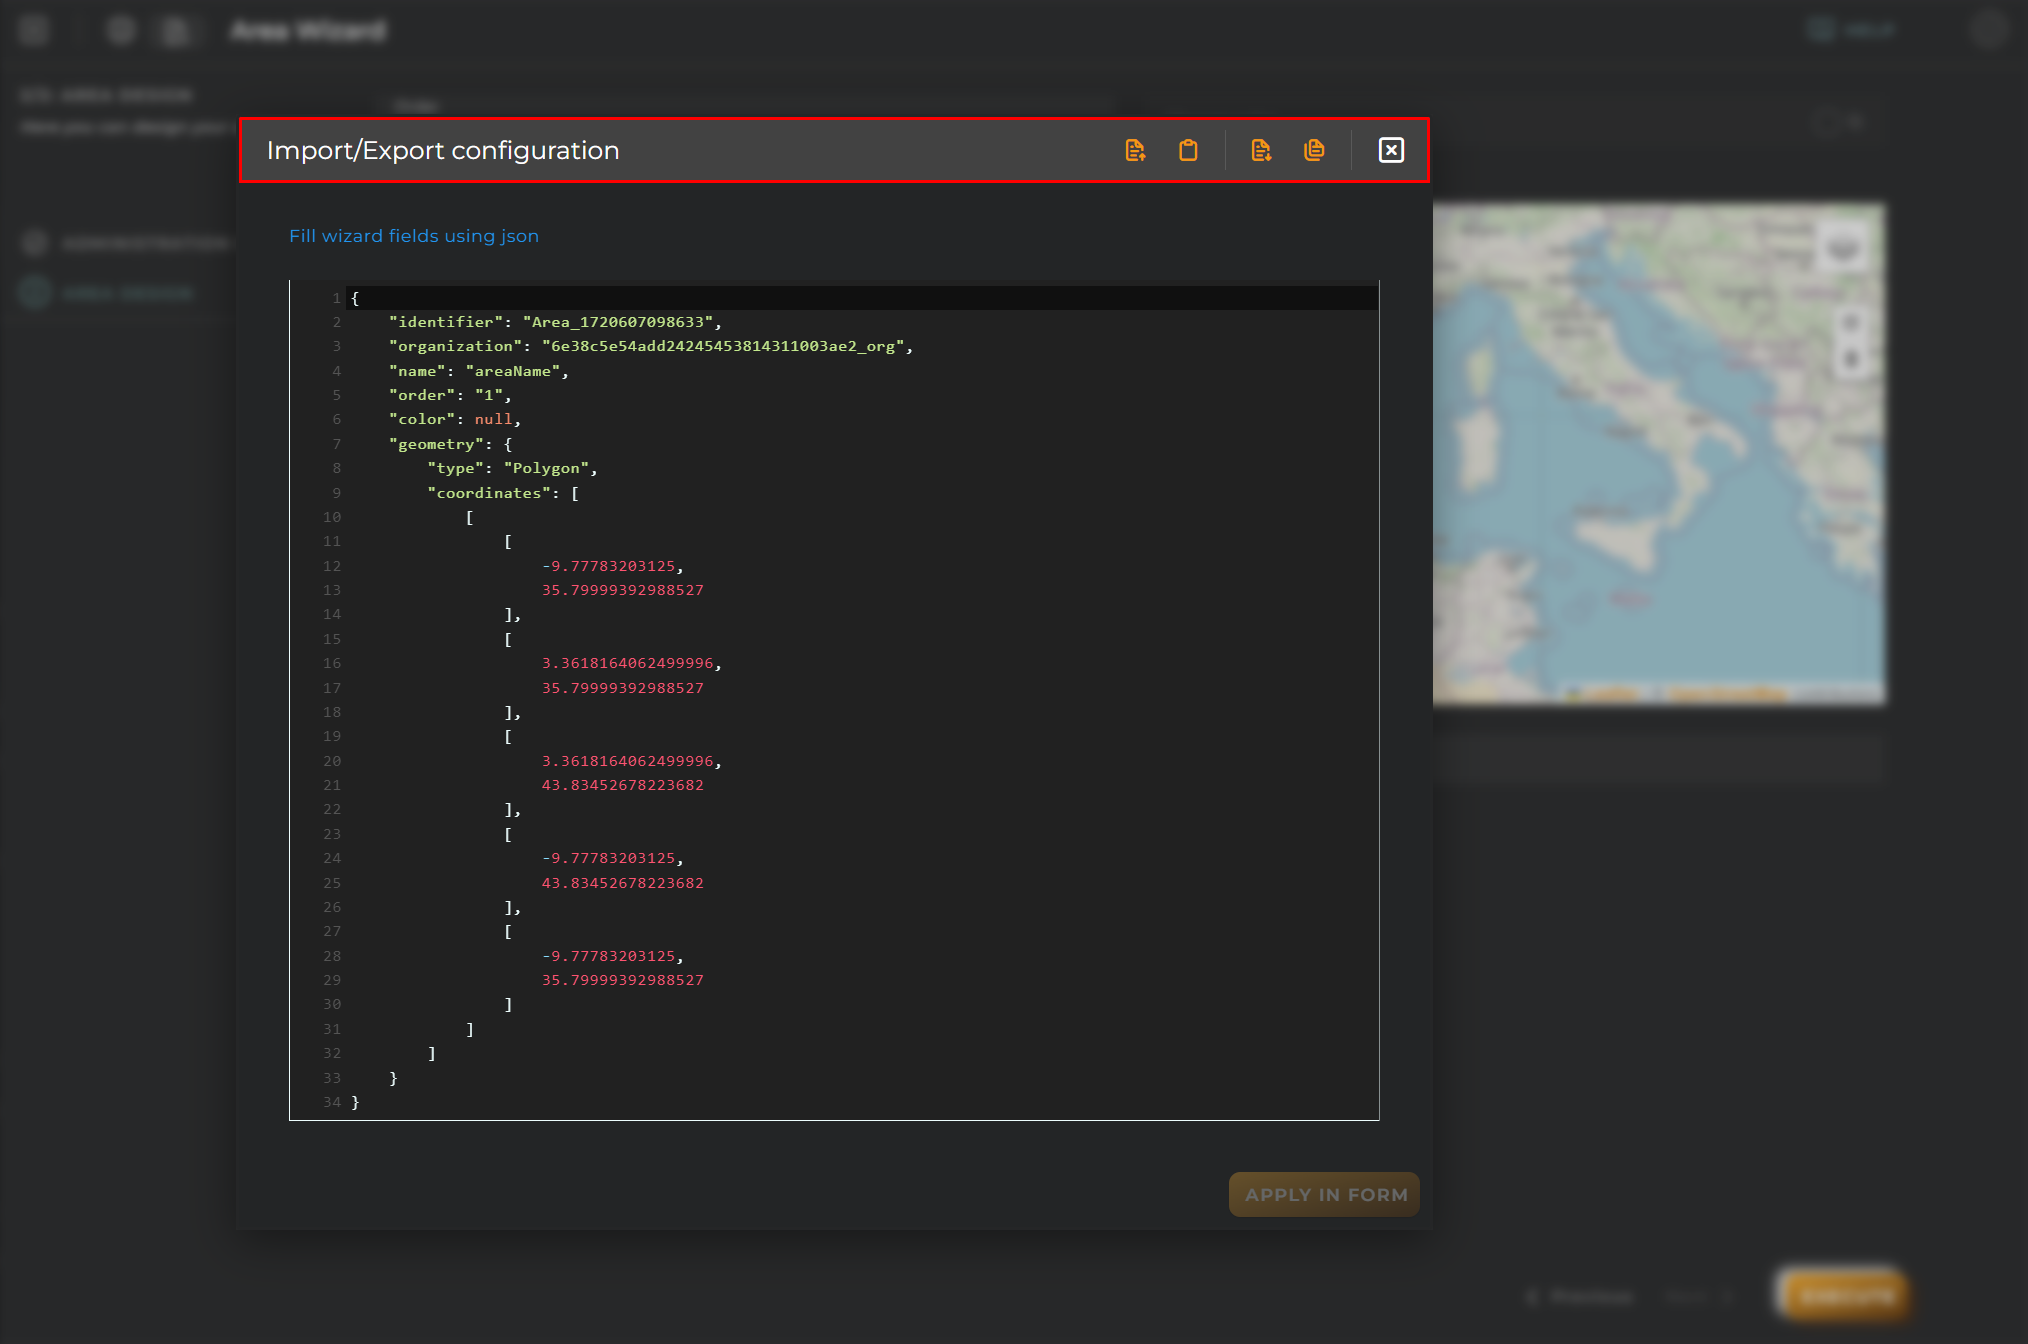
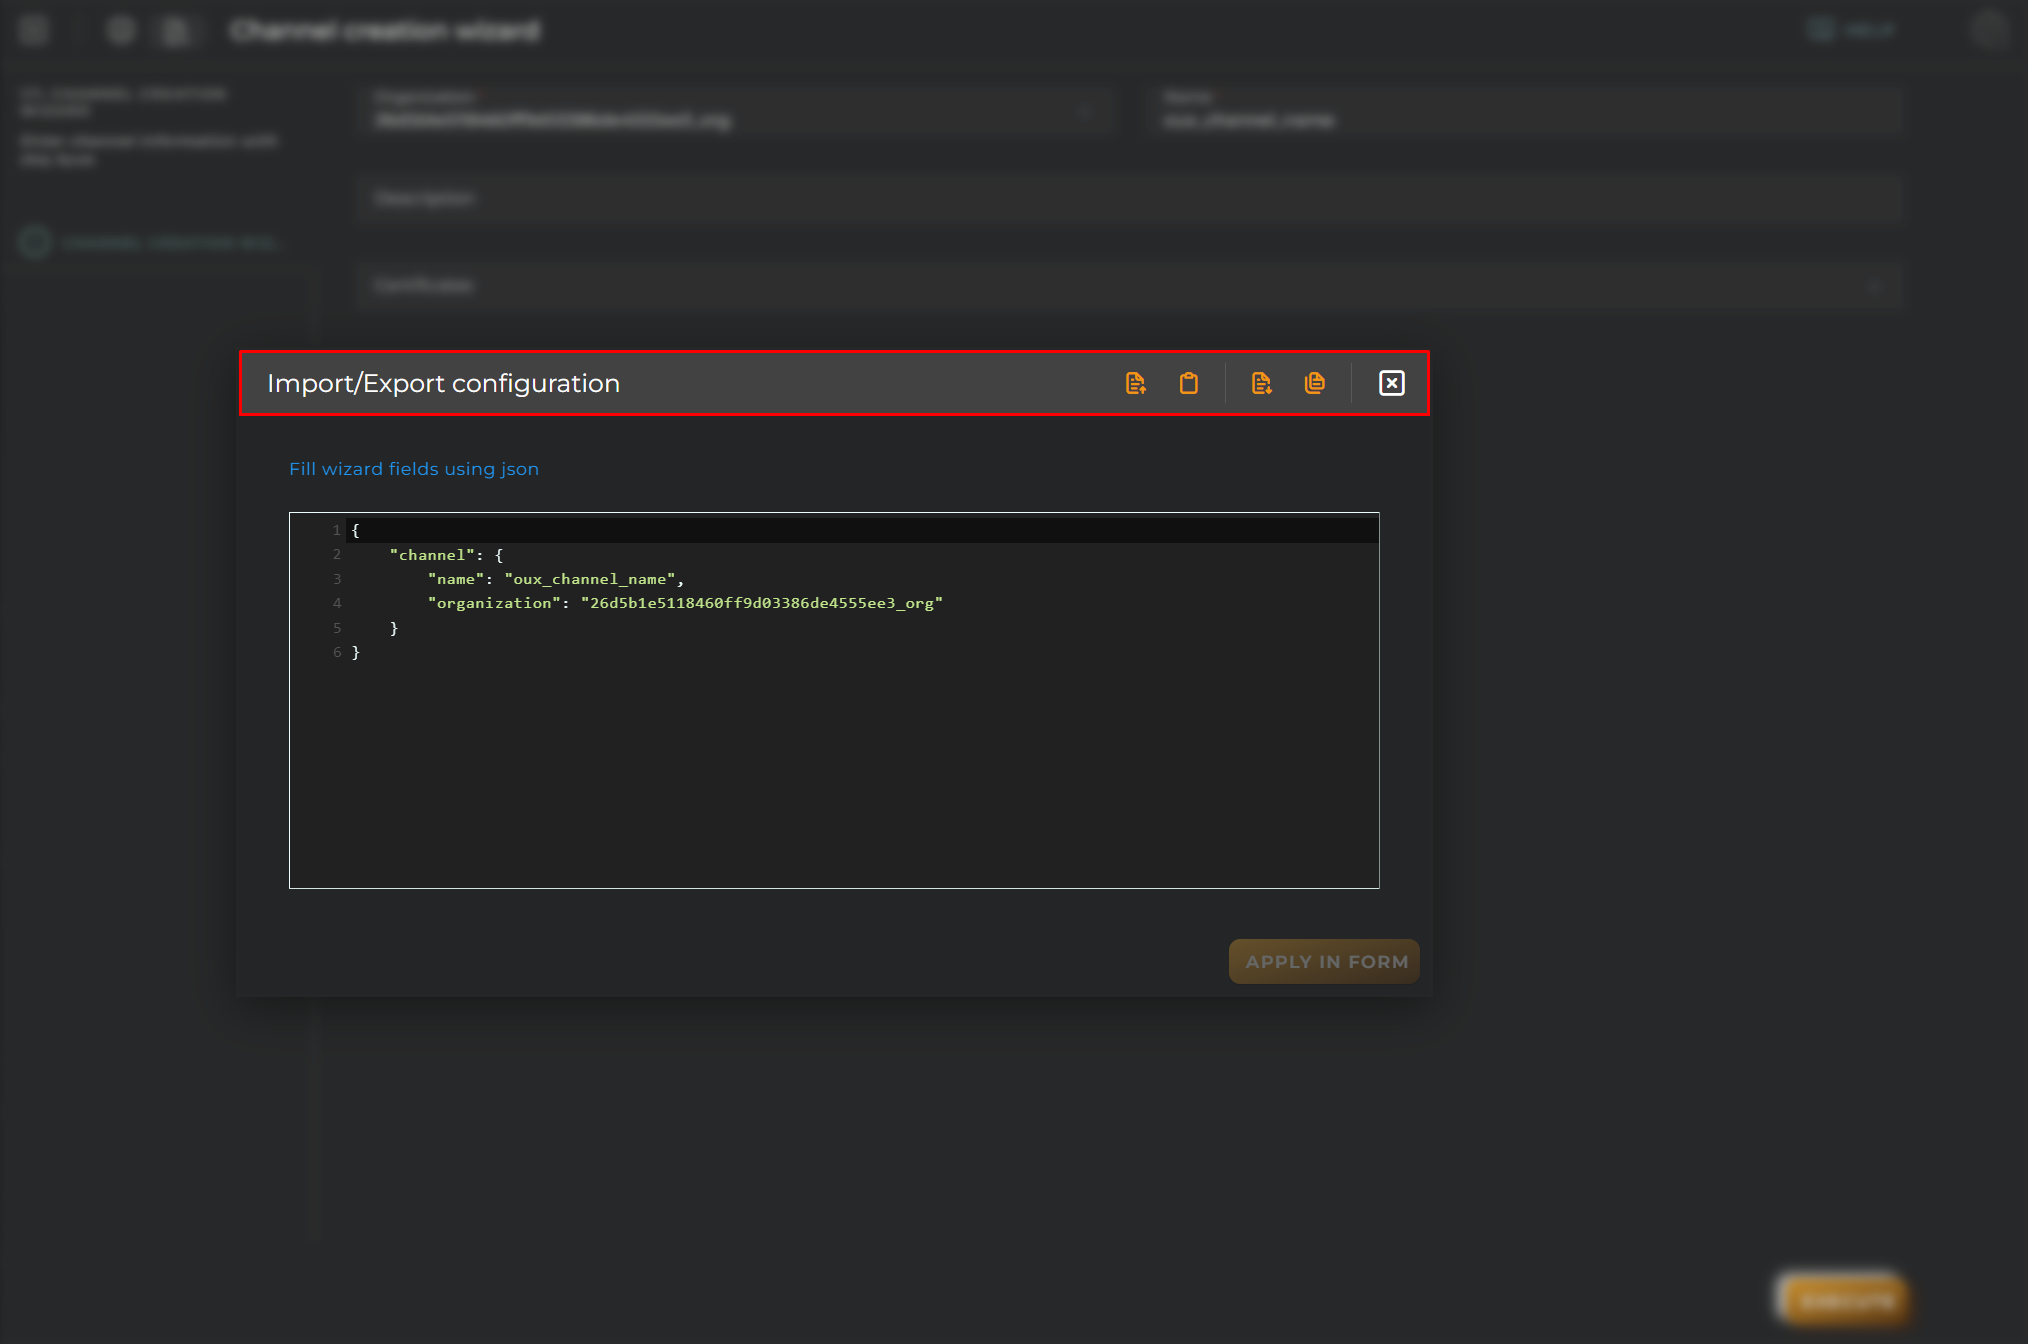
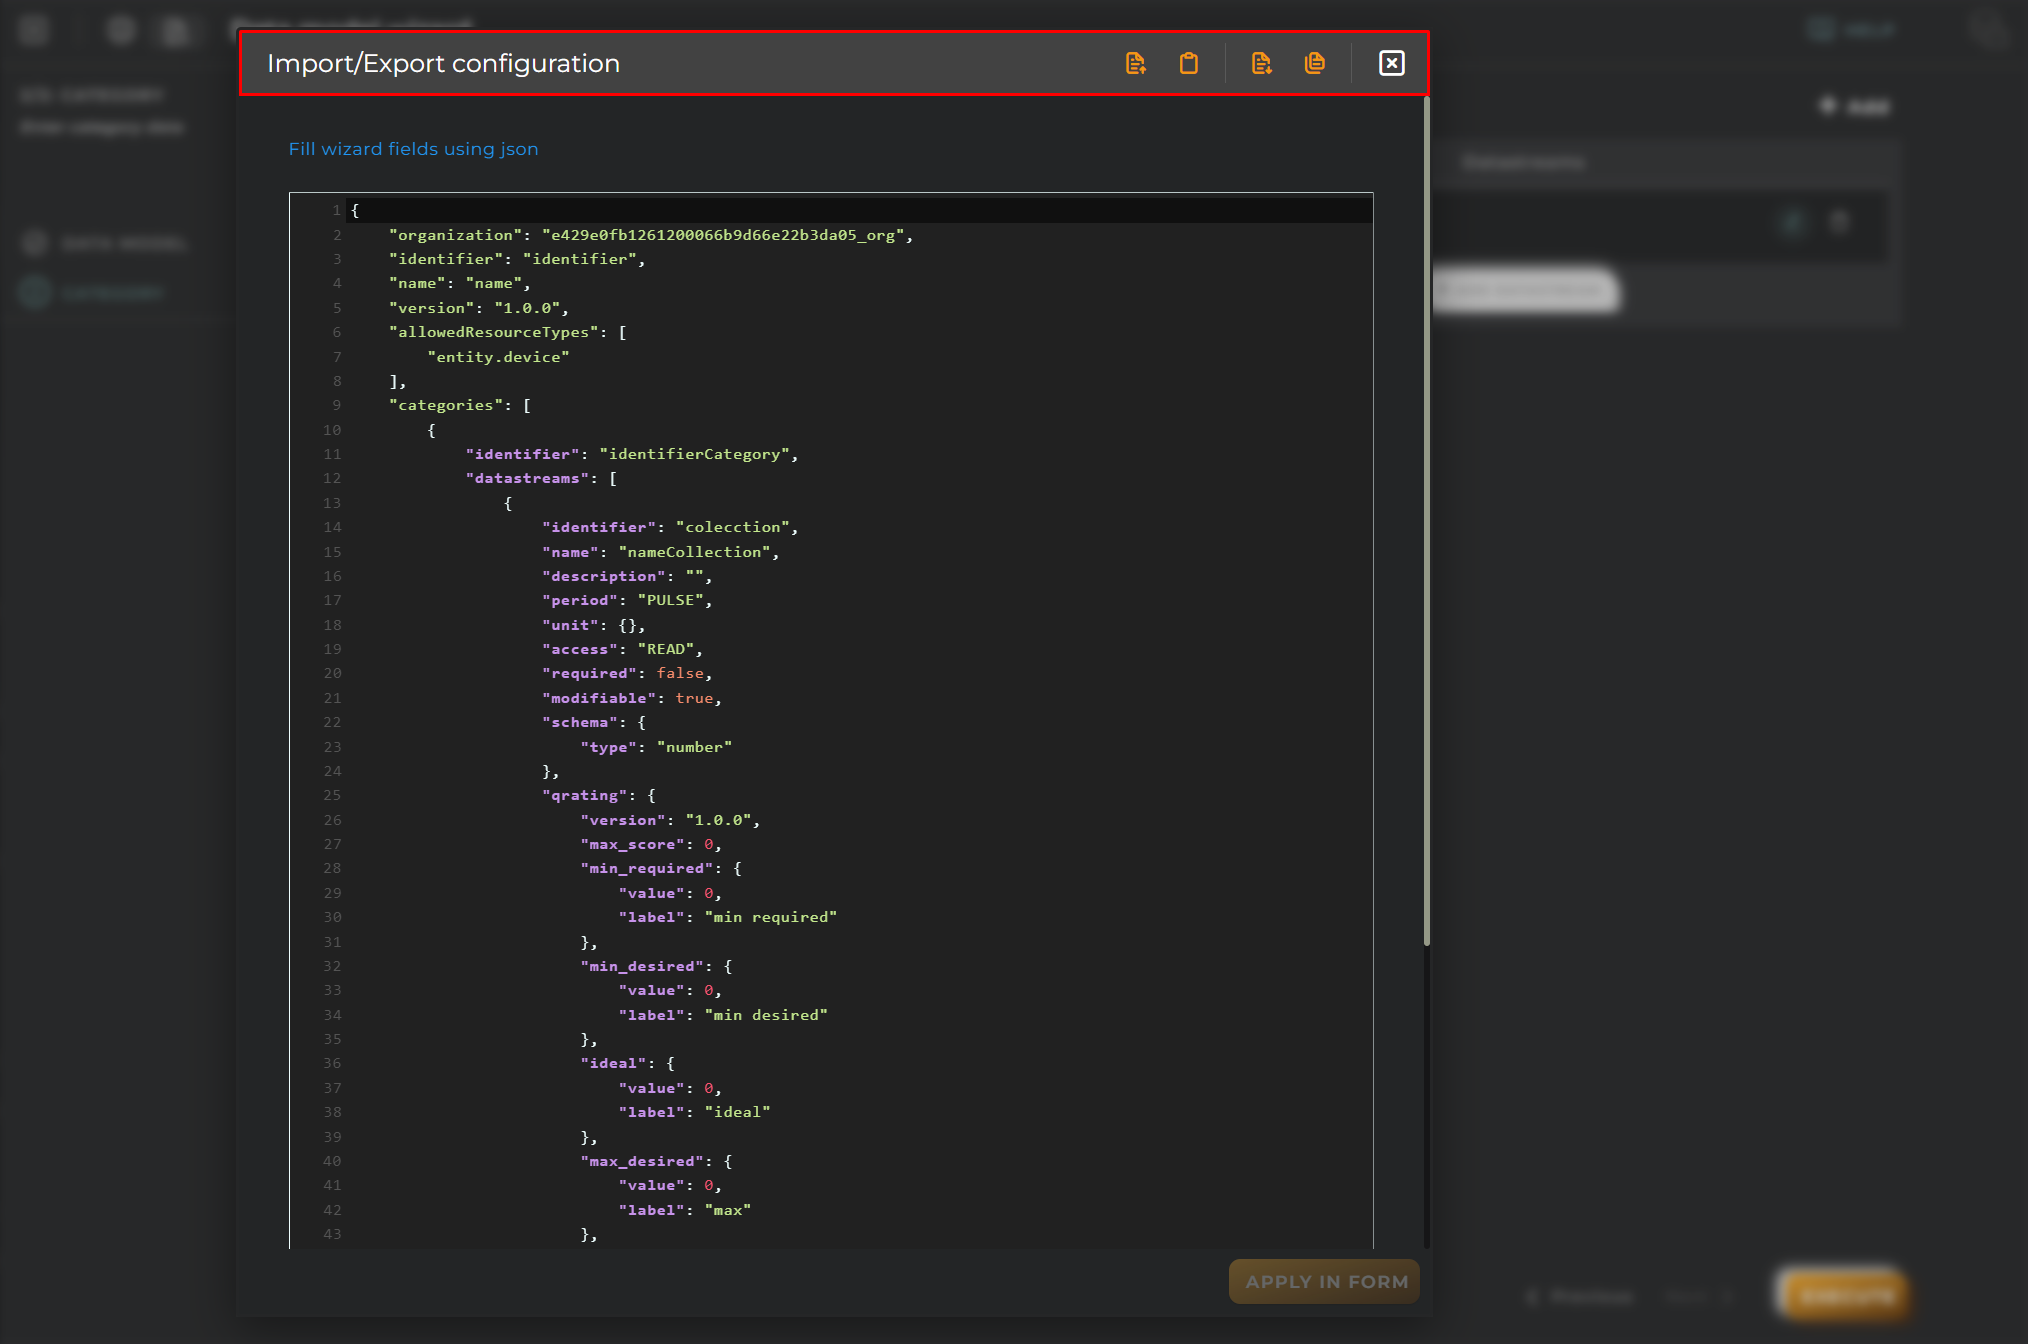
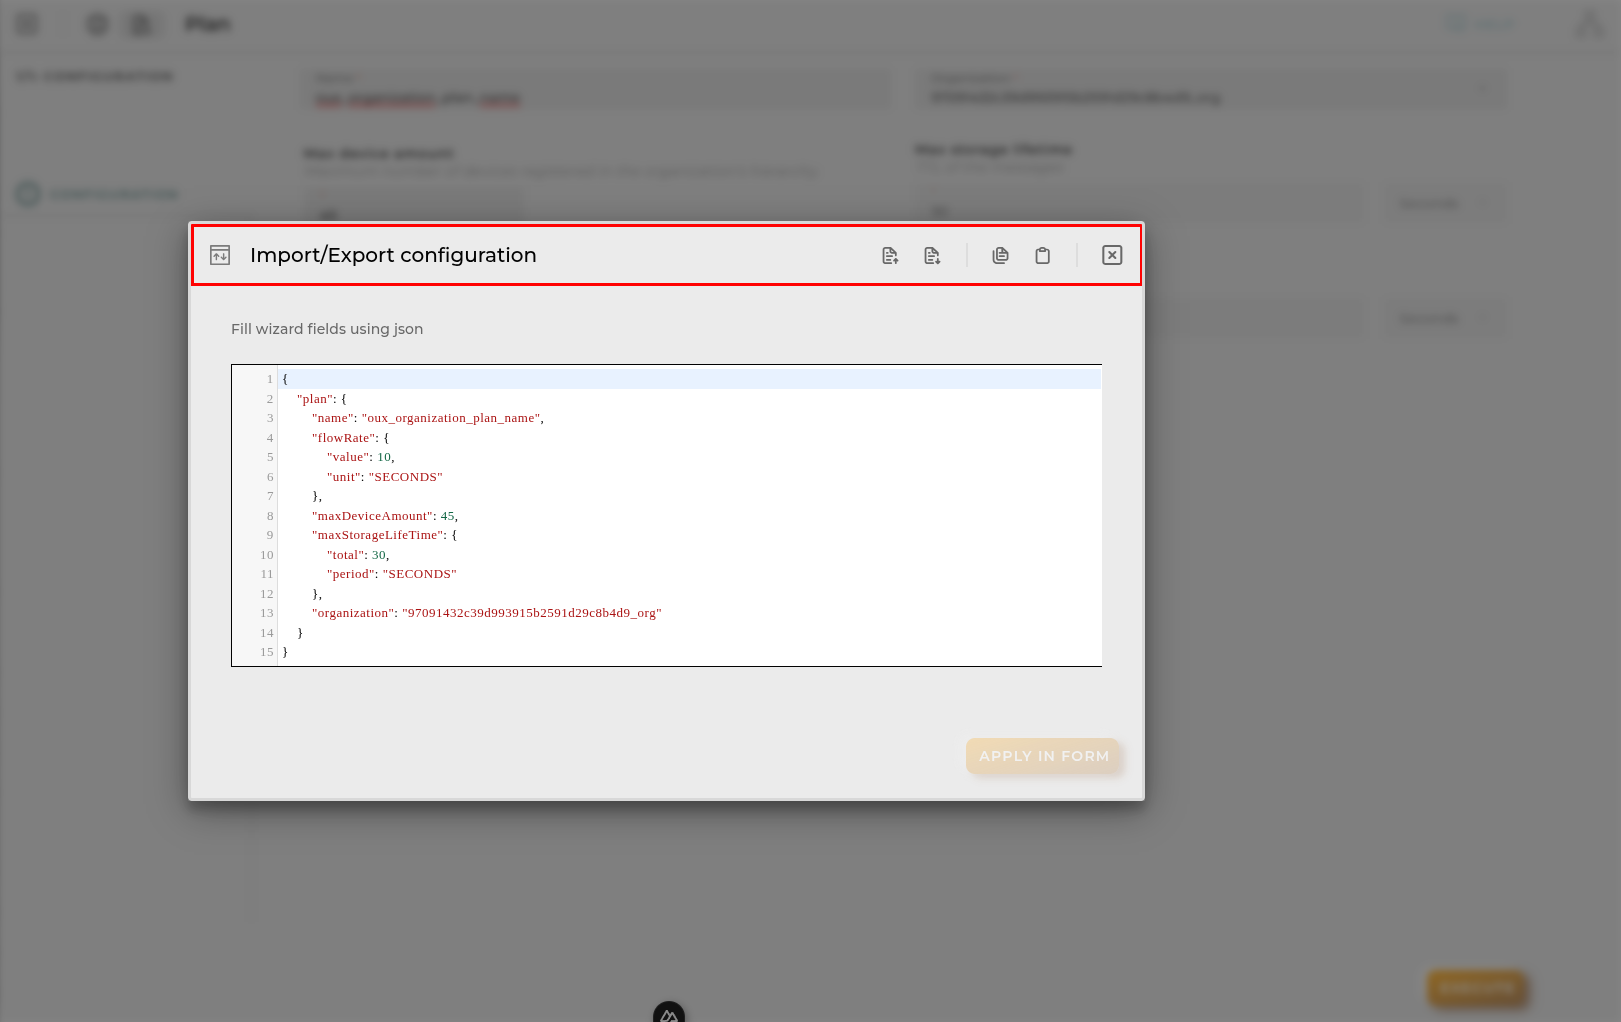
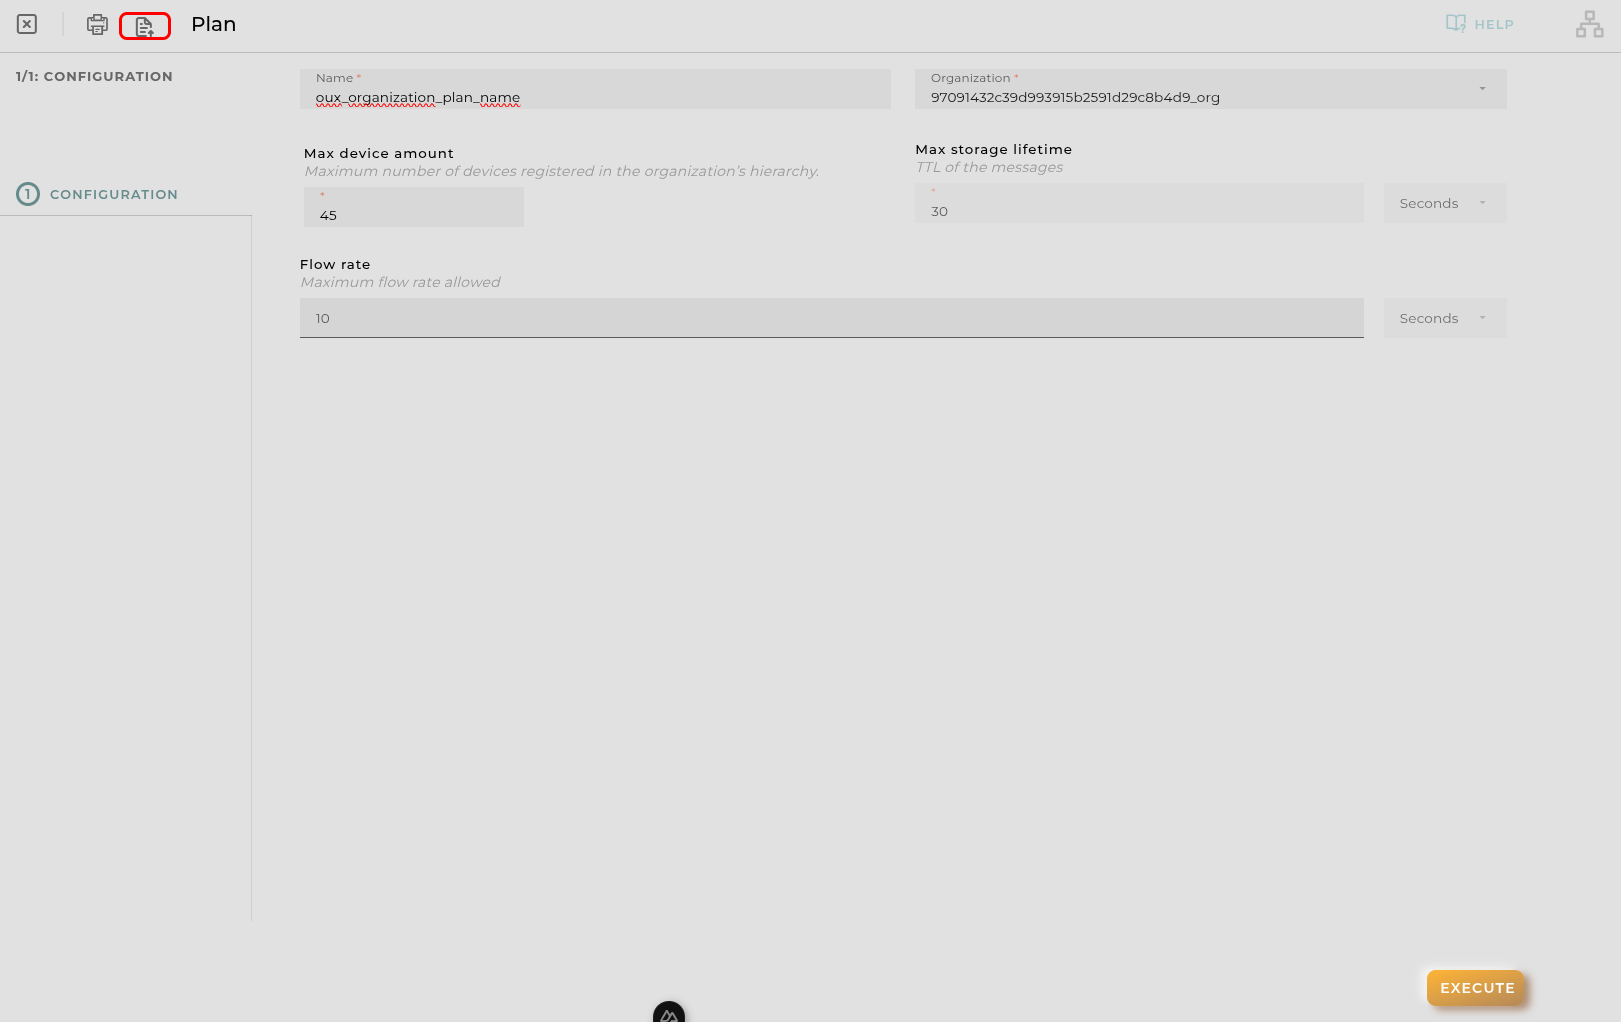
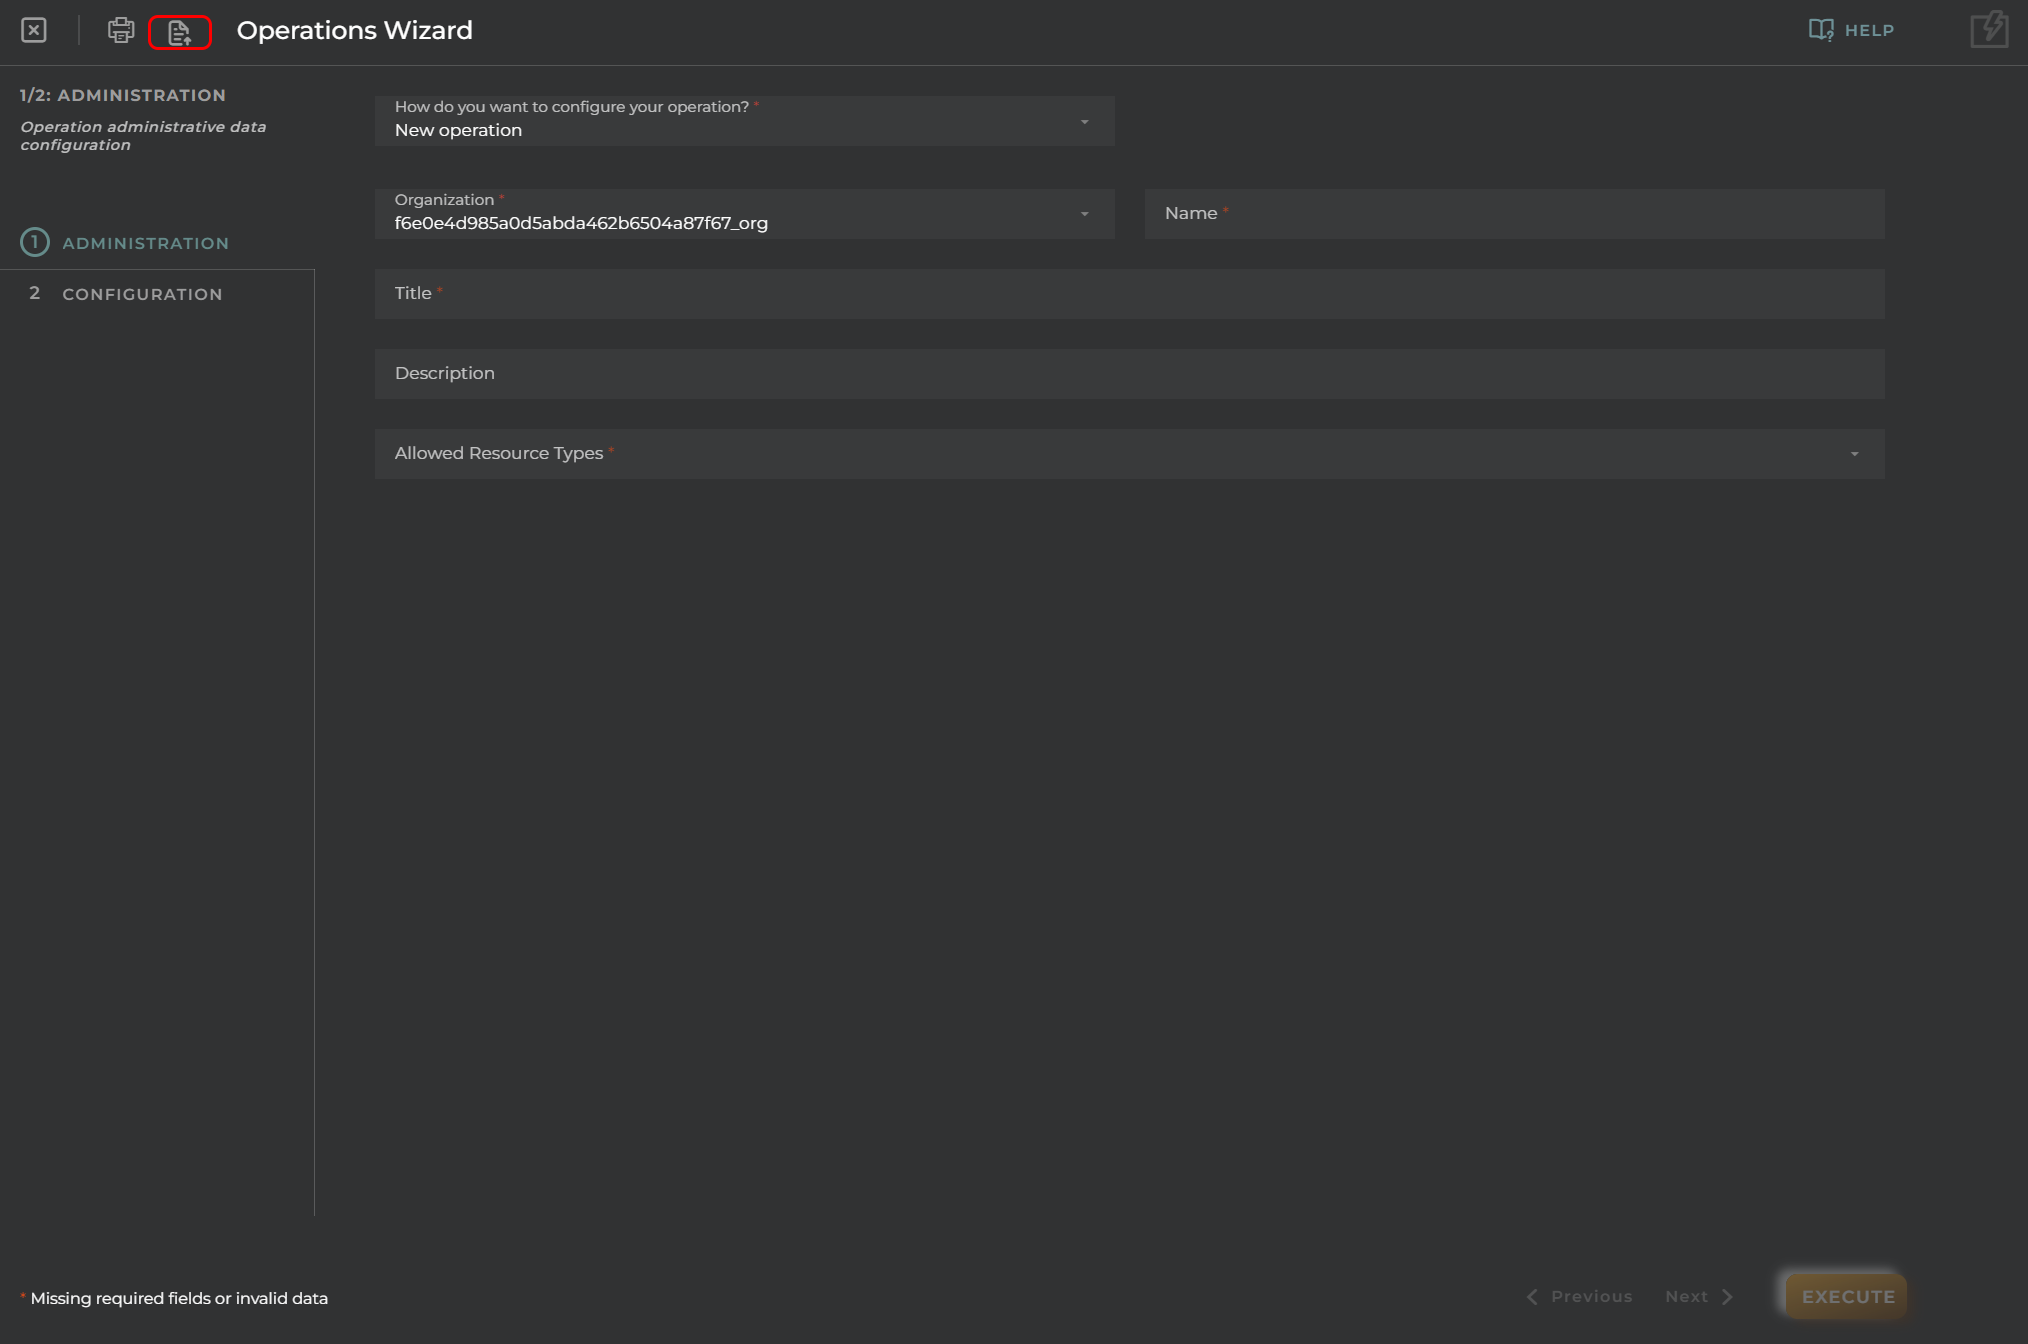
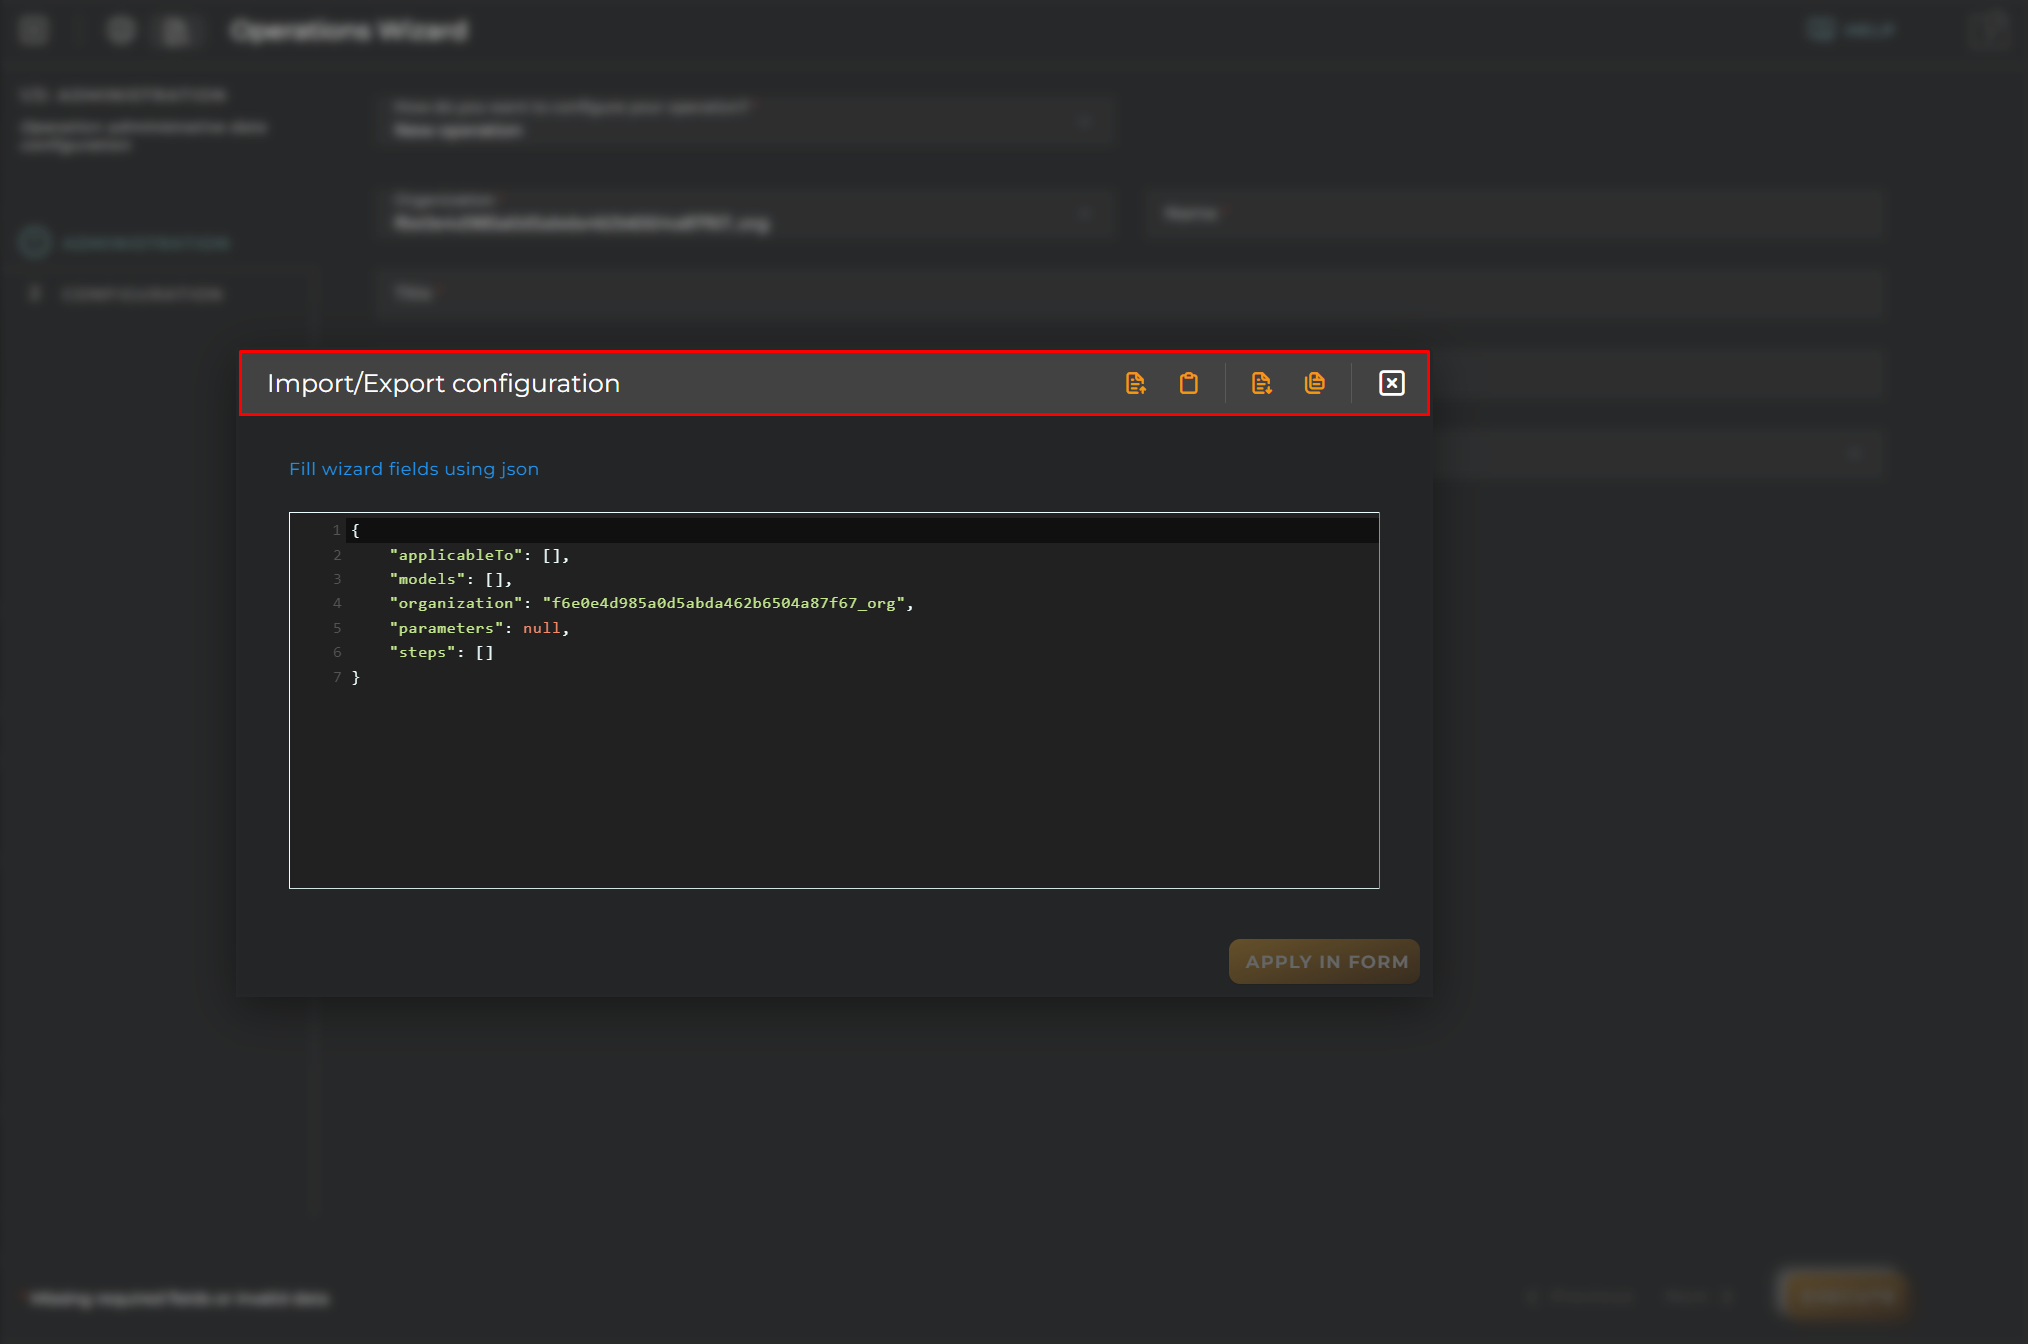
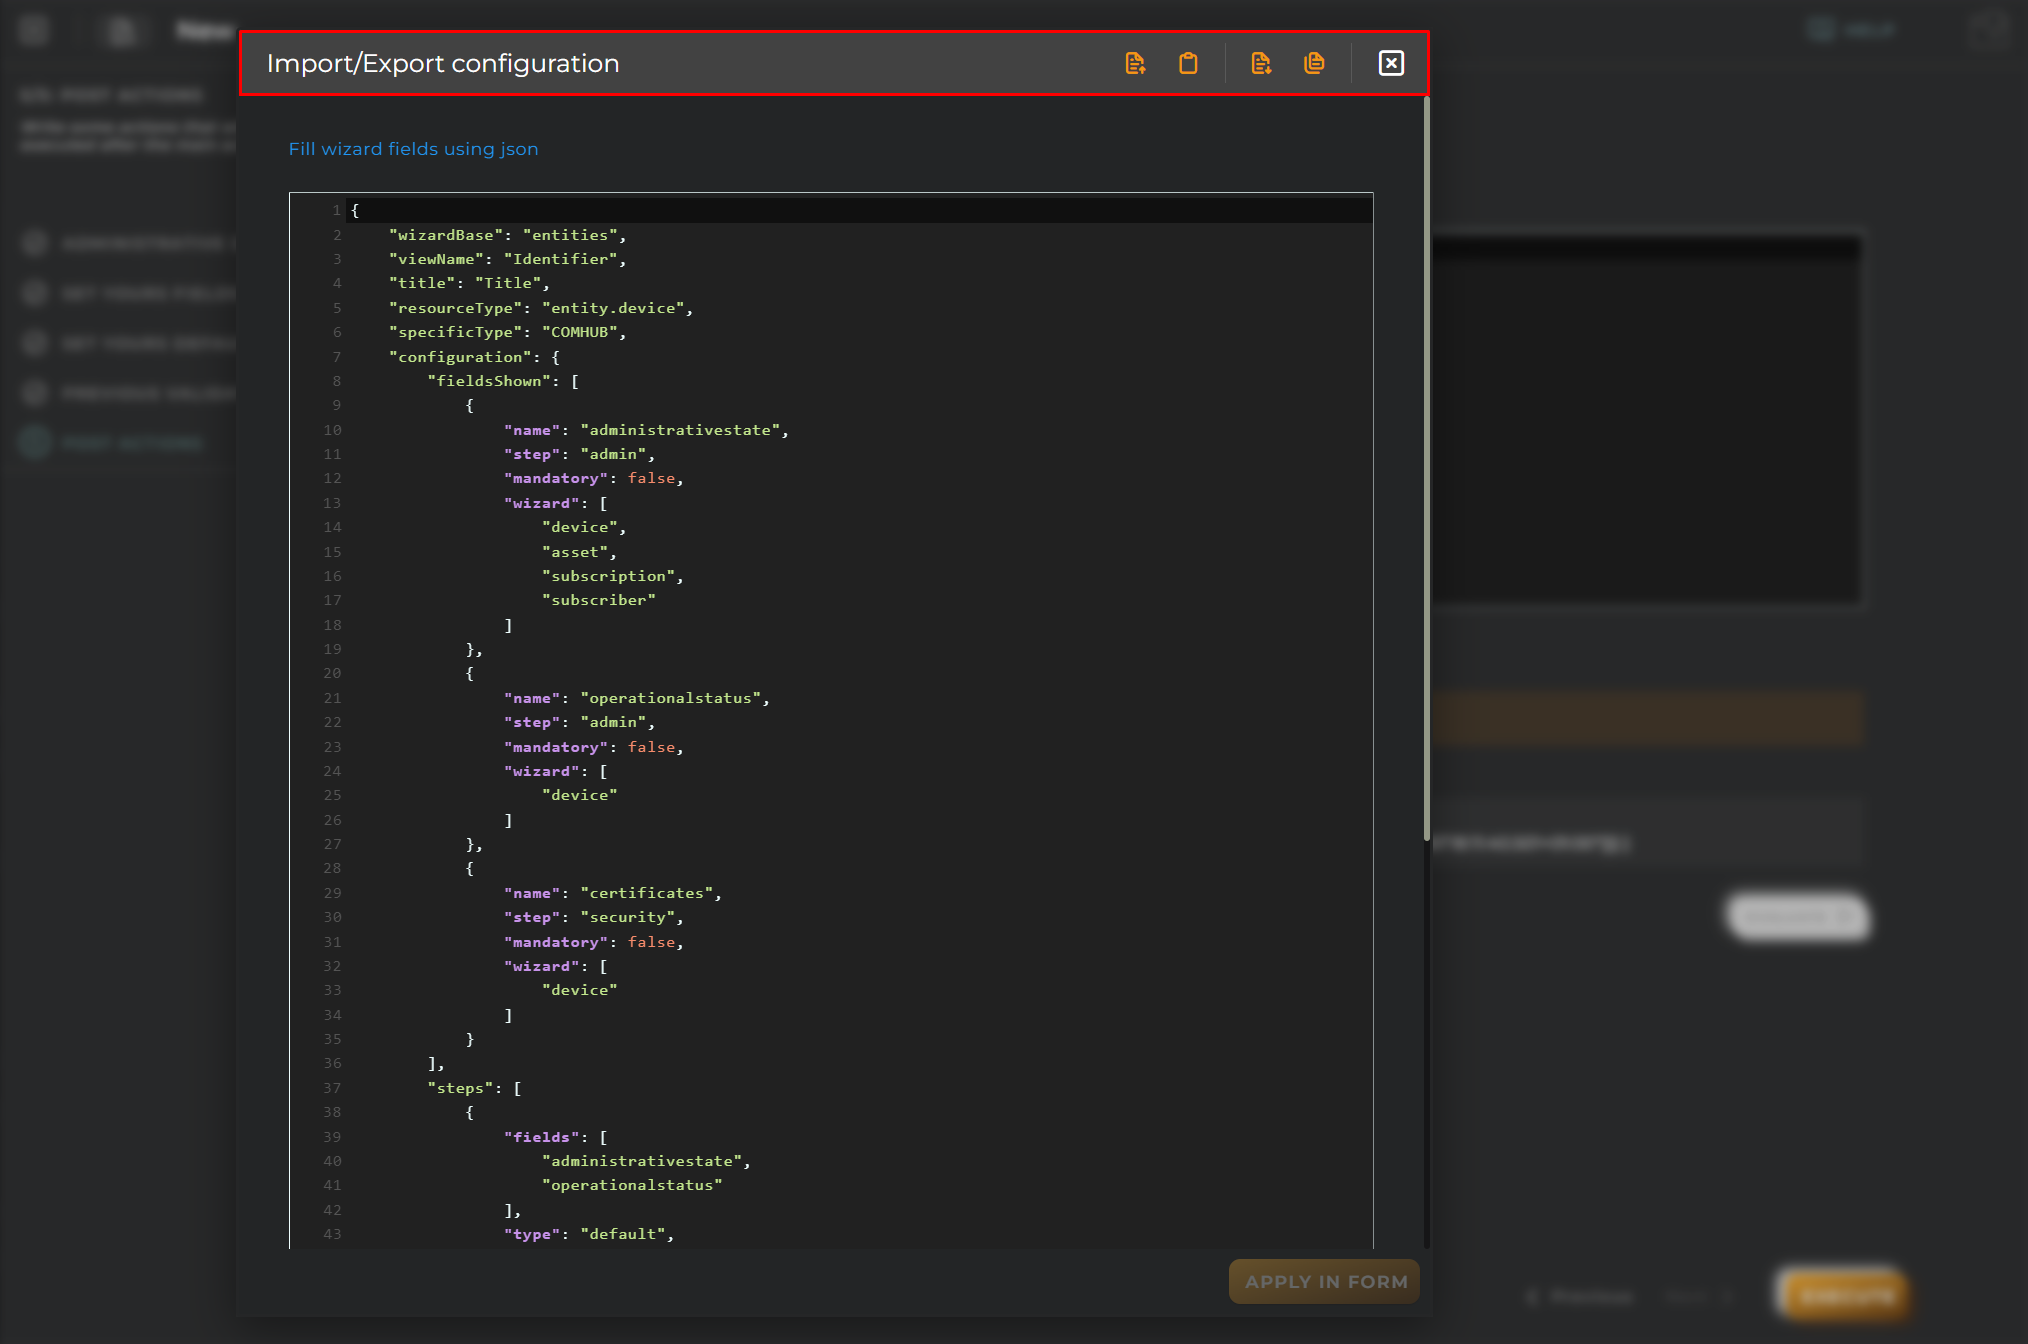
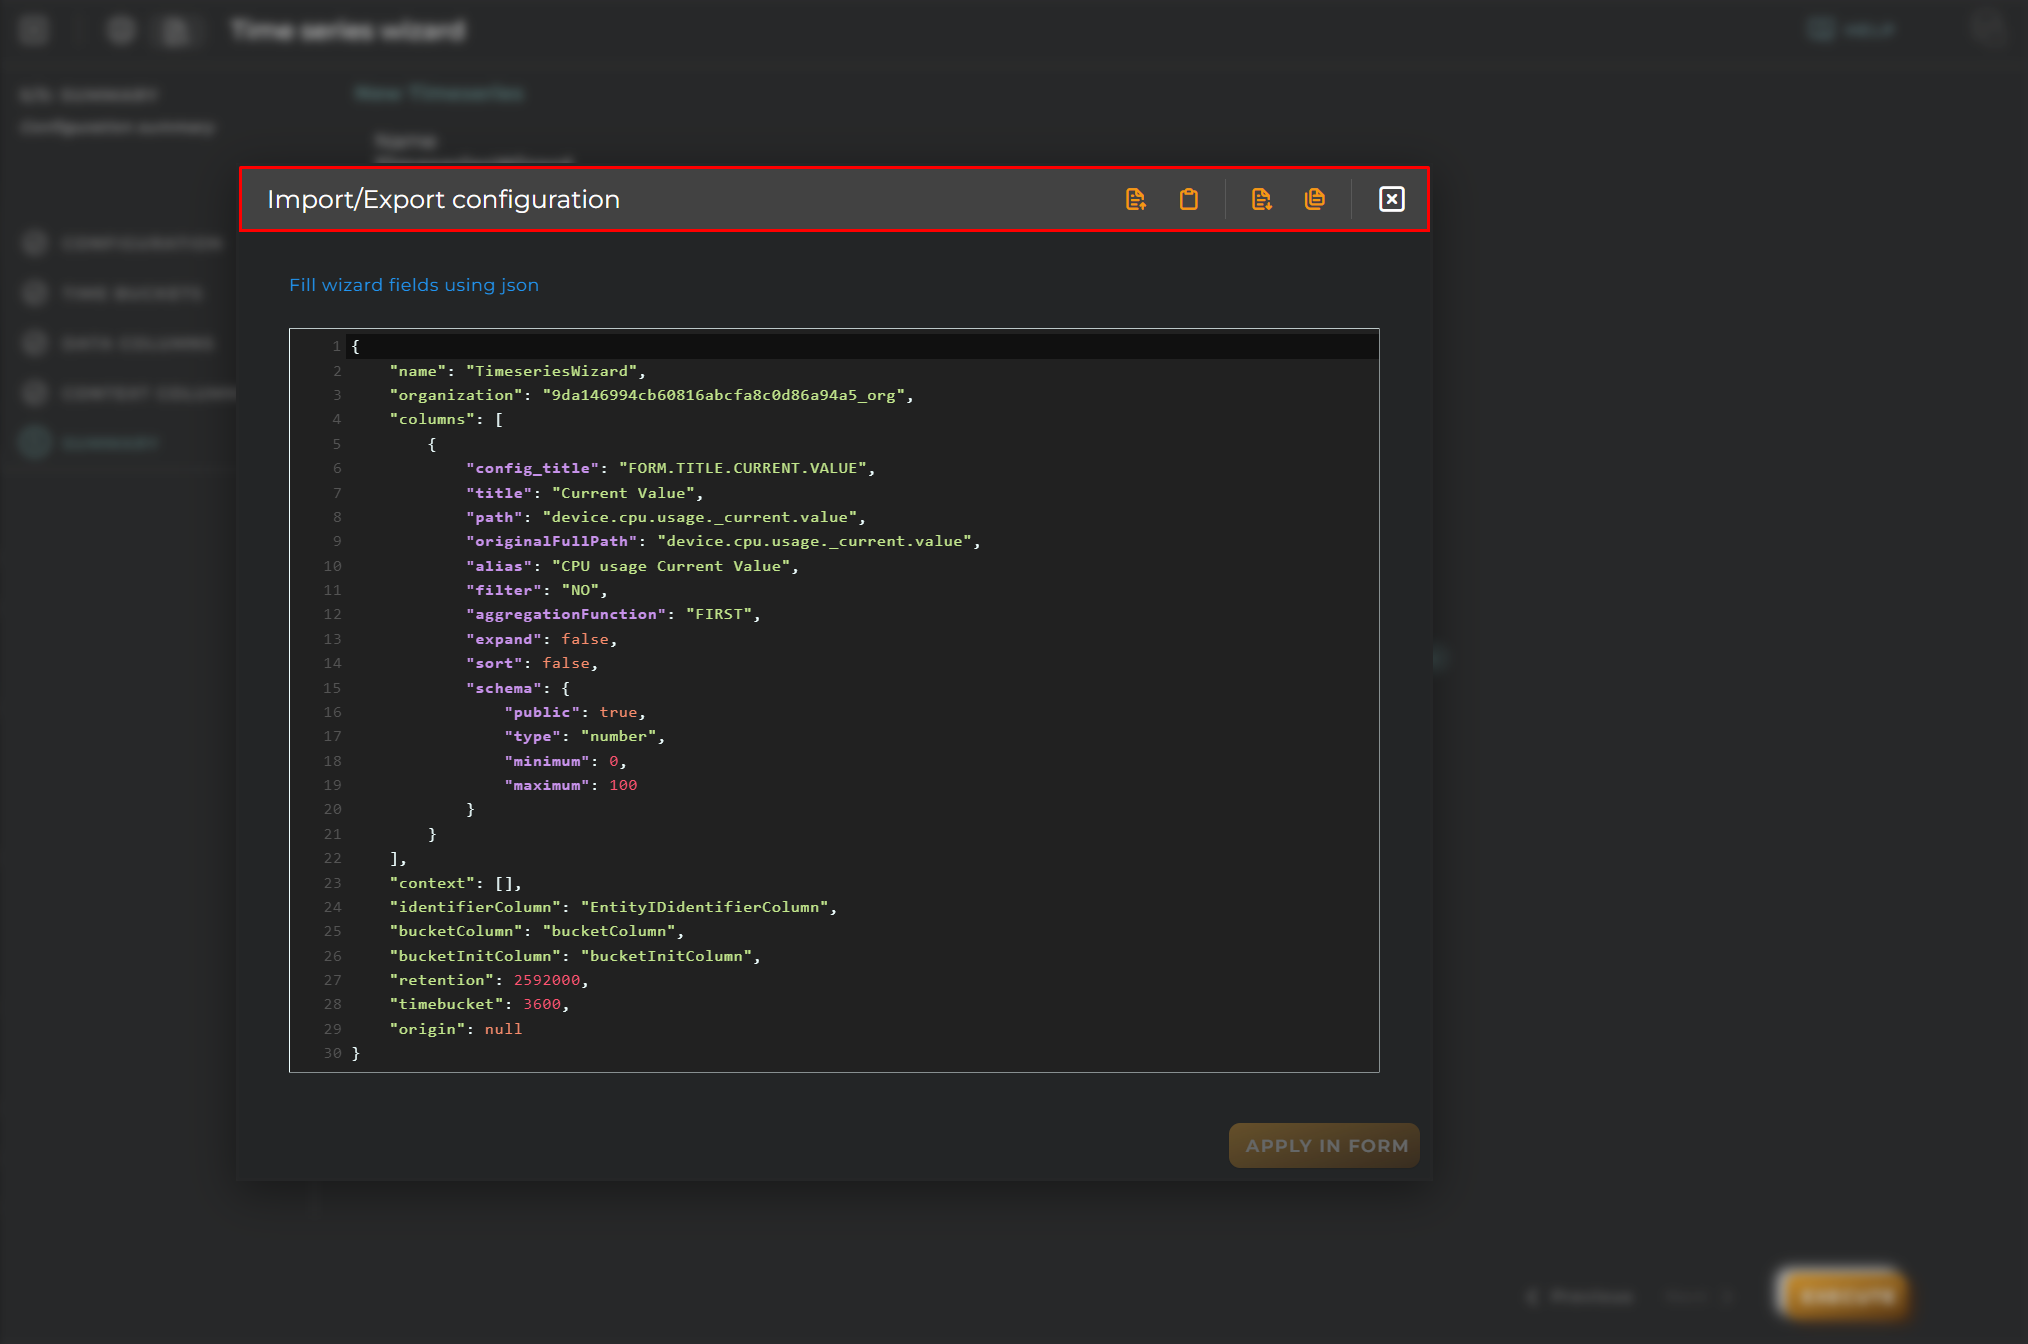
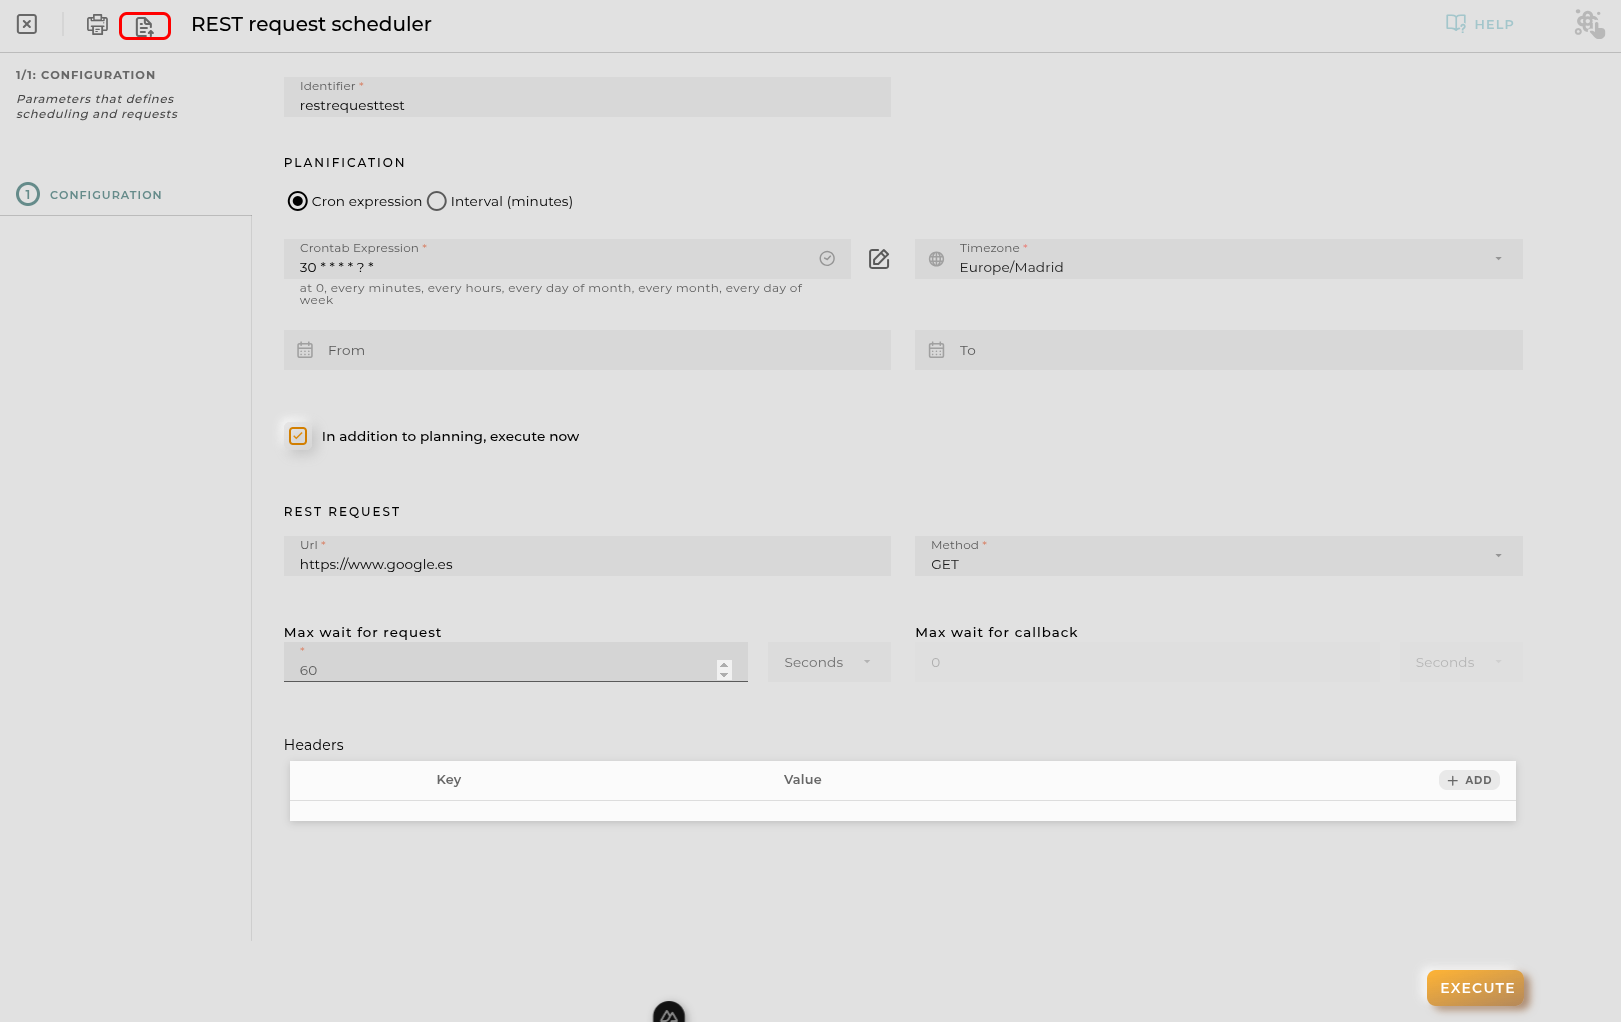
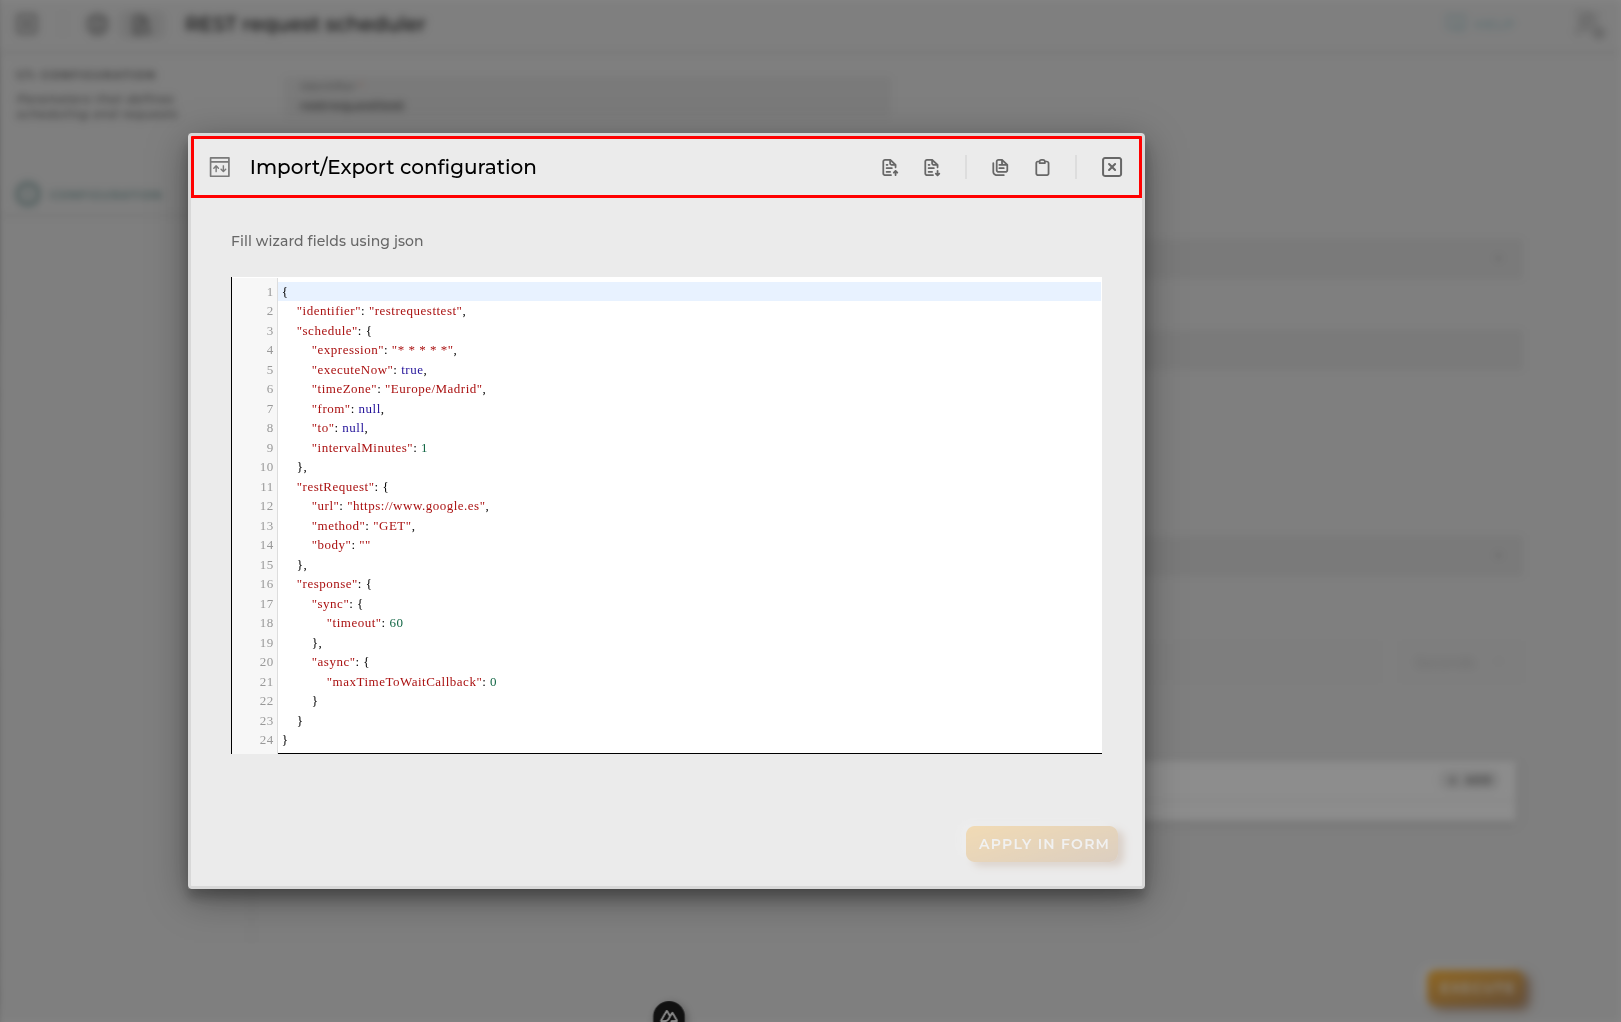
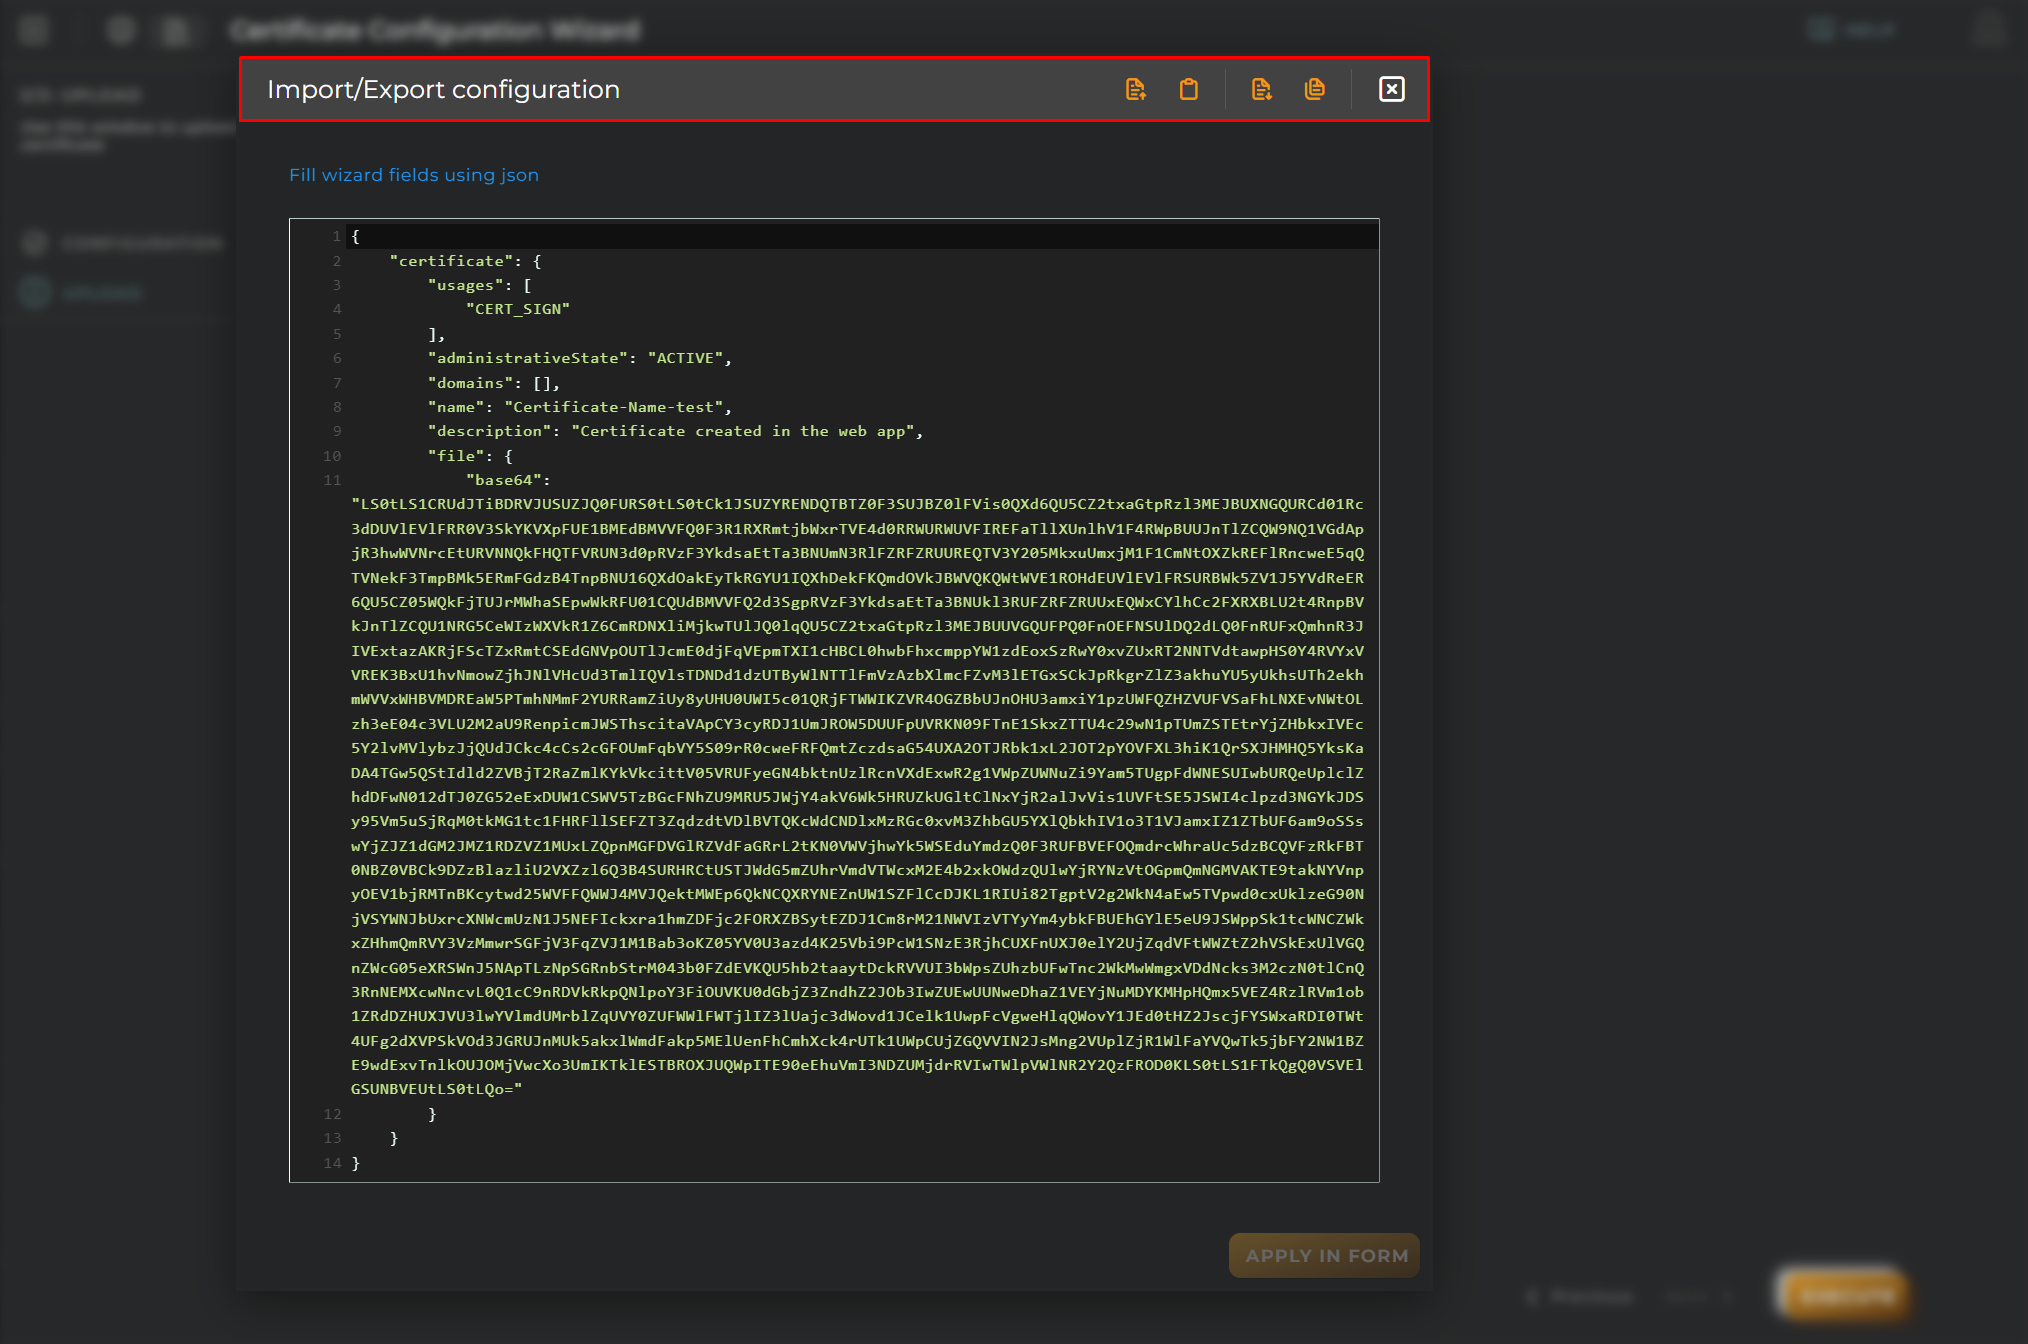
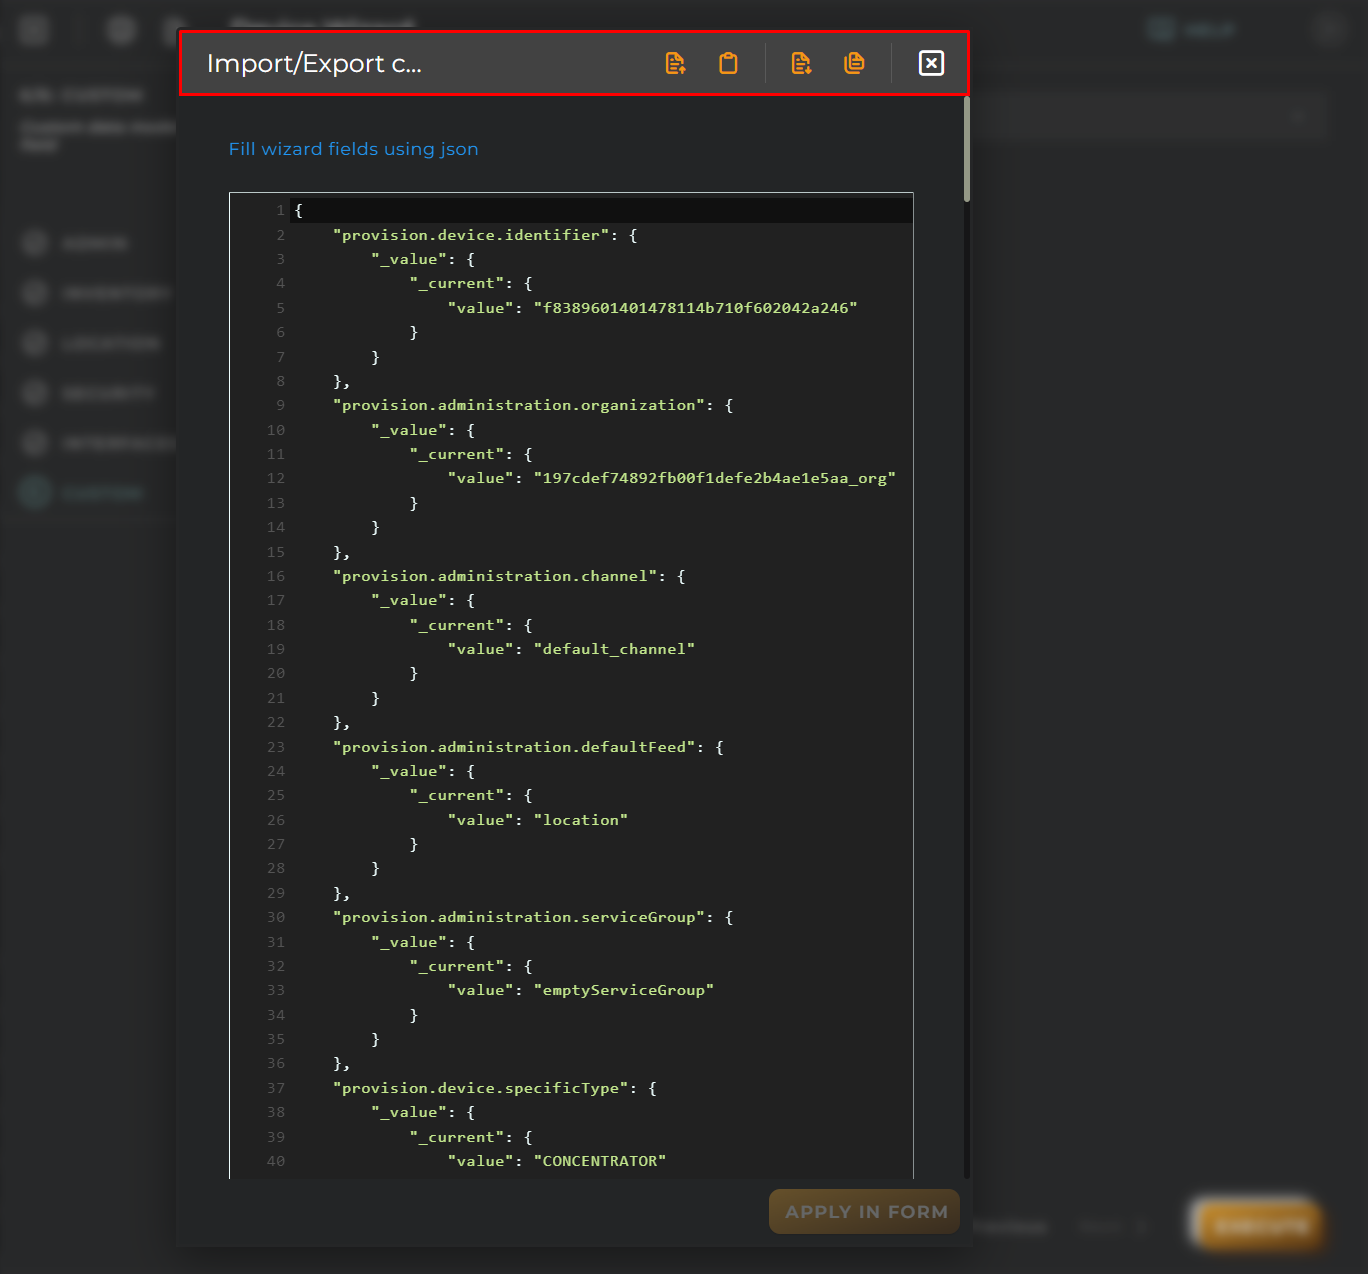
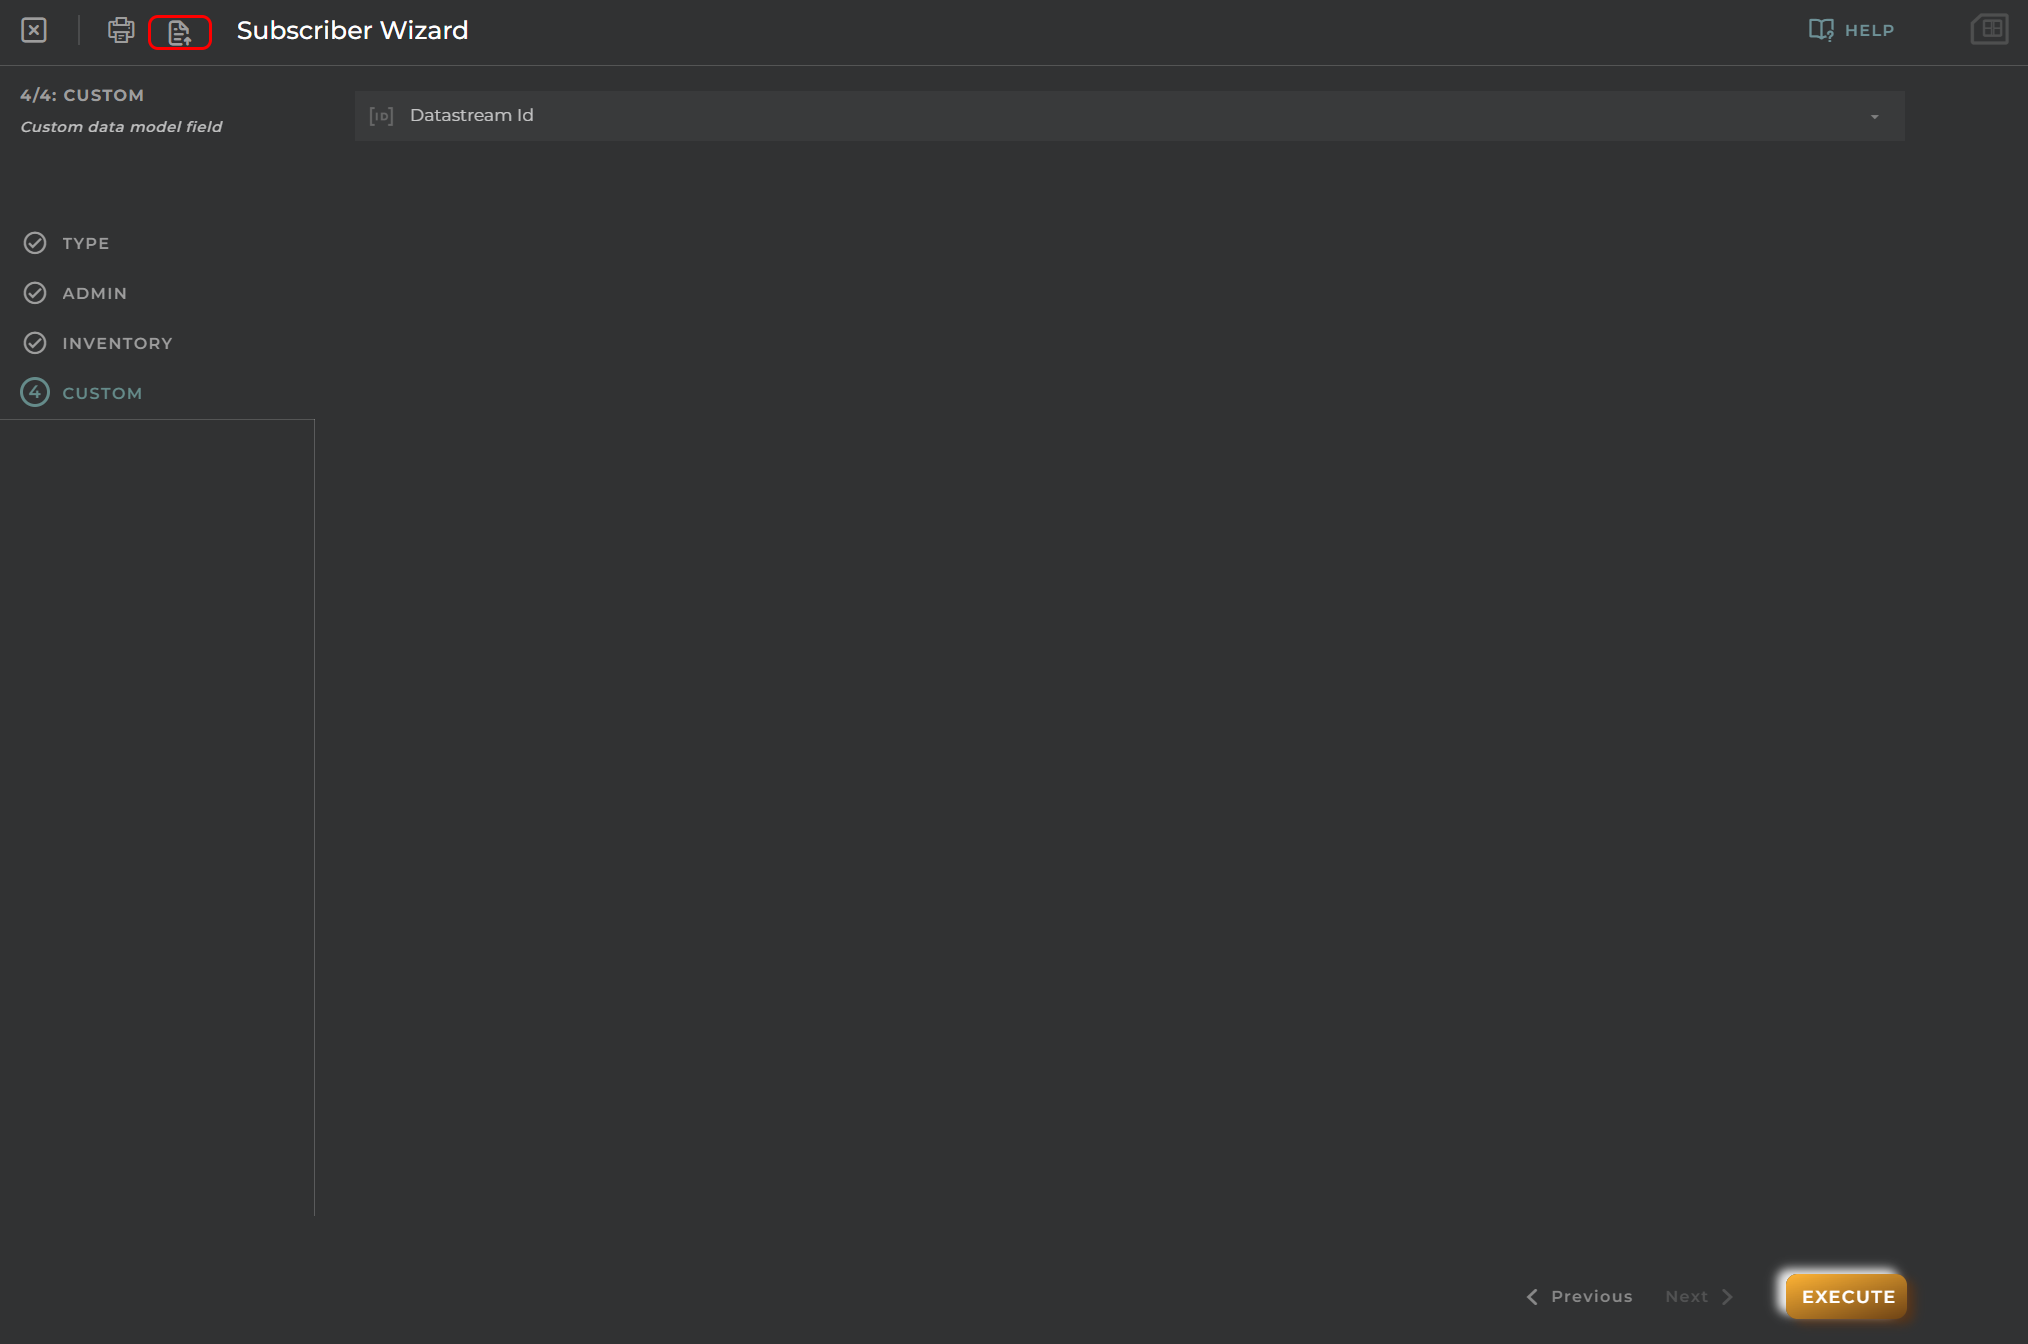
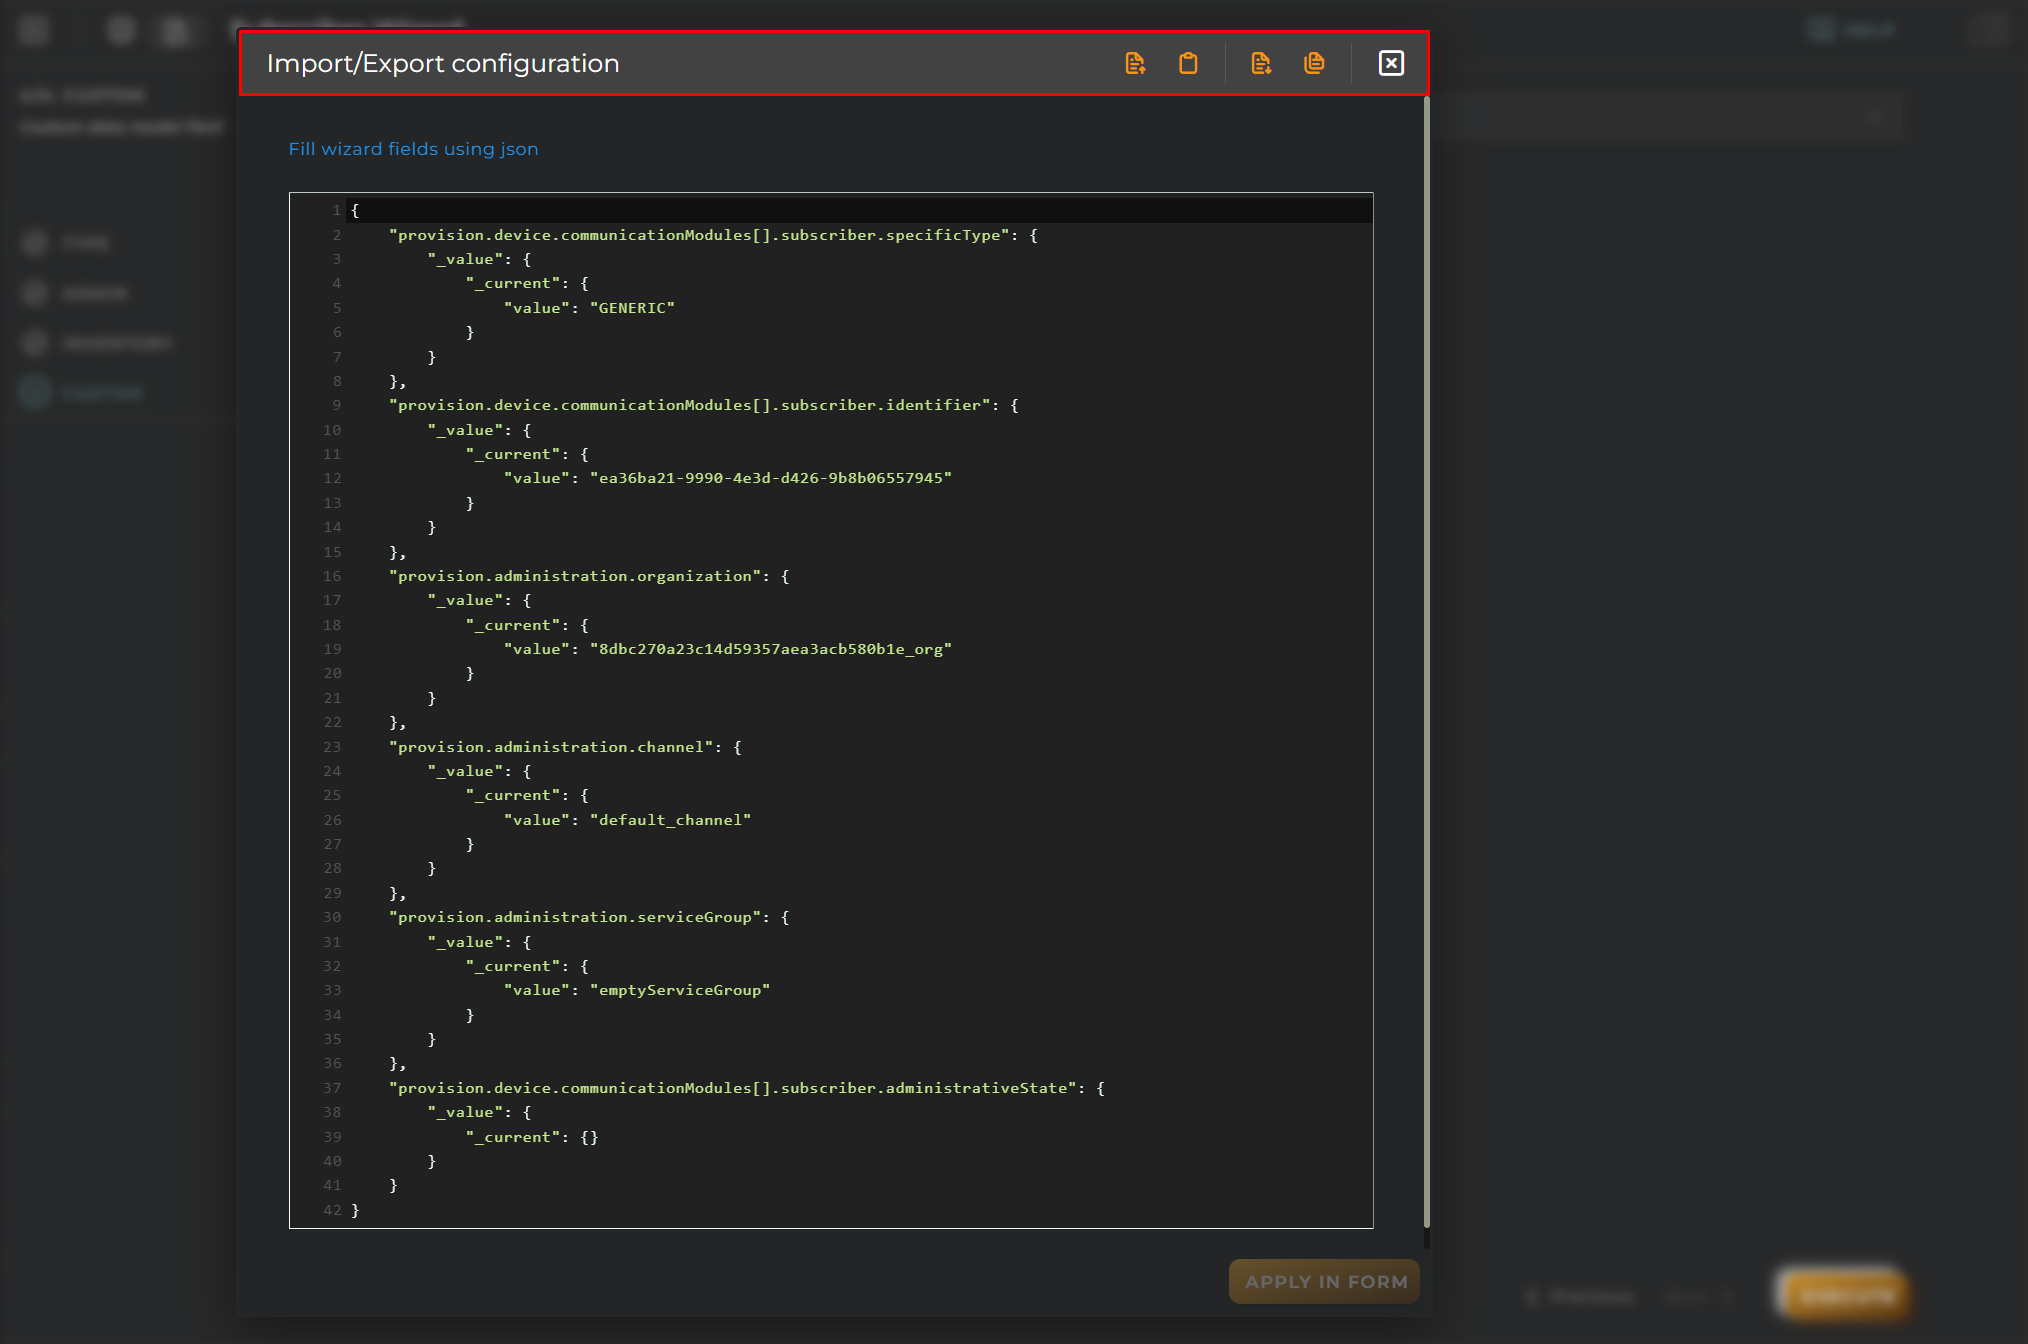
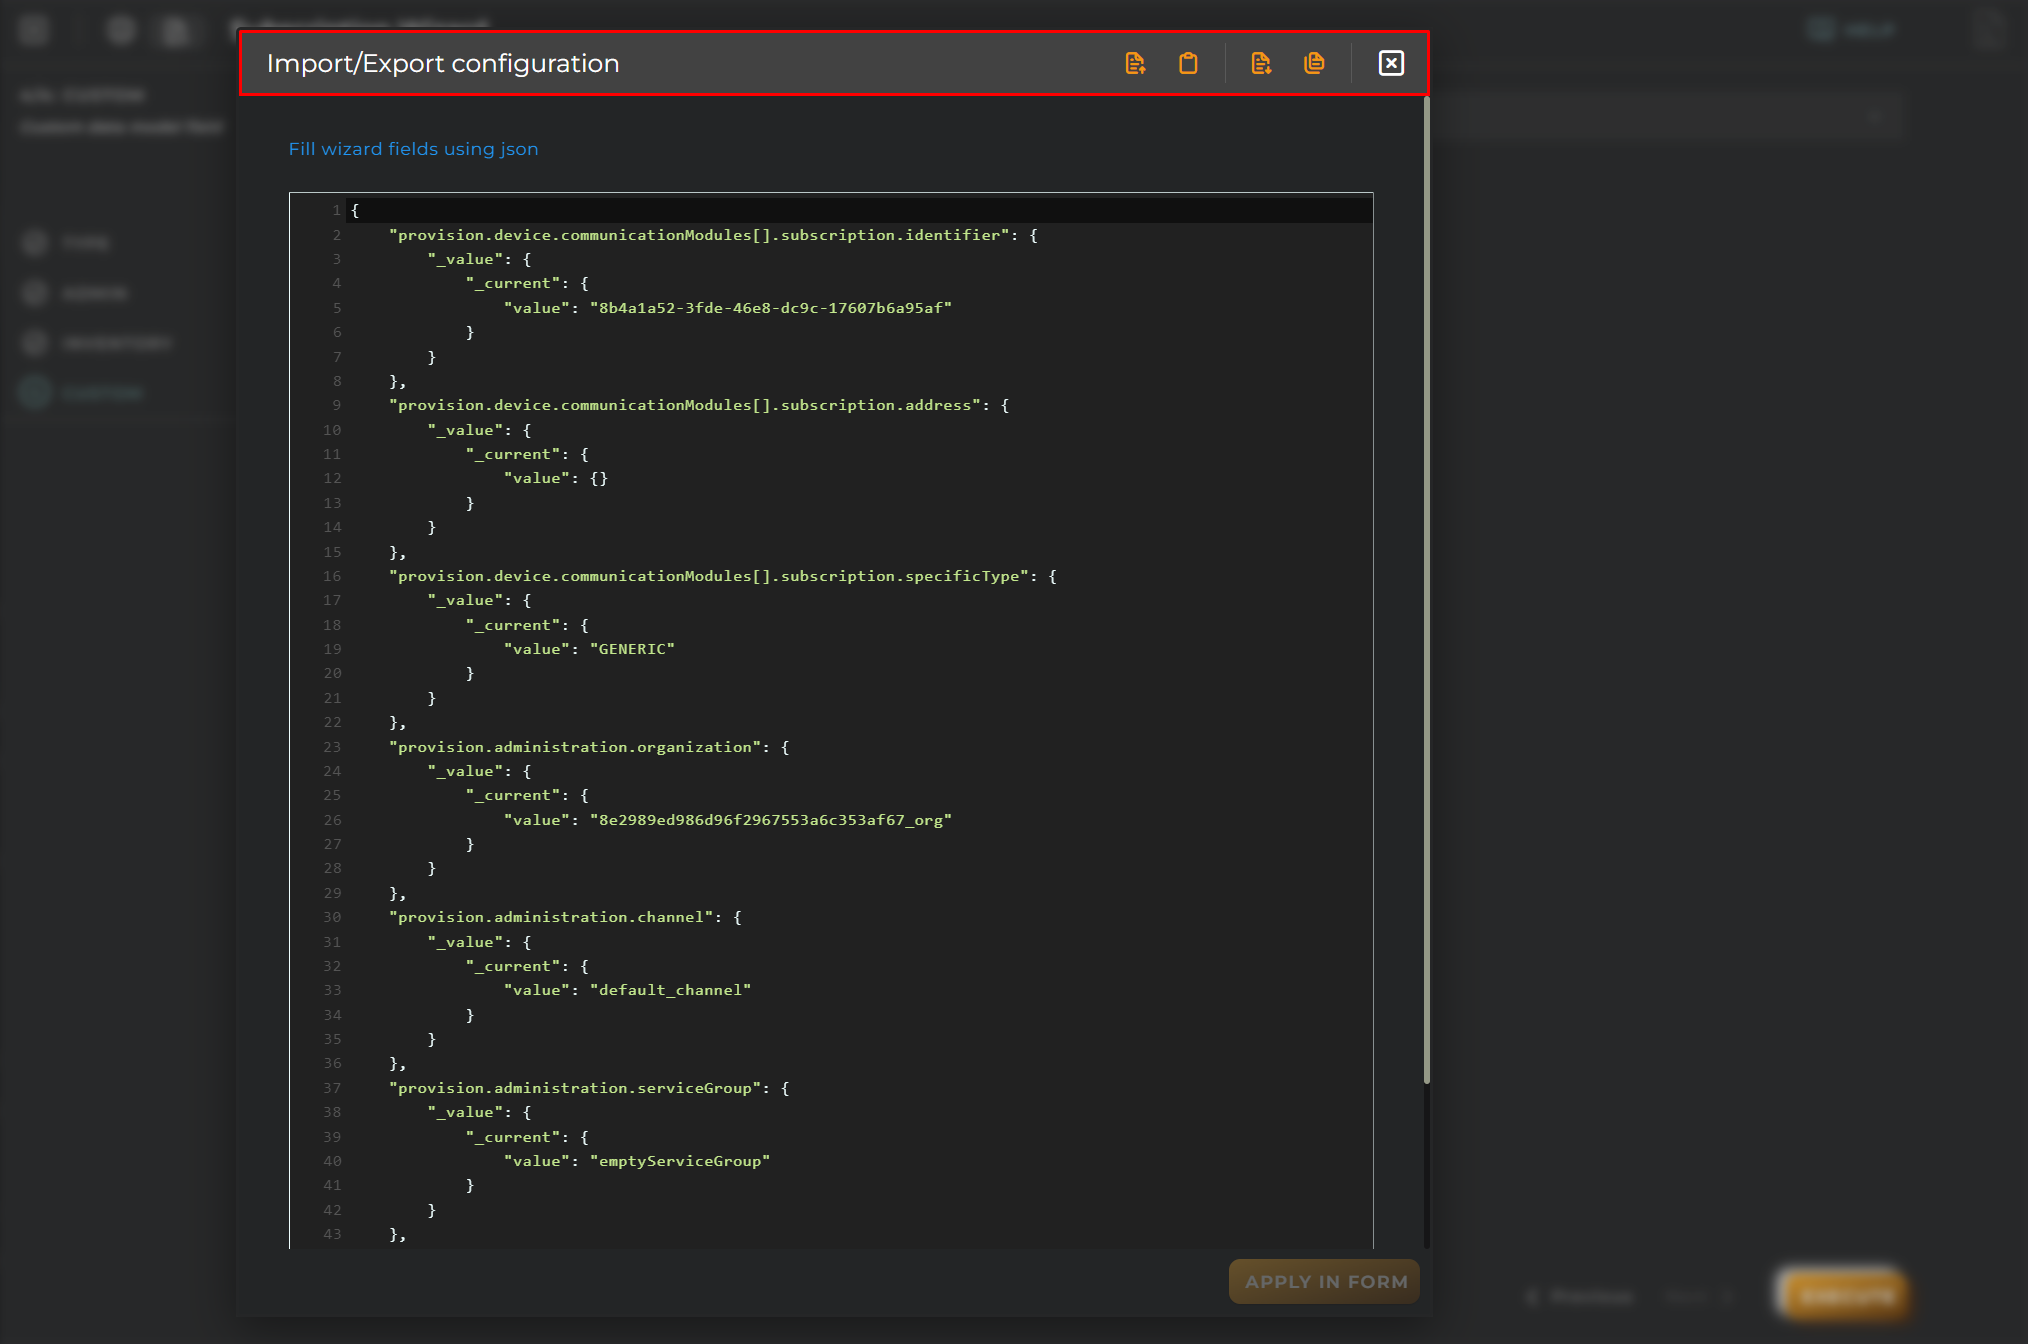
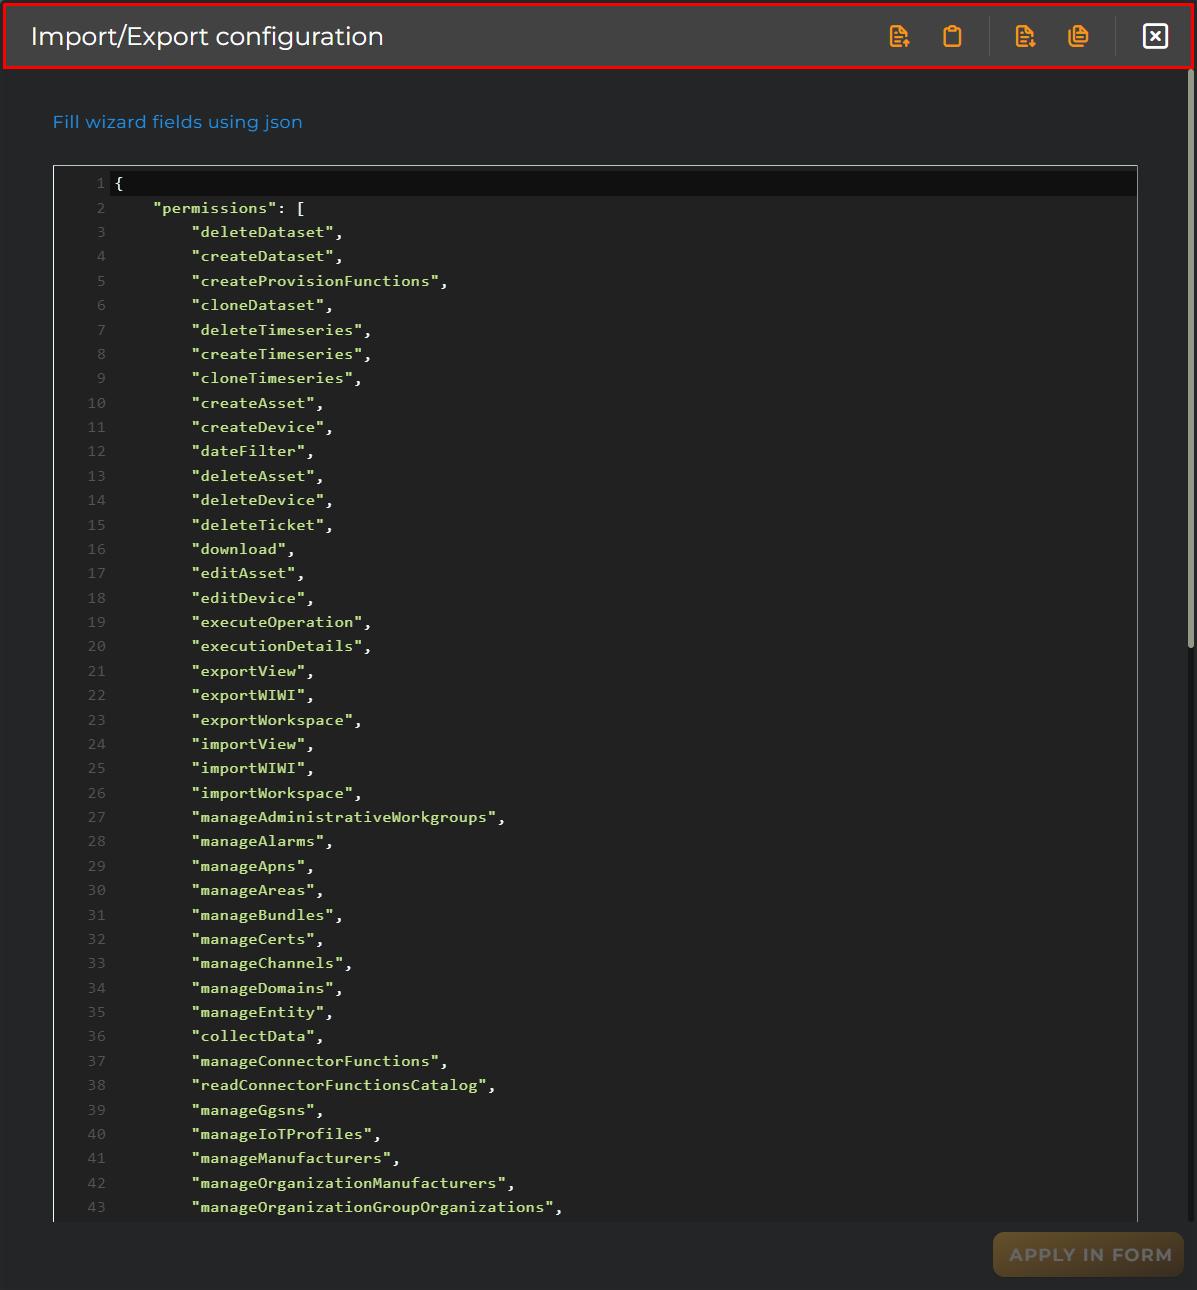
Here you can download the JSON to be imported in the wizard using the top option “Import/Export configuration”
Copy the following JSON and paste into the code box:
This apply the JSON in the wizard that can be used if desired, directly using the API.
4. Entity Provisioning
🌐 The OpenGate Entity Types
OpenGate models several types of entities to structure and manage your IoT ecosystem. These entities are:
Asset: A digital representation of something that may have one or more related devices. For example: a parking slot, a warehouse room, a patient, a wind turbine, or a solar plant.
Device: Typically a physical component such as a sensor or machine. Examples include temperature or motion sensors, industrial PLCs, water/gas meters, or generators.
Subscription: The communication contract associated with a device. This could be a 5G or NB-IoT mobile data plan.
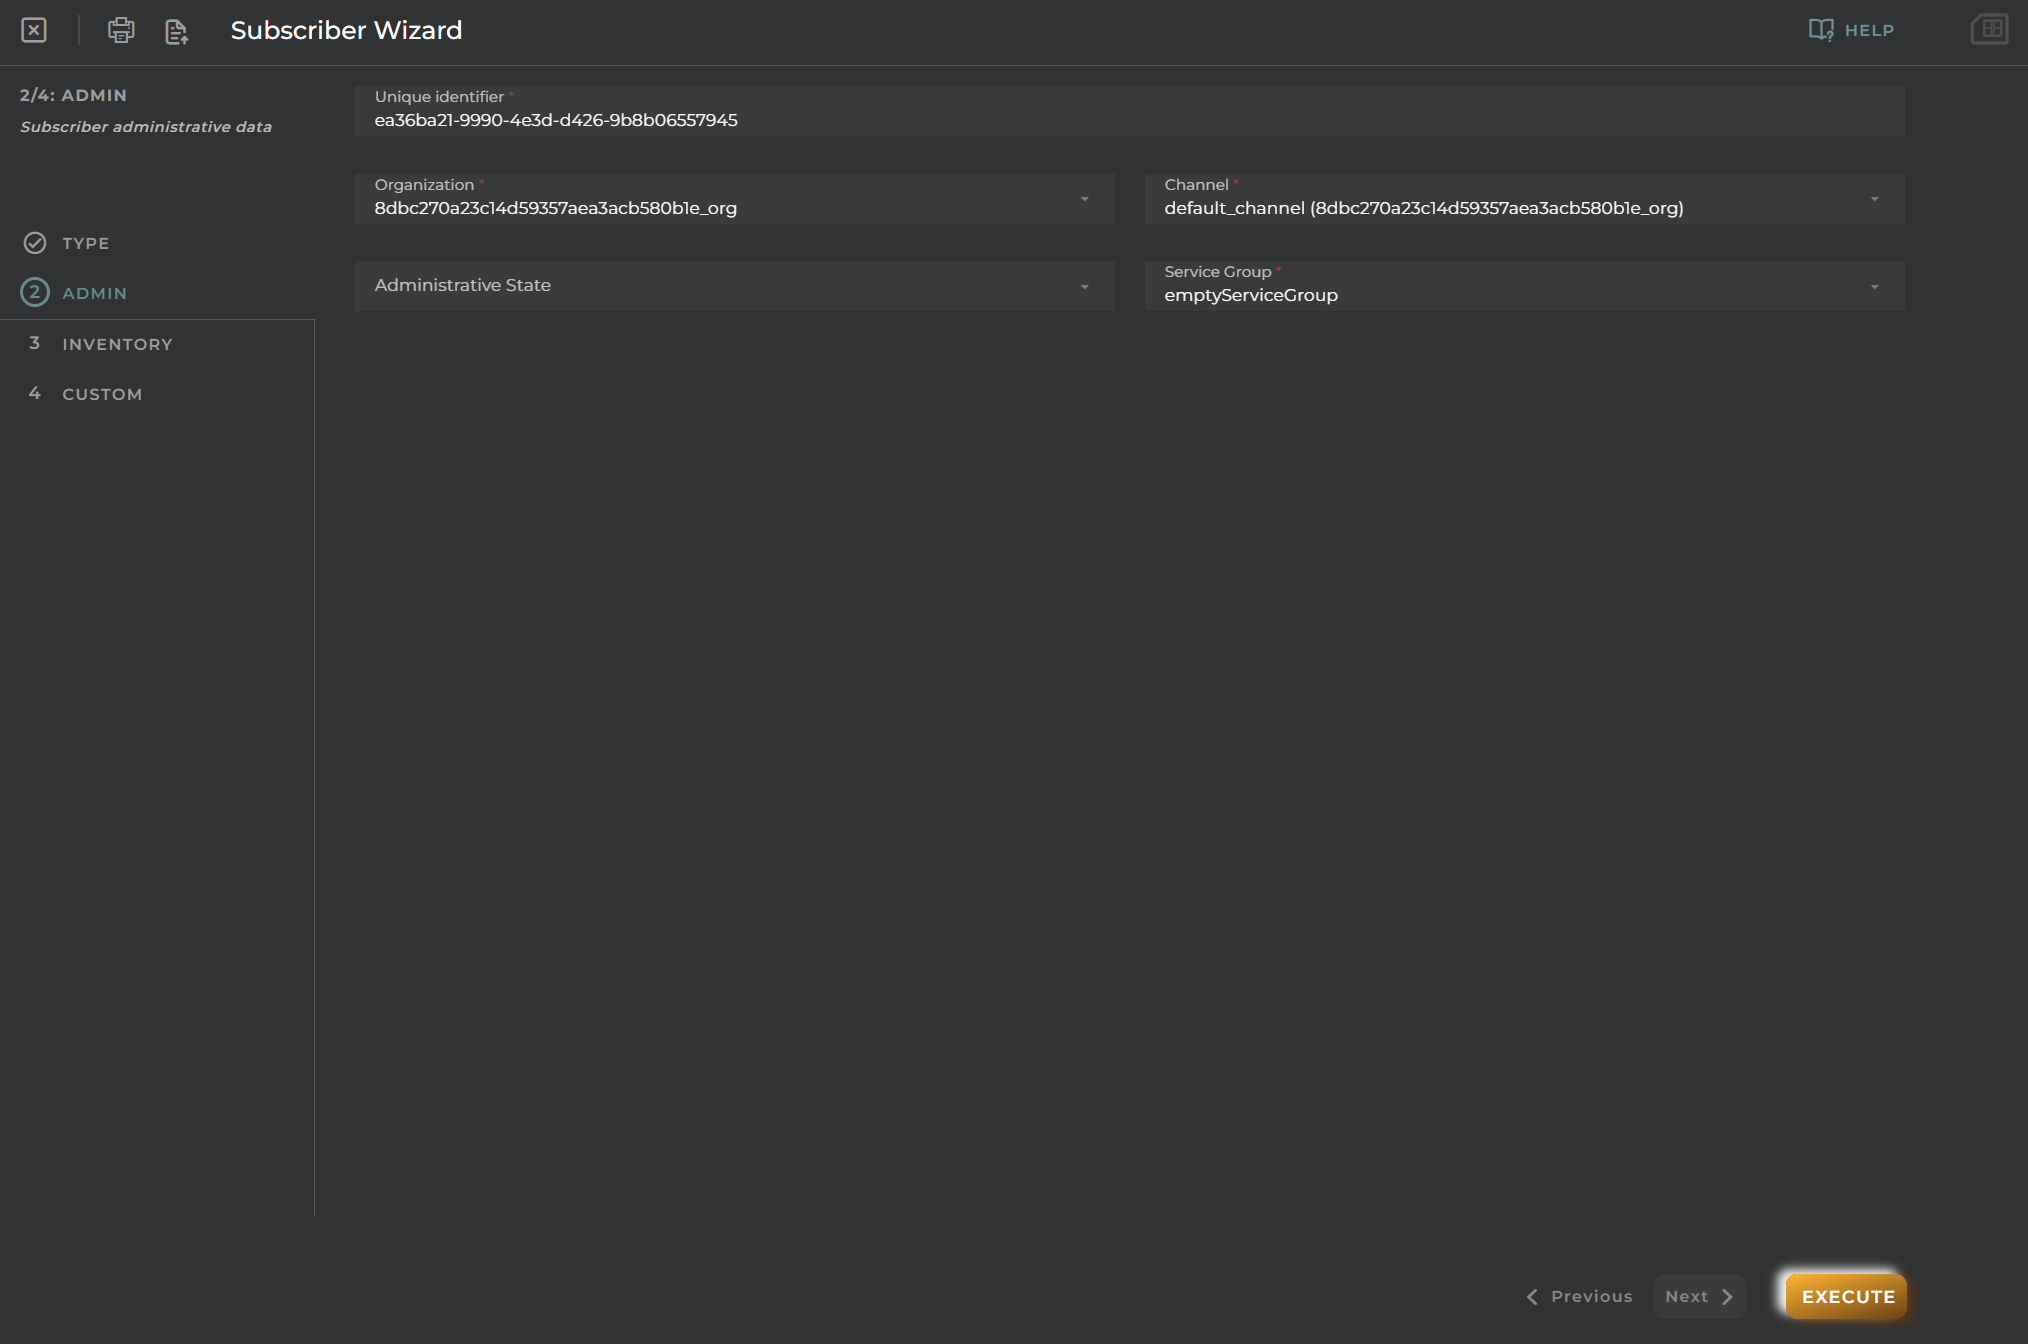
Subscriber: The identifier that enables communication, usually a SIM or eSIM number.
Ticket: A special entity used to log work within the platform, such as on-site deployments or repair processes.
Organization: Represents a company or its sub-organizations.
Channel: A logical grouping of devices, often organized by location, function, or asset group.
⚙️ Provision new Entities
To begin collecting data from your ecosystem, you’ll need to provision entities in OpenGate. There are three ways to do this:
🎯 IMPORTANT CONCERN ABOUT ENTITY IDs
IMPORTANT: In case you are using OpenGate Cloud, take into account that the IDs for the entities are unique for all the OpenGate instance. OpenGate cloud is an unique instance for all our public cloud customers, and because of the behaviour of some manufacturers and protocols, the device ID must be as is without modifications (MAC address, UUID for people, and so on). We need this ID to identify the device correlation to your OpenGate account so it may occur that if you use custom identifiers, those identifiers already exist on OpenGate Cloud.
We always recommend that you should define a prefix to create virtual or simulated entities.
For this tutorial, define a [YourPrefix] to replace later the JSON provided with the examples.
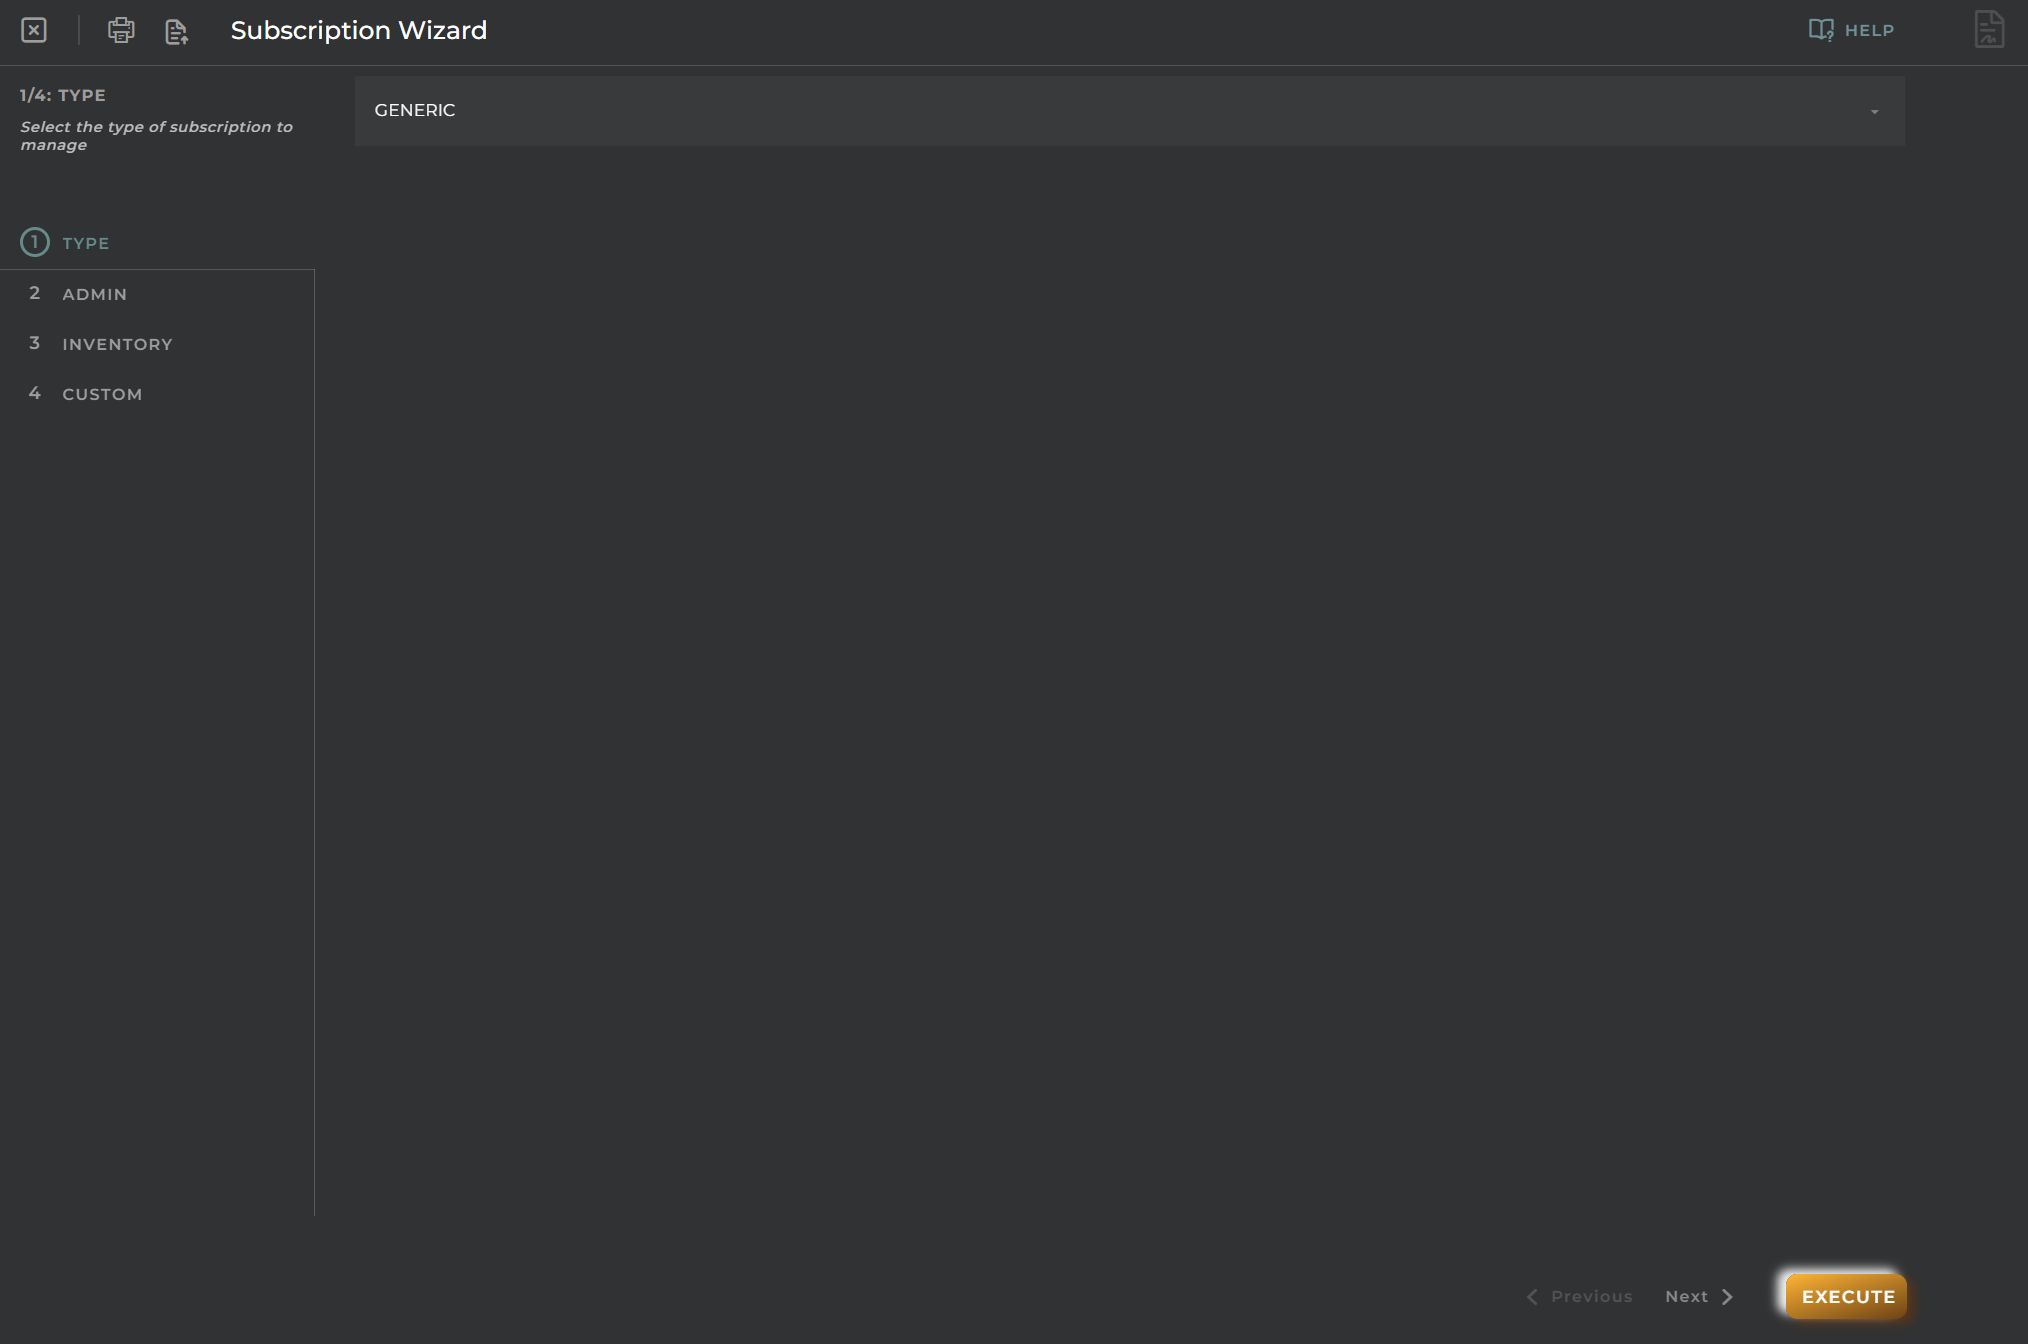
🧙♂️ Using the Wizard
OpenGate includes a guided wizard to help you create new entities easily, step by step. Although the wizard is customizable, for this tutorial we’ll use the default version.
1. Open the wizard from the UI.
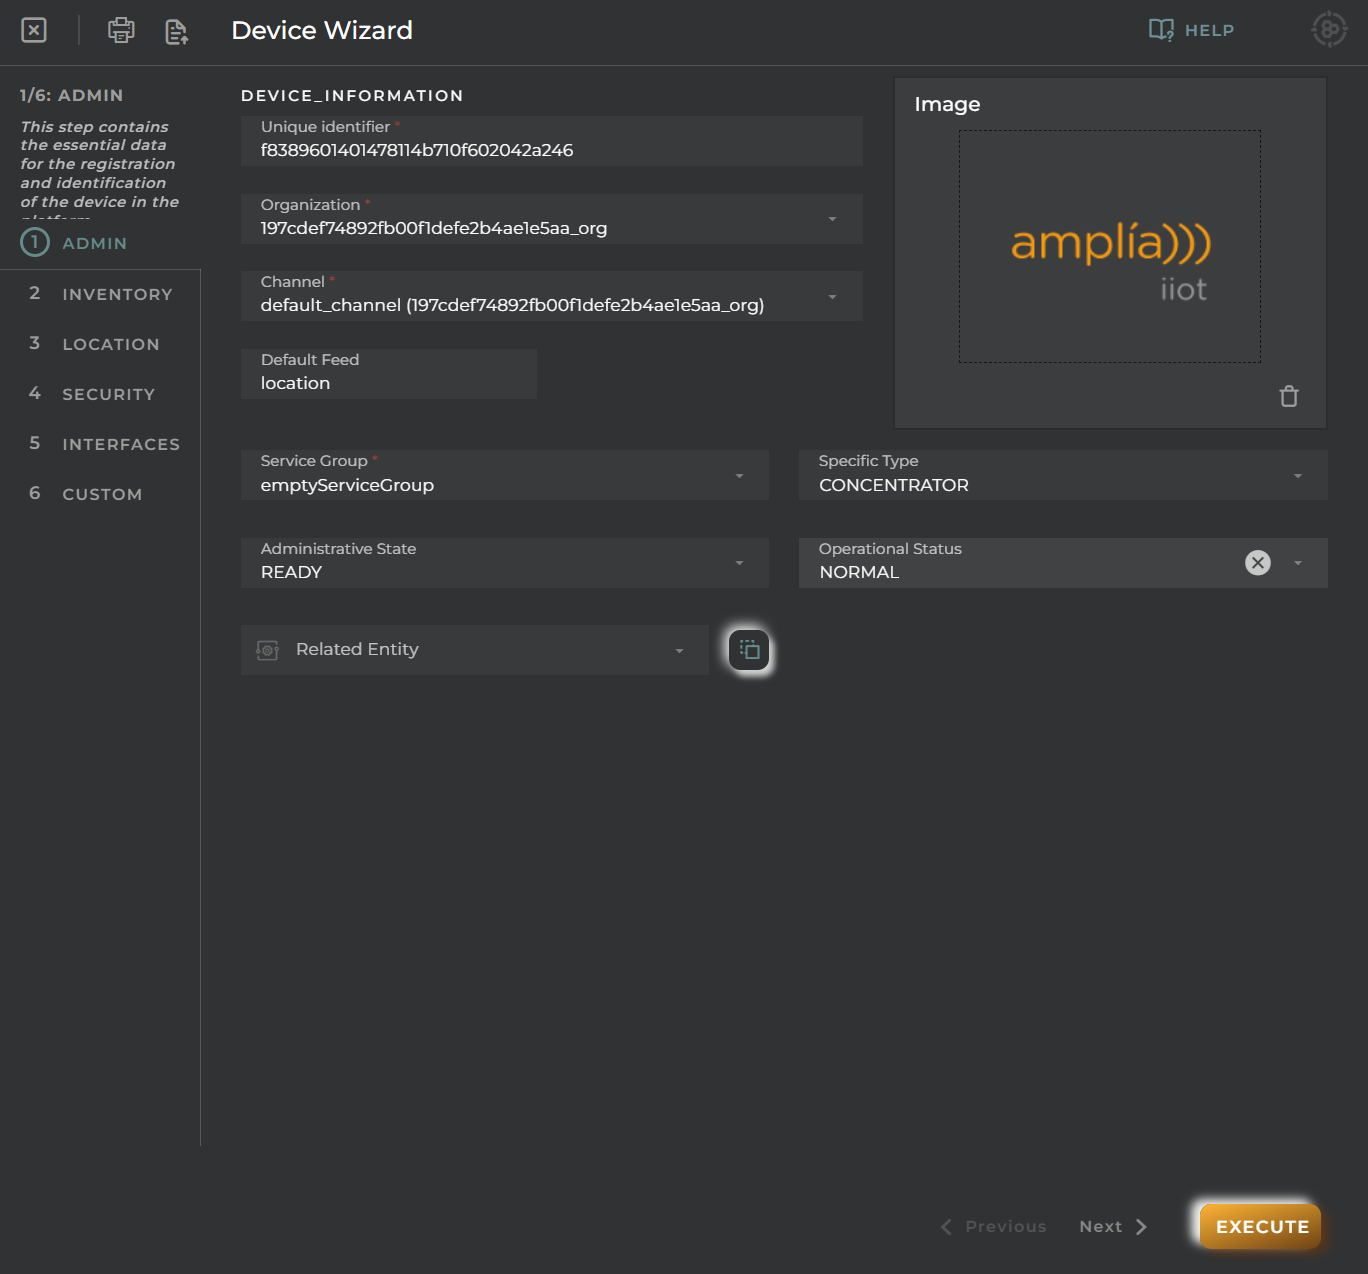
Go to “Opengate Management > Devices”, then click on “+ Create Device” and the wizard start
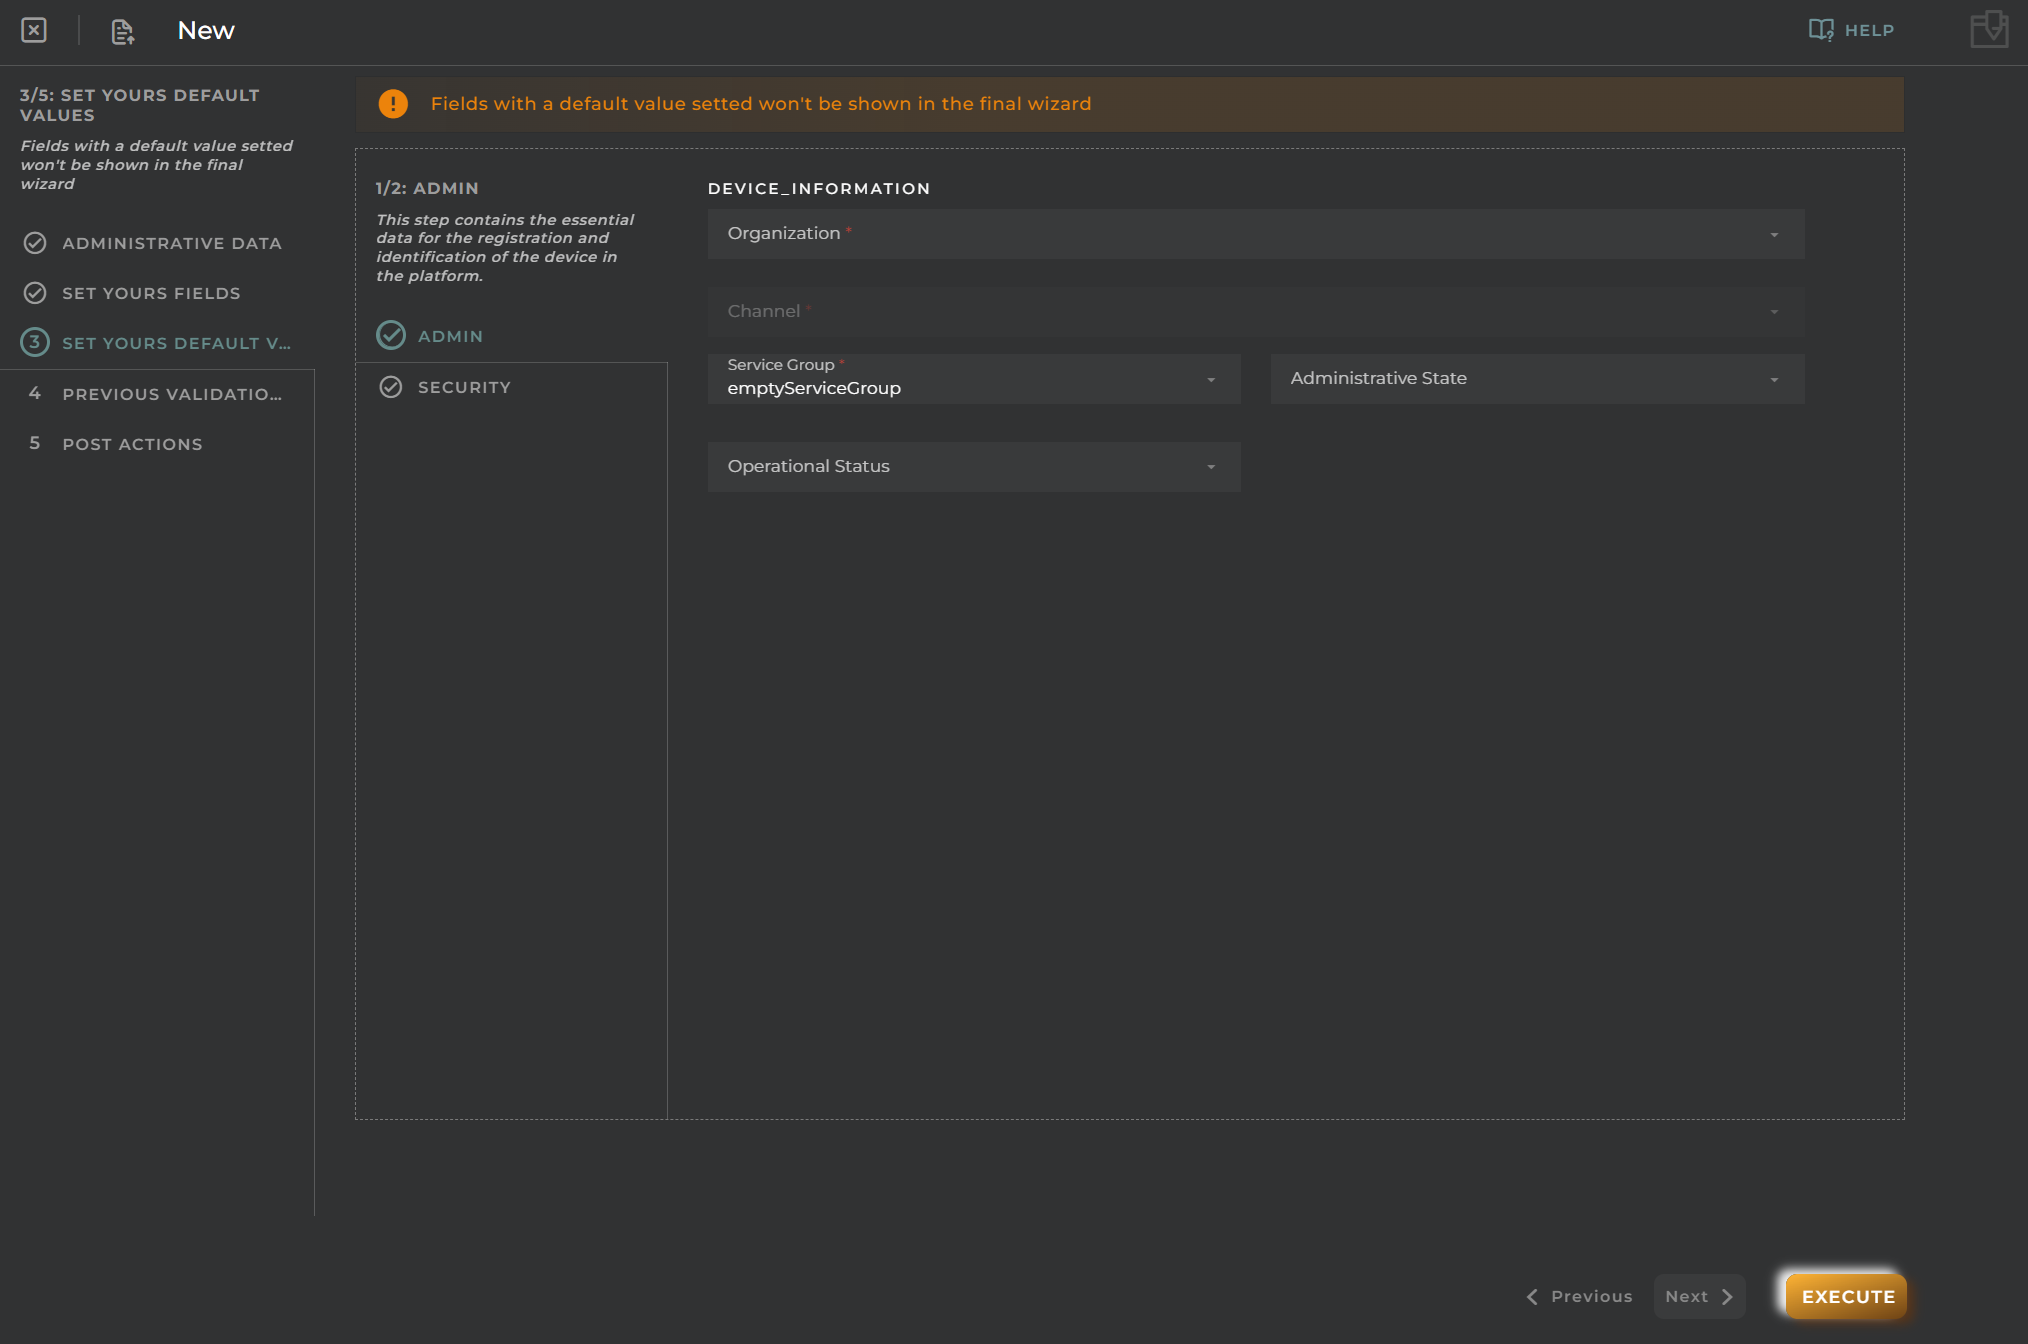
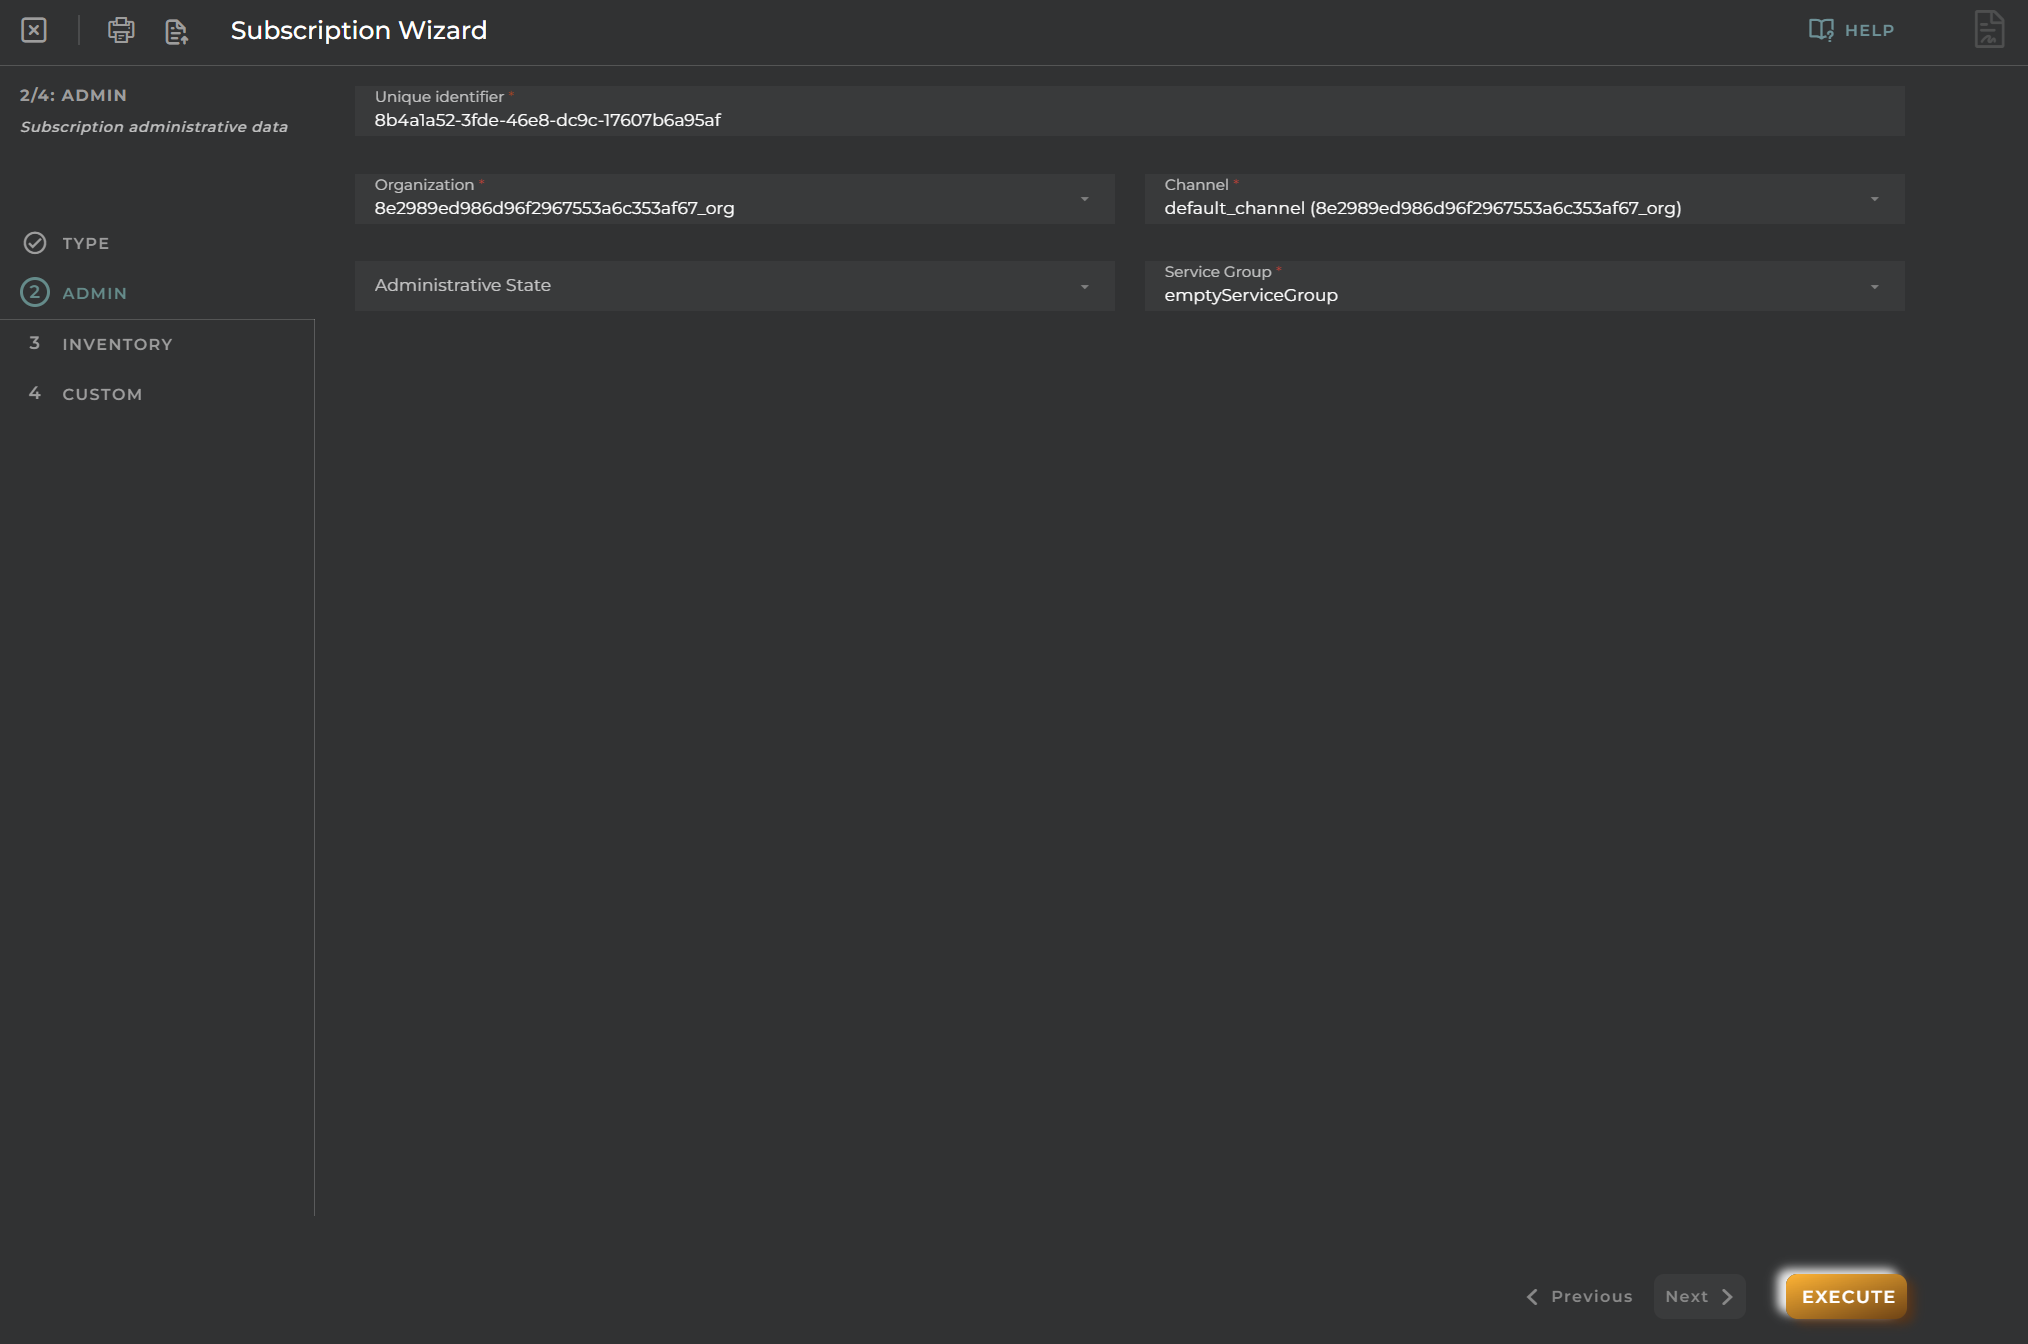
2. Fill the first step: Enter administrative information (name, type, organization, etc.).
As this tutorial’s purpose, we will fill the most commonly used fields, that are:
Unique Identifier: This is the unique ID of the device on the platform, use [YourPrefix]-ps-001
Organization: To what organization this entity belongs. We have not more in this tutorial, use workshop
Channel: Group of devices, in this tutorial we just have default_channel (workshop)
Plan and Service Group: We don’t go deeper in this tutorial for these fields but Plan indicates the traffic and data policy for this devices, and ServiceGroup, indicates the operations group of the entity. Use defaults
Specific Type: As the name indicates, this allows you to set the specific type of device. This works like a label, and later we will see how to create filters based on this field. The options here are predefined but an Administrator user can customize them. Use SENSOR
Administrative Status: This is the Administrative Status of the entity, use ACTIVE
Operational Status: This is the operational Status of this entity, use NORMAL
🎯NOTE: The next steps are optional, but for this tutorial we will show you the most relevant standard fields
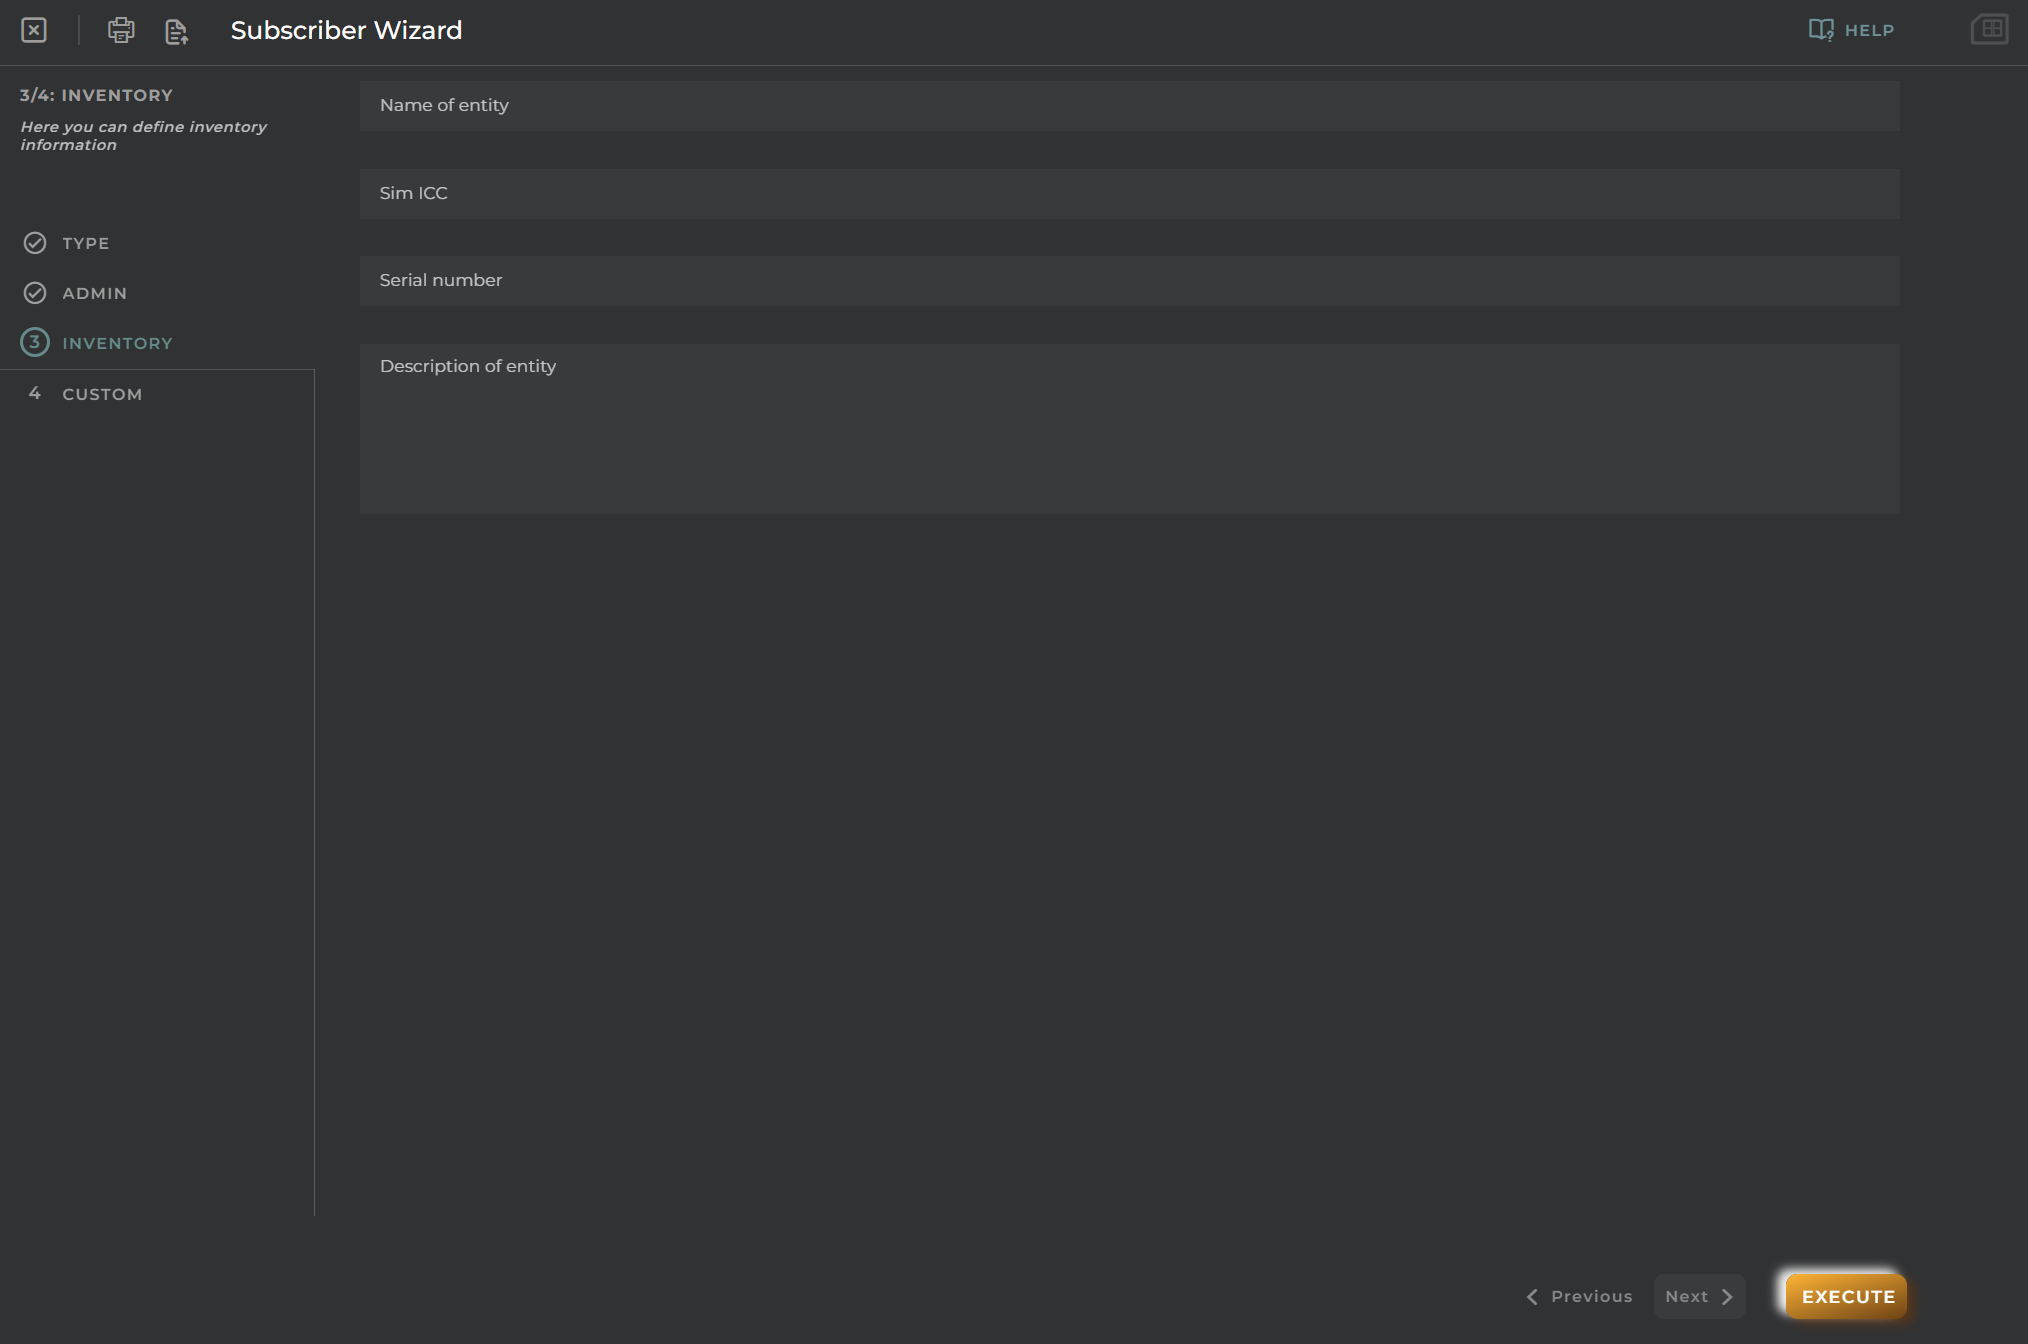
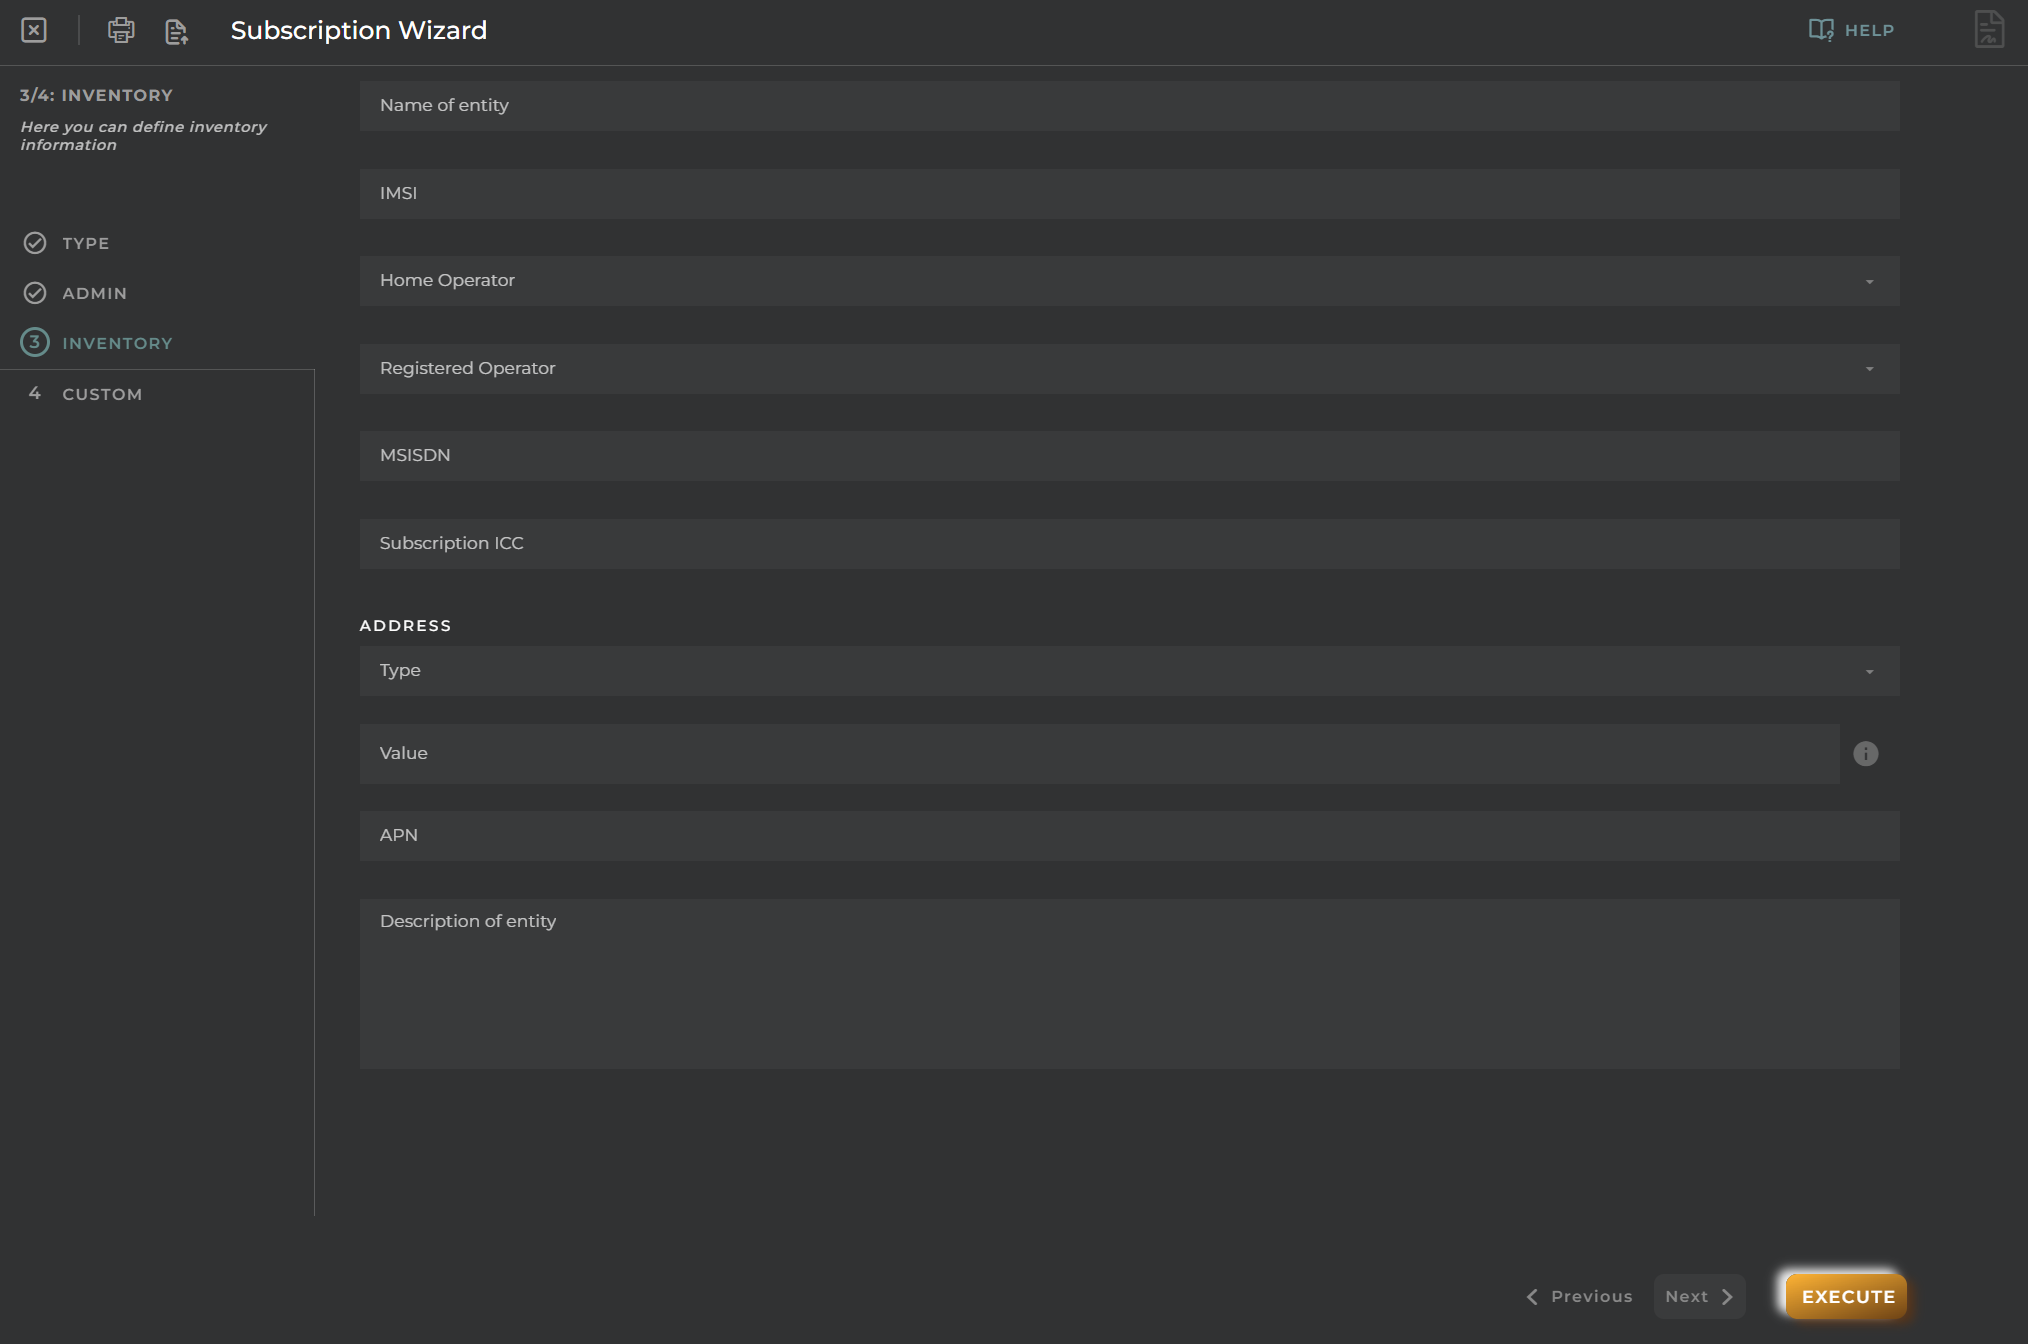
3. Step 2: Inventory
This step allows you to define other device info, lets fill the following:
Name: This is the name of the entity, ussually this is a commonly used name in your solution. Use: Parking Sensor 001
Serial Number: This is the serial number, usually a device serial number is an unique number for the hardware itself. Use: PS.AABBCCDDEE00001
This group of fields are not mandatory and we will not fill in this tutorial, but just for clarification the others fields are:
Description: Obvious, a free text description for the entity just in case we need some notes.
Topology Path: Some times there are devices that have not communication capabilities by themselves or that require another entity to play as gateway to send the information depending on the architecture requirements. This field allows you to provision the device that play this role for this entity. It is possible to choose one or create a new one from this same screen.
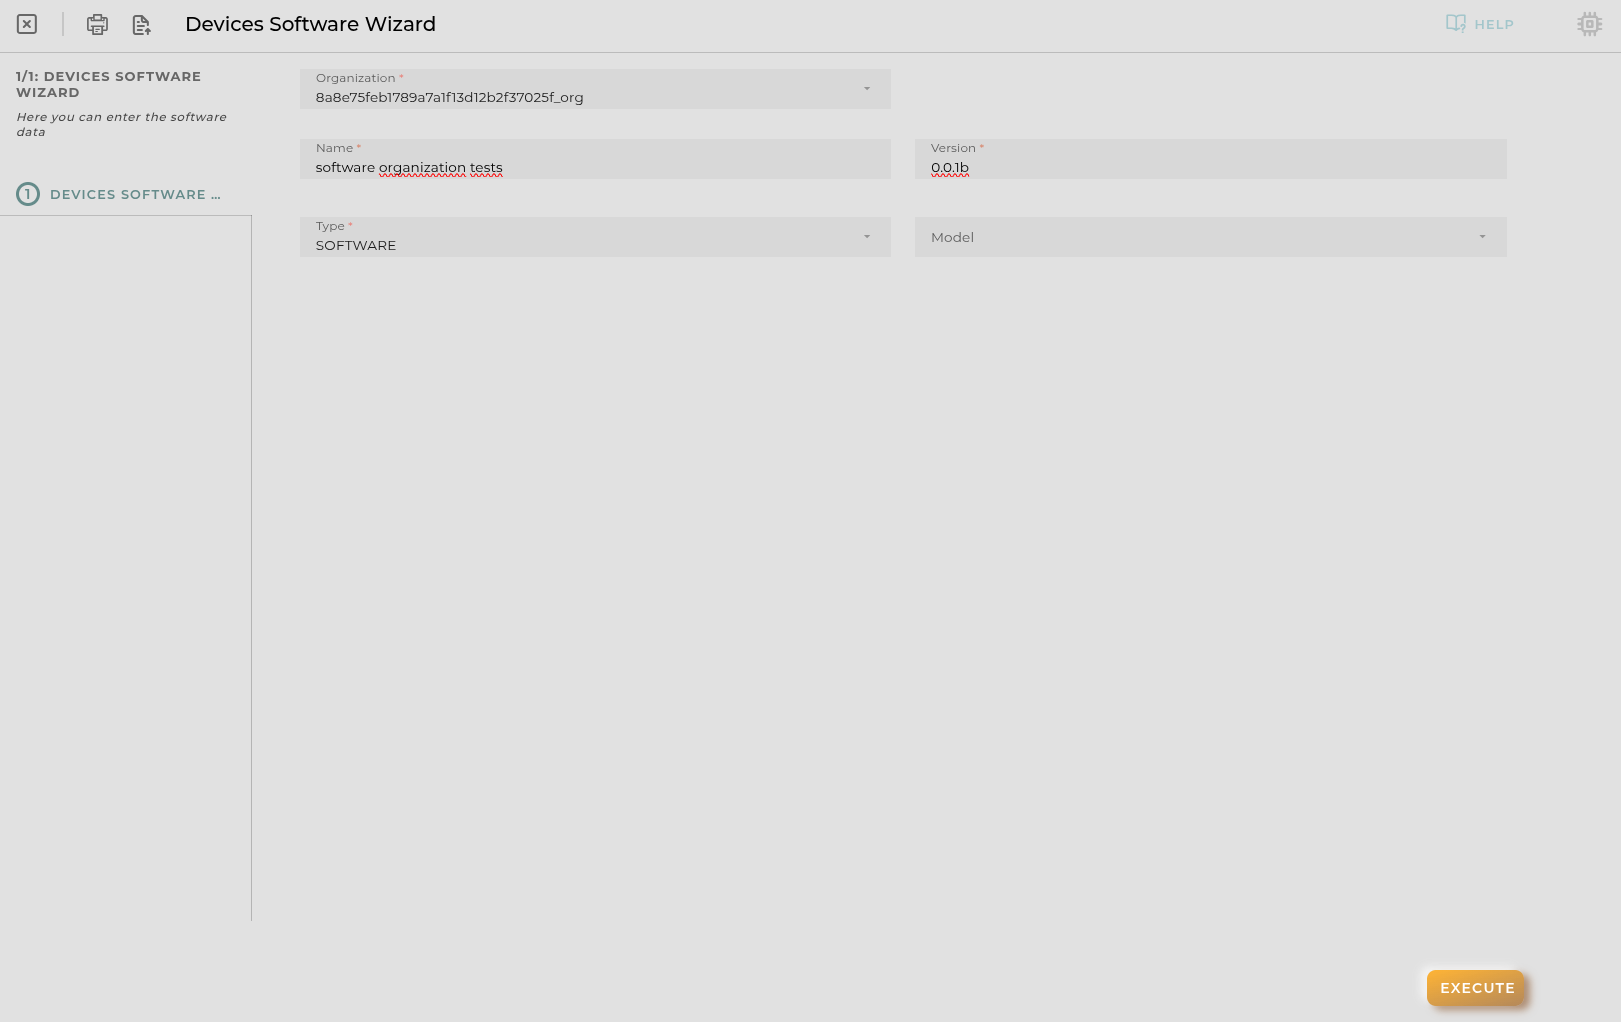
Hardware and Software/Firmware: Are used to indicate the inventory information for the hardware and software/firmware version of the device. This information is provisioned by a user, and may differ from the information collected from the device.
After fill the fields that we need, you should see this:
4. Step 3: Location
It is possible to define the location of the devices. For that this wizard step allows you to use directly the map to click on the entity location. Additionally, you can fill the information manually.
For this demo purposes use the location that you want.
Try to click in the map, you use the map left bar to show it in full screen
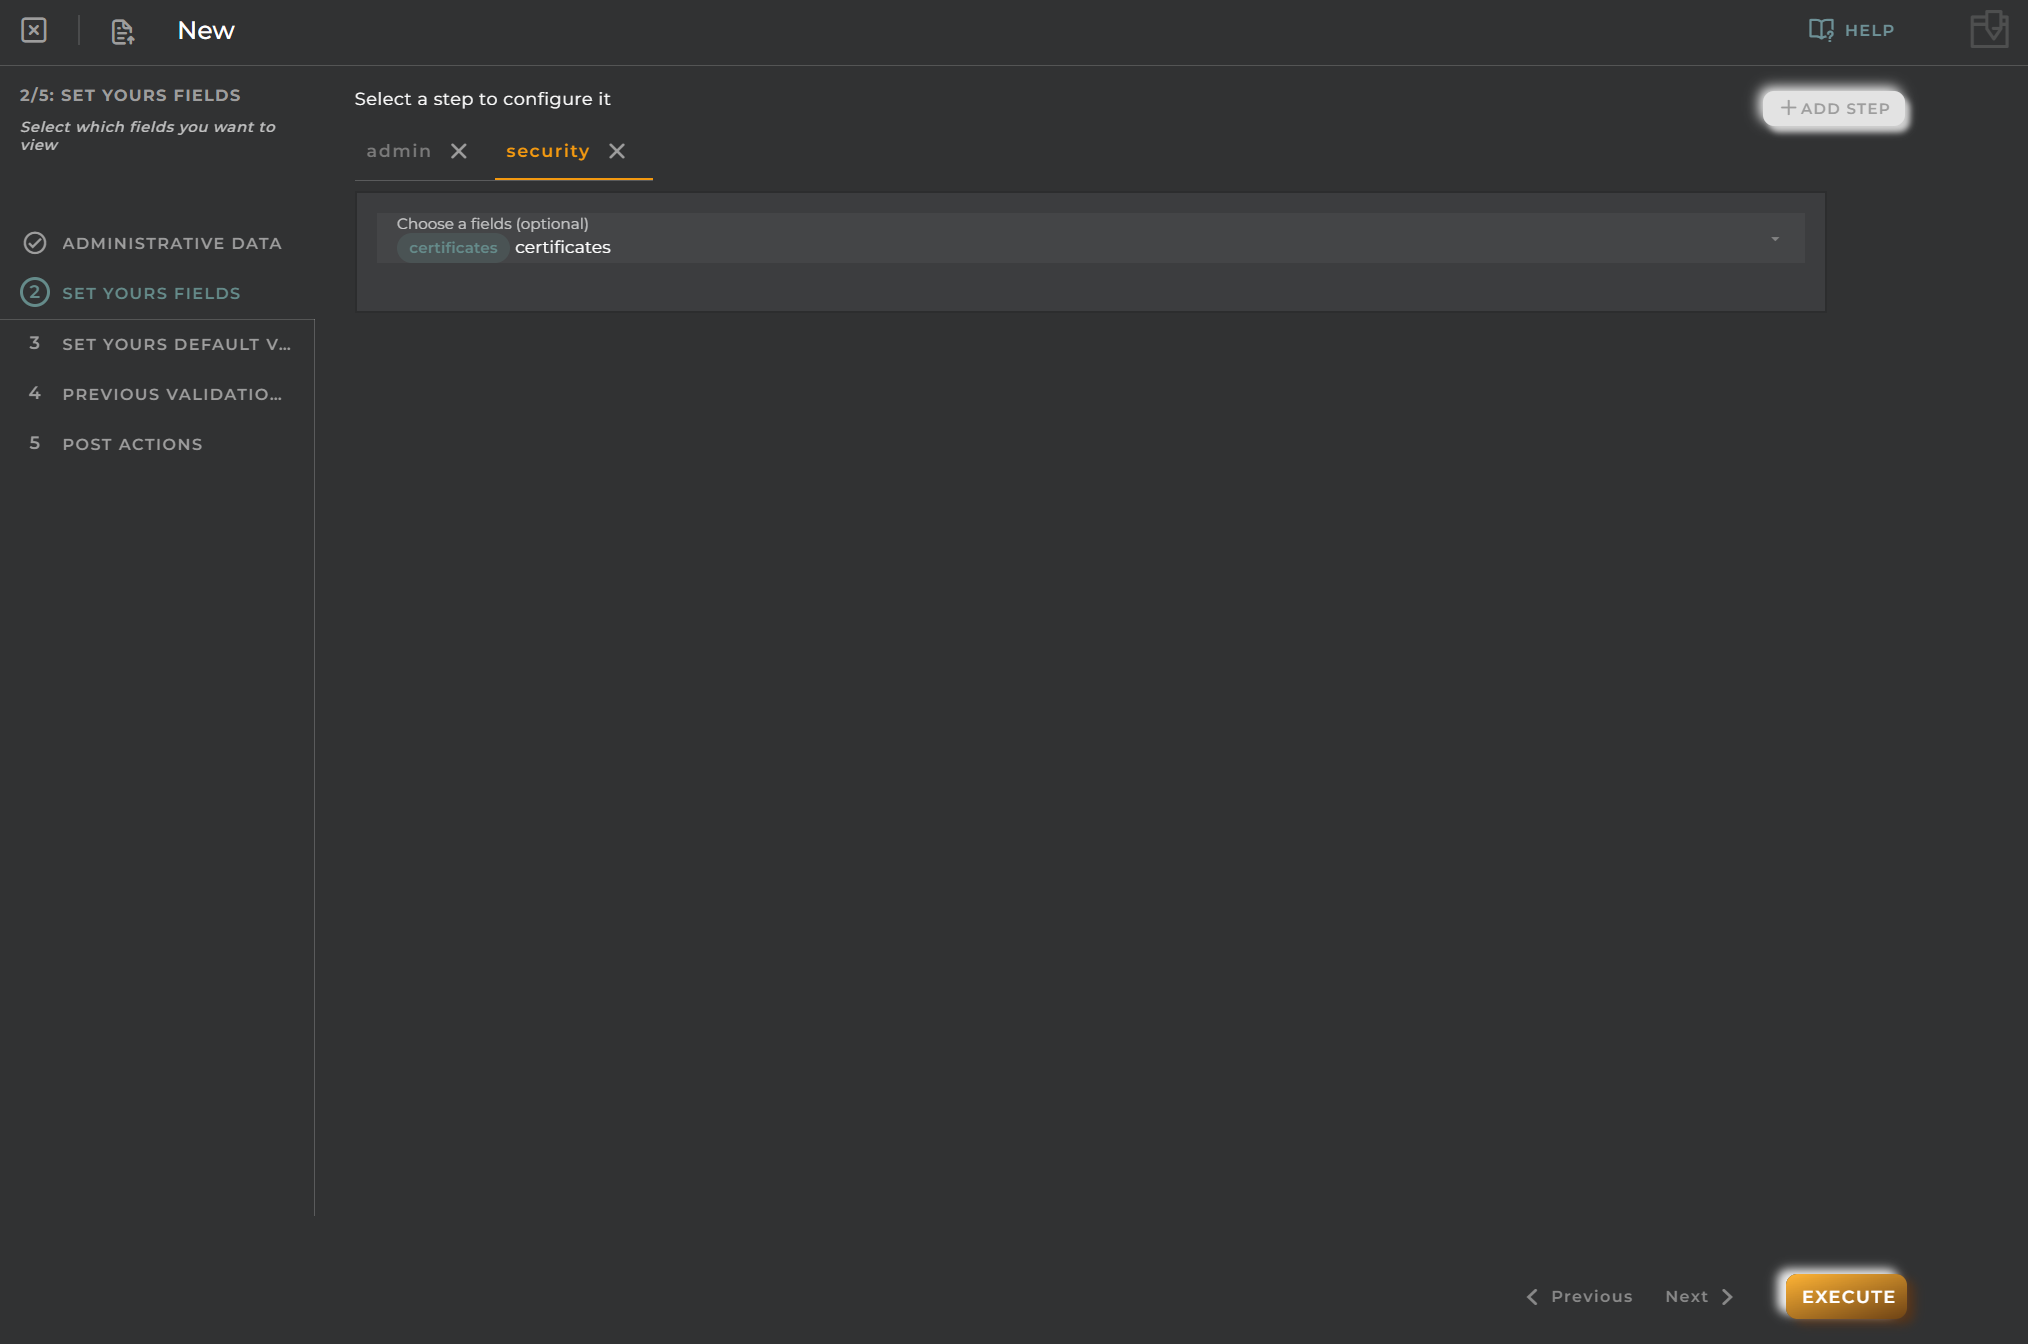
5. Step 4: Security
This step allows you to provision the standard OpenGate security options. We will not use it in this demo to easy accomplish the tutorial but you can provide here:
Trusted Boot: If configured a device must present this value on each collection event
Certificates: An administrator can add and manage certificates for your OpenGate organization
DLMS security params: DLMS devices are supported by OpenGate for different protocols and so, you should provide its security information to use them.
6. Step 5: Interfaces
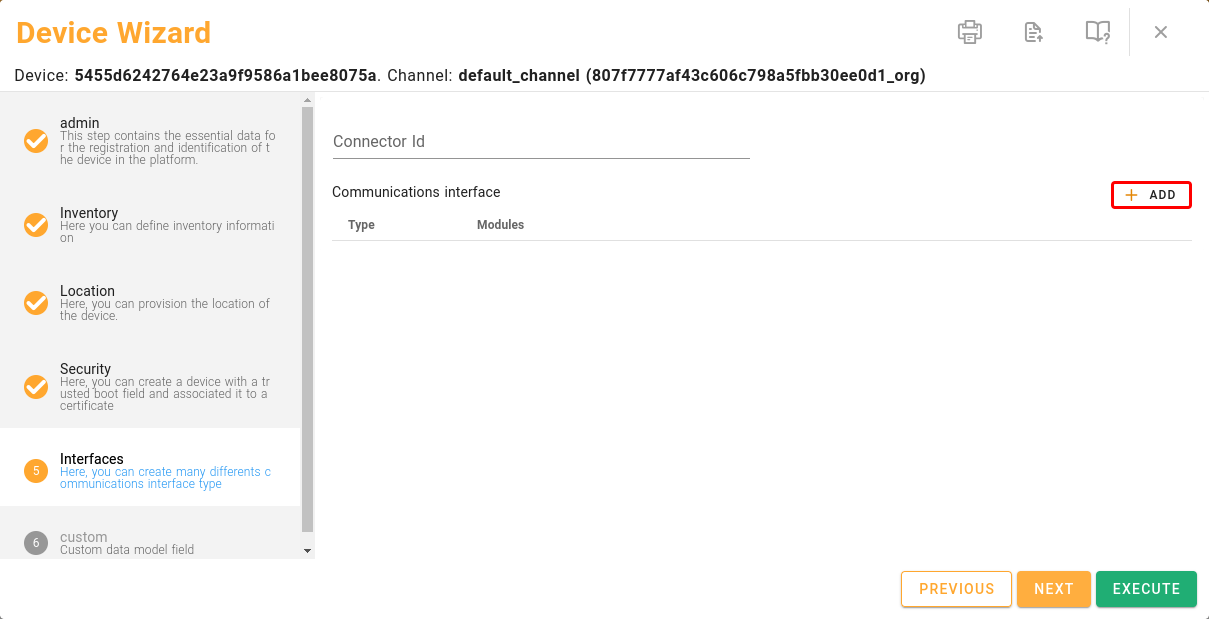
As we mention before in this HowTo’s serie, OpenGate can work with several parts of the IoT Value Chain and so, our platform allows you to manage and monitor even the communications layer, assotiated with your entities. This includes its communication modules, so from here you can provision the communications modules that the device has
For this demo, we will add one communication module (a device can have many) and we will add a Mobile communications module.
Click on “ADD” button and the platform will fill default values for the Subscription and the Subscriber. In case you have a real device with this capabilities, and so your own communications layer, you can fill this step form with your real values. In any case, you should see something like this:
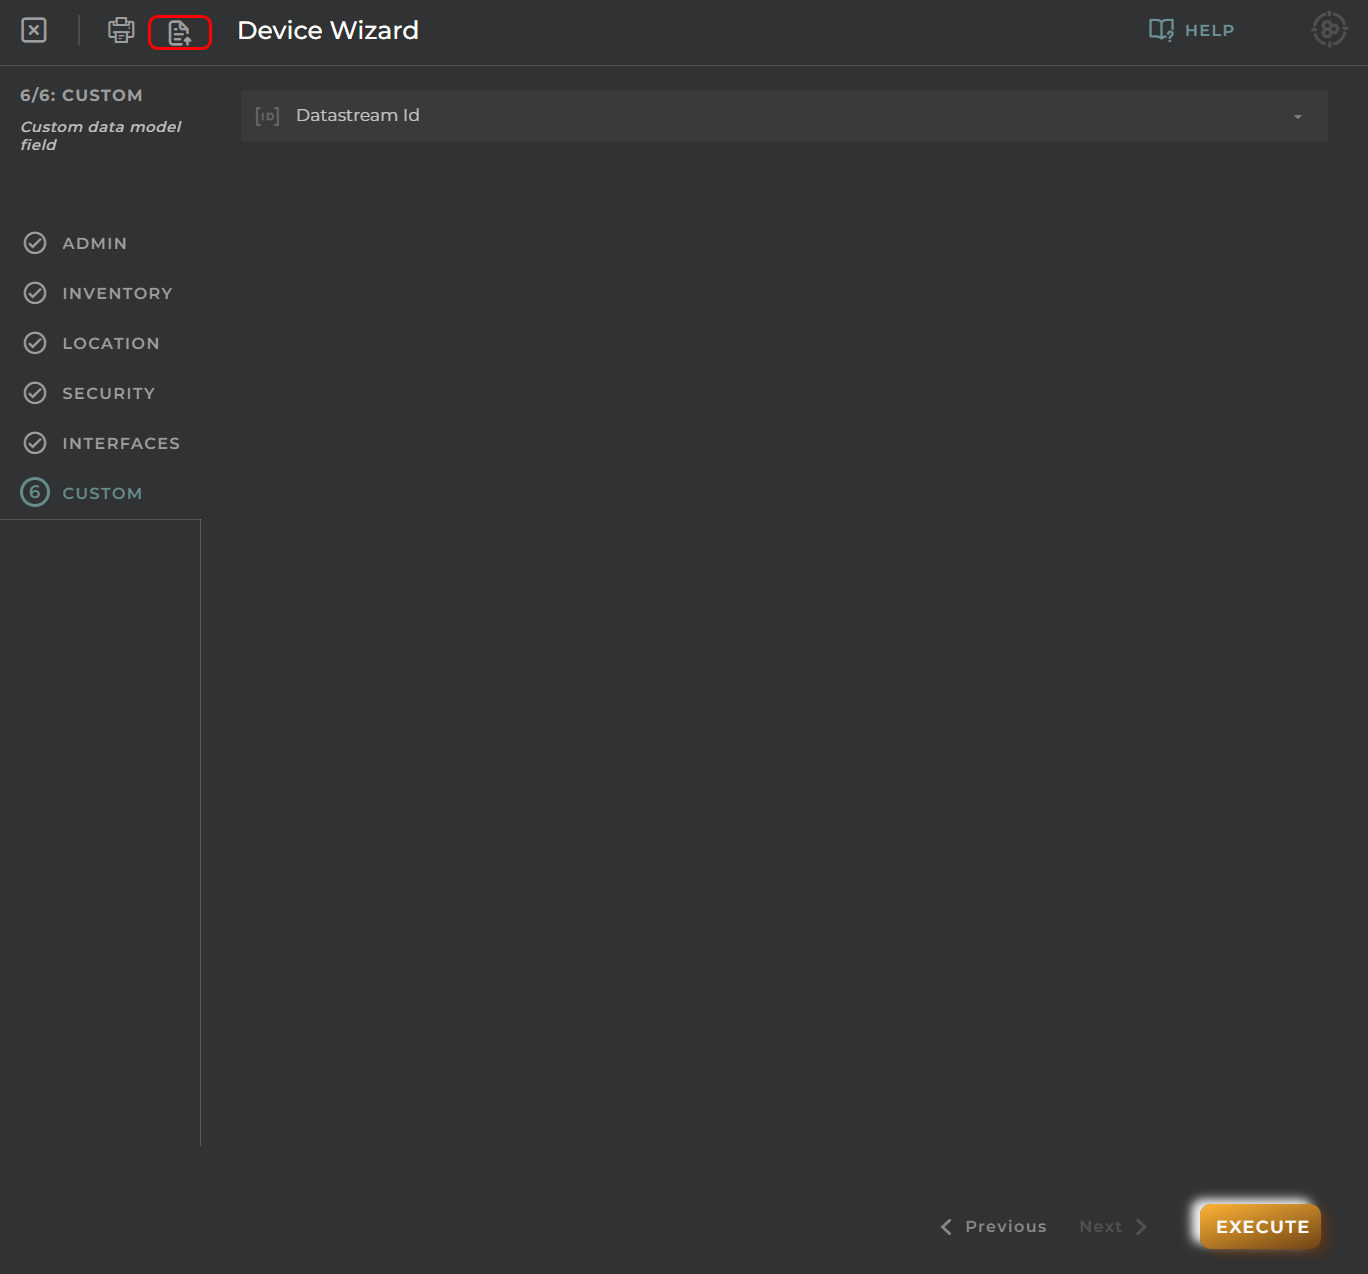
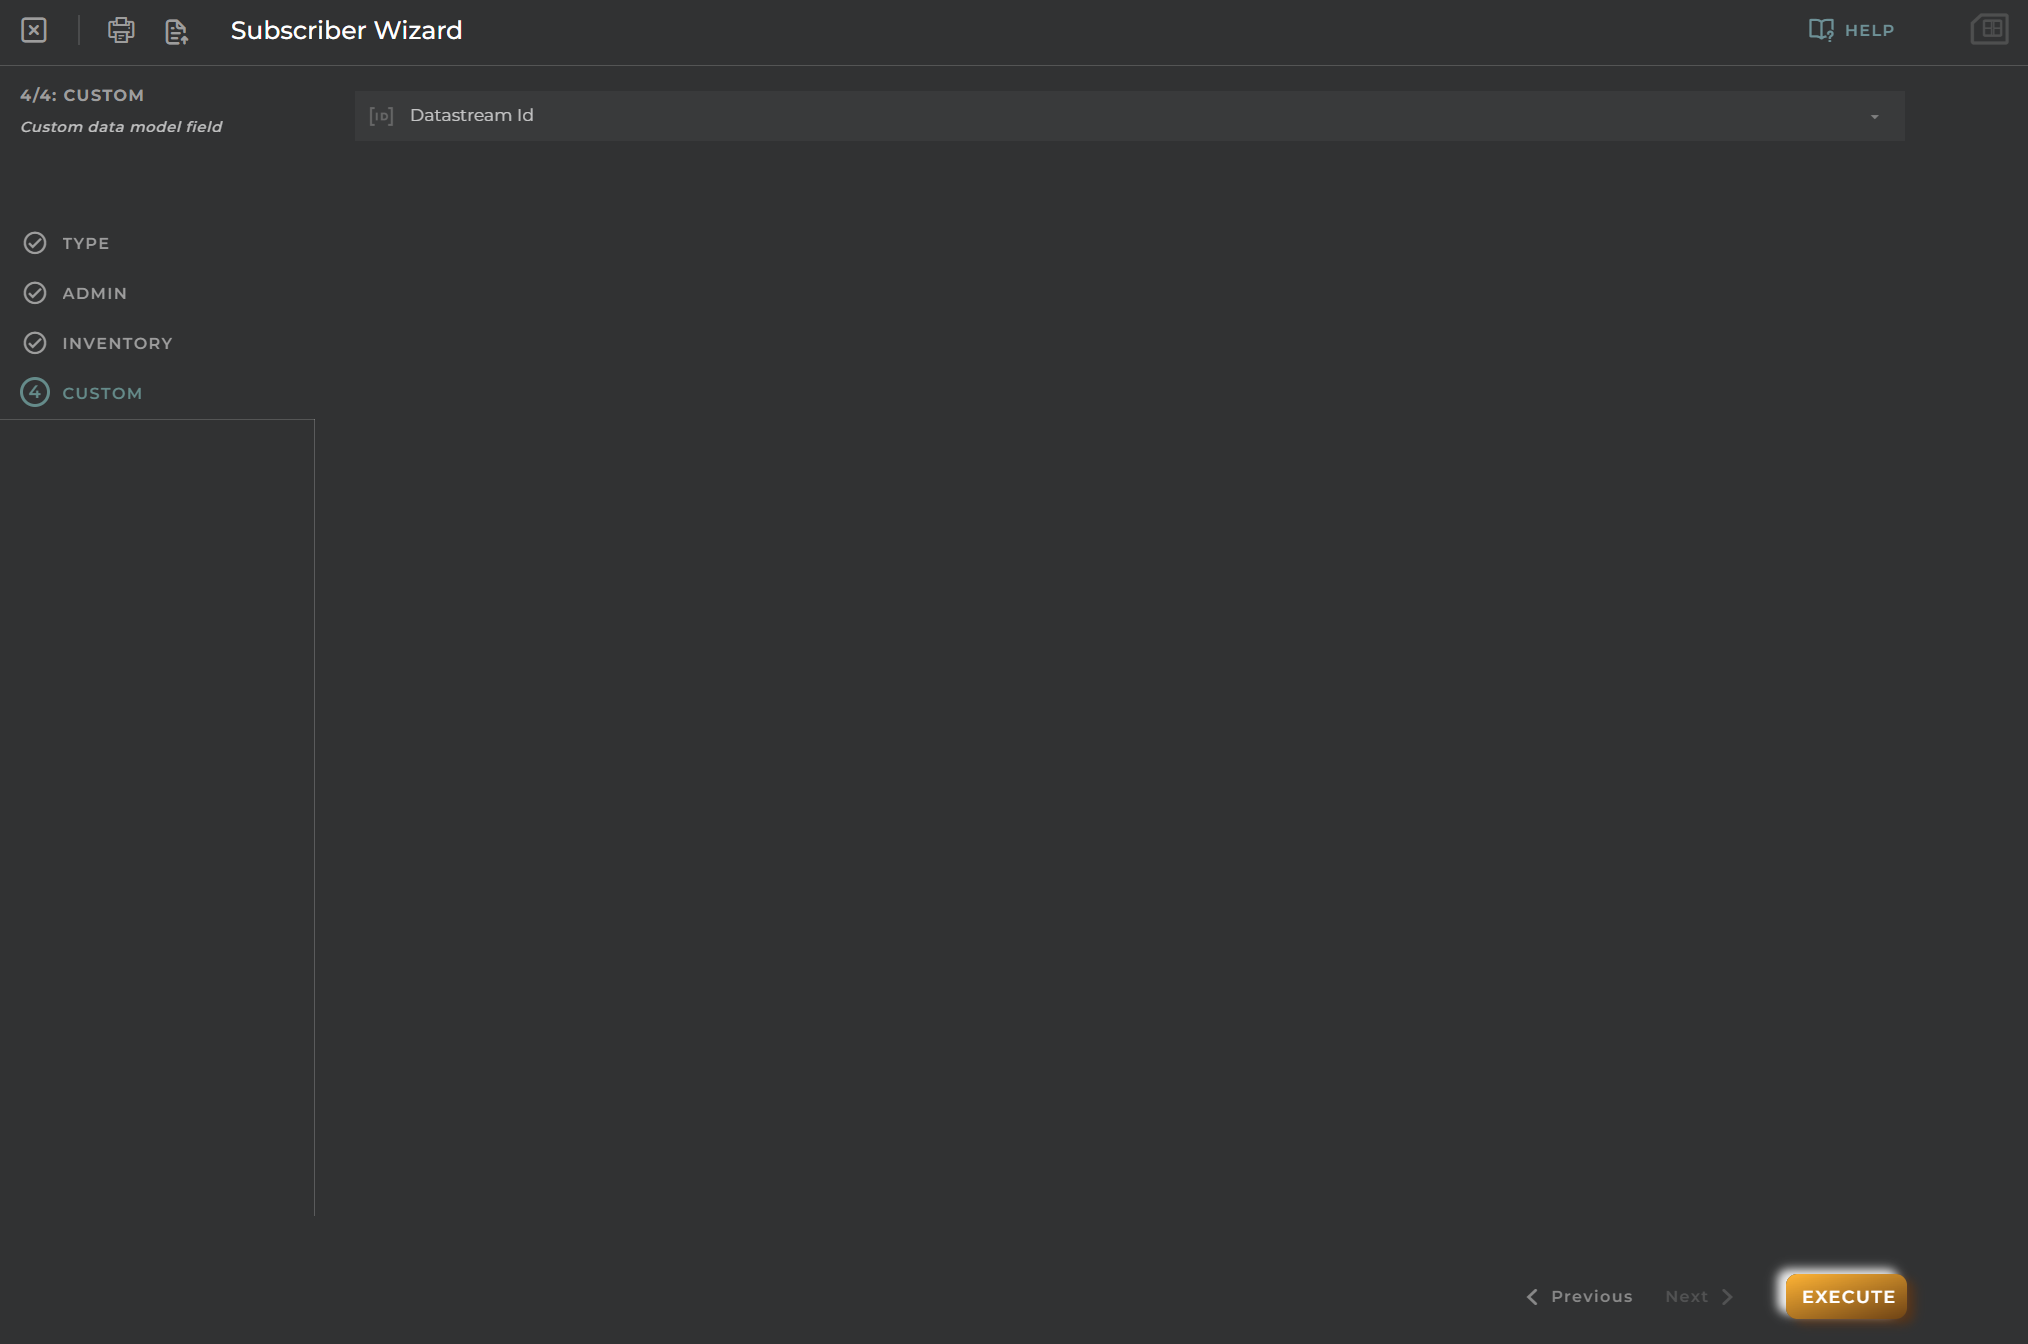
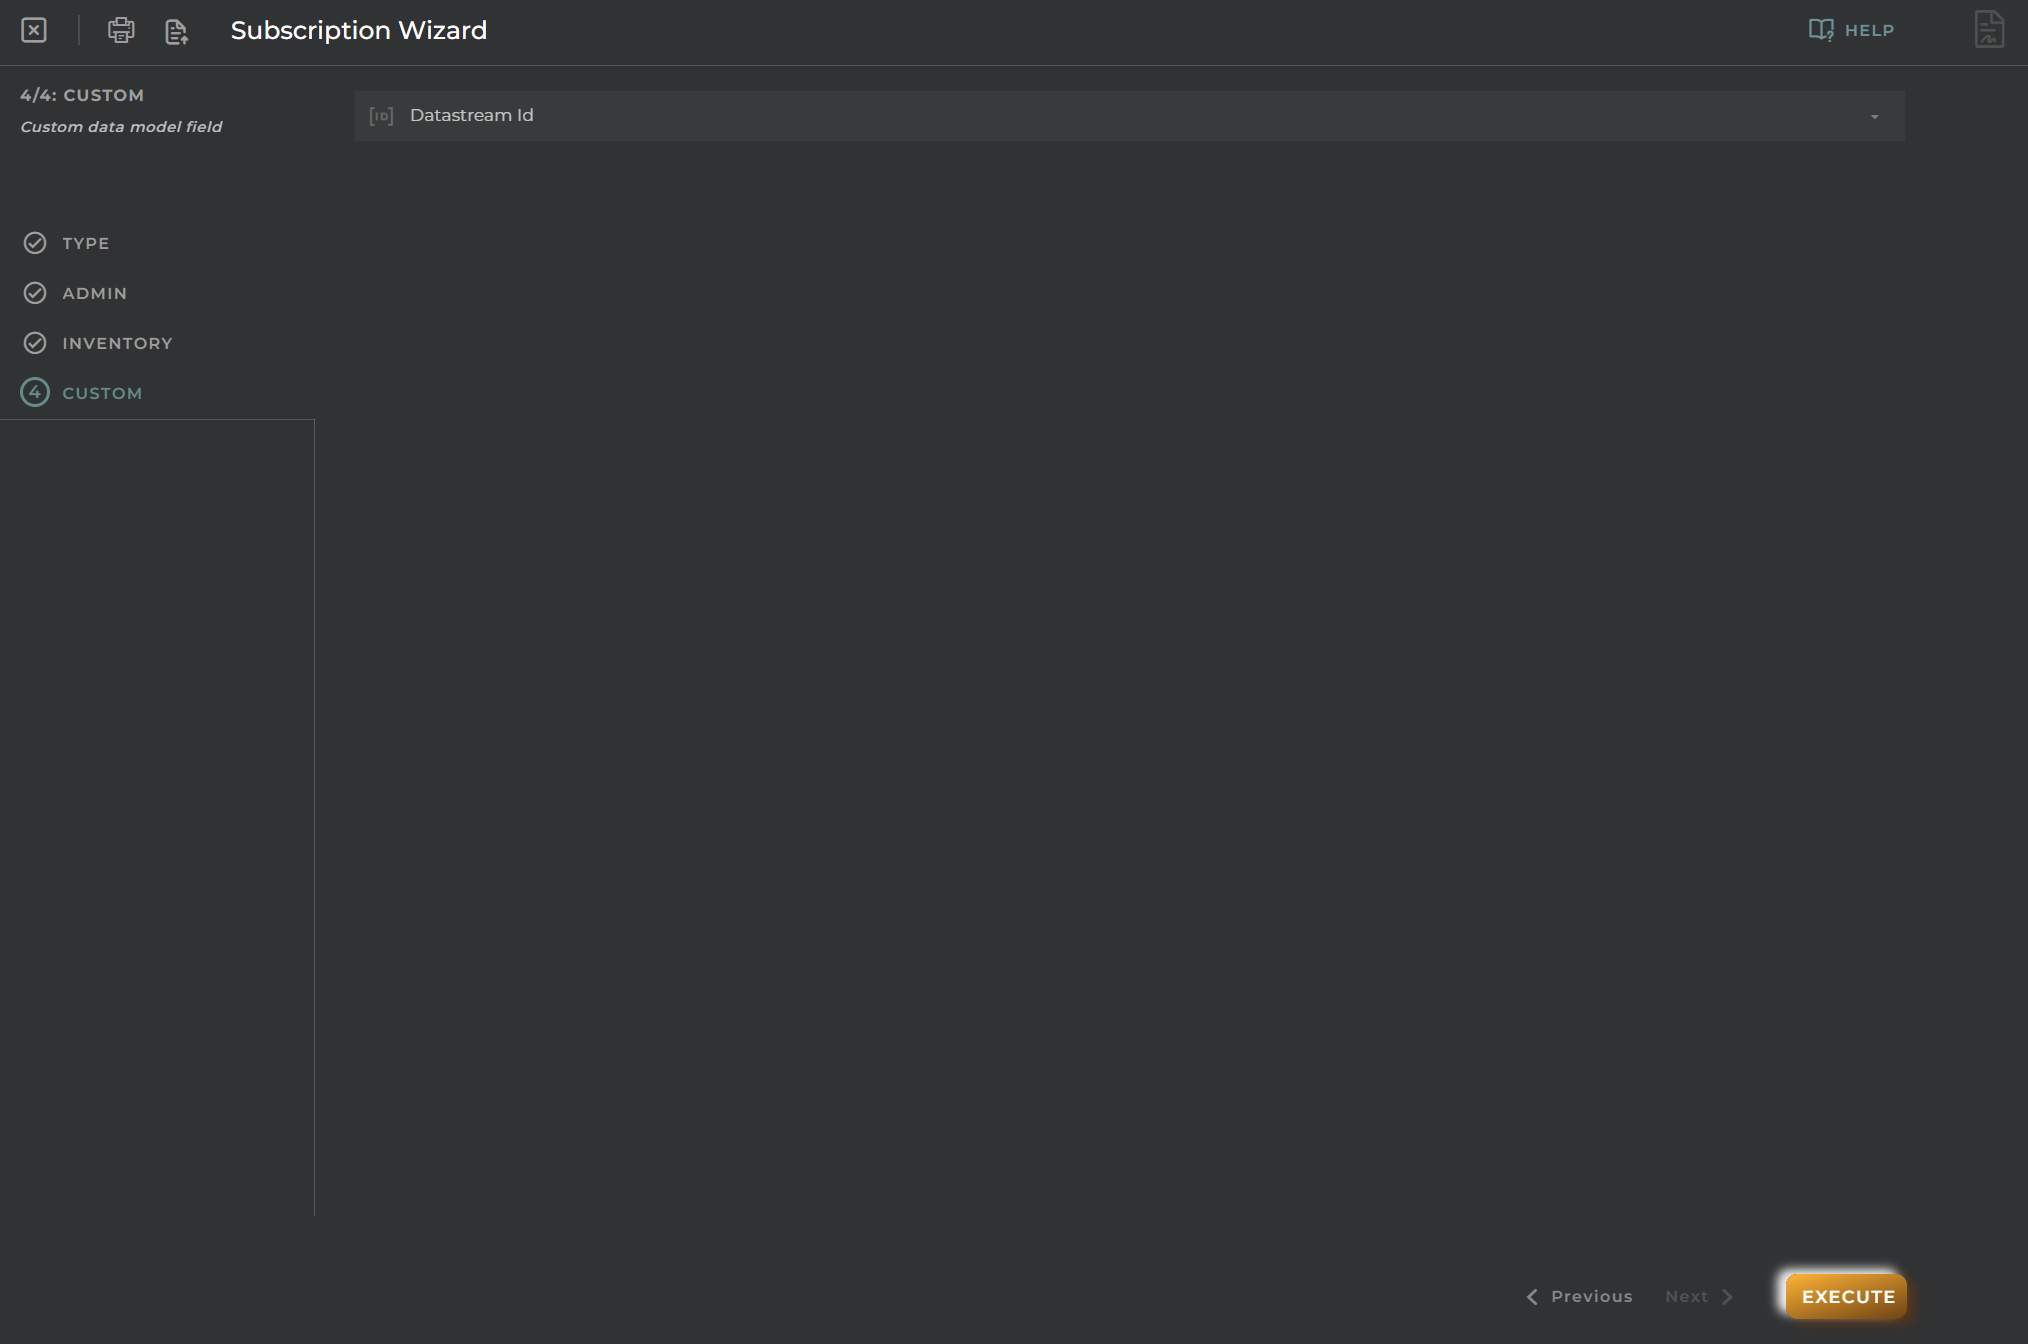
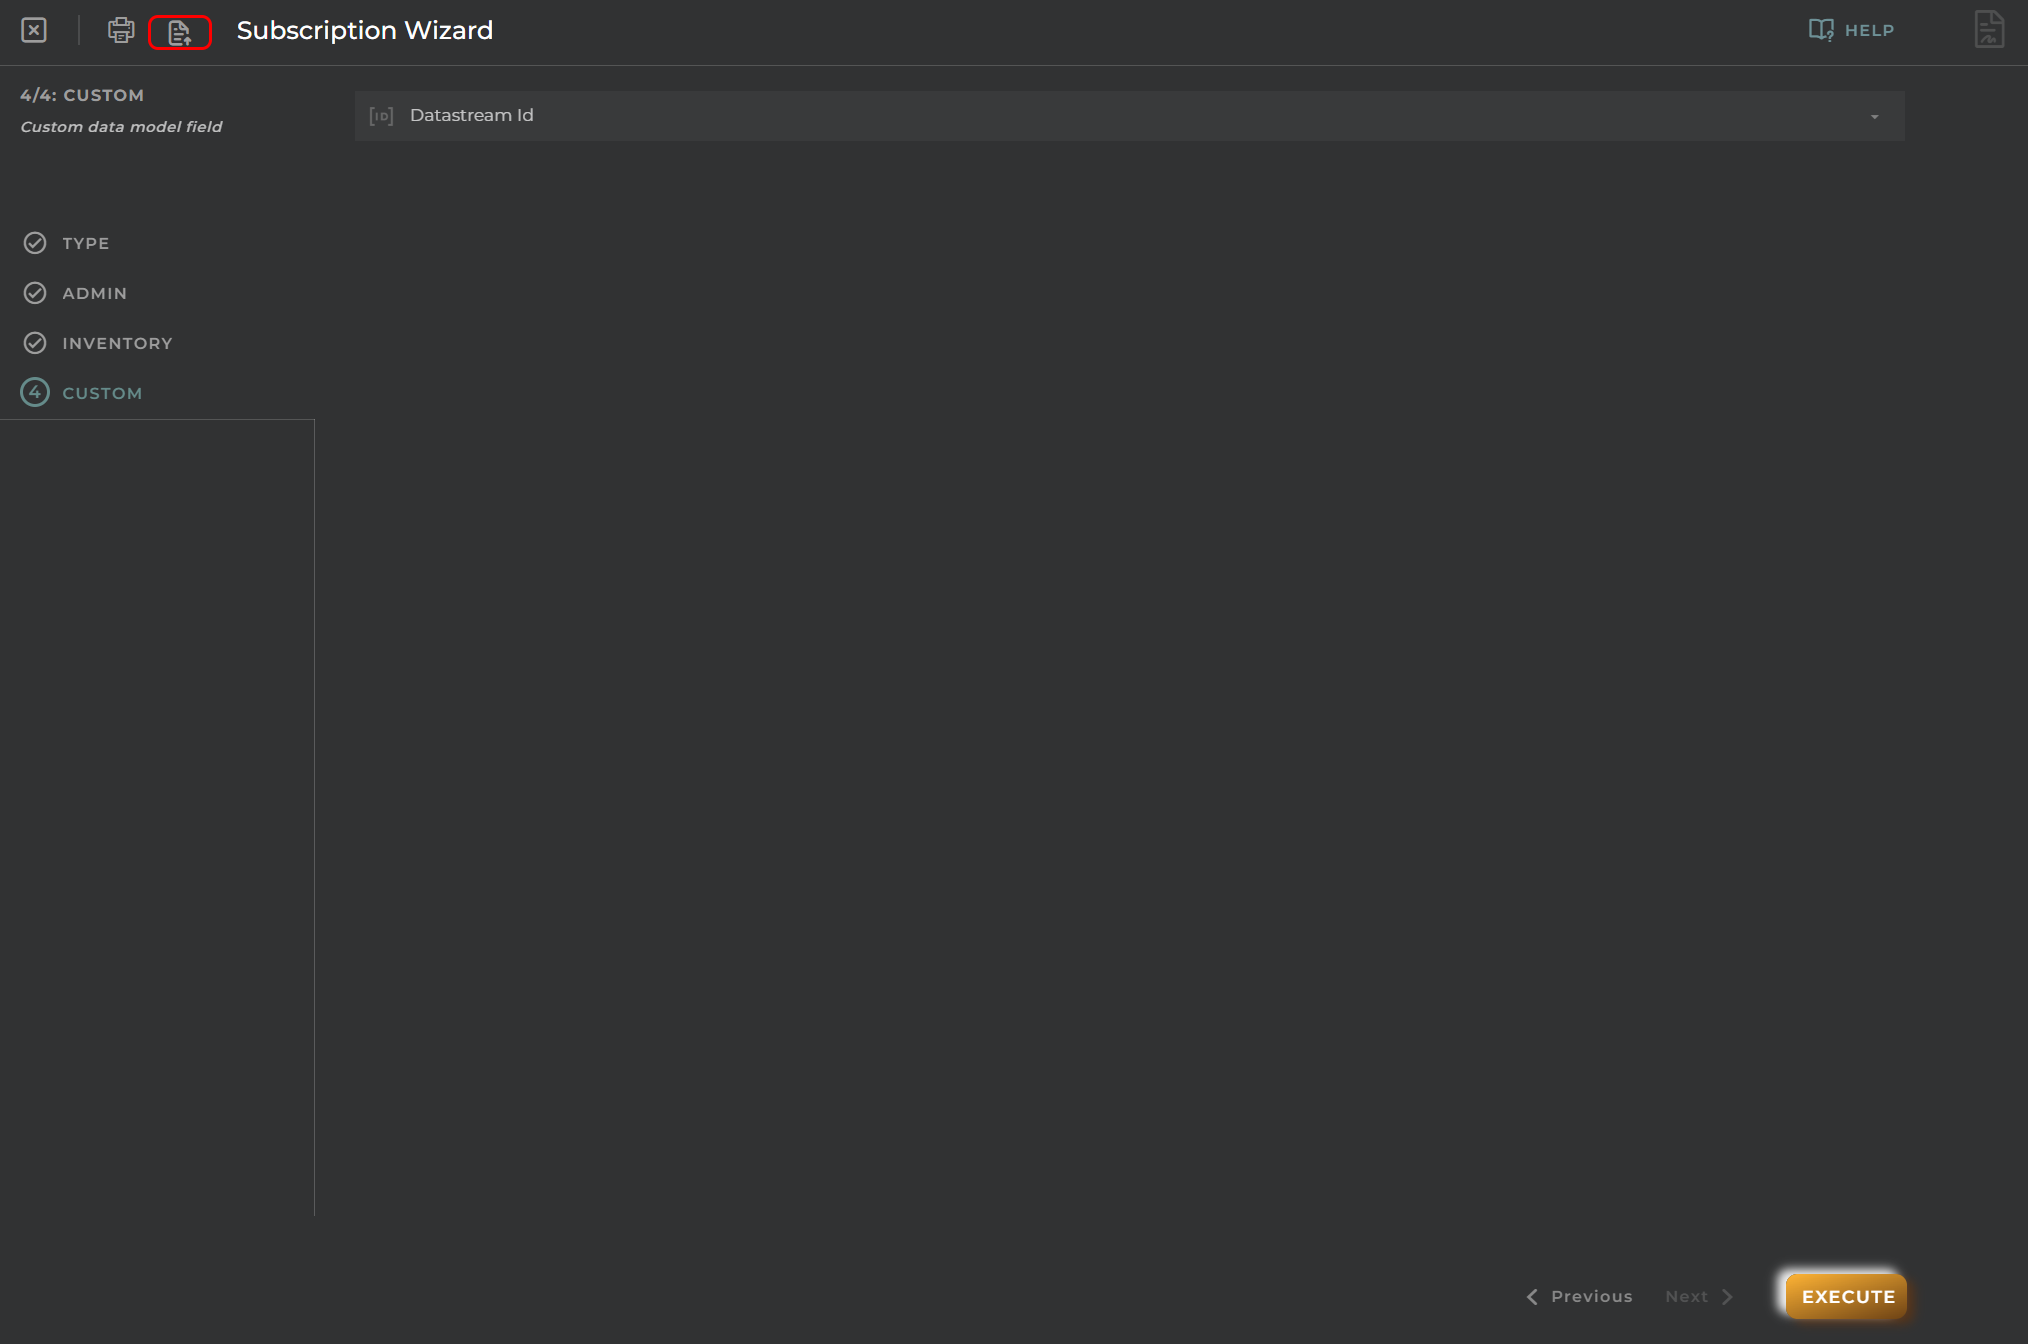
7. Step 6: Custom
This field allows you to fill any other “provision datastream” from the OpenGate standard catalog, or another one that you create in your own datamodel by searching it from the input field
8. Confirm your settings
Click on “Execute” and check the confirmation message
🎉 Your new Entity is created!
Finish your work
Now, to continue this tutorial, you can go to the bottom of this chapter and create all the needed entities contained in the excel files using the wizard, or give a try to the provision functions on the section bellow “Bulk Provisioning”
🚀 When to use this method:
Best for onboarding a small number of entities manually or quick add unitary devices. It is especially useful during prototyping, demos, or for users unfamiliar with API or scripting tools.
📦 Bulk Provisioning
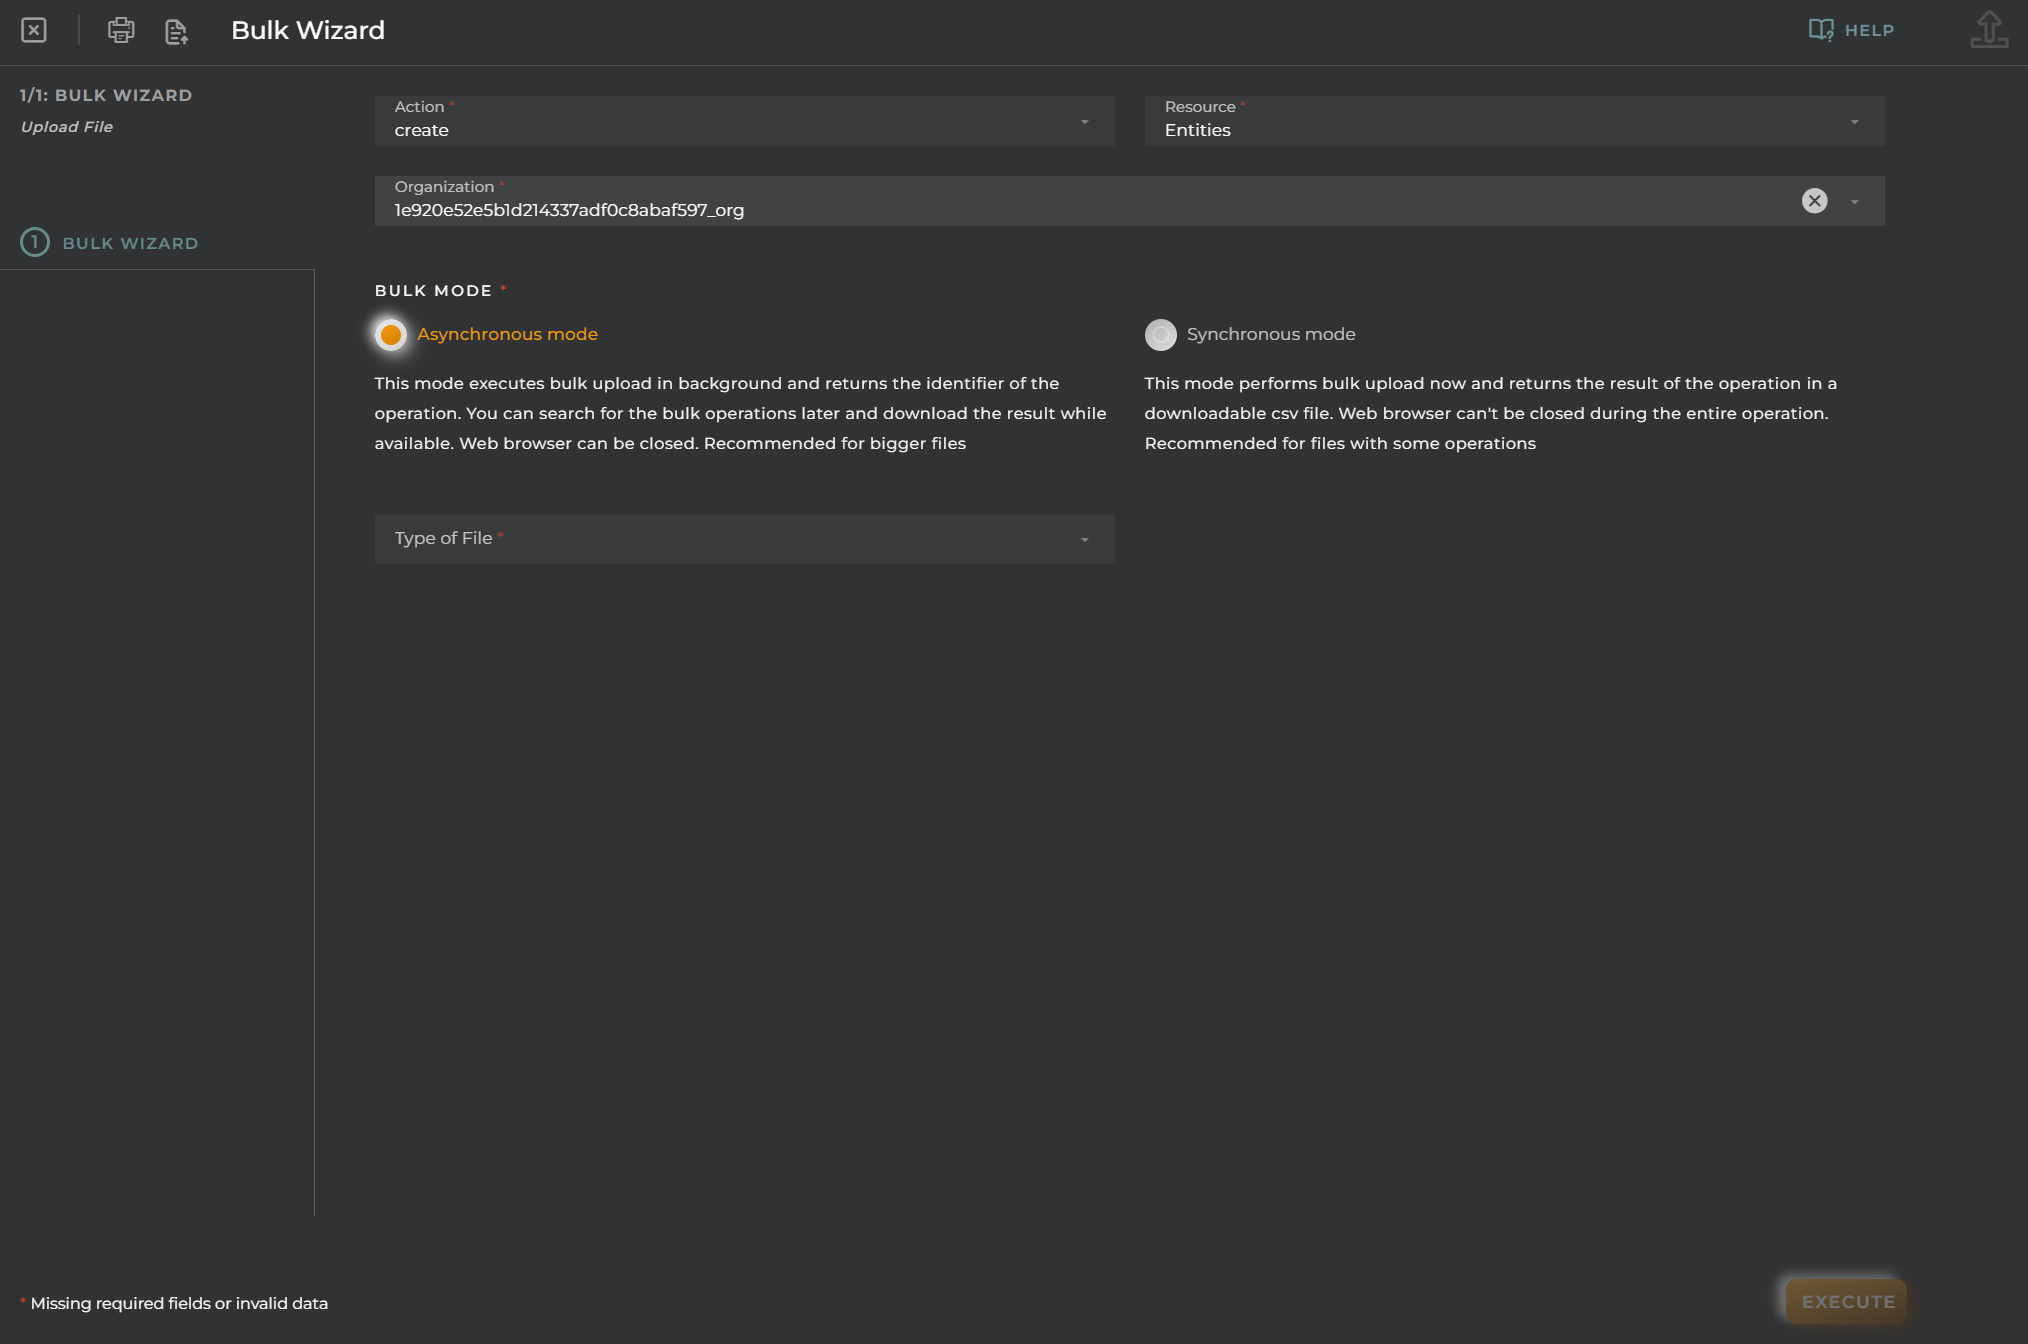
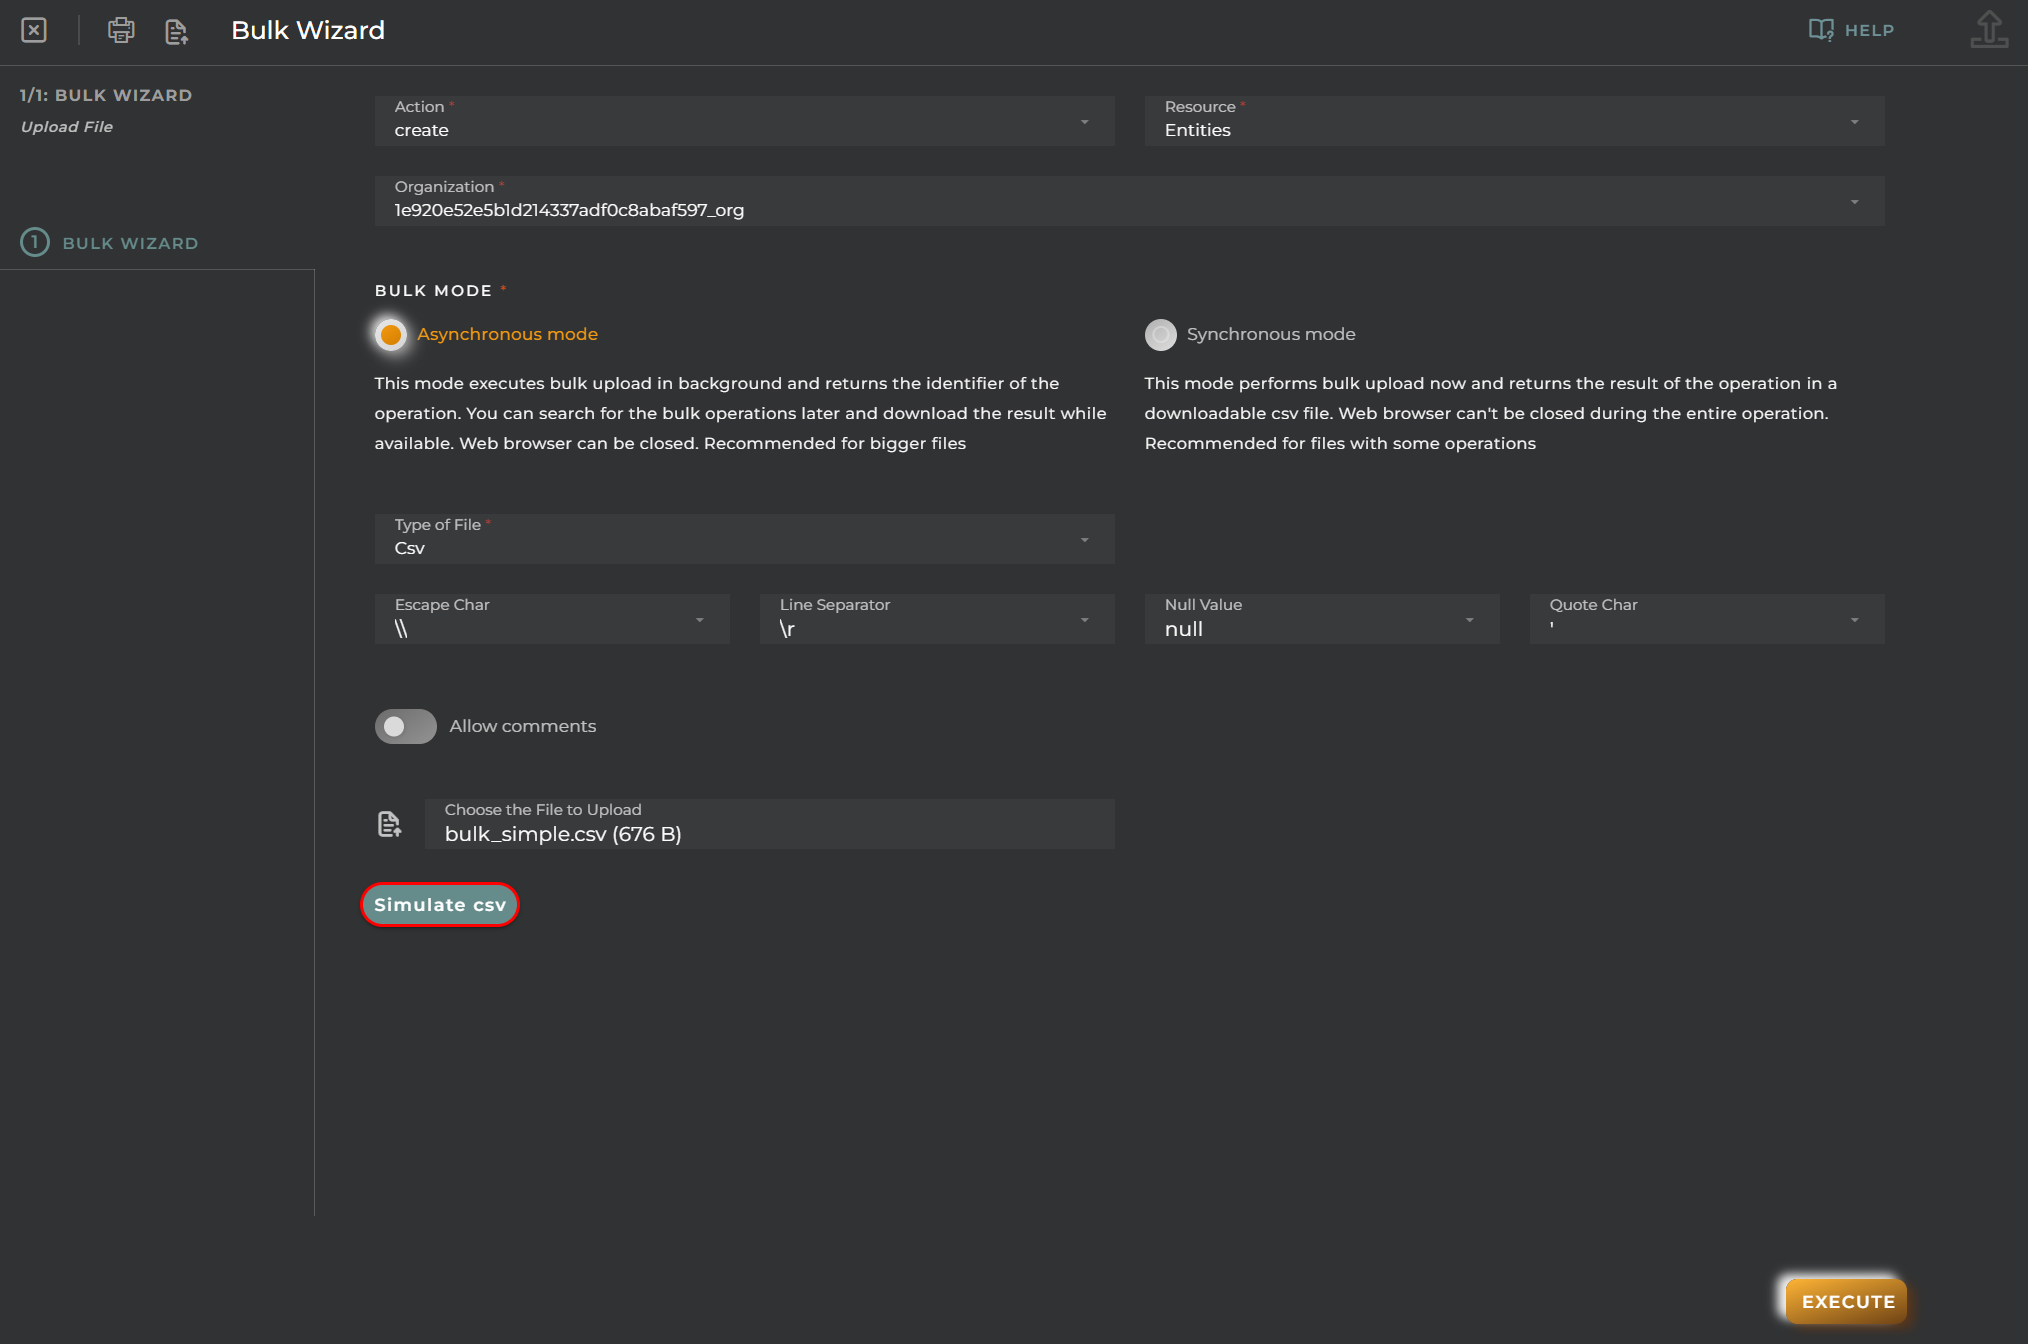
Bulk provisioning enables you to register multiple entities at once via uploaded templates and custom logic. This method uses Provision Functions, which allow you to apply JavaScript logic to Excel files to create, modify, or remove entities in bulk.
The configured JavaScript logic will be applied to each row and the result will be noted in an additional column.
A great feature is that, after the provision function execution, you can download the result file to check what happened with every row, so you can fix the rows with problems if exists and execute again the provision function with this file so only the pending rows will be executed (what a powerful tool! right?)
Let’s use this method to provision some sample entities
1. Open the wizard
Go to “Opengate Management > Provision functions”, then click on “+ Create Provision Function” and the wizard start
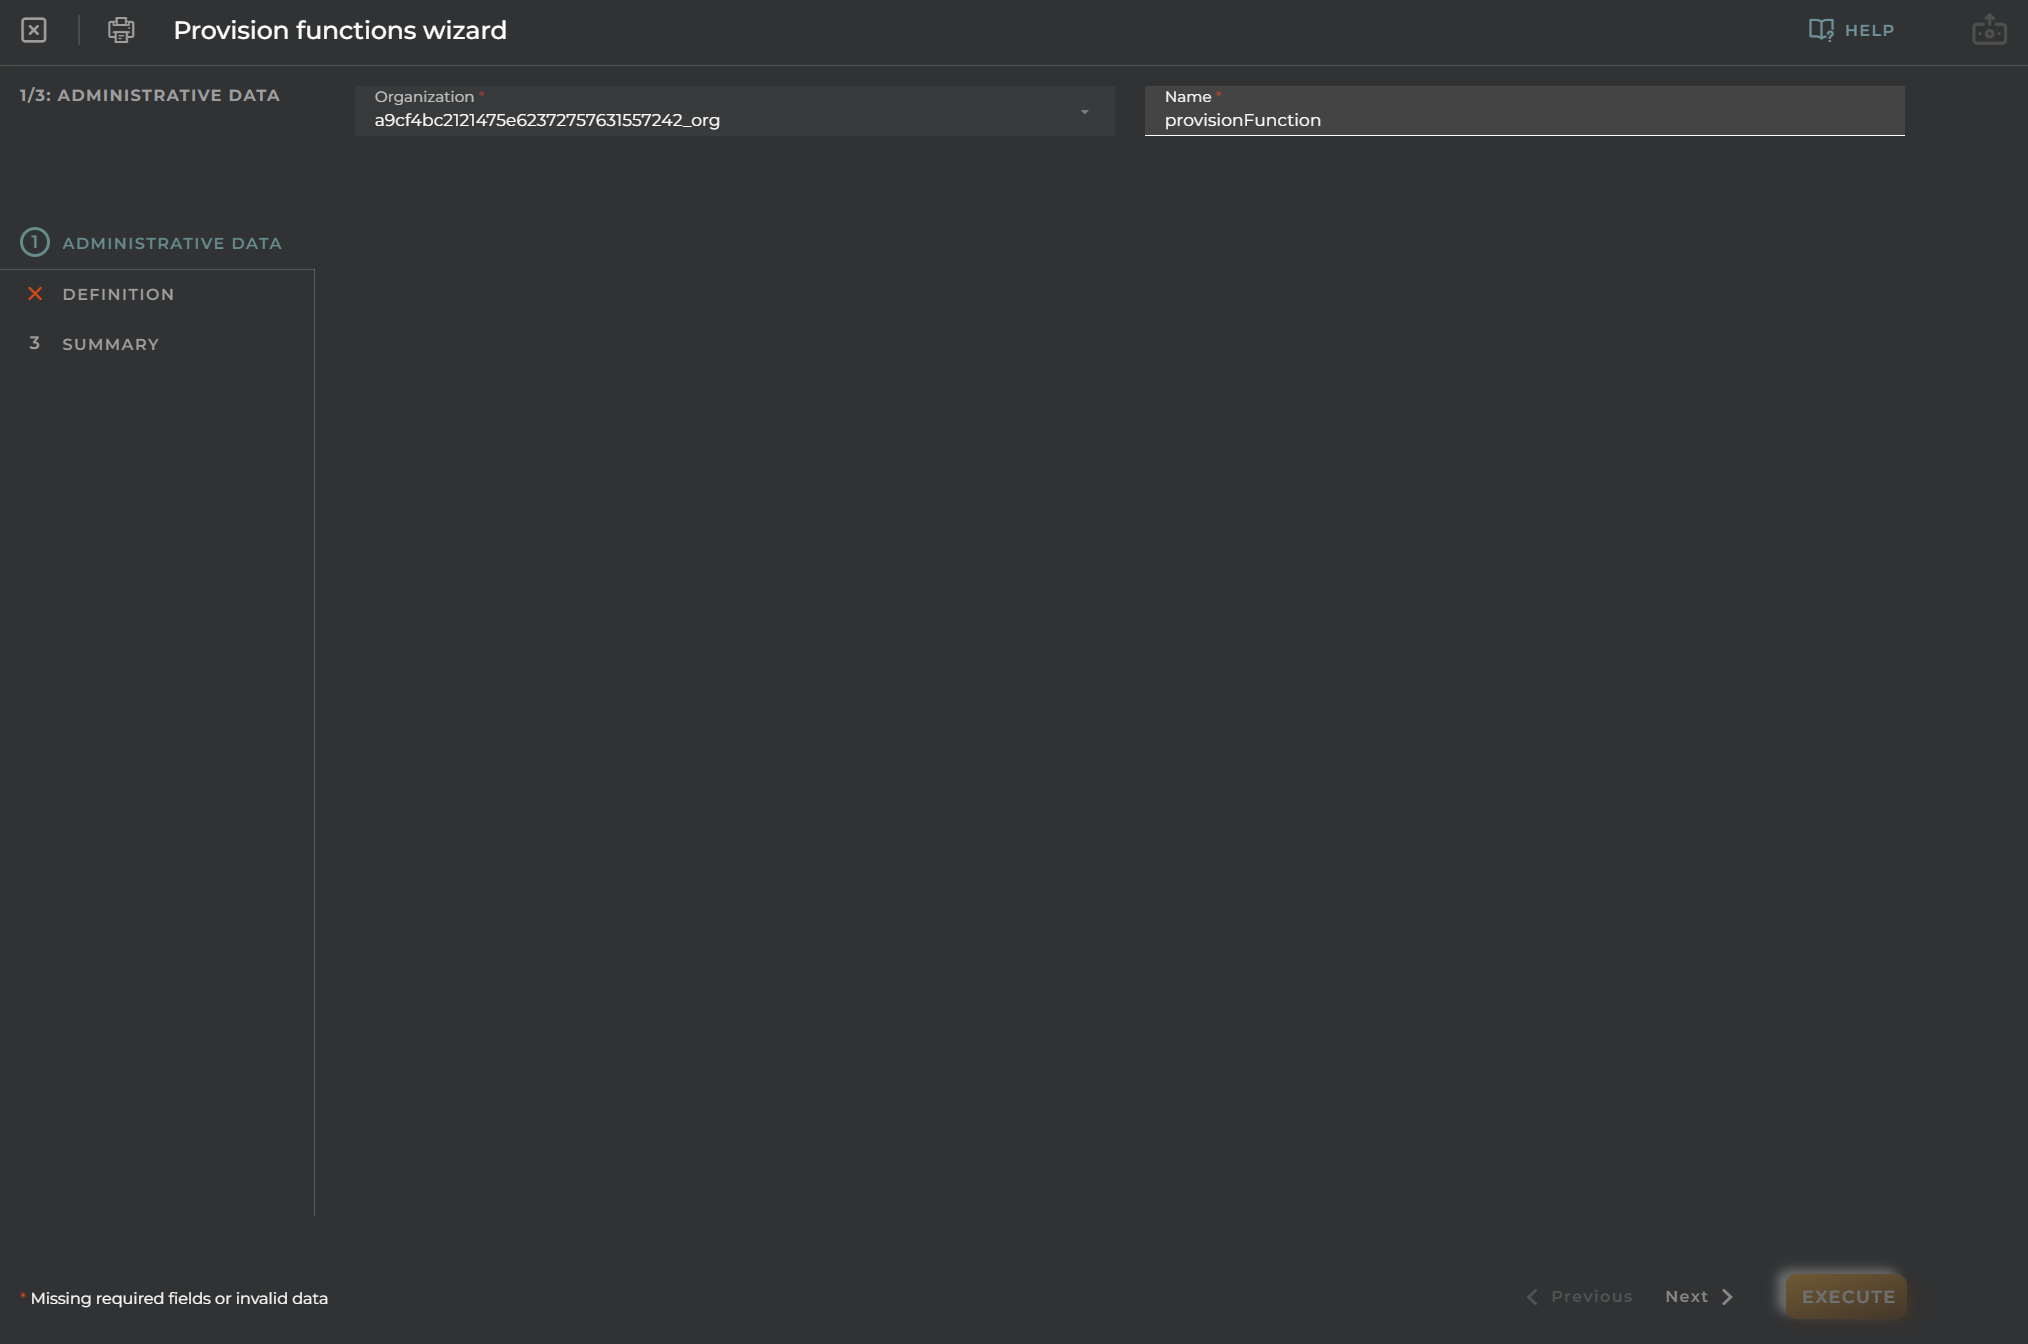
2. Step 1: Administration info
Fill the Name of the Provision Function. For this tutorial, we are going to configure our provision function to create rooms as assets for our warehouse from an excel file, so we call it CreateRooms. This will create as many assets as rows contained in the Excel file during the provision function execution.
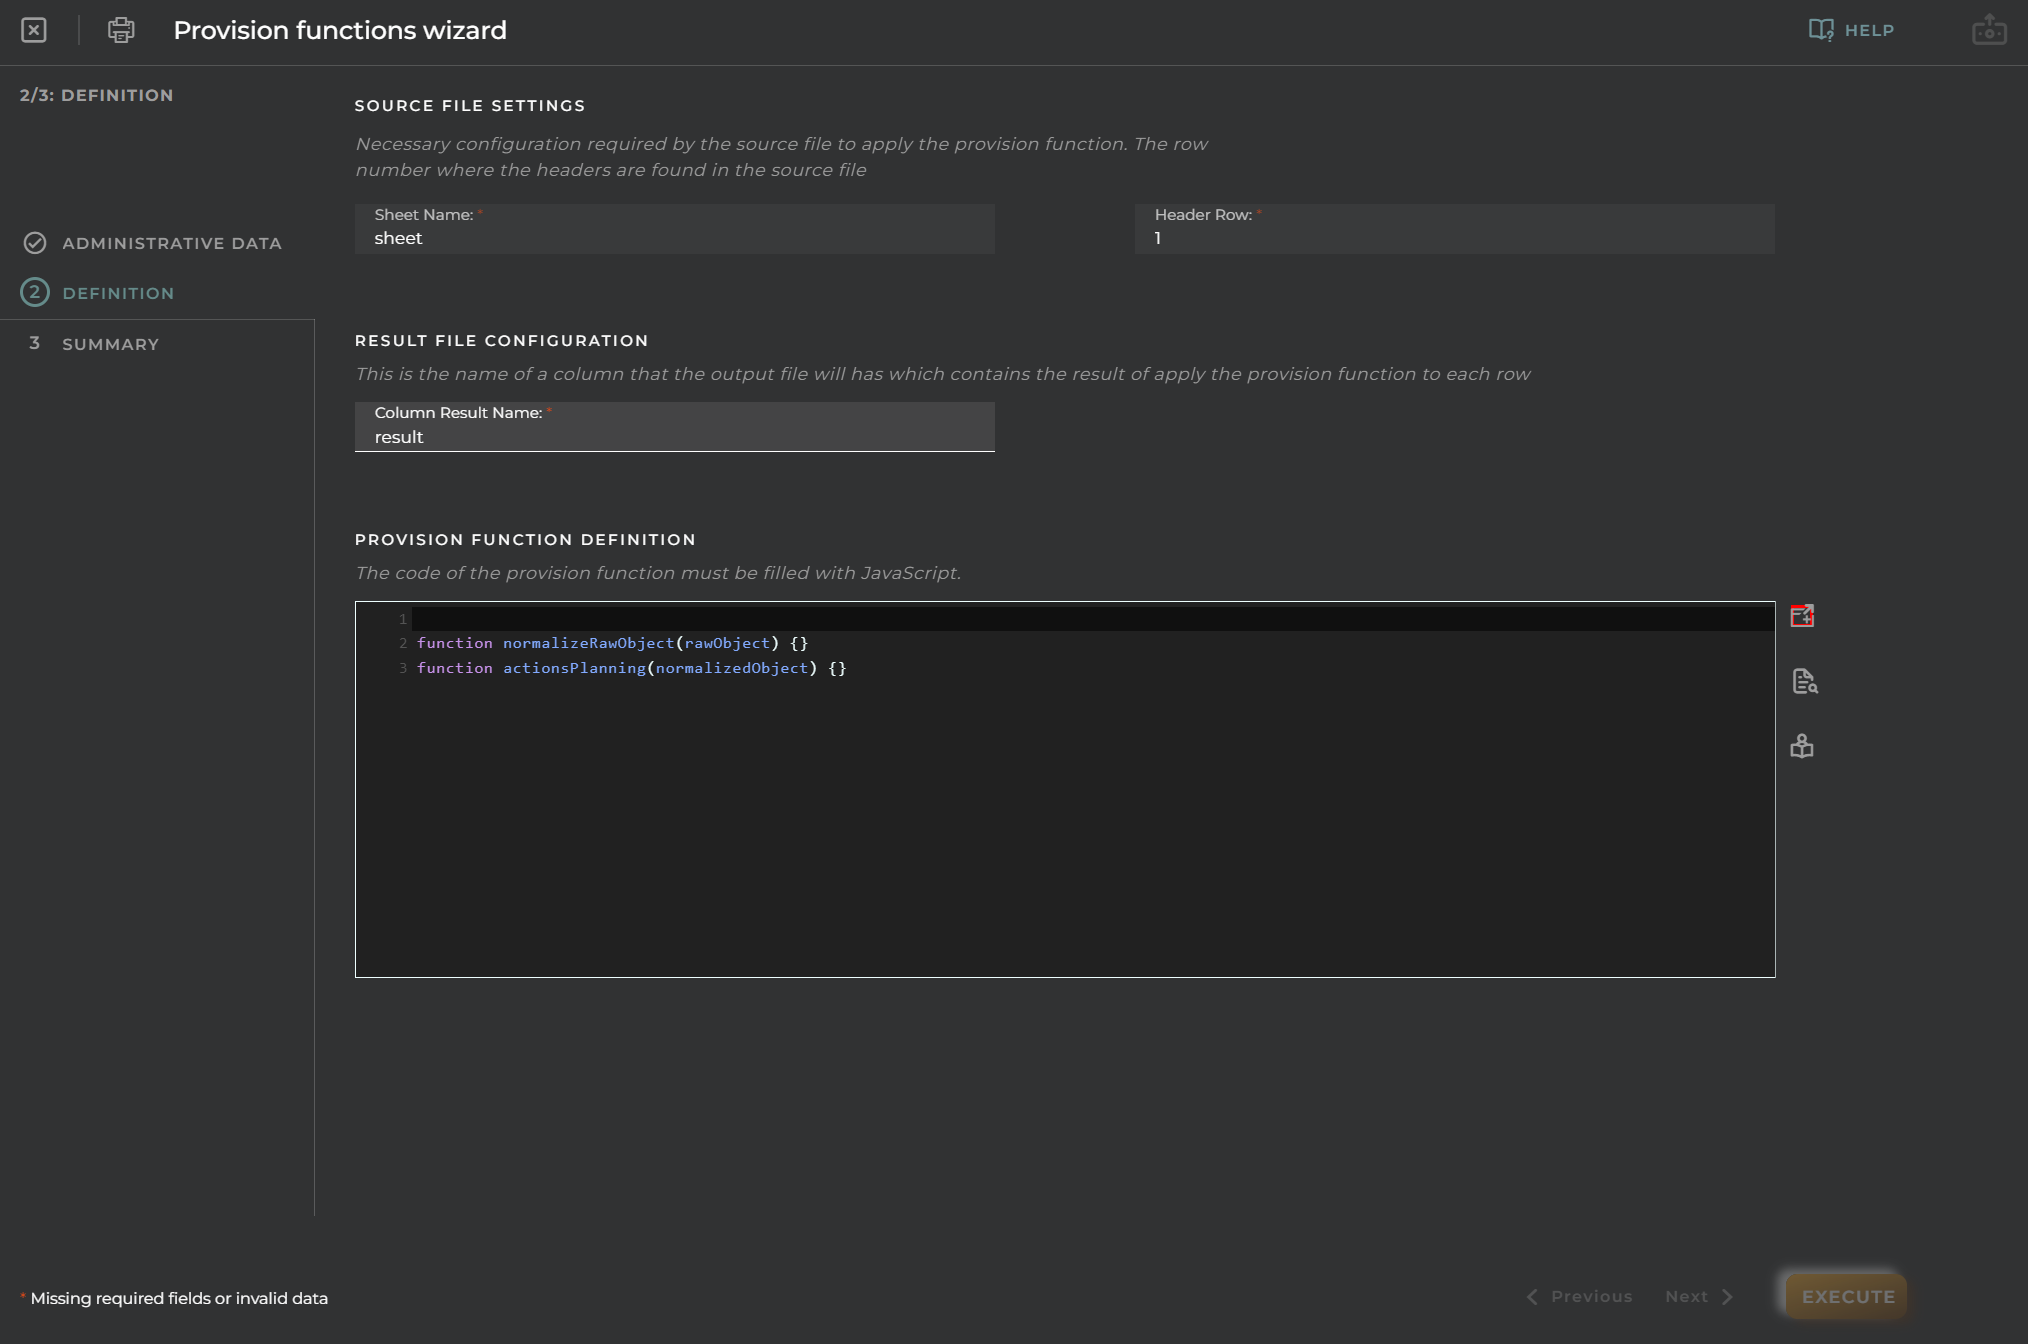
3. Step 2: configure your provision function
Now we are going to create our provision function to create assets…
The OpenGate Provision Functions allows you to use javascript to manipulate the excel file and to do whatever you need during the provision function execution.
The parameters you need to indicate are:
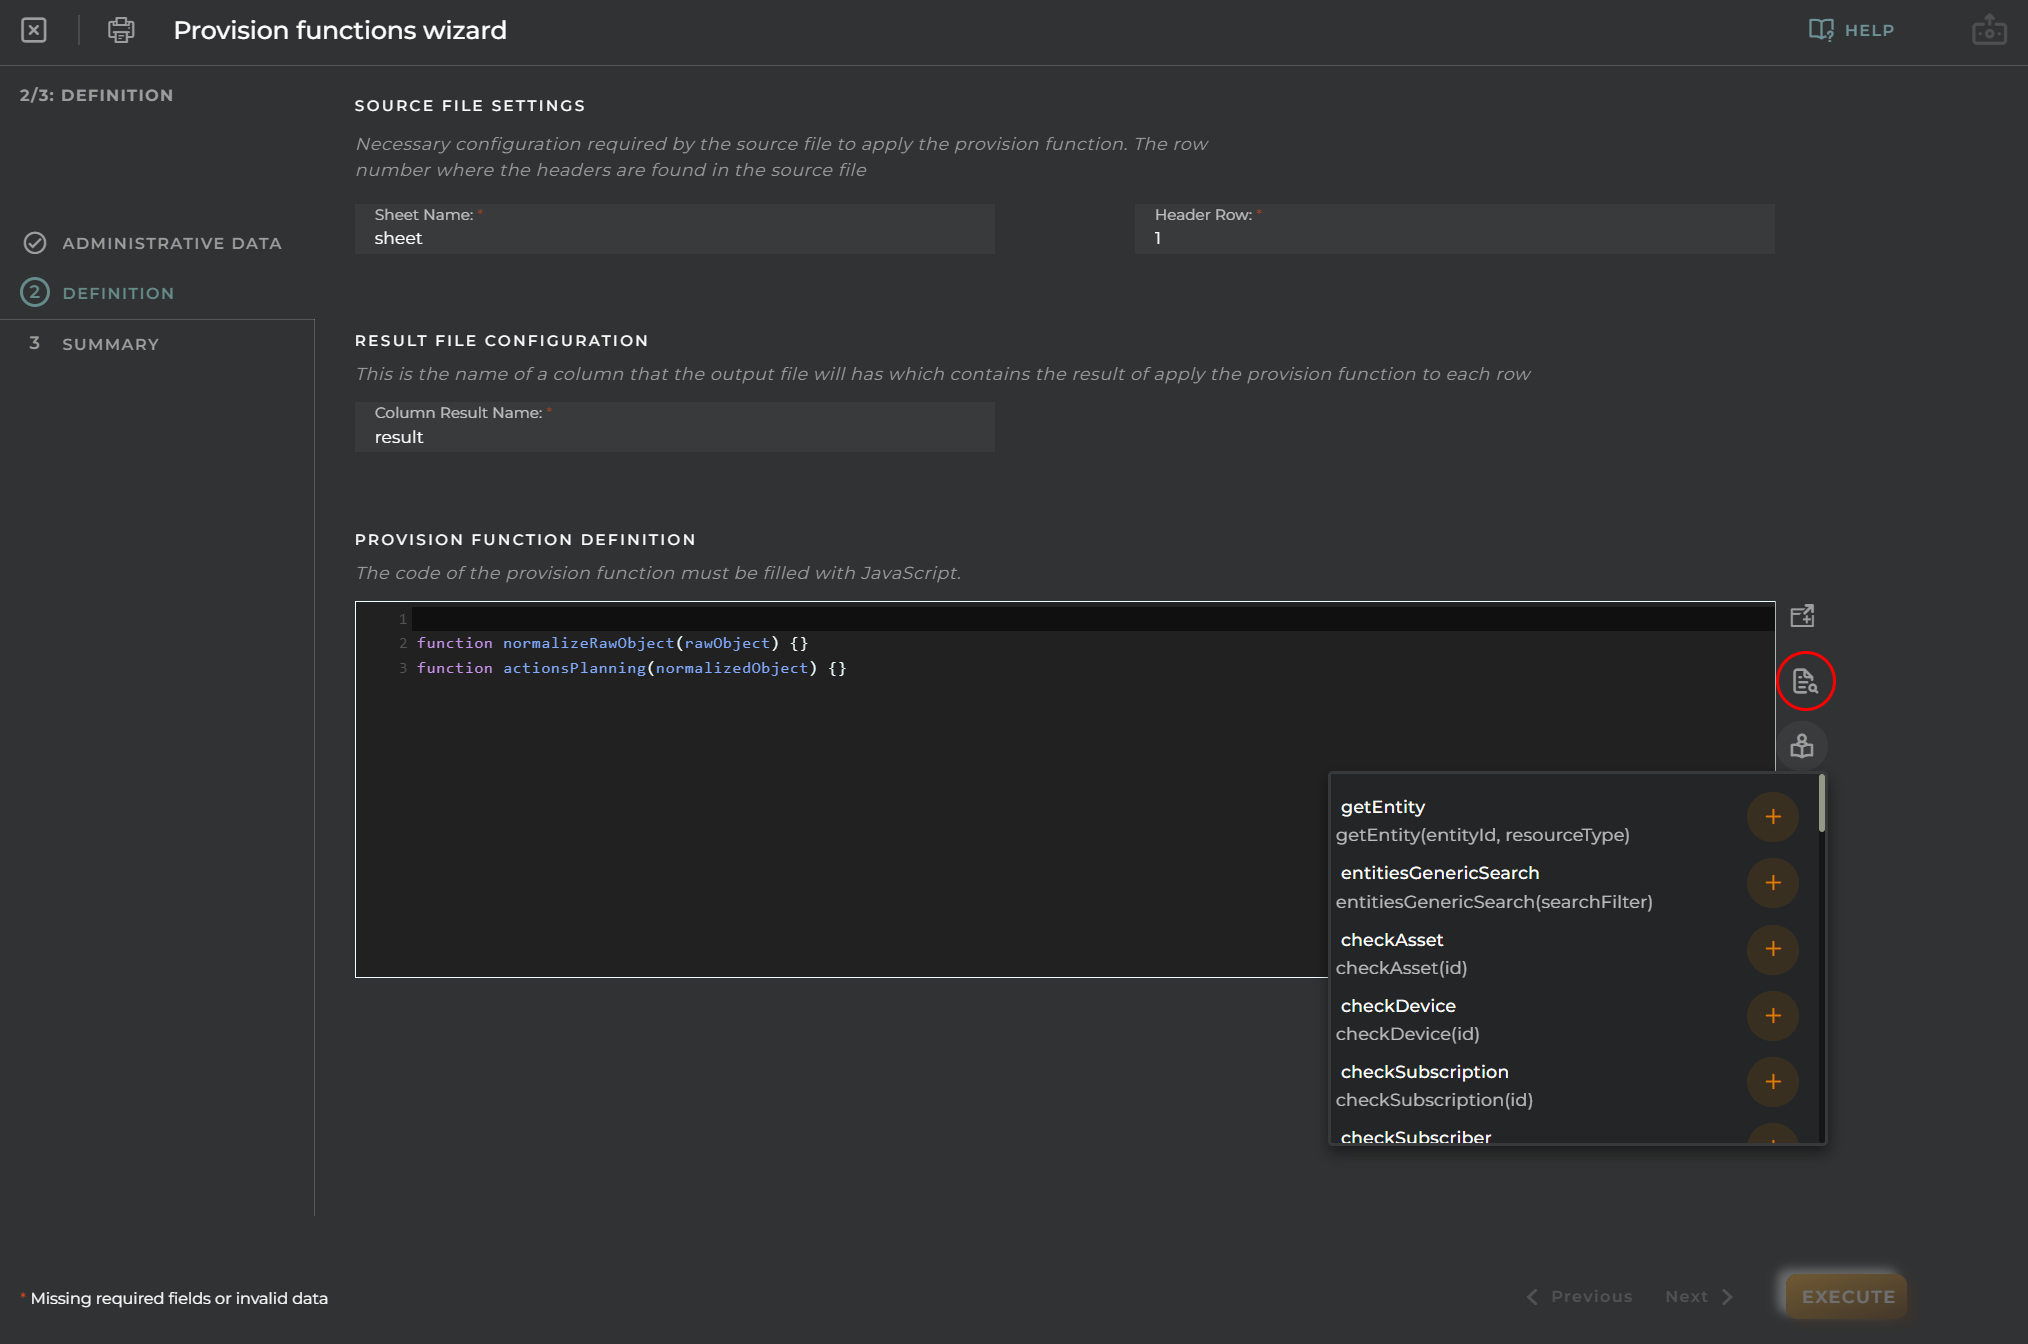
Source file settings: “Sheet Name” of the file, and “Header row” number fo find the data to be used during the provision proccess. Use: Sheet1 and 1
Result file configuration: This is the name of the column where the result of each row will be shown.
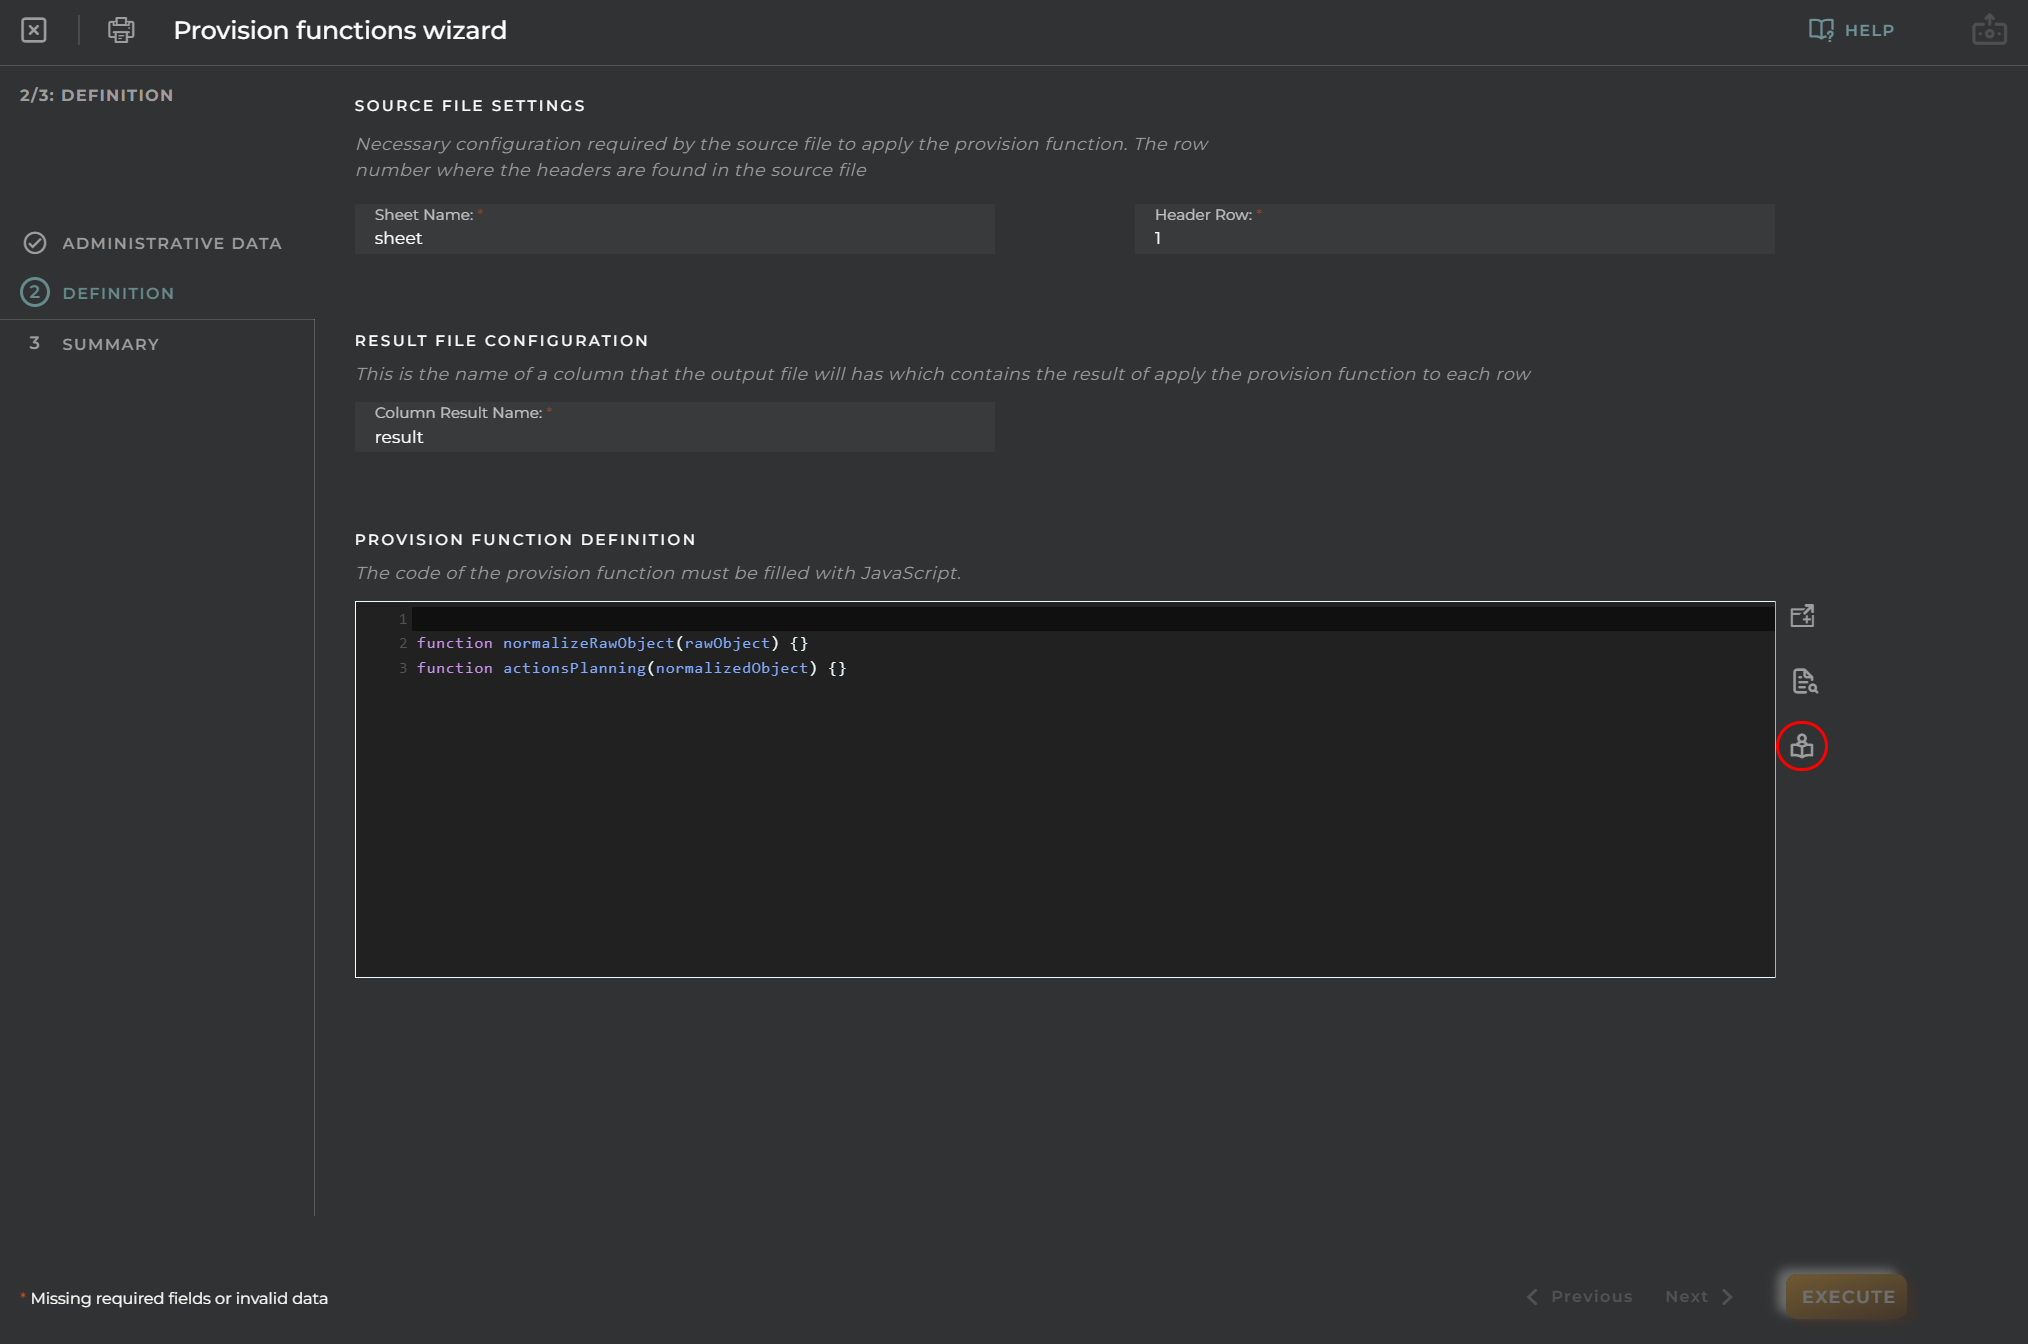
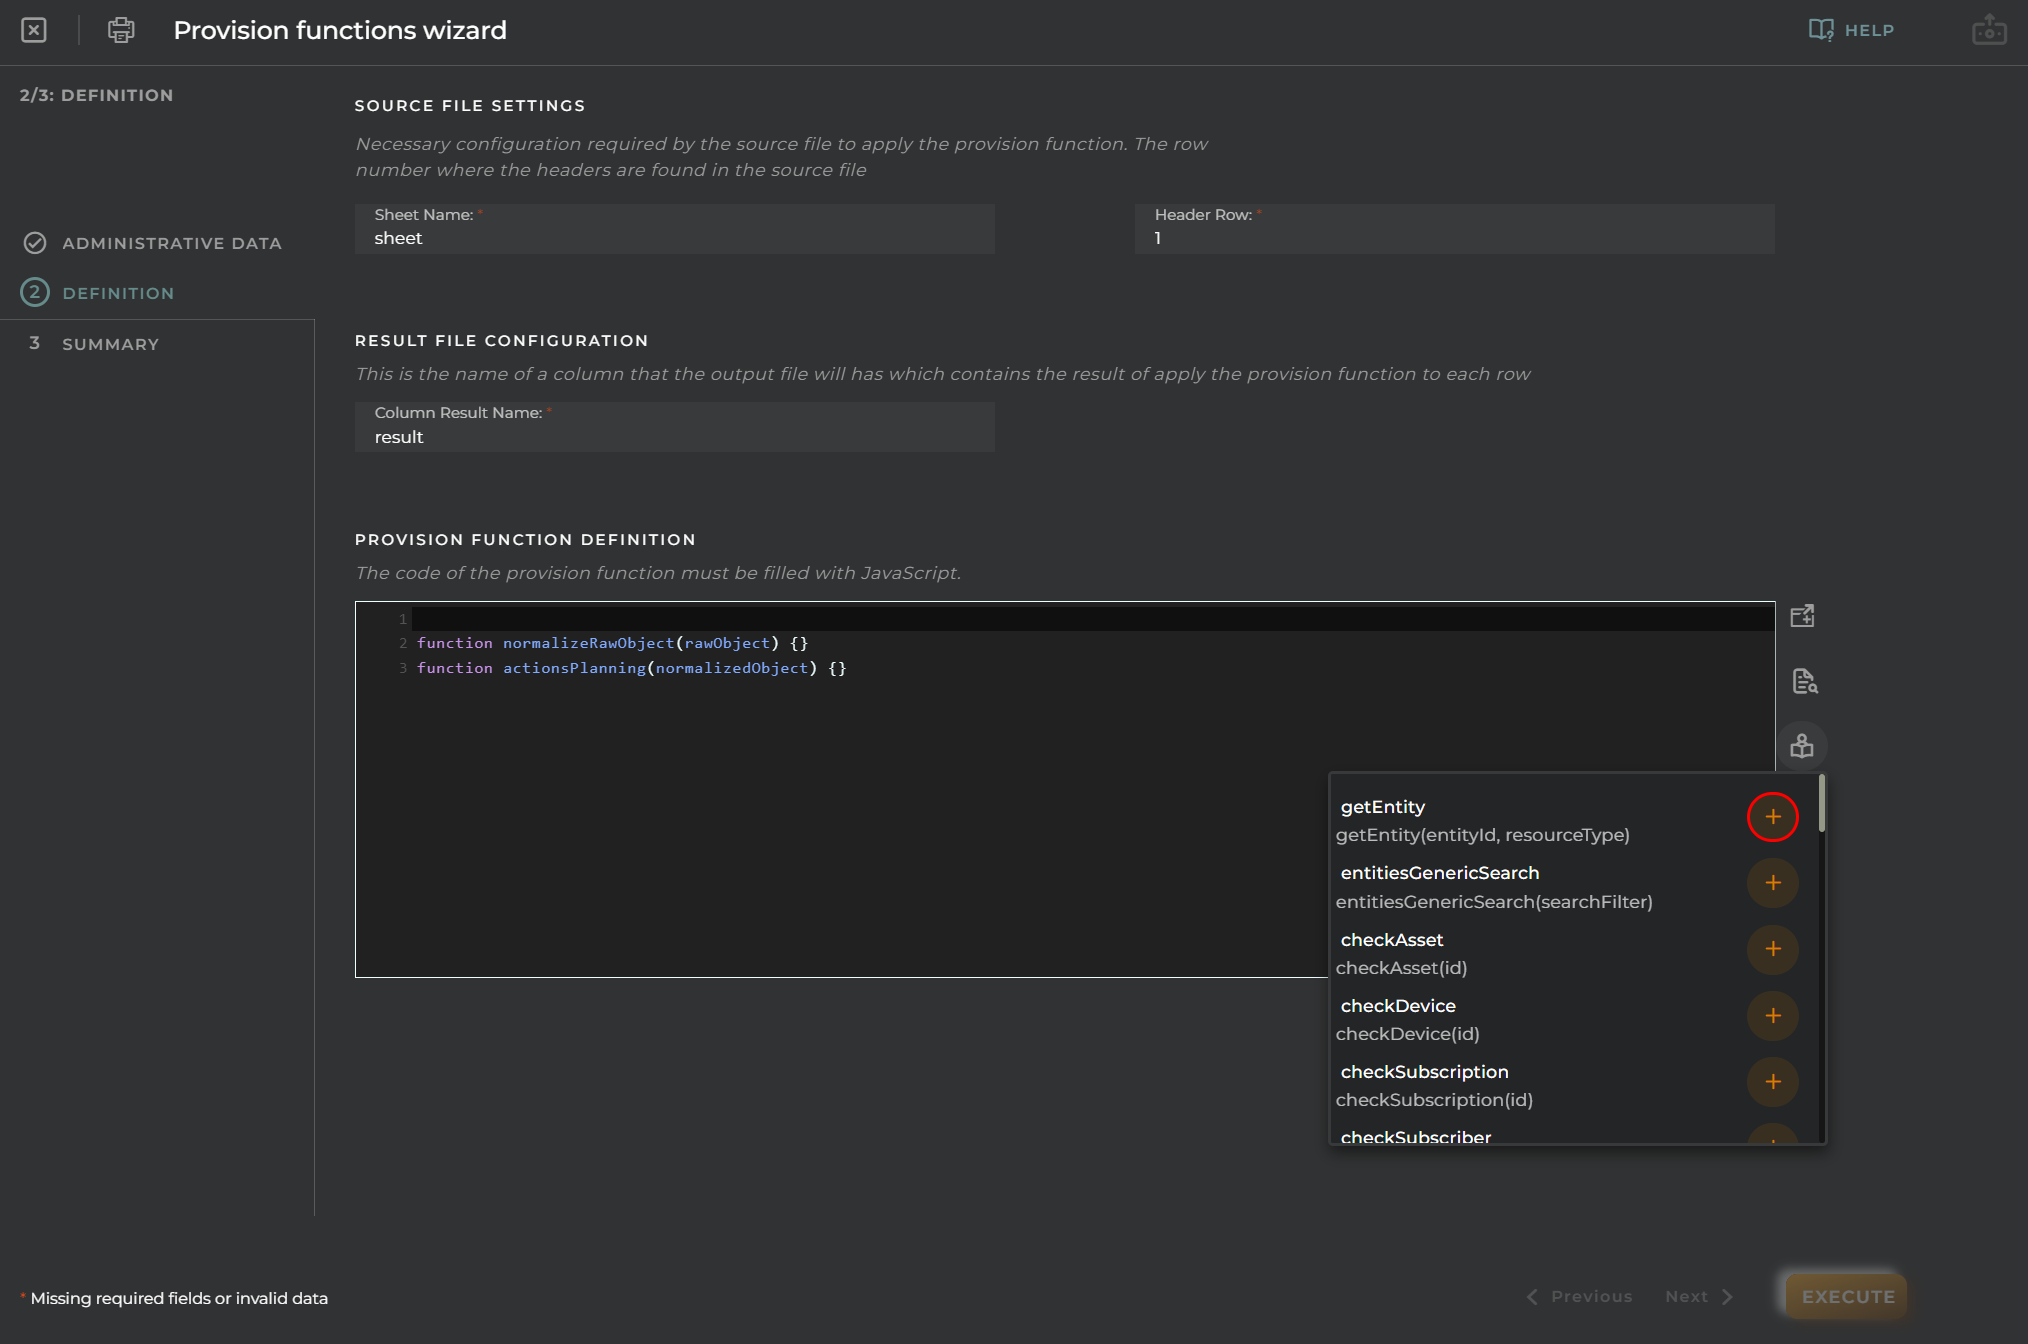
Provision function definition: The javascript code to execute within the provision funtion.
To this tutorial, we prepare the code for this provision function that creates rooms as assets, so you can download it and test this functionality:
Copy the following JavaScript and paste into the code box:
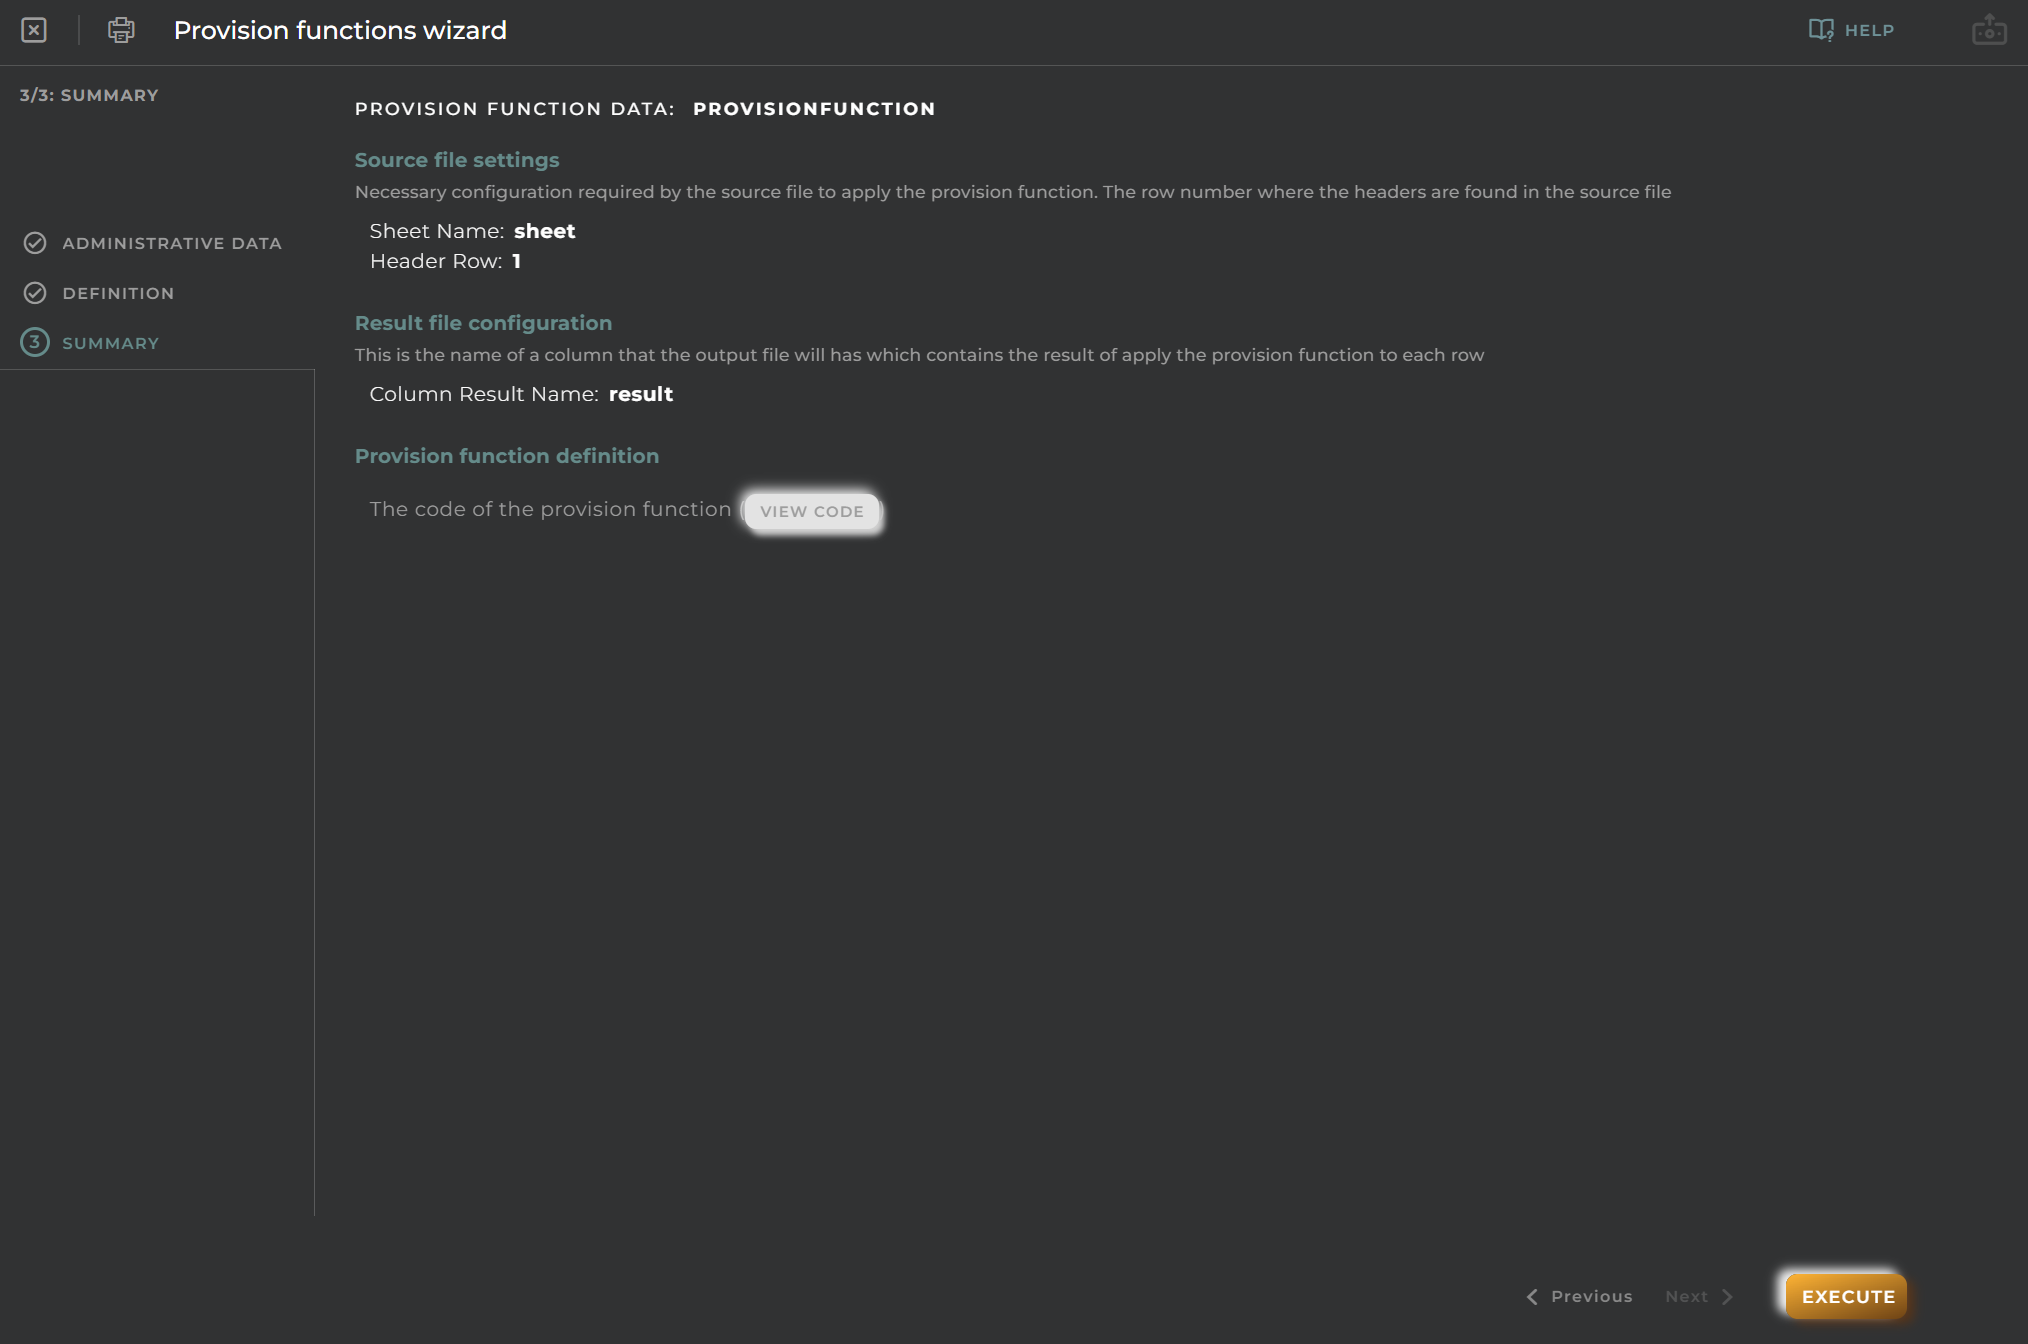
As with the other OpenGate wizards, the final step always shows you the summary of what you configured to confirm and the “EXECUTE” option.
👏 You created your first provision function!
5. Using the provision function:
Now that we have our provision function, let’s use it to create our assets that represents the rooms of our warehouse:
5.1 Go to “OpenGate Management > Bulk provisions (Advanced)” and click on “Upload Bulk File (Advanced)”
This opens the wizard to execute a provision function process
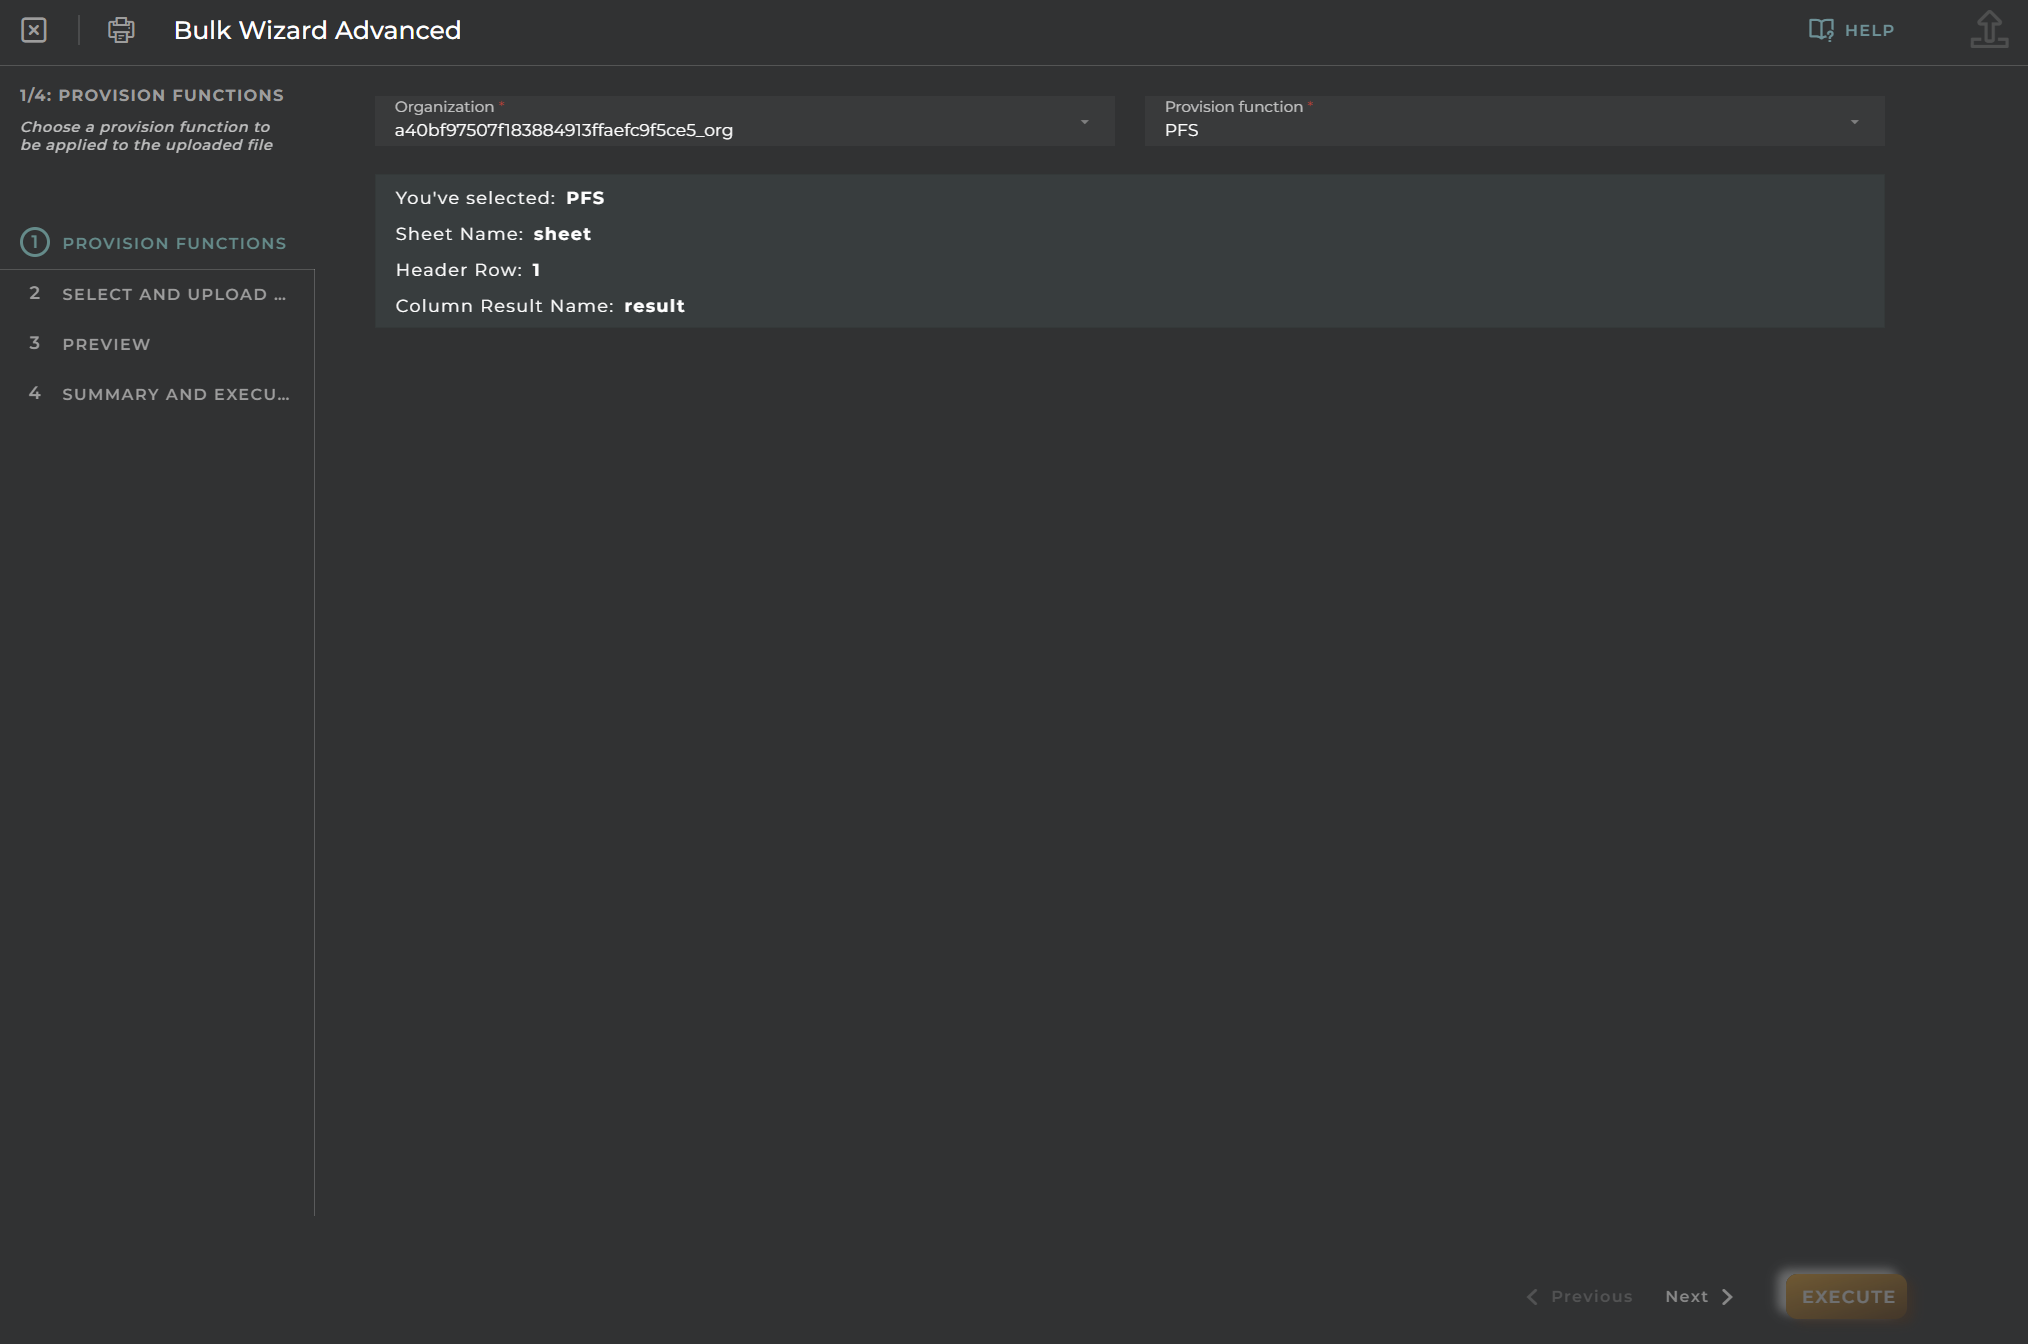
5.2 Step 1: Choose our Provision Function
Choose our new provision function “CreateRooms”
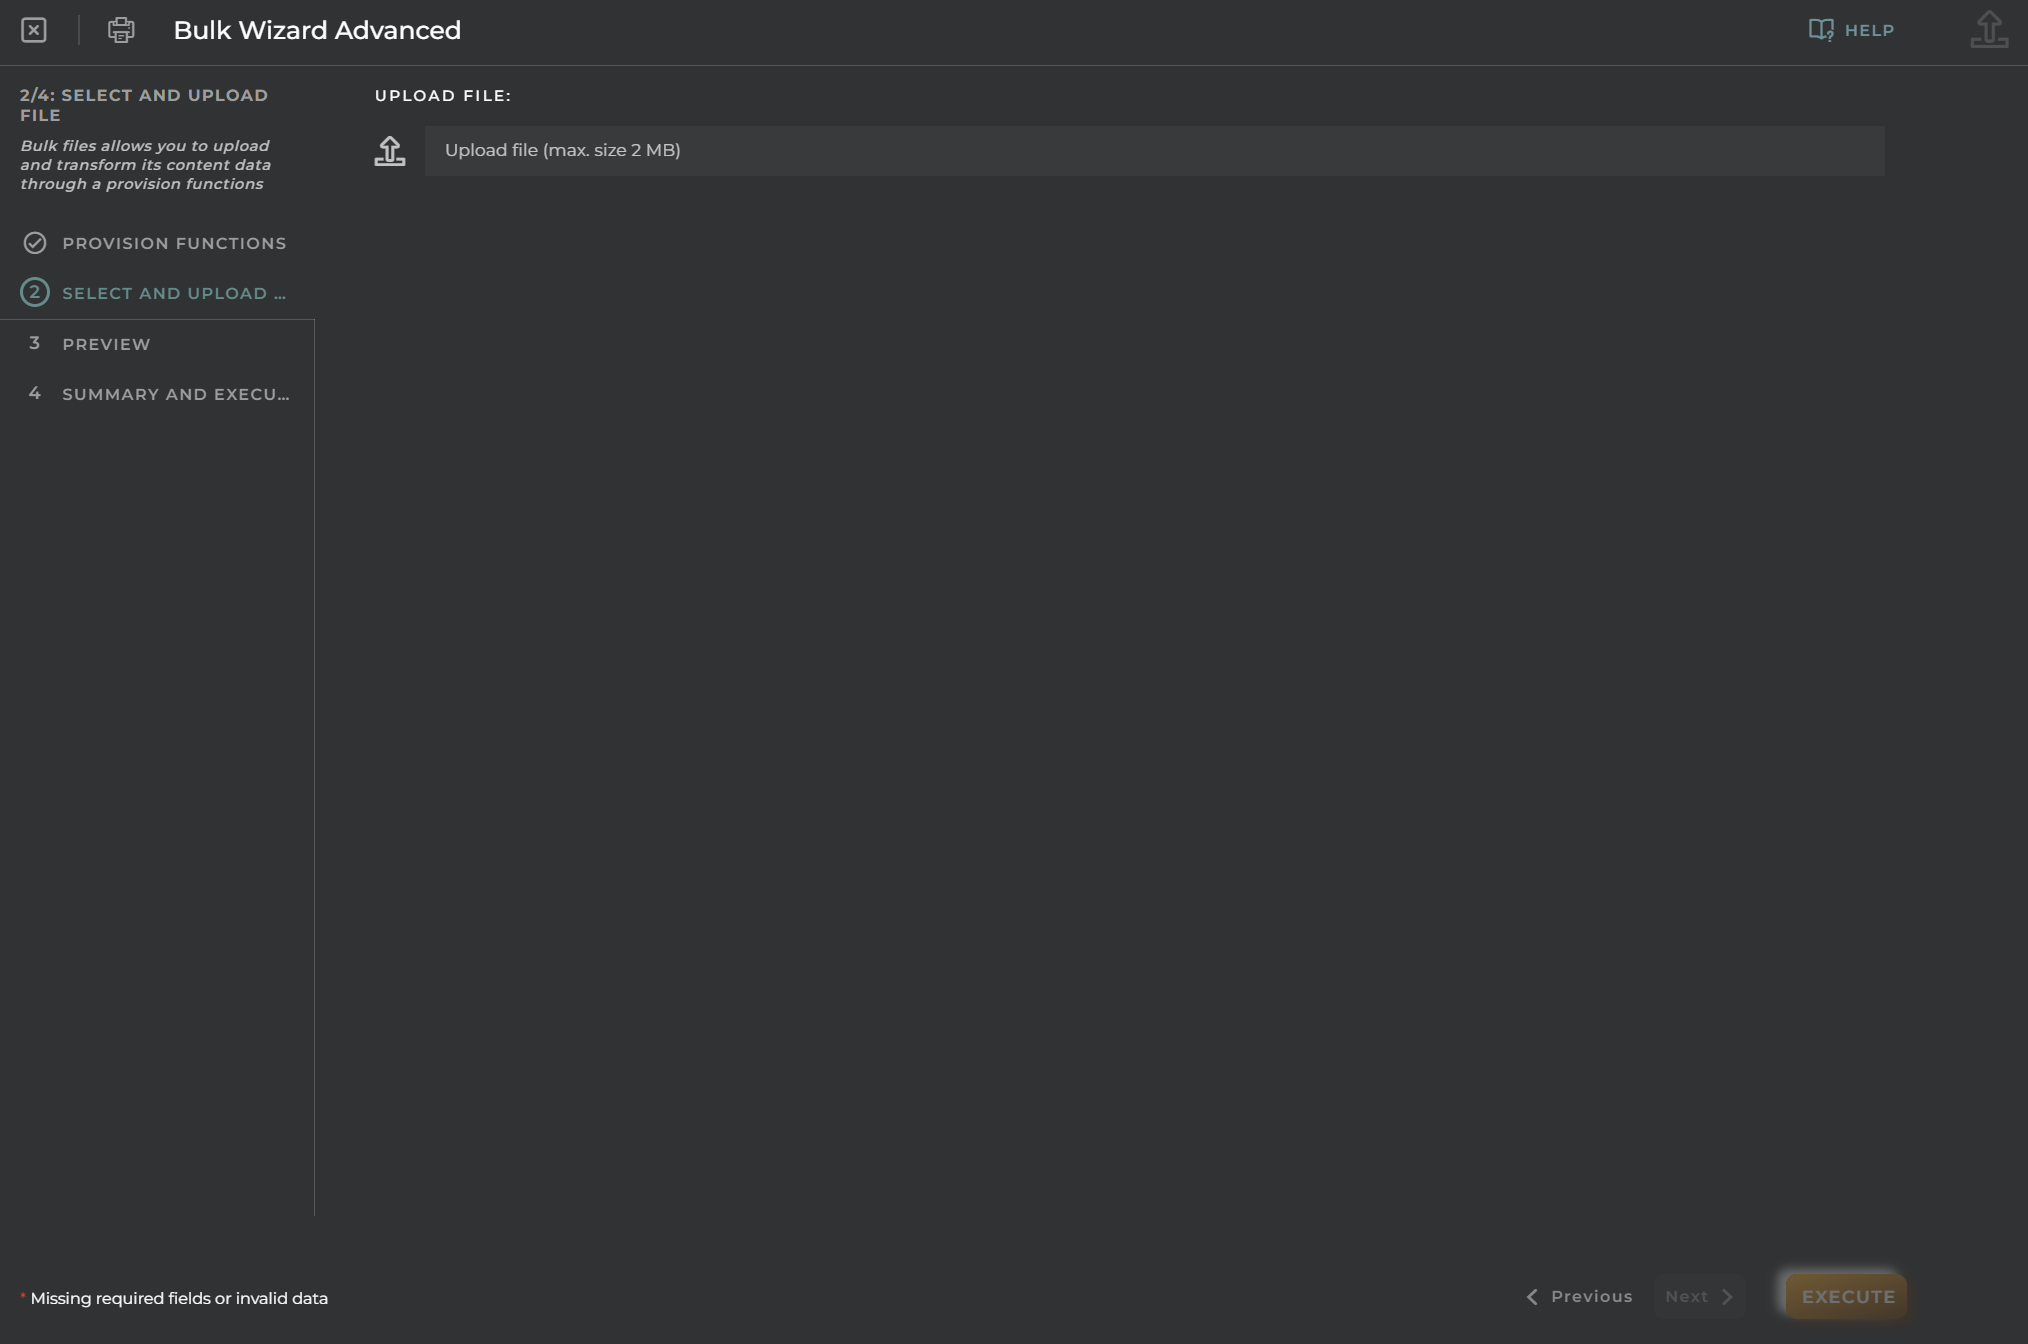
5.3 Step 2: Upload your file
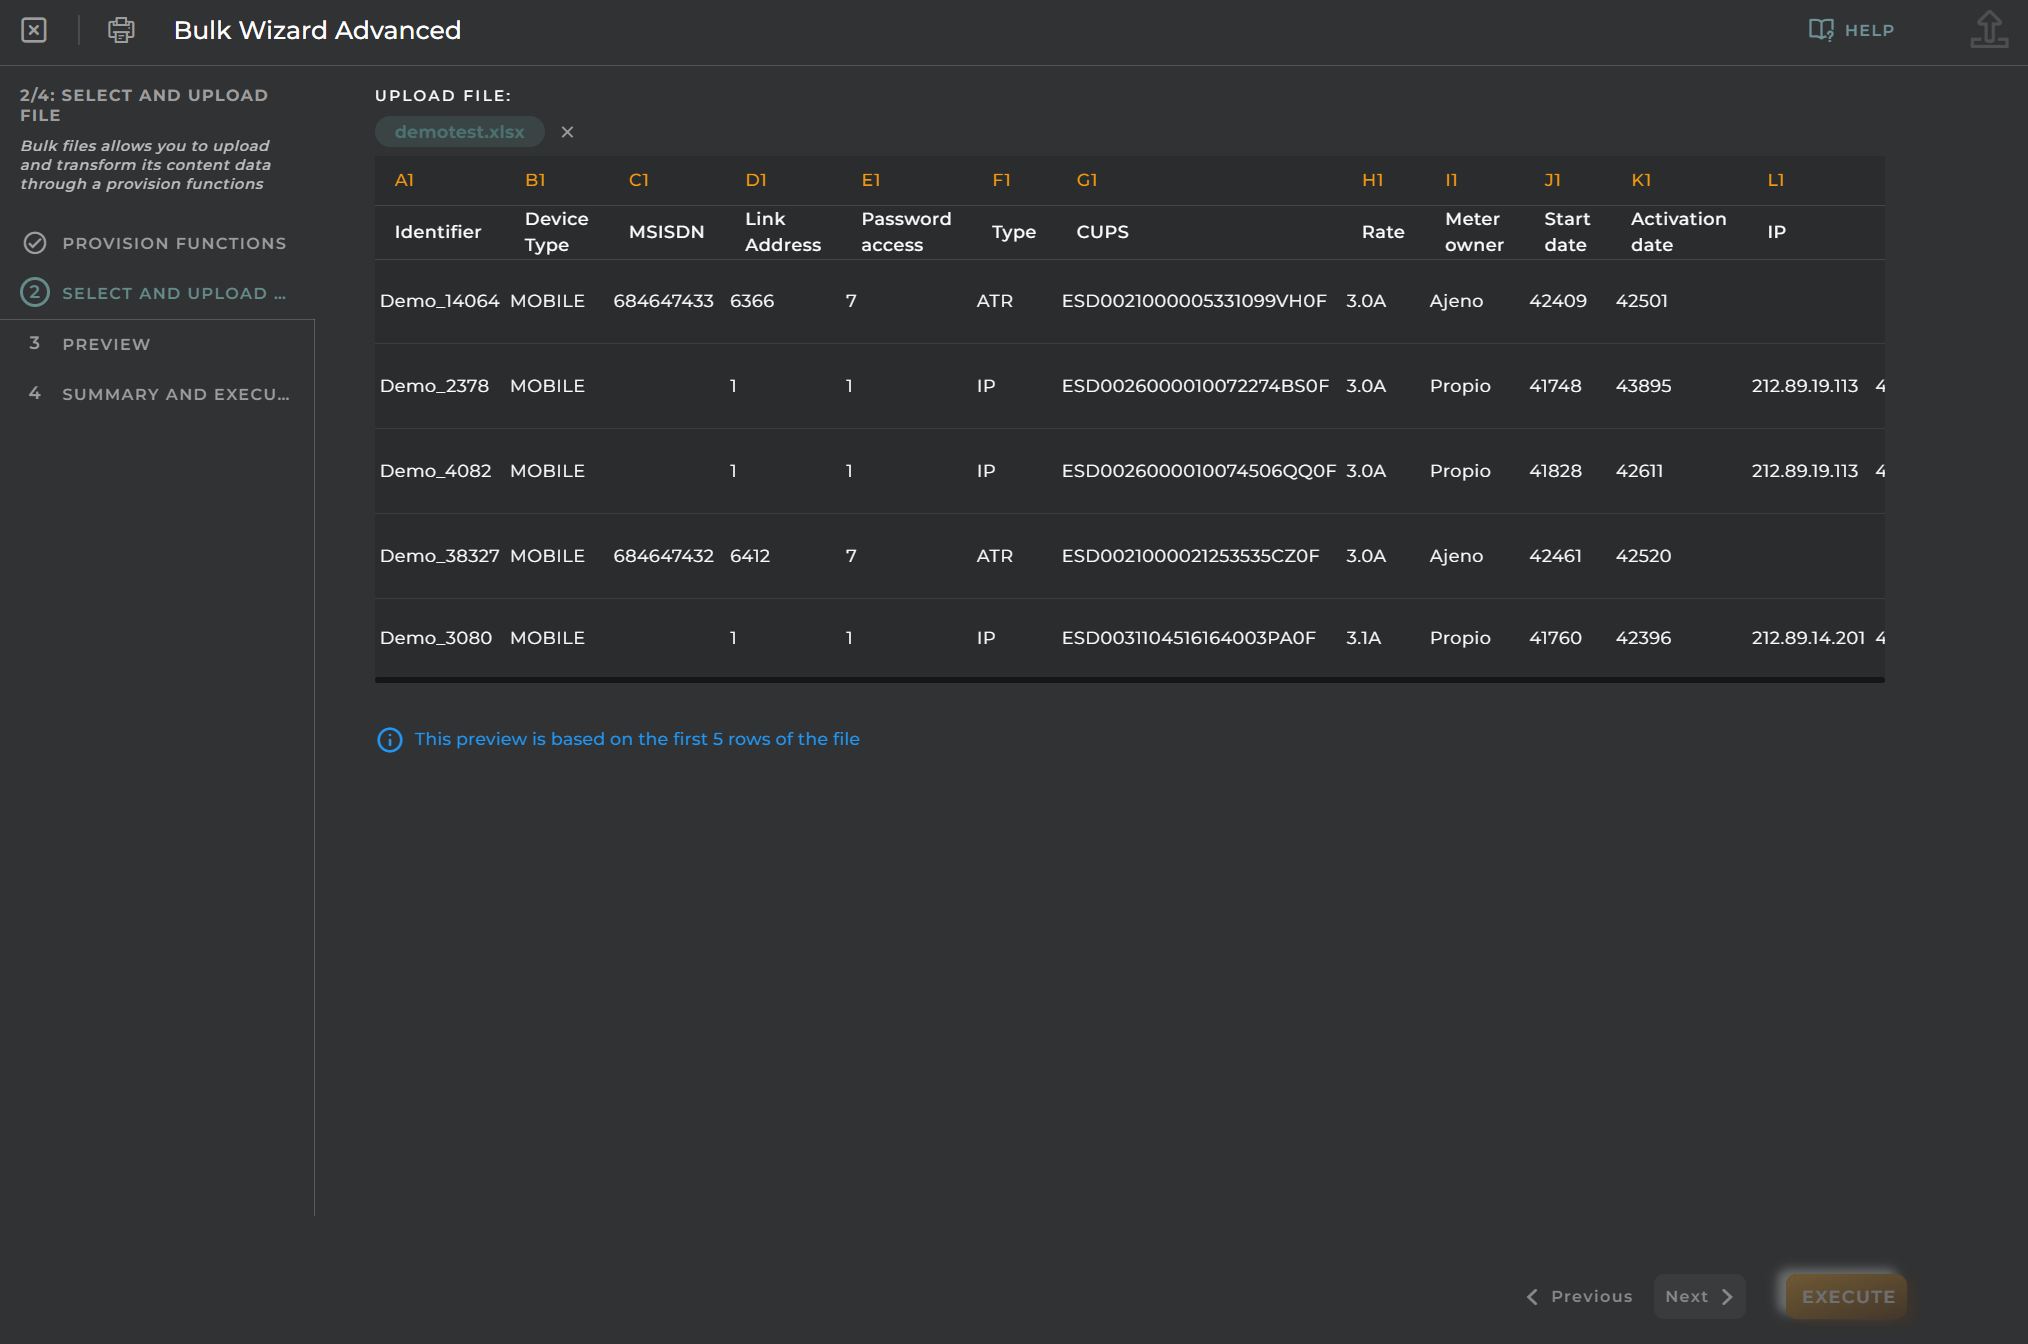
Use the file 🗒️provision_rooms.xlsx. This file contains some rooms to be populated into our OpenGate.
⚠️IMPORTANT: Please edit them and change [YourPrefix] and [YourOrganization] with your values
After upload the file, you will see the first rows as preview
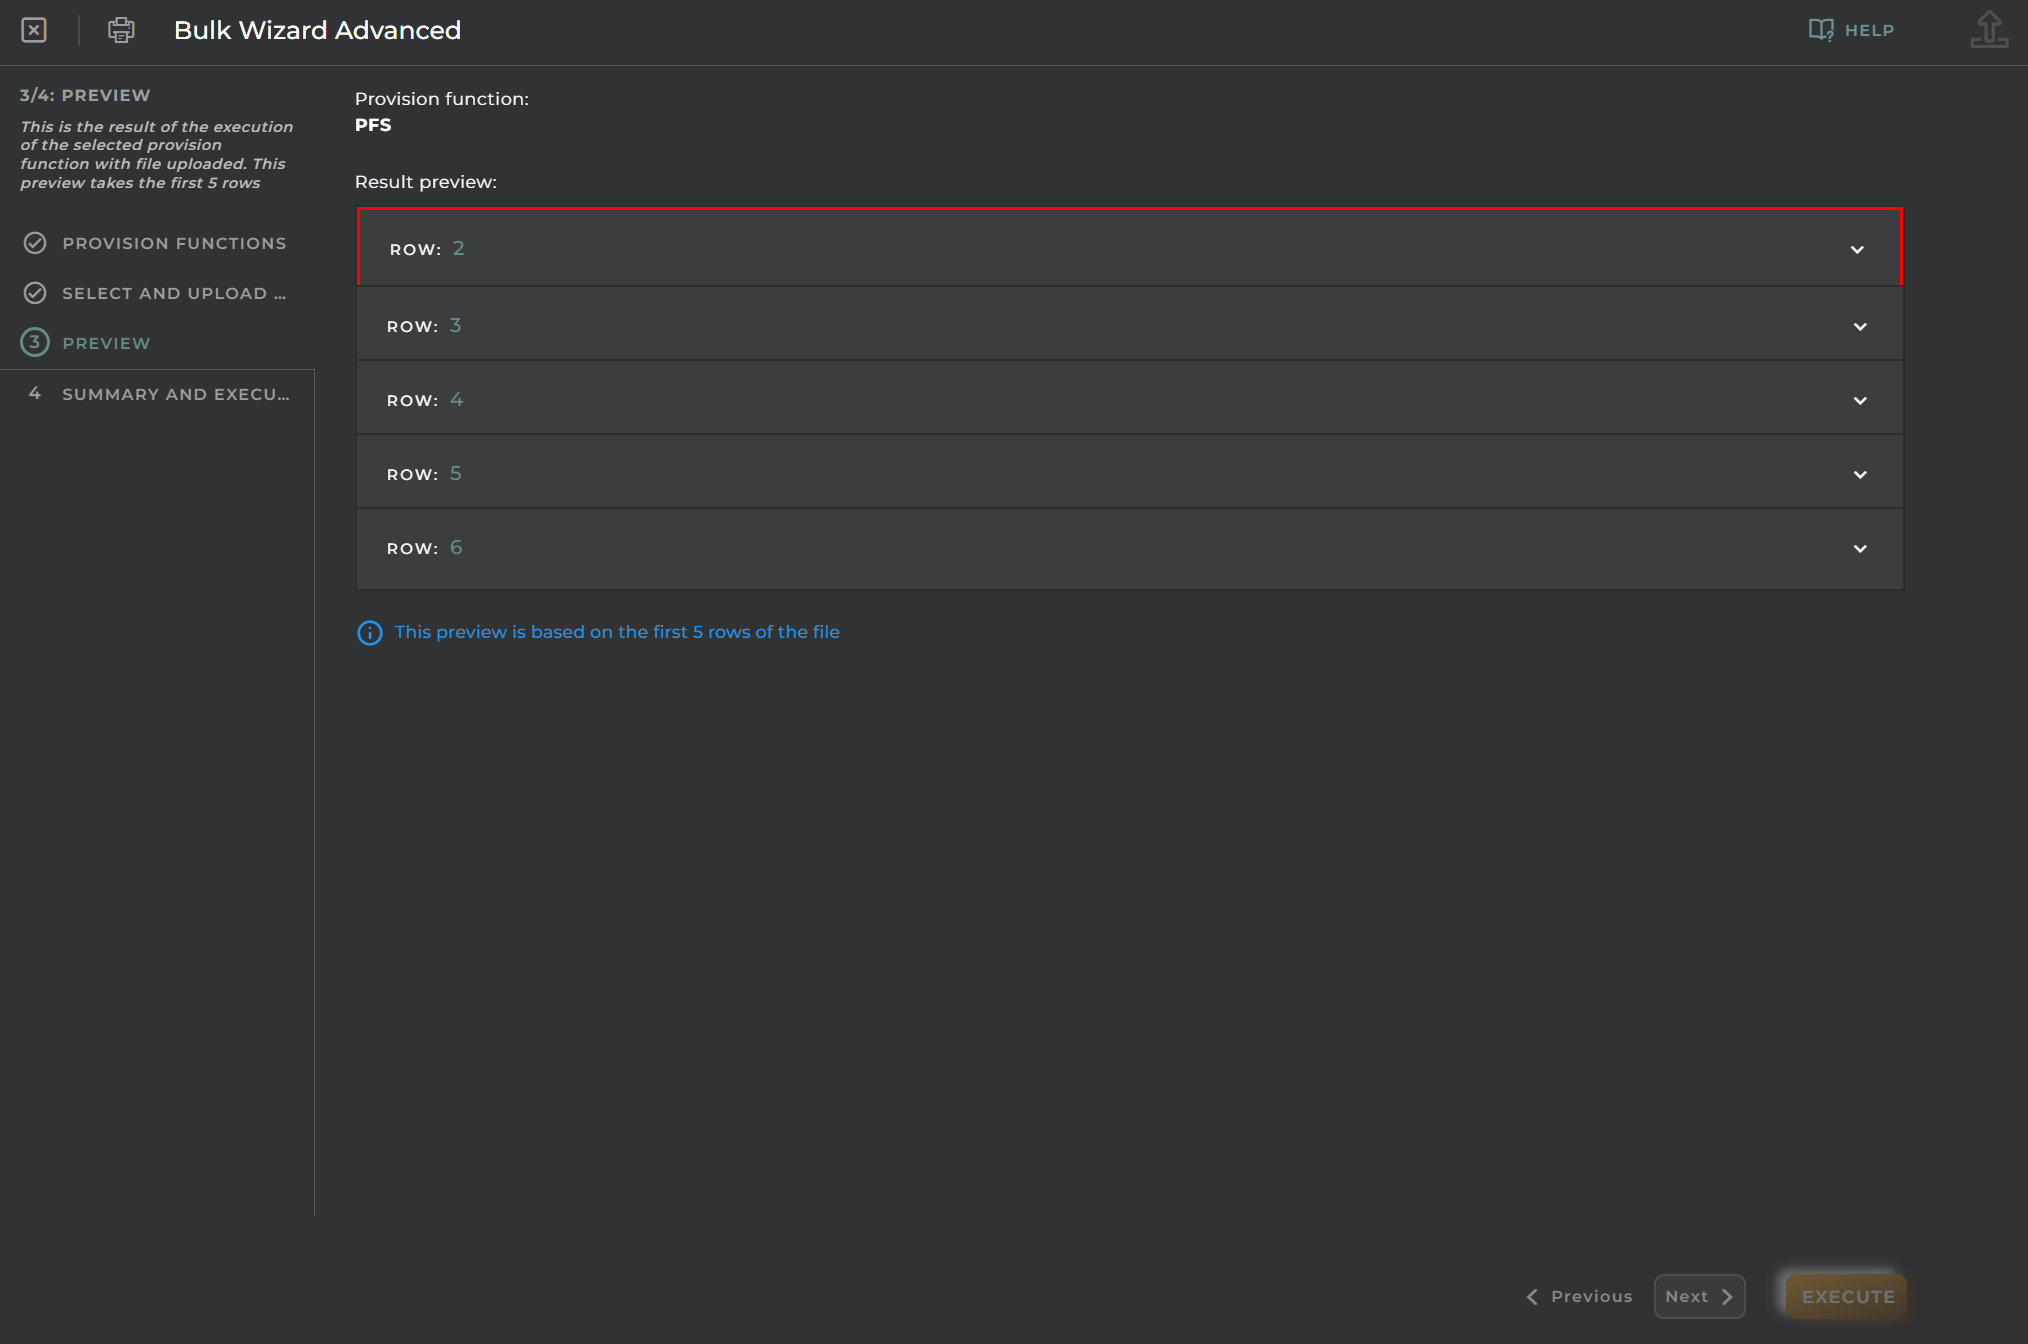
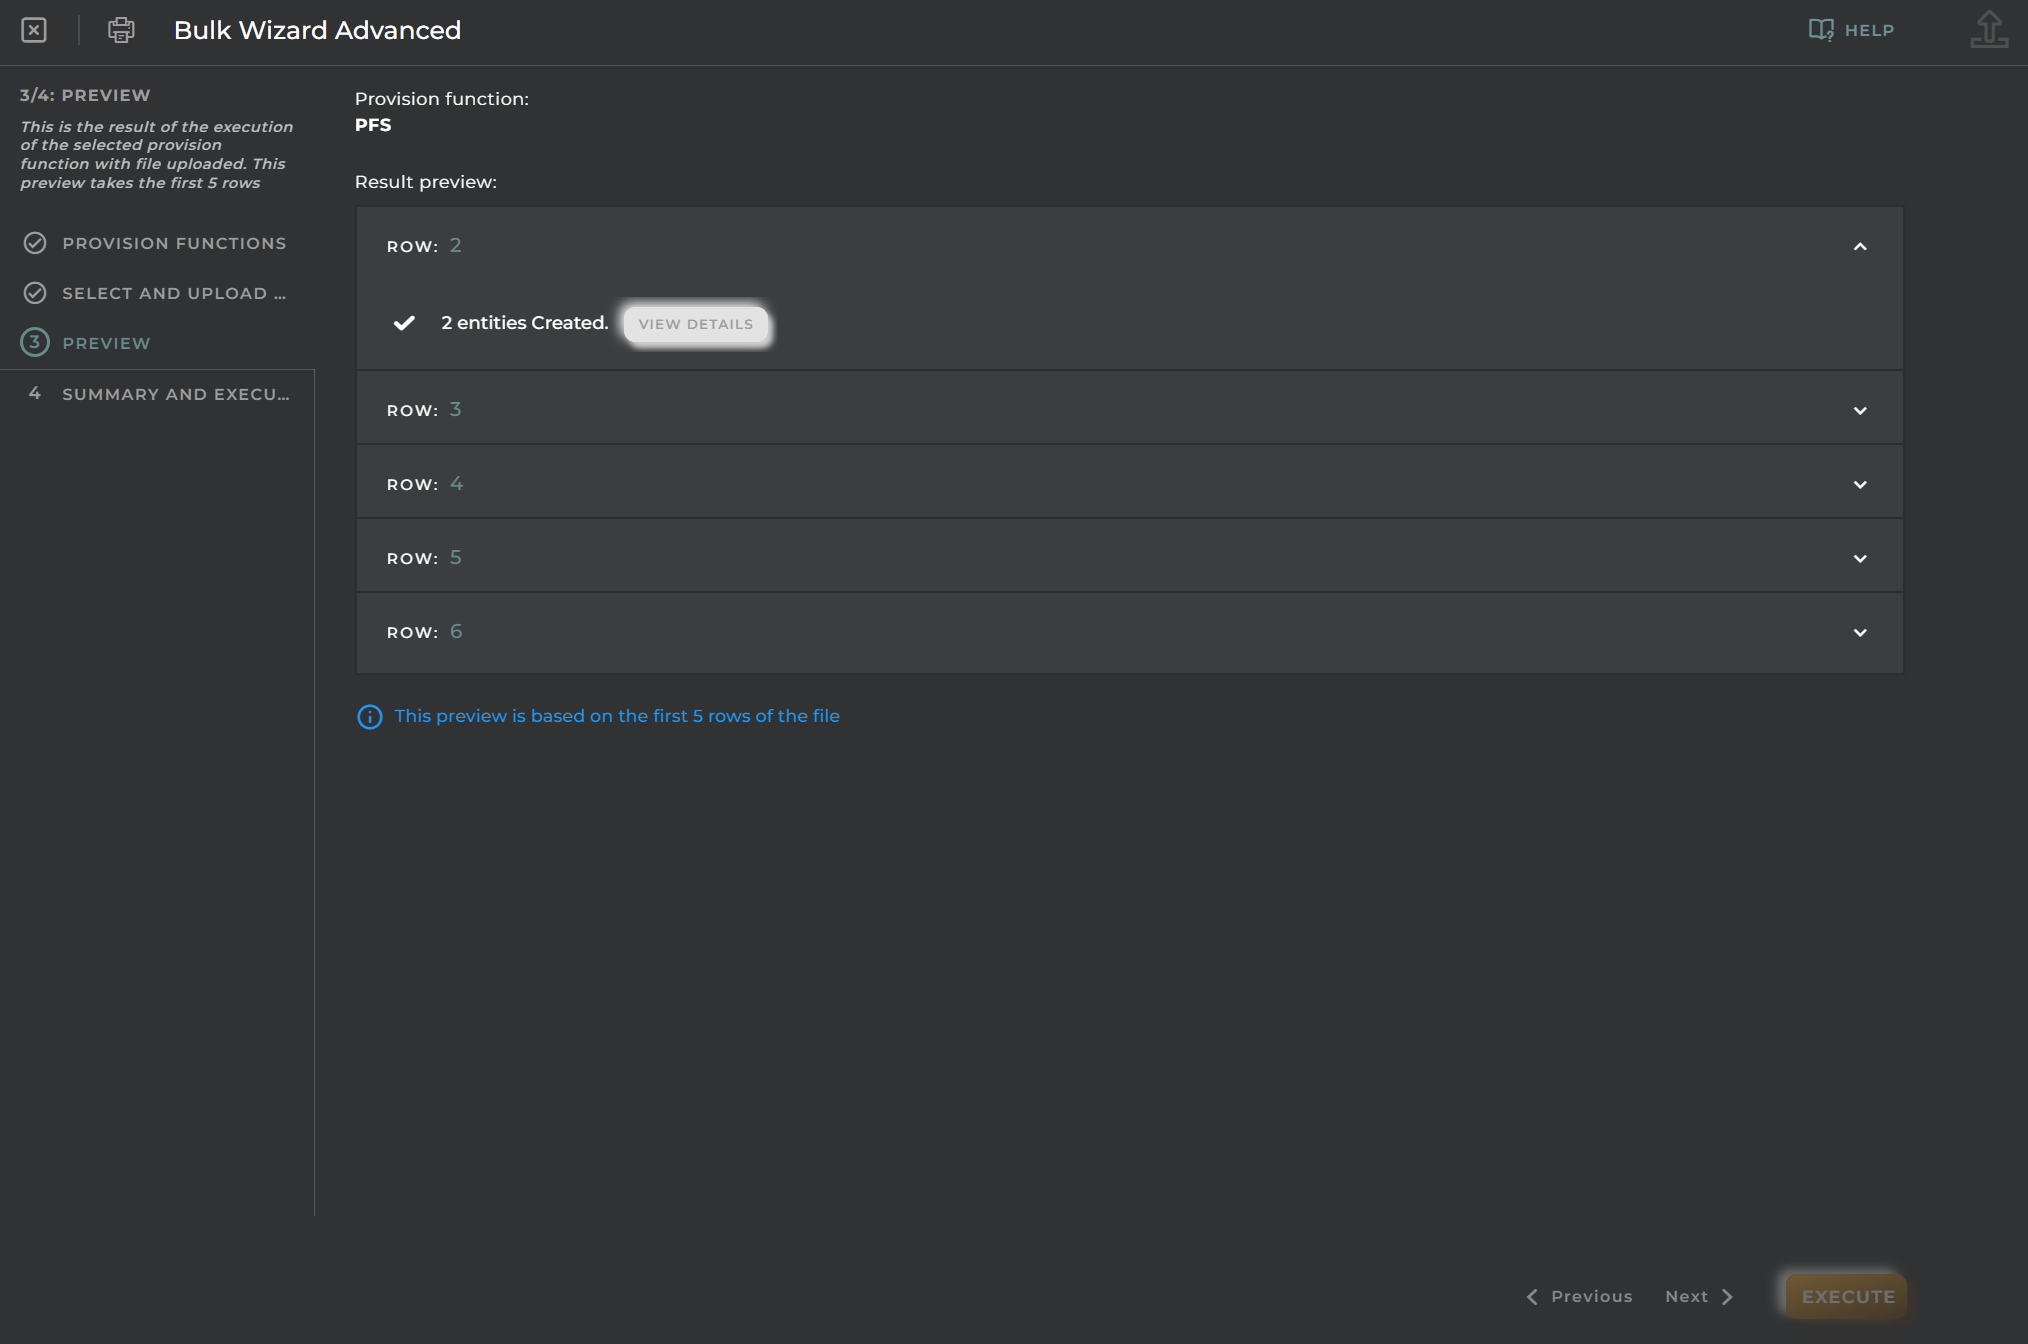
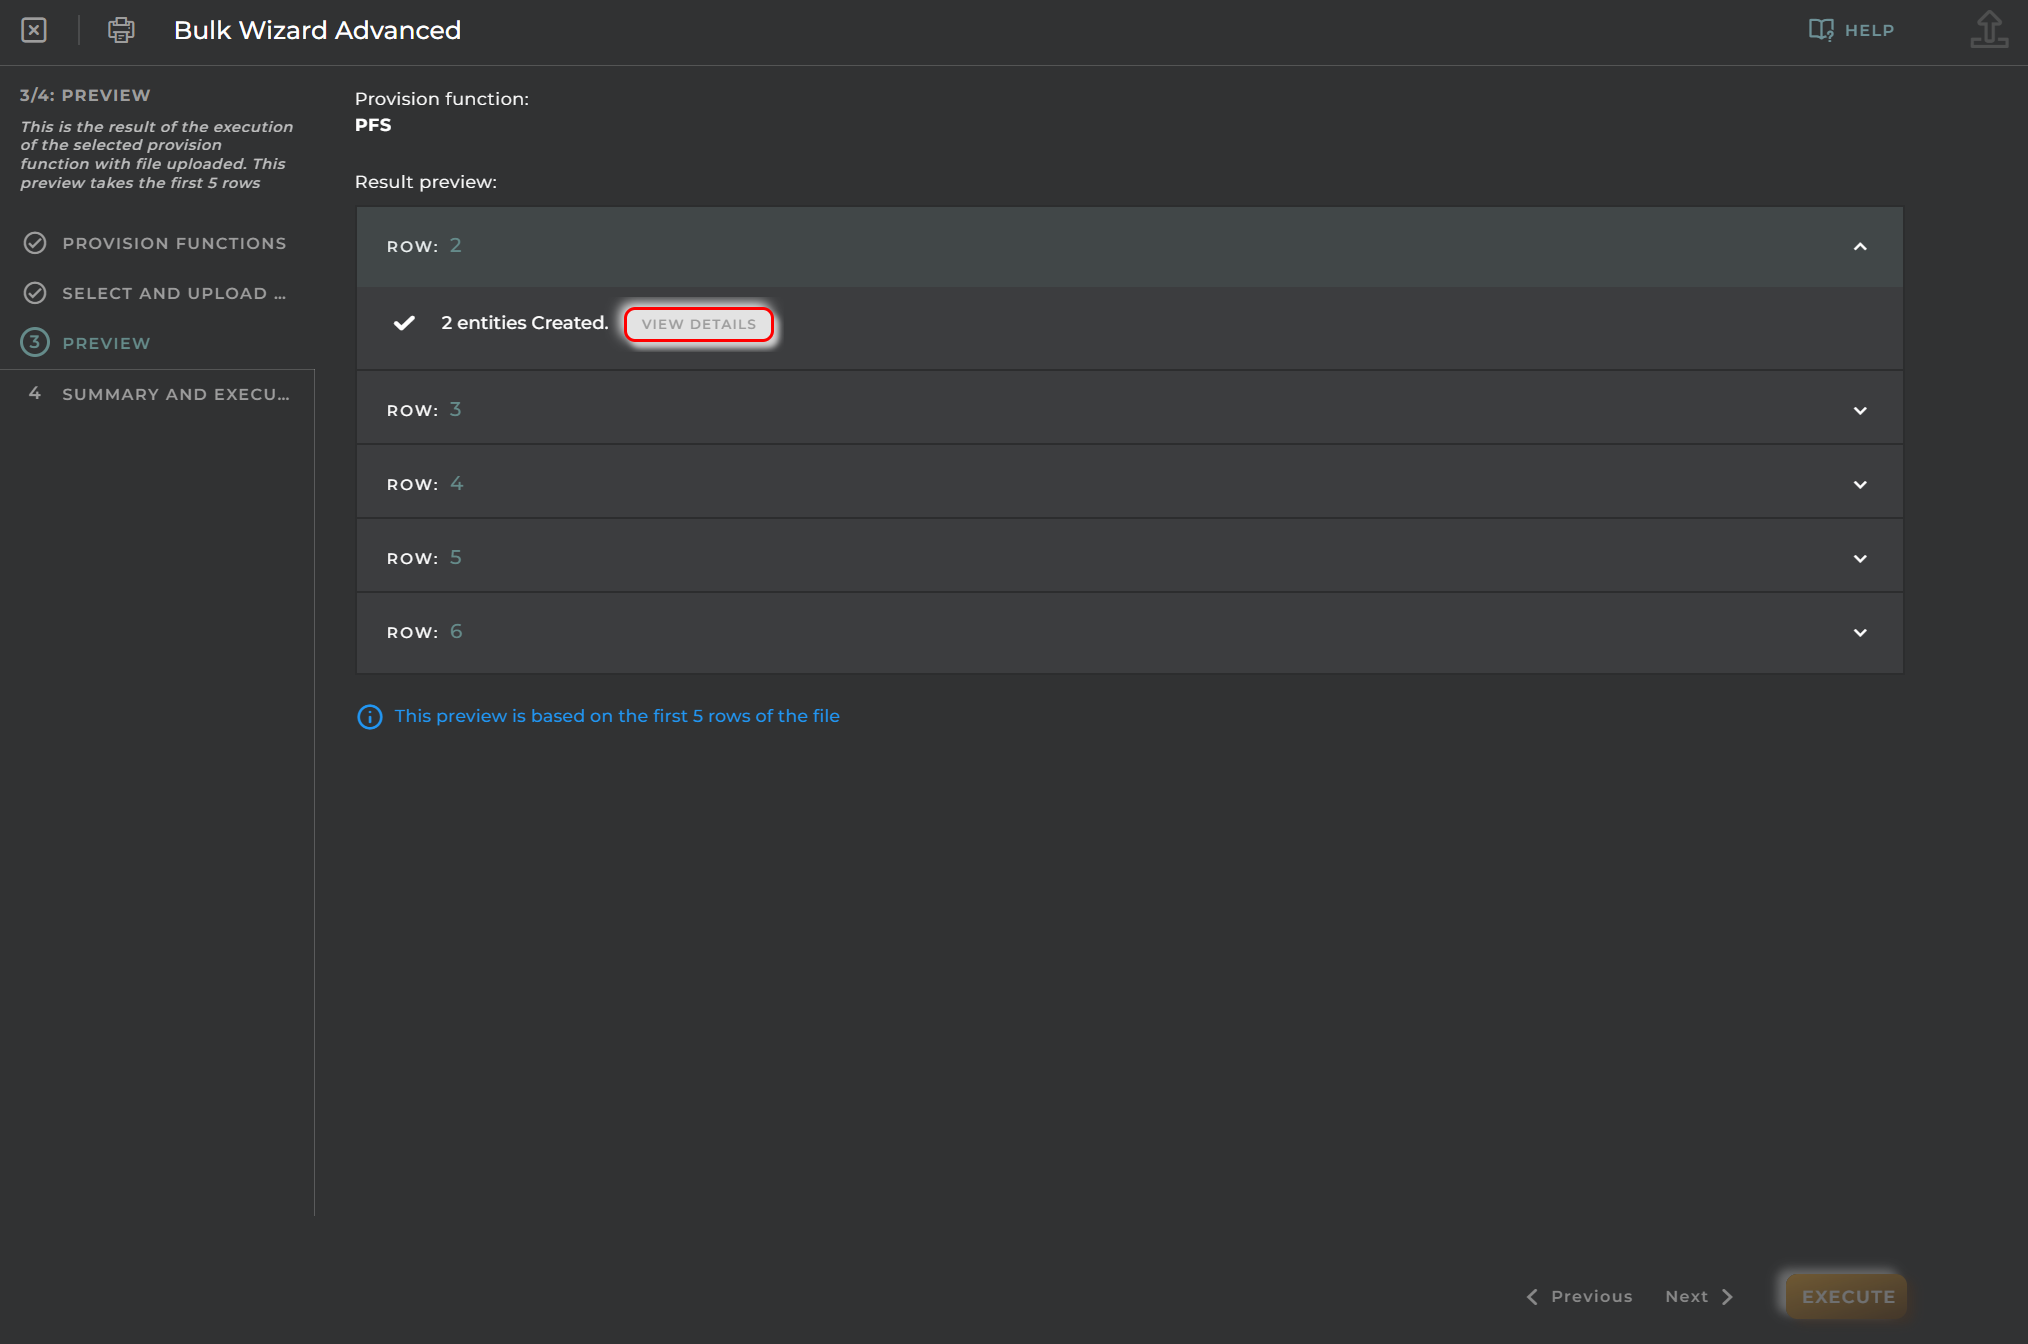
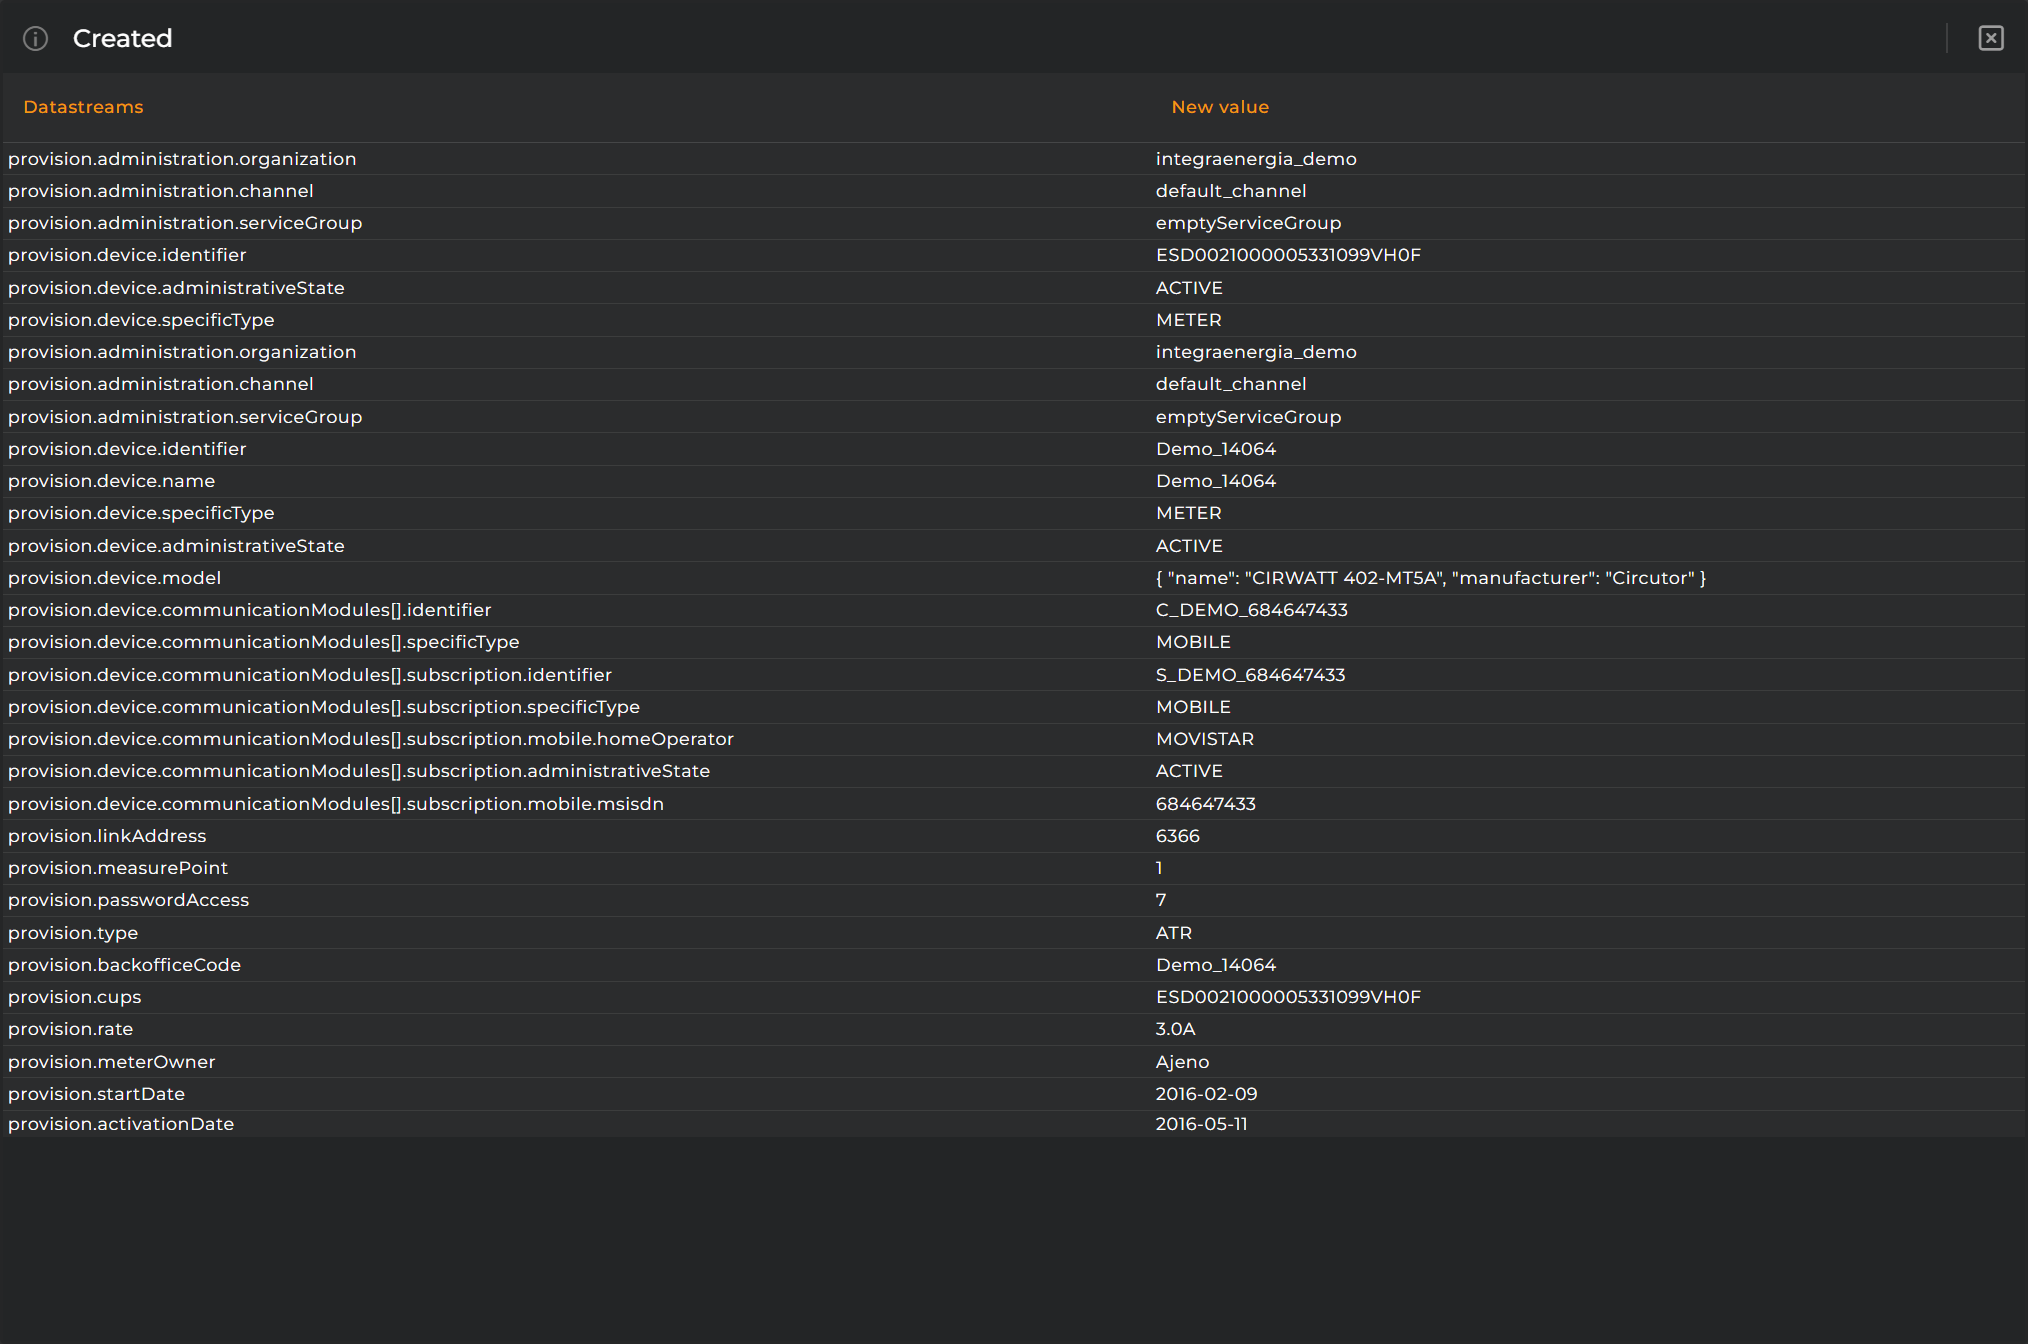
5.4 Step 3: Preview results
Because this is a critical functionality, this step allows you to check as preview what the provision function selected will do with the first rows.
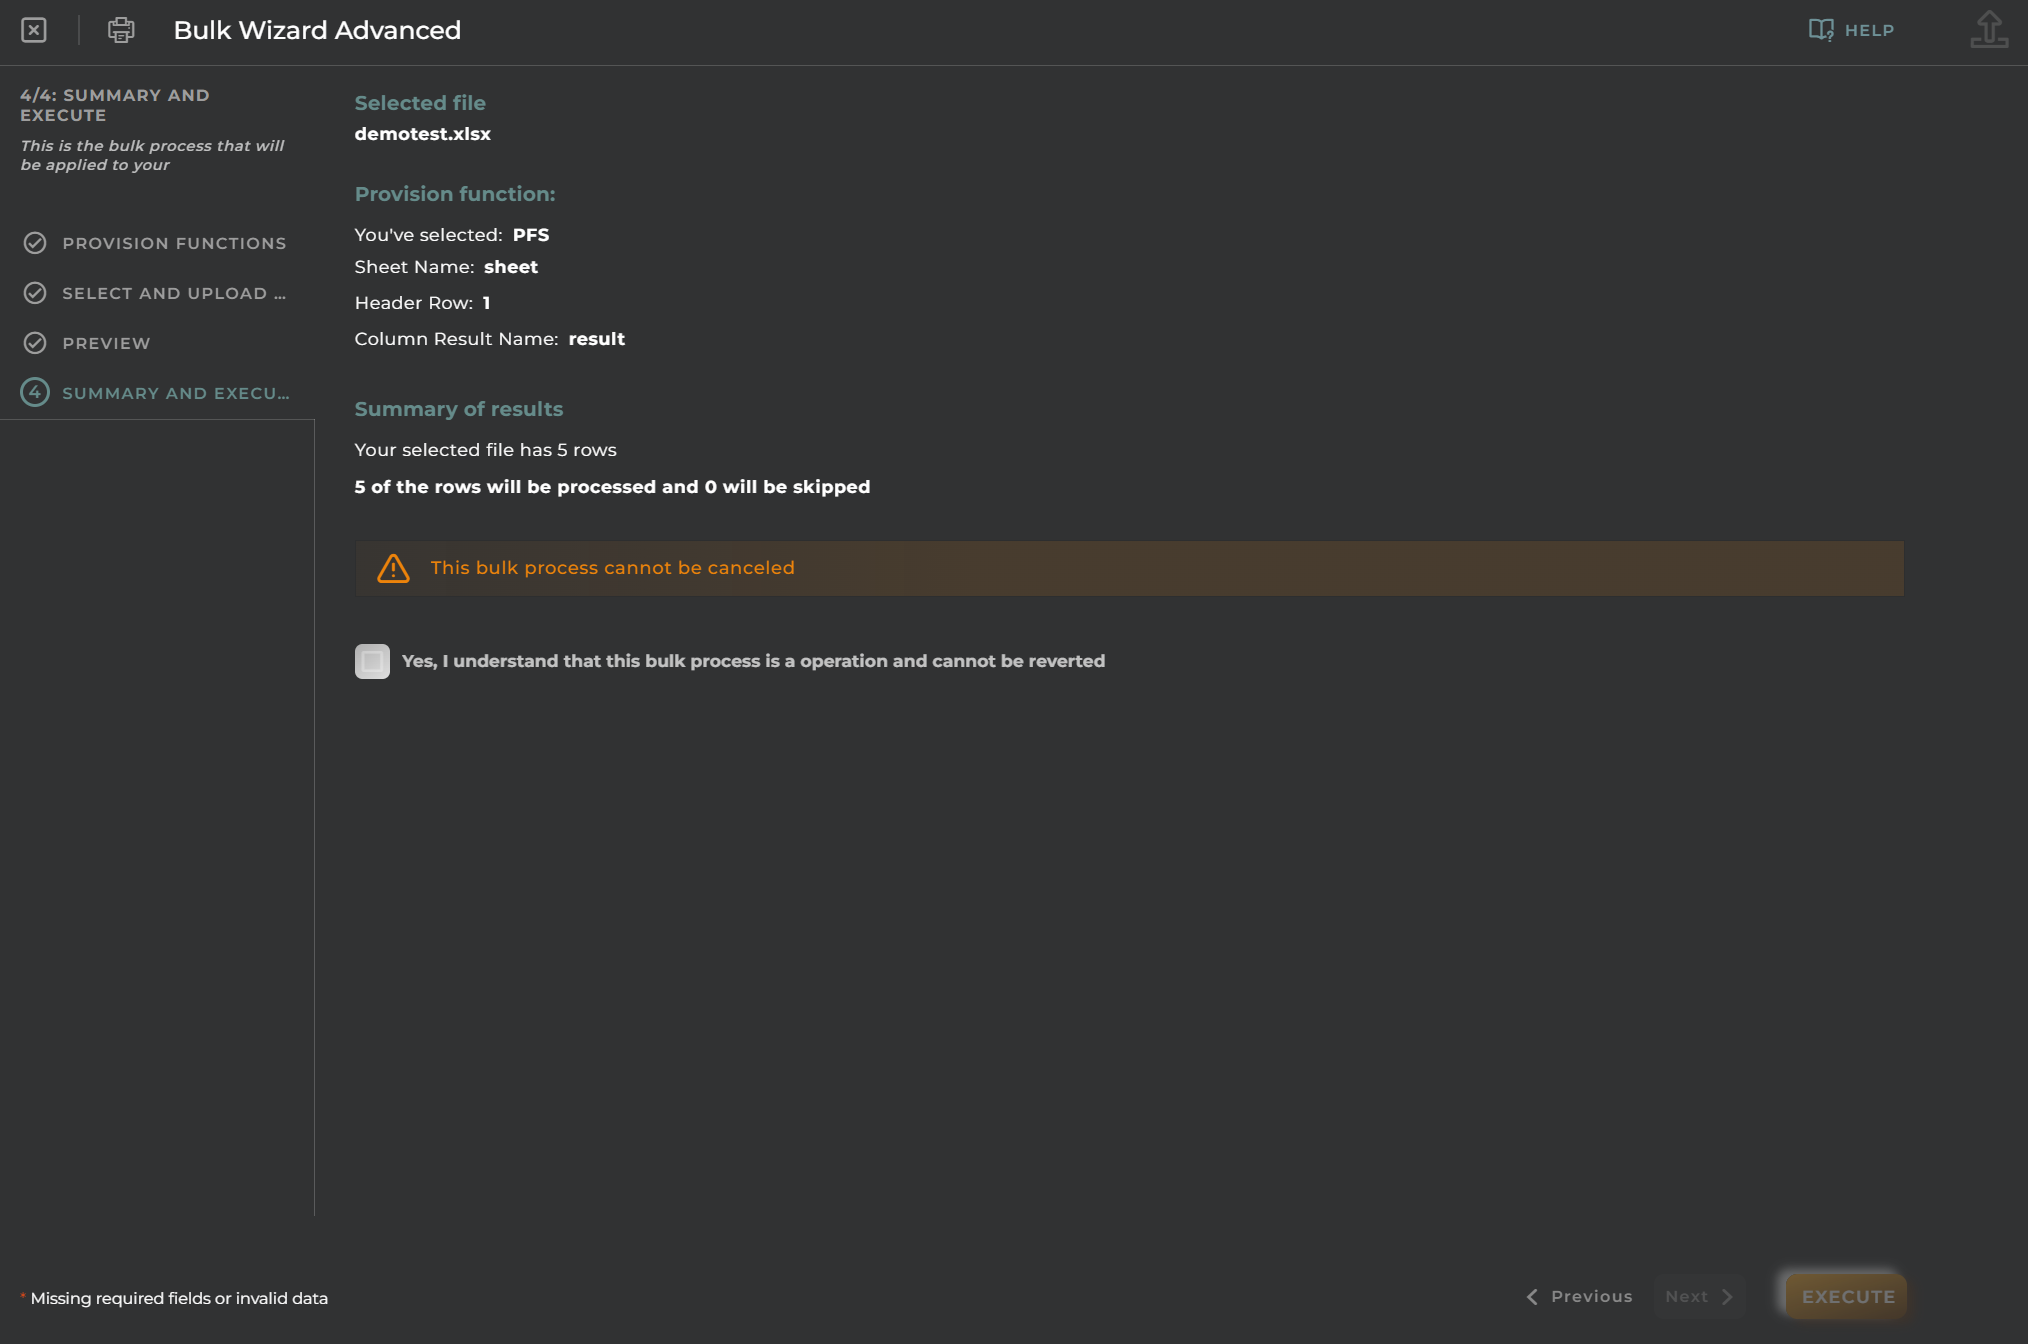
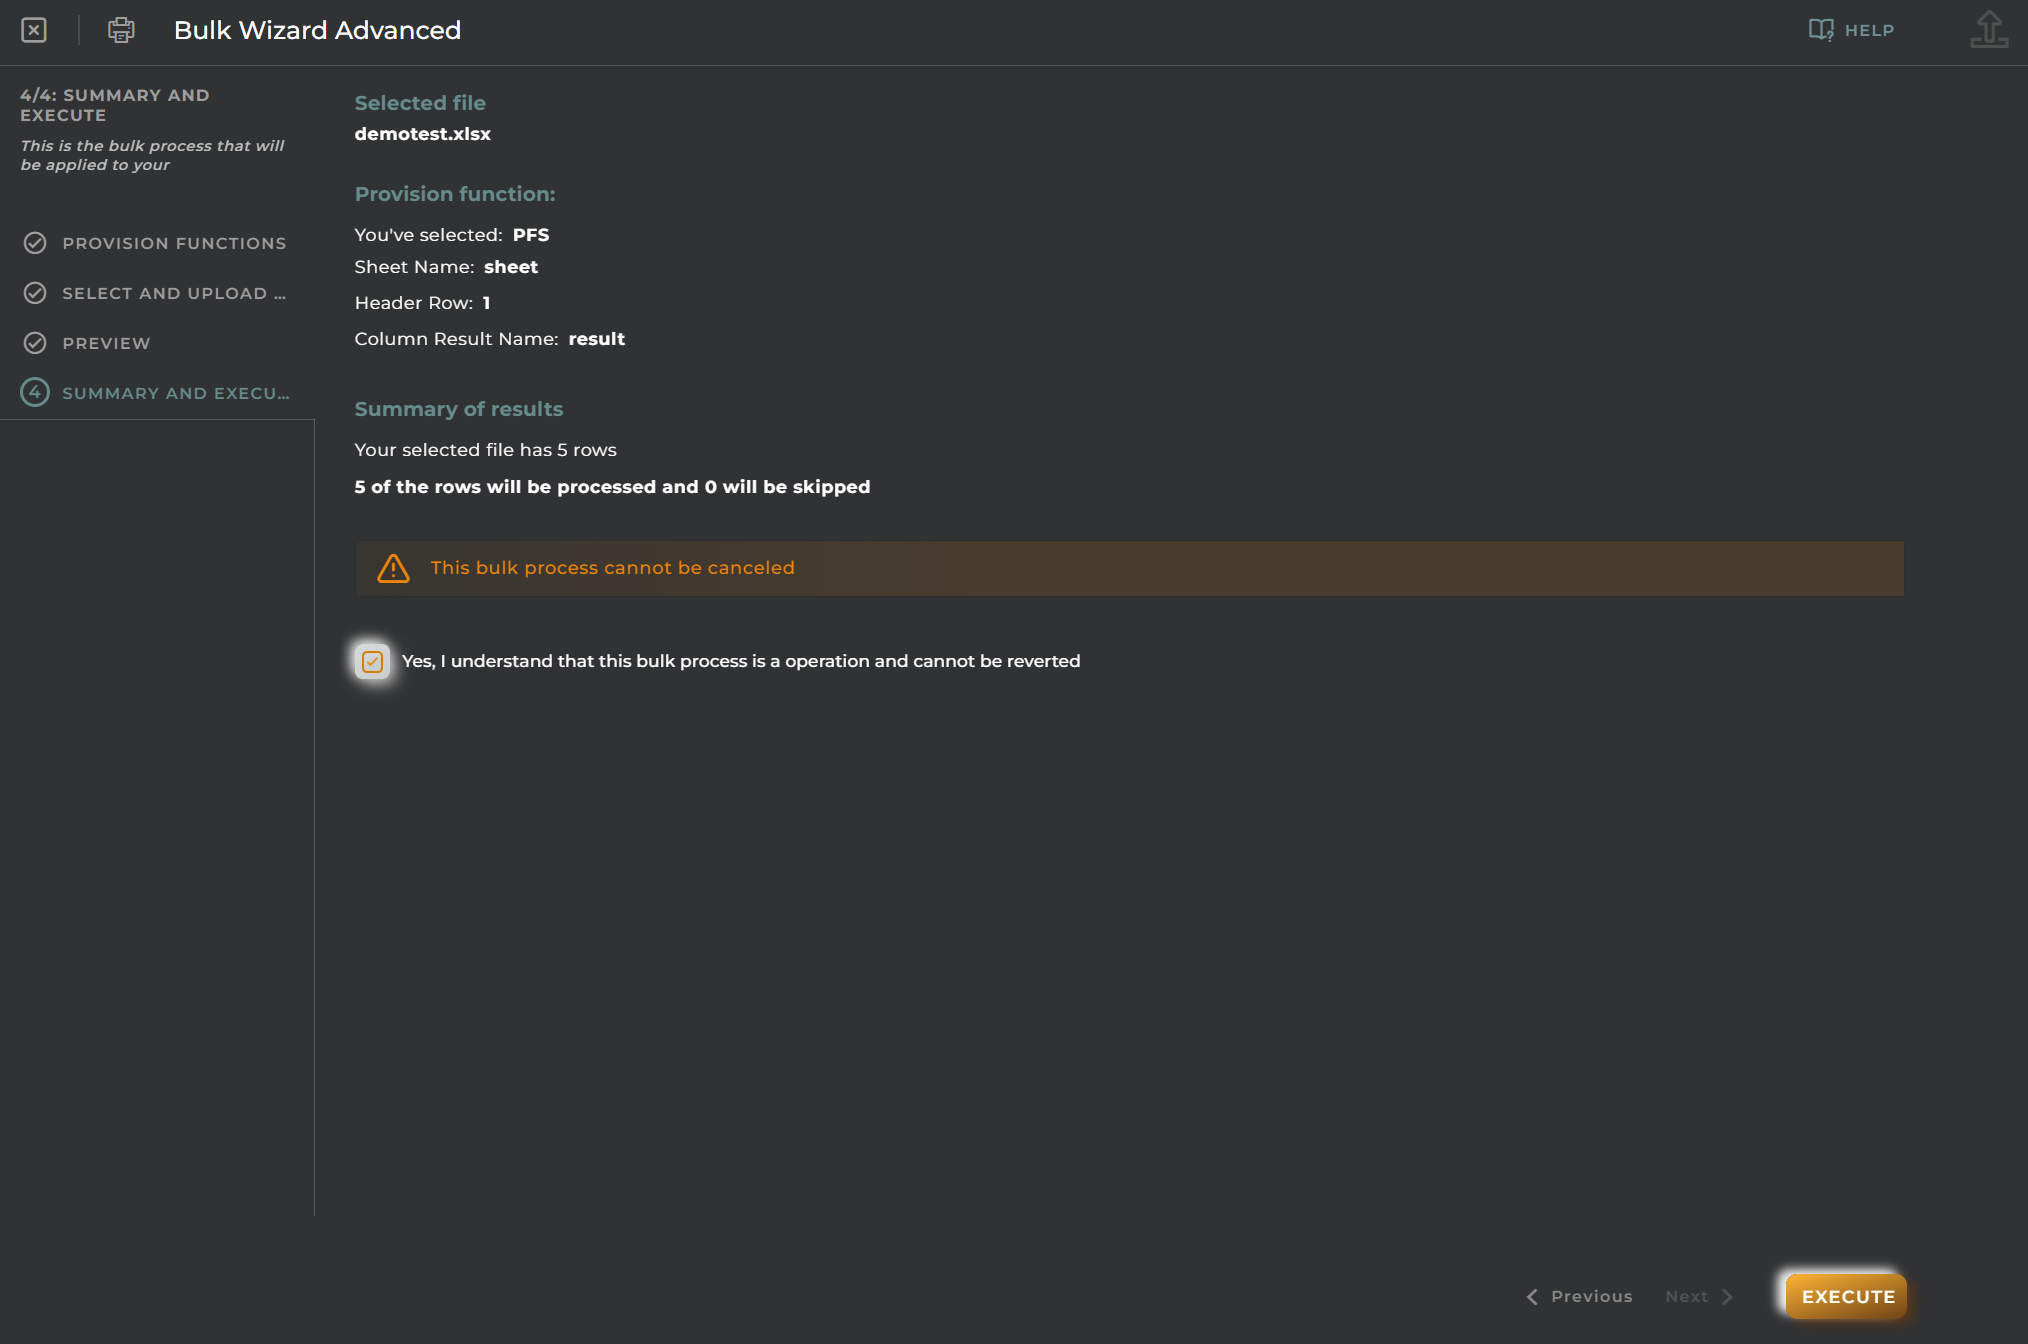
5.5 Step 4: confirmation
We want to repeat this… Because this is a critical functionality, you must check the doble confirmation before click on “EXECUTE”
6. Check the process result
The execution of a Provision function may take some minutes depending on the actions, rows and so on. For that, the process will execute in background and the execution is shown on the screen, Check that the status is “IN_PROGRESS”
Click on refresh to check if the process is “FINISHED” and check the results on columns “Processed”, “Successfull” and “Error”.
Remember, you can download the result file to check the process row by row. You will se something like this:
🚀 When to use this method:
Perfect for mass onboarding, data migrations, or applying business logic during entity creation and modification, o even to delete groups of entities.
🏗️ Continue the tutorial
To finish the tutorial properly, use the method you prefer, wizard or bulk creating another provision function, to create the entities containted in this files:
🗒️prov_function_sensors.js: This contains the javascript code of the provision function to populate sensors and link them (as related entity) to the assets created previously.
🗒️provision_rooms.xlsx: This file contains some rooms for our warehouse that will represent our facilities for the tutorial.
🗒️provision_sensors.xlsx : Here you can find the devices that will be assigned to the different rooms
Check our new entities
When you finish this chapter, you should see the following entities:
Devices:
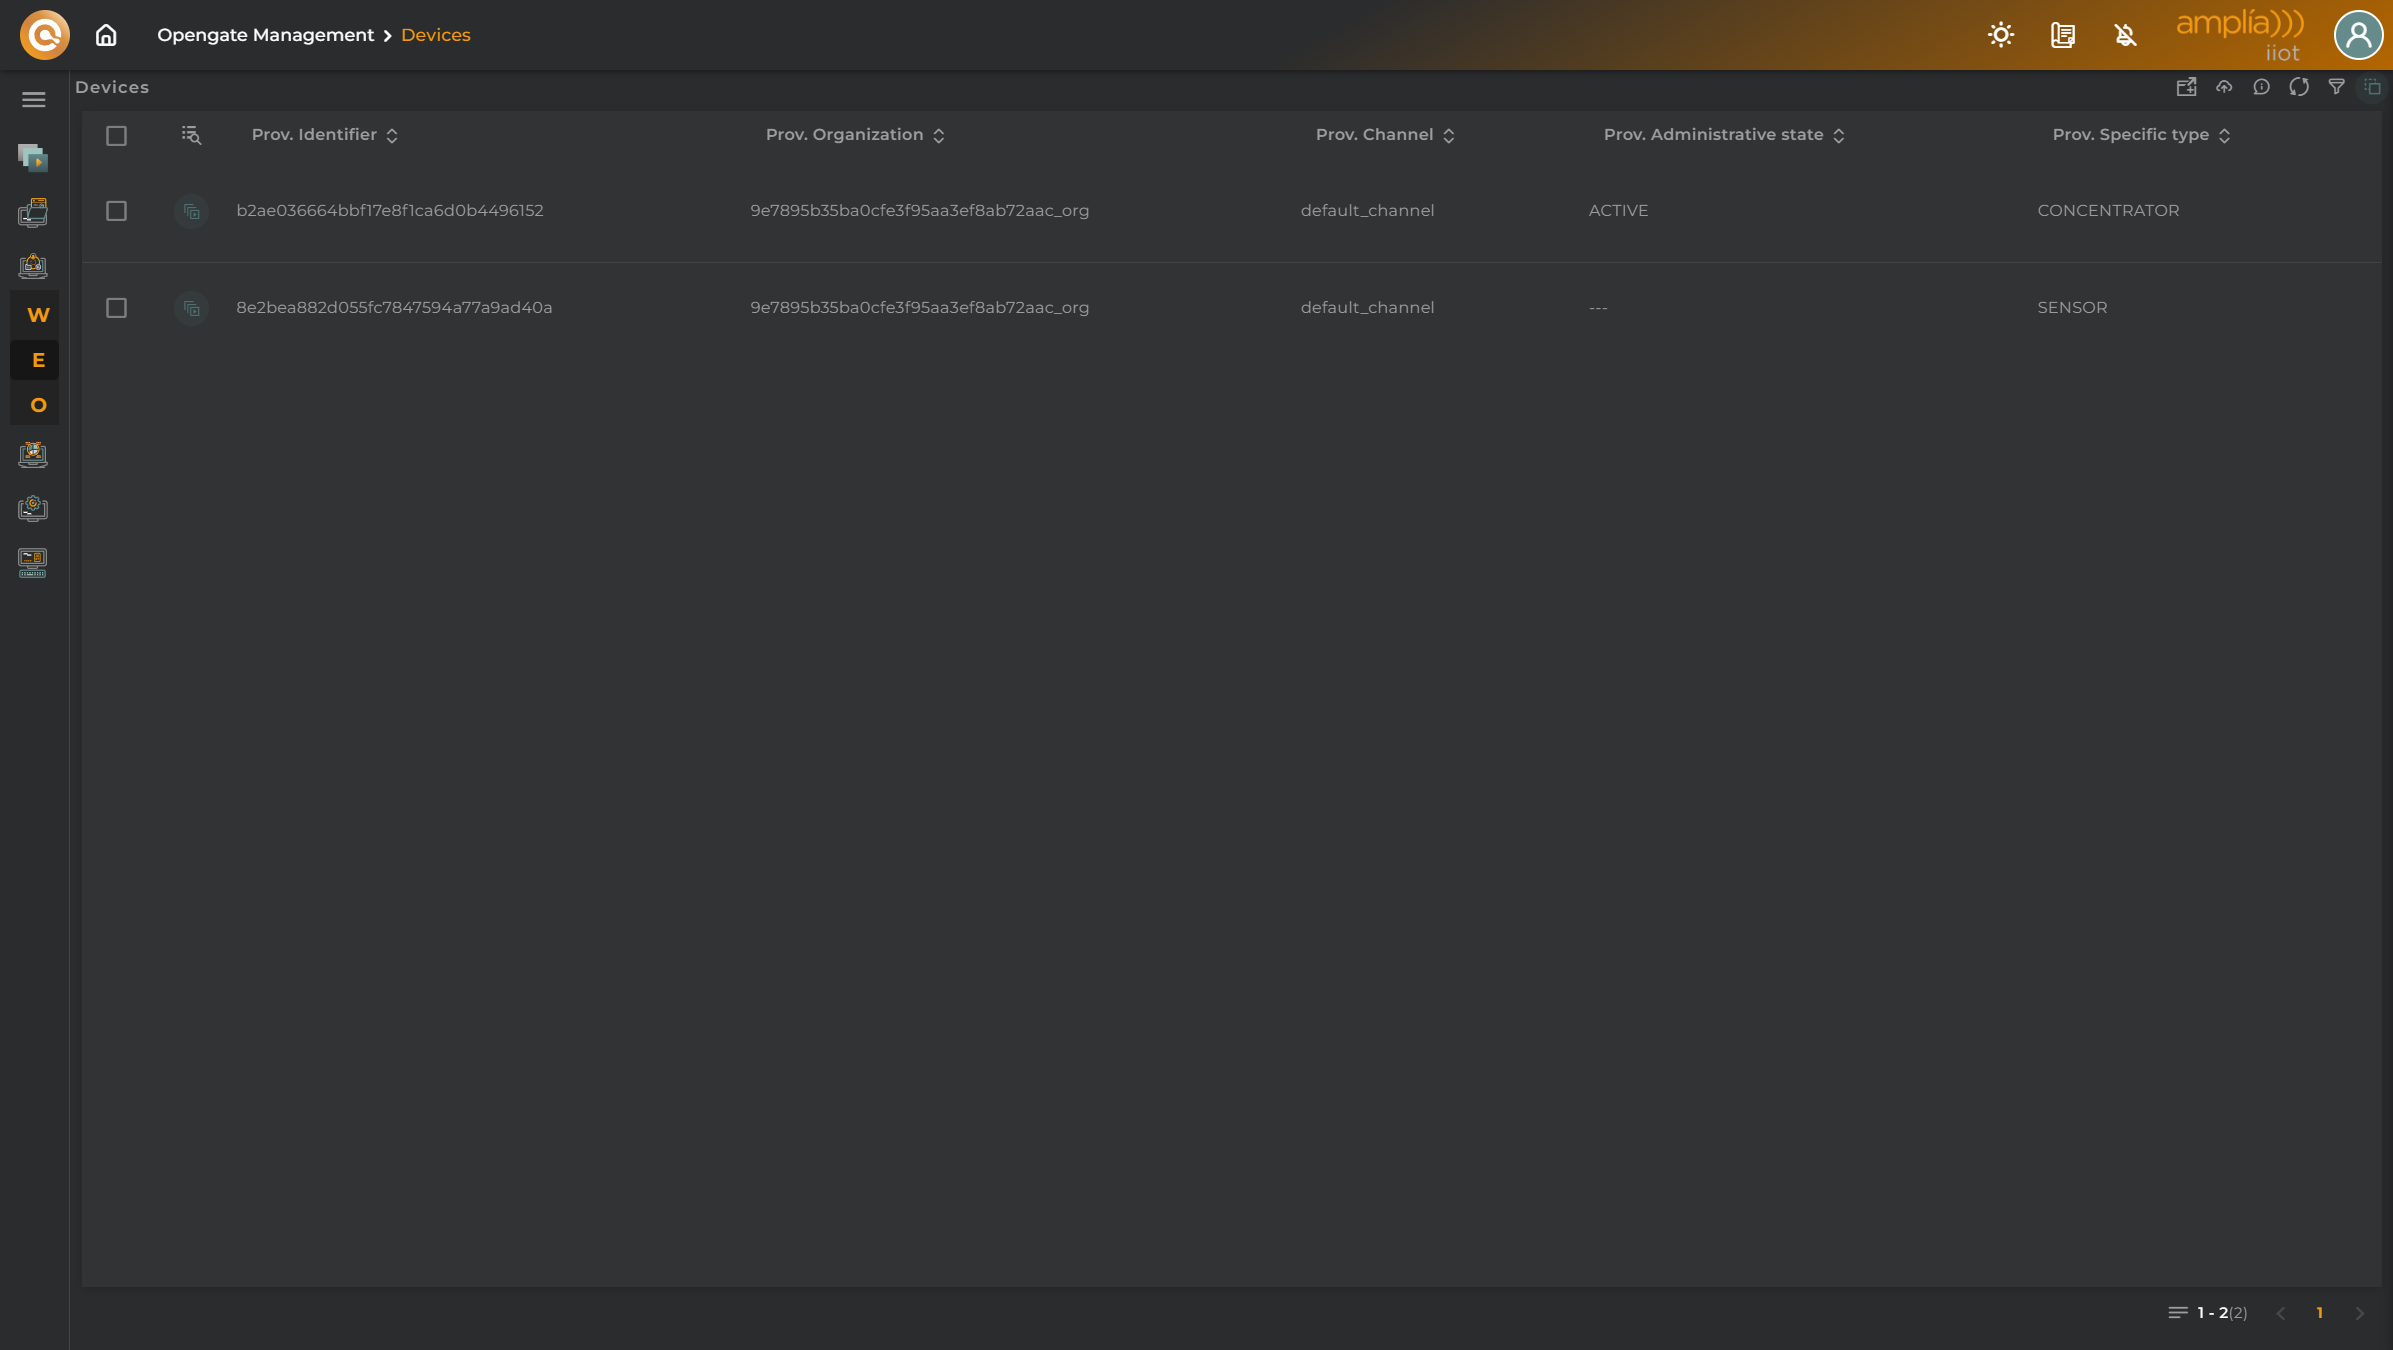
Go to “OpenGate Management > Devices” and you should see your devices
Assets:
Go to “OpenGate Management > Assets” and you should see your assets
🚨 Important notes
🆚 Provision vs Collection
The data or information that we entered during this chapter is recorded in OpenGate as Provision Information in Provision Data Streams (OpenGate standard or custom data streams from your datamodels). This means that this information is entered by someone and is not collected from the device.
The data collected directly from the device through the south API, passing through all the workflow that we discussed in the OpenGate Introduction (Connector functions, Rules, and so on) is recorded in the platform as Collection data streams datapoints.
IMPORTANT: This functionality allows you to distinc the information provided vs the information collected, and is a powerful tool, because cometimes the inventory information differs from the collected information and you may detect missmatchs between the information of your entities what you think you have and the information that the entities realy have.
⚠️ Using bulk for delete
Is posible to use the provision functions to delete entities but remember… some actions that you perform on OpenGate sometimes can not be undone…
We provide you this two examples for provision functions to delete entities to clean your workshop entities if needed.
You can download the javascript files and create new provision functions with the code provided:
Remember that OpenGate’s REST API offers all the functionality managed from the GUI so, for more control and automation, OpenGate’s REST API lets you create entities programmatically that is so powerful in serveral ways.
1. Prepare your provisioning JSON object according to the OpenGate schema.
For security concers, each OpenGate user, has its own API KEY. Your can obtain your API KEY directly from the OpenGate GUI.
Just go to the OpenGate web console and click on the top right user icon button, then click on copy next to APY KEY
Annotate this API KEY and… of course, do not share it with anyone…
3. Send the request to OpenGate.
Send the request to the provision endpoint: https://api.opengate.es/north/v80/provision/organizations/[YourOrganization]/devices/[YourEntityID]?flattened=true
4. 🎉 Entity created!
If you receive a 200 as response, all is fine, if not, fix the errors and repeat the process
🚀 When to use this method:
Ideal for backend integrations, automated deployments, or provisioning at scale when combined with external systems.
5. Data Collection
📡 Data Collection in OpenGate
Once entities and devices are provisioned, the next step is to start collecting data. OpenGate offers the OpenGate Device Emulator to simulate, ingest, and so check your OpenGate workflows in real time. This chapter focuses on how to send data to the platform, monitor its flow, and validate that everything is working as expected.
In our ongoing scenario, the IT team has already provisioned ambient and presence sensors across the warehouse and parking area. Now, they want to verify that these sensors are sending data correctly and that the platform is capturing it.
IMPORTANT: All the data collected using the OpenGate Device Emulator will be recorded as collection datapoints for the data streams that you use.
🧪 Simulating with the Device Emulator
OpenGate includes a built-in Device Emulator that allows users to simulate telemetry from virtual devices. This is especially useful during testing phases or when physical devices are not yet deployed.
For this tutorial we are going to:
Navigate to the Device Emulator section in the console.
Select one of our warehouse sensors.
Send test data for that sensor.
Repeat the process with a second device to simulate multiple inputs.
1. Navigate to the Device Emulator section in the console.
Go to the OpenGate web console and click on the left menu on “OpenGate Device Emulator”. We recommend you to choose a new tab using the nested button “NEW WINDOW”
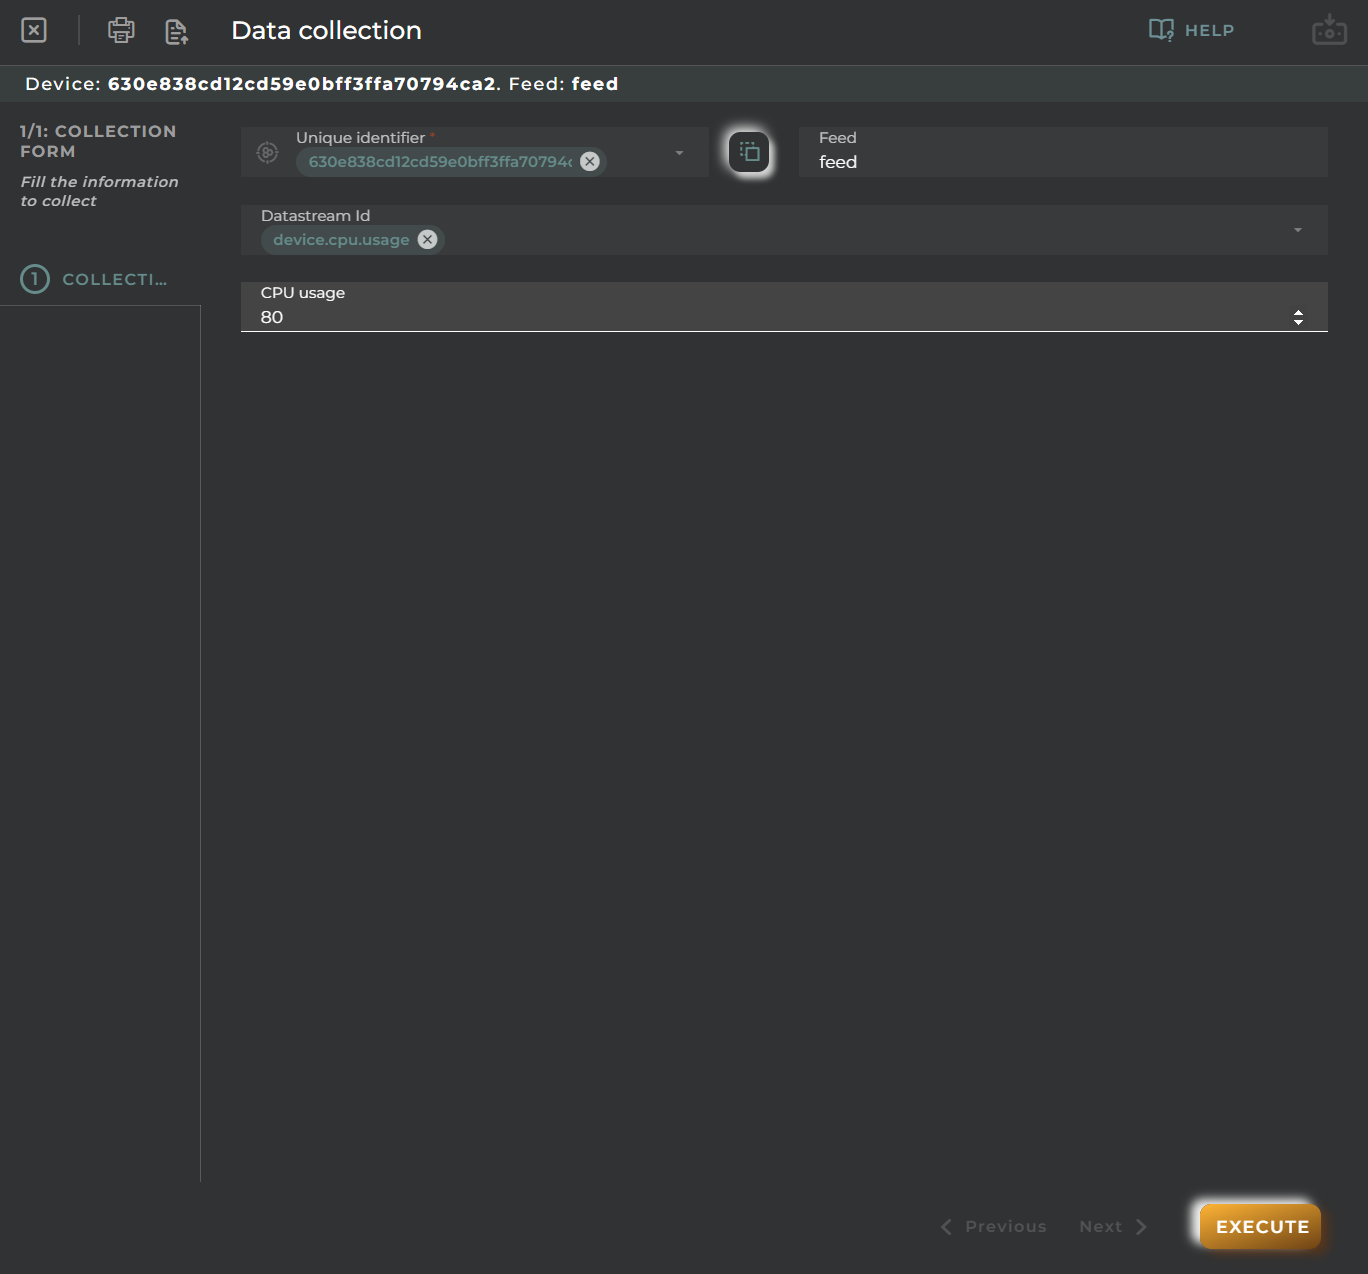
2. Collect data
Choose the entitiy to emulate. We will use [YourPrefix]-ws-stemp02 from our tutorial.
In this tutorial, this device represents a device with has temperature and humidity sensors
As you can see, there are some tabs to gives you access to powerful tools to emulate the device:
SYSTEM: This allows you to collect the OpenGate standard inventory data streams emulating the device
RECOLECTION: From here you can emulate the data streams collection that you want. We will use this in the tutorial.
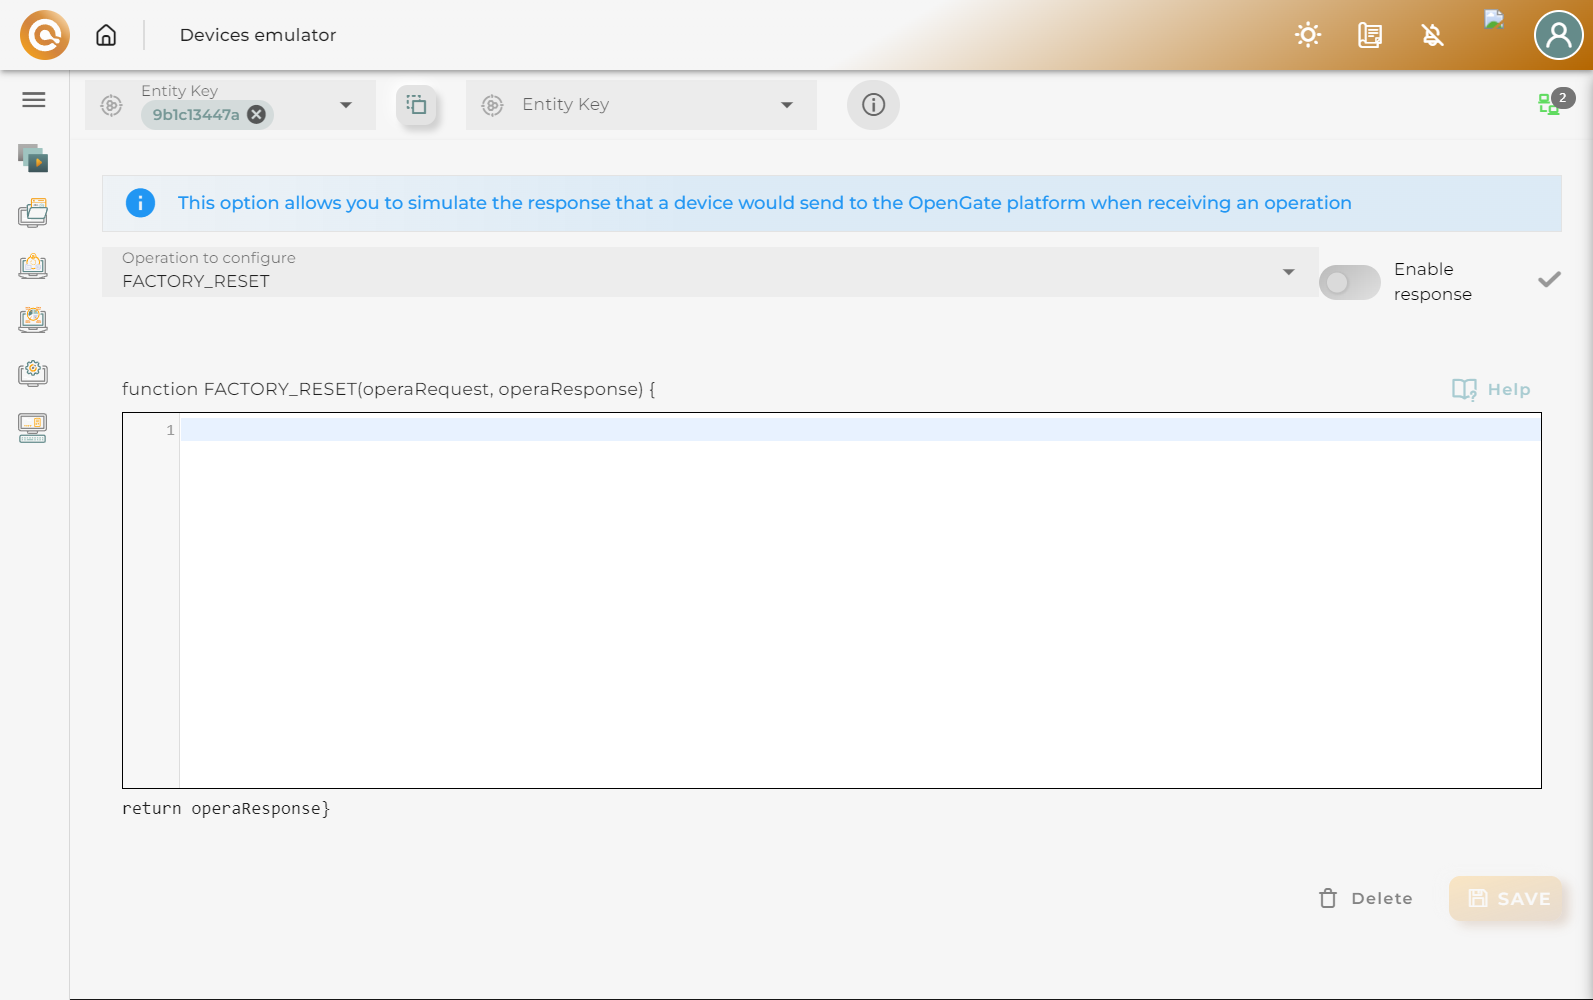
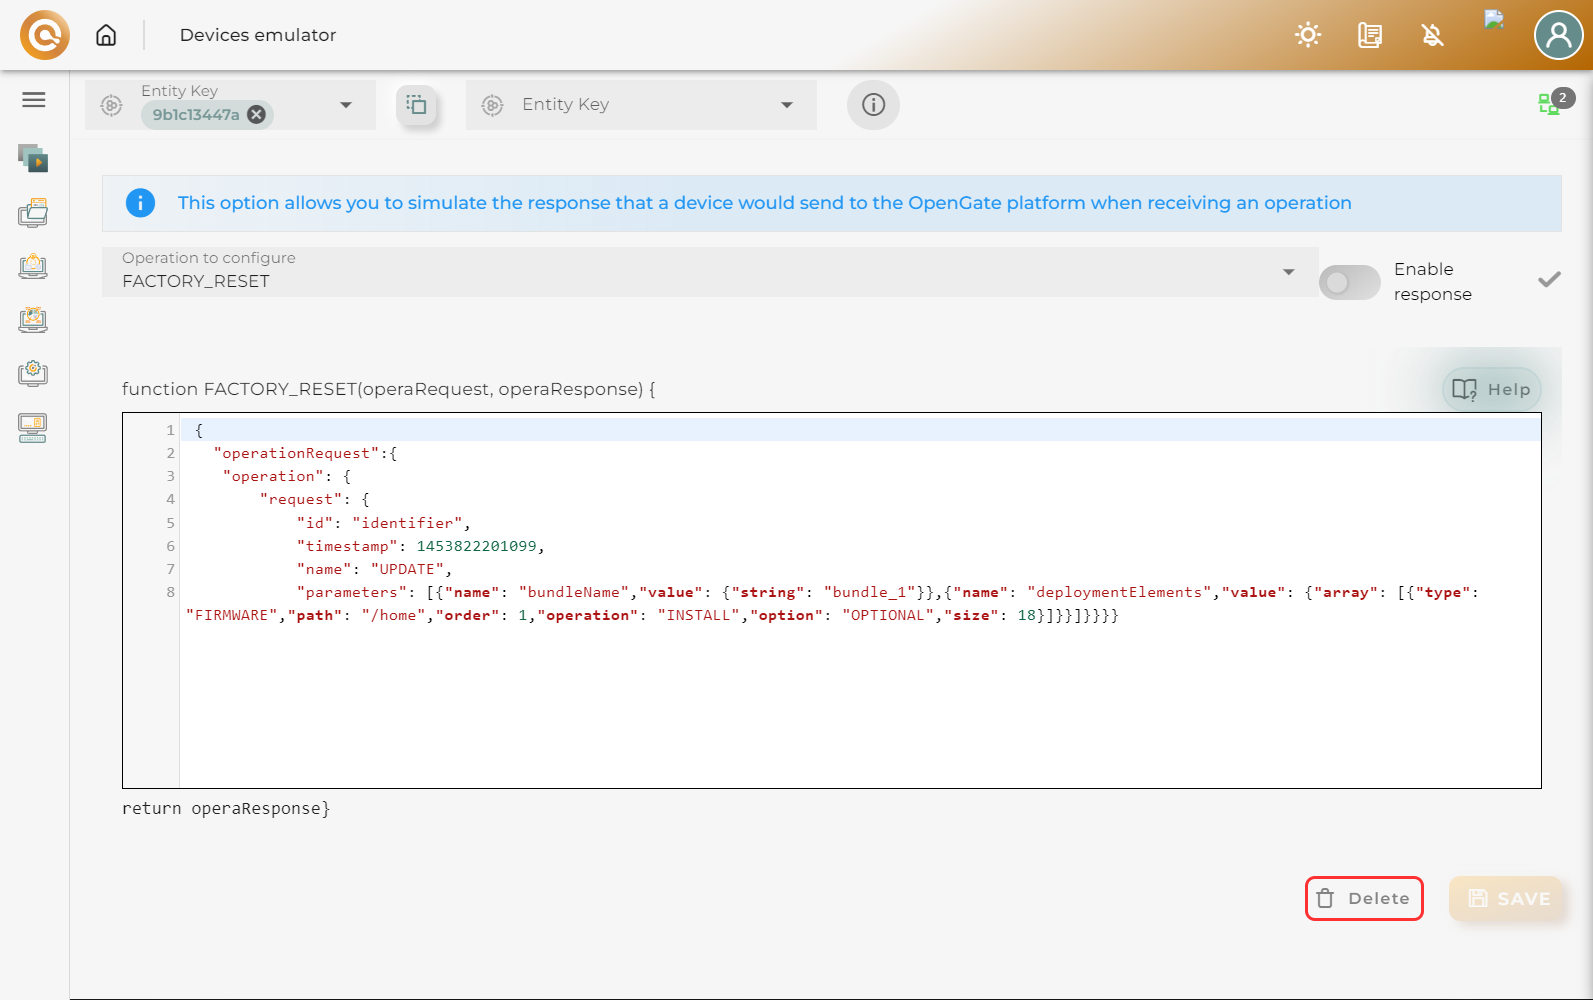
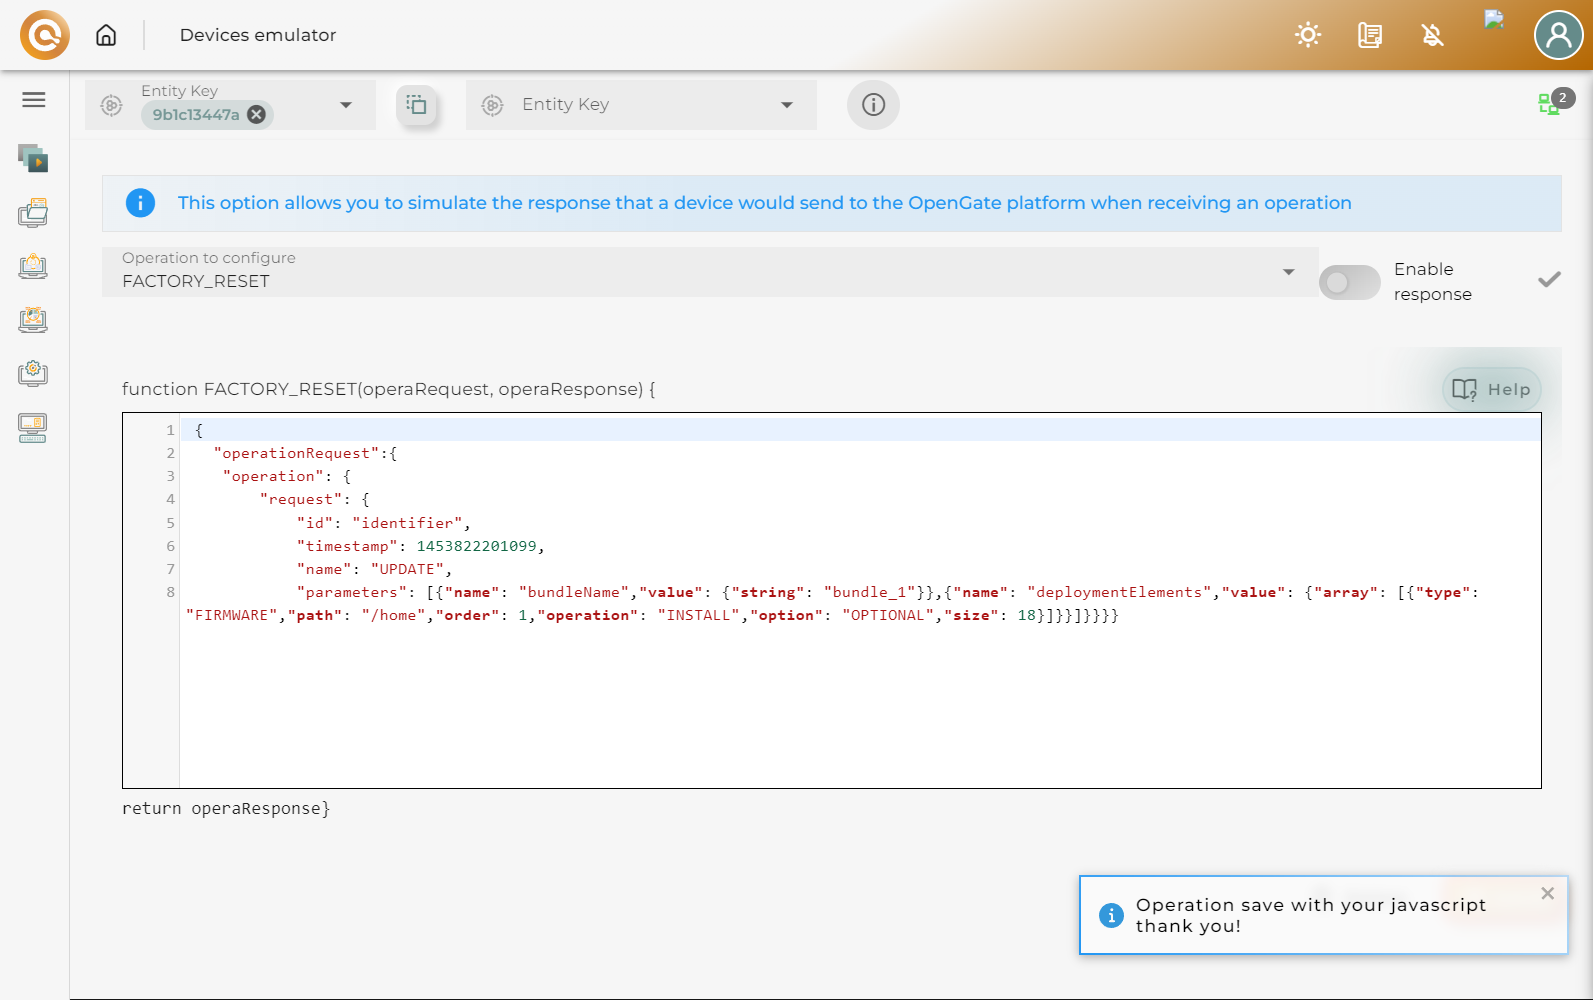
OPERATIONS: Here you can emulate the Operation Response from the device to check operations workflows.
MAP: This allows you to collect a location event directly from a map.
For this tutorial, we will use the “RECOLECTION” tab to send some basic data collection for our data streams.
click on “RECOLECTION” tab, then enter temperature and humidity in the “Datastream id” box.
This add to the collection data form, the datastreams selected so you can enter some value
click on “SEND DATA and choose “Once Now” to send one collection event. You may use the emulator as periodic event generator using “Once Every” option, but for this tutorial, we just need to send one value.
Click on “SEND DATA” and a confirmation message appears:
3. Send more data!
Now choose the entitiy [YourPrefix]-ws-spres02 from our tutorial, this represents a presence sensor.
Just choose presence datastream and check the box to record a “true” value for presence detected.
Click on “SEND”, and “SEND ONCE” as the last time.
📊 Viewing Data in Entity Panels
Once data is received, it can be visualized directly in the Entity Details Panel. Let’s view the data and relationship between entities and assets
1. Checking data is received in devices
Go to “OpenGate Managemenet > Devices” and click on the menu for “[YourPrefix]-ws-stemp02”, then choose “Entity Details Panel”
Here you can see the last value for the data streams that we use for the test: temperature and humidity:
Now repeat the process for [YourPrefix]-ws-spres02 and check that the “presence” value is collected in the data stream.
You will see something like this:
2. Checking data is populated to the asset
As you may notice, both devices [YourPrefix]-ws-stemp02 and [YourPrefix]-ws-spres02 are related with the [YourPrefix]-ws-room02 asset. That means that both devices are present in the same room of our warehouse and then both devices provide data about the status of that room, so the data of bothe devices will be populated to the asset
To check this, just go to “OpenGate Management > Assets” and click on the menu for the [YourPrefix]-ws-room02
As you can see there are some relevant information here… On one hand, you can see that the related devices for that asset are [YourPrefix]-ws-stemp02 and [YourPrefix]-ws-spres02 and, additionaly you can check that the data collected for that devices, is recorded also for the asset so you we have values for temperature, humidity and presence.
🧠 Pro Tips
Using the emulator to simulate devices helps you to test dashboards, connector functions, rules, operations and so, the entire OpenGate workflow that you are configuring. You can also combine emulated data with real devices to validate hybrid scenarios.
On the “RECOLECTION” tab, you can IMPORT/EXPORT a JSON file with the datastreams and values to use so you may prepare different sets of data to work in a more efficient way.
The exported JSON from the “RECOLECTION” tab, works directly using OpenGate South API collection endpoint. Just paste the JSON on the POST request body to test it!
6. Connector Functions
⚡ The Superpower of Connector Functions
What if your devices don’t follow the OpenGate standard message schema?… Use Connector Functions.
Connector Functions are one of OpenGate’s most powerful features. They allow you to transform, enrich, and adapt incoming data so it can be properly collected and processed by the platform.
Whether your devices send custom payloads, use different field names, or require preprocessing, Connector Functions give you the flexibility to make it work.
🧪 Connector Function Example
Let’s walk through a practical example. We’ll create a Connector Function to receive a JSON payload using the OpenGate Standard HTTP connector and adjust it to collect the values correctly.
🔧 Step 1: Create the Connector Function
1. Open the wizard
Go to OpenGate Management > Connector Functions and click on New Connector Function.
2. Fill administrative data
Let’s configure our Connector Function administrative data:
New Connector function?: In case we have others we could clone another as template, but this is our first one, so click on New Connector function
Name: for this tutorial, use testCF
Operational Status: You can choose if you want to enable or disable this CF, choose Production
Type: We said that is a superpower because not only we can use the Connector Functions to collect data. We can use it to manipulate operations request or responses. For this tutorial, choose COLLECTION
3. Configure criteria
This allows you to decide what of the available protocols will activate this Connector Function and the URI to use as target by the devices collection process. For this demo, we will use https:// and for the URI enter: testCF. As you can see, our endpoint will be https://api.opengate.es/south/v80/devices/{deviceId}/testCF where {deviceID} must be replaced by the device identifier.
4. Definition, Let’s Coding!
All the power of JavaScript and a lot of predefined functions and connectors are available for you to build your connector function.
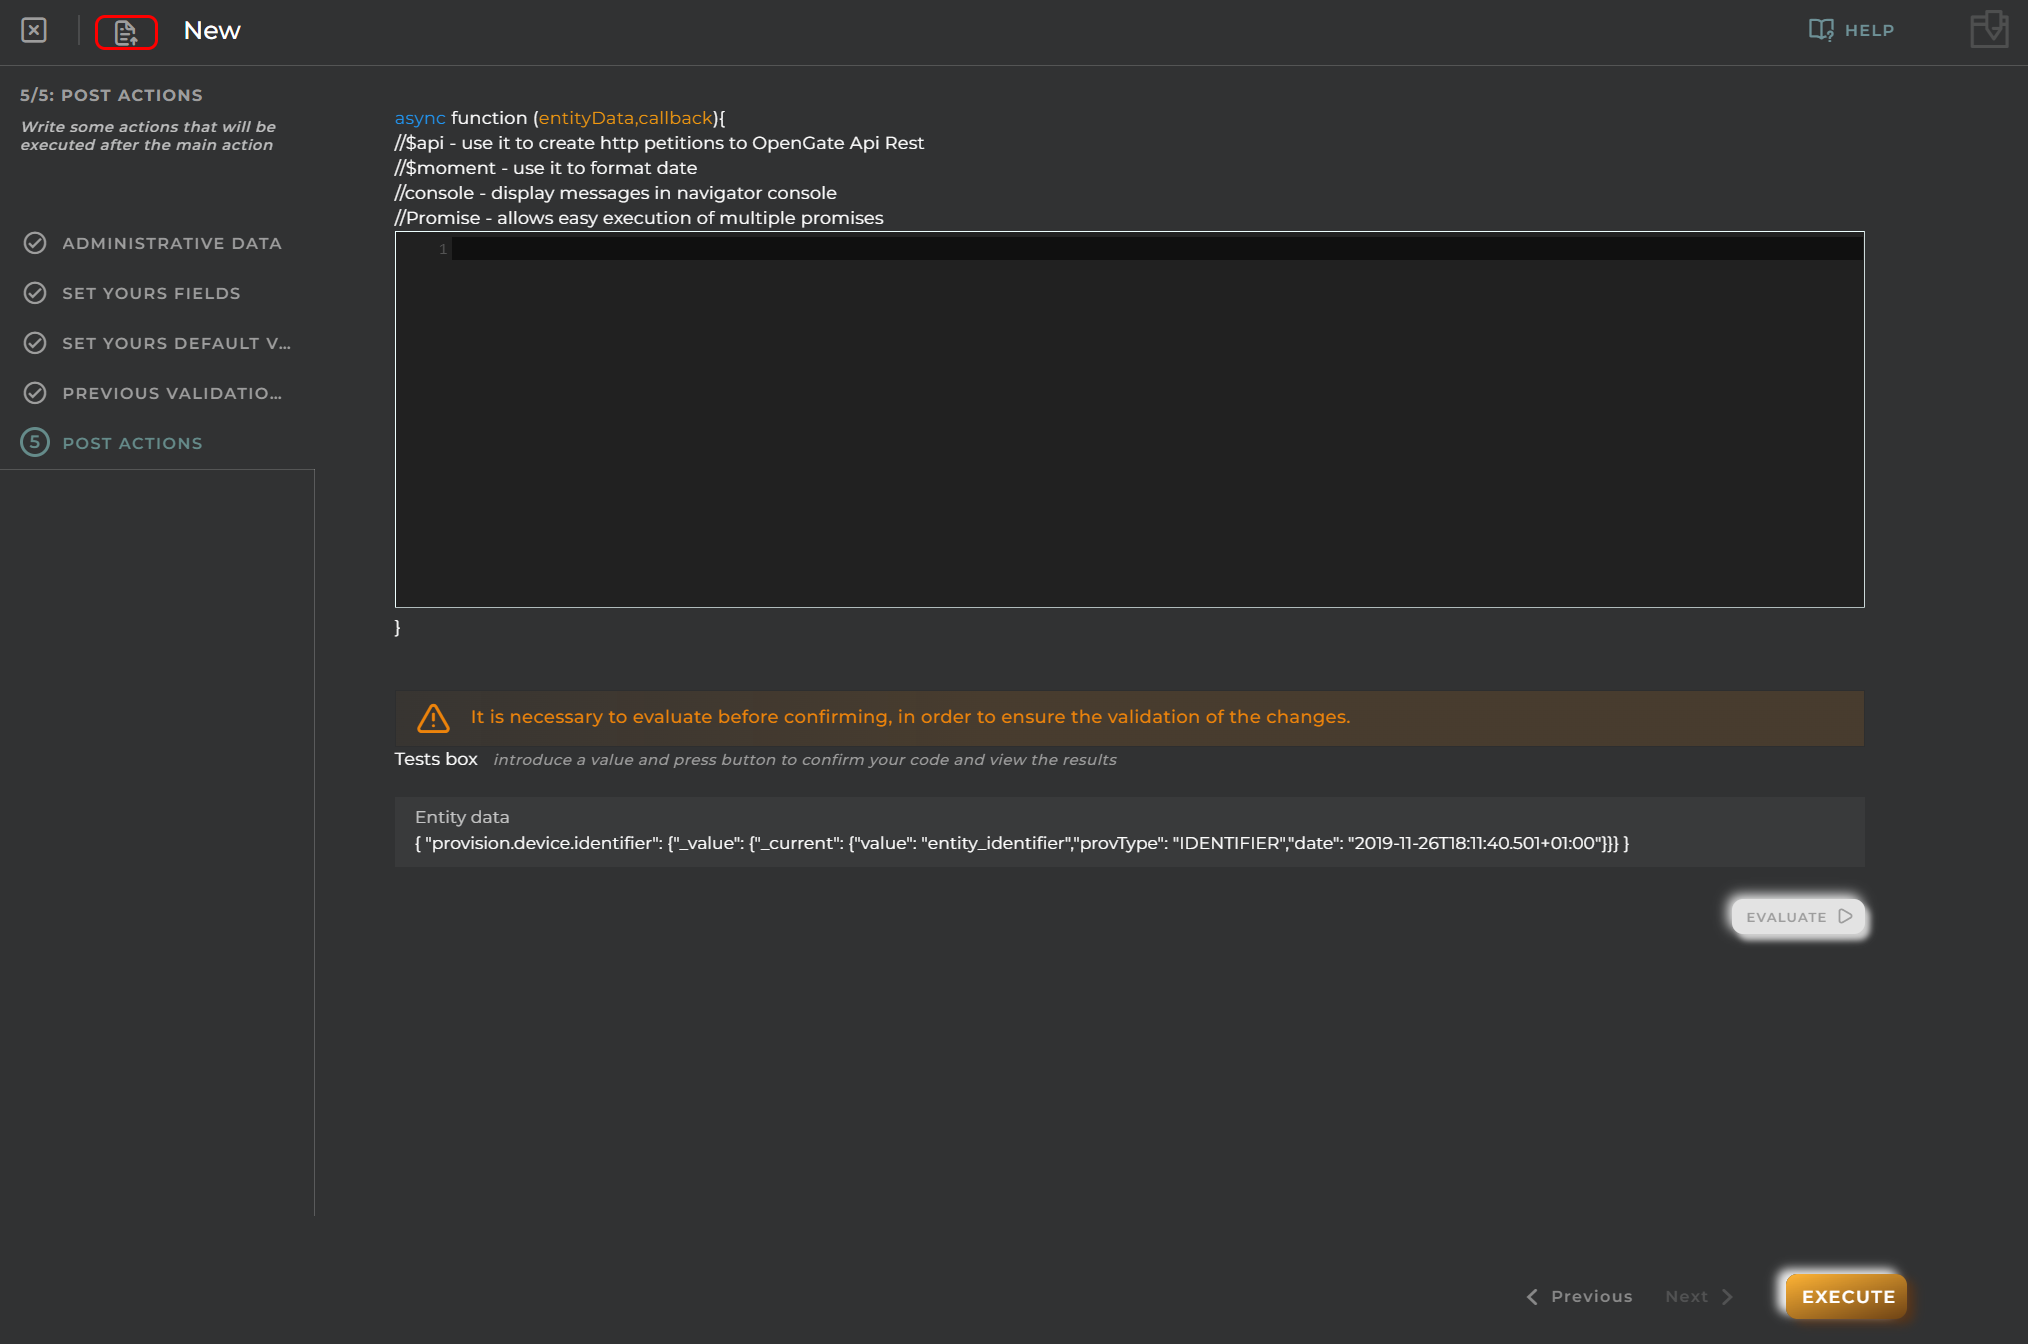
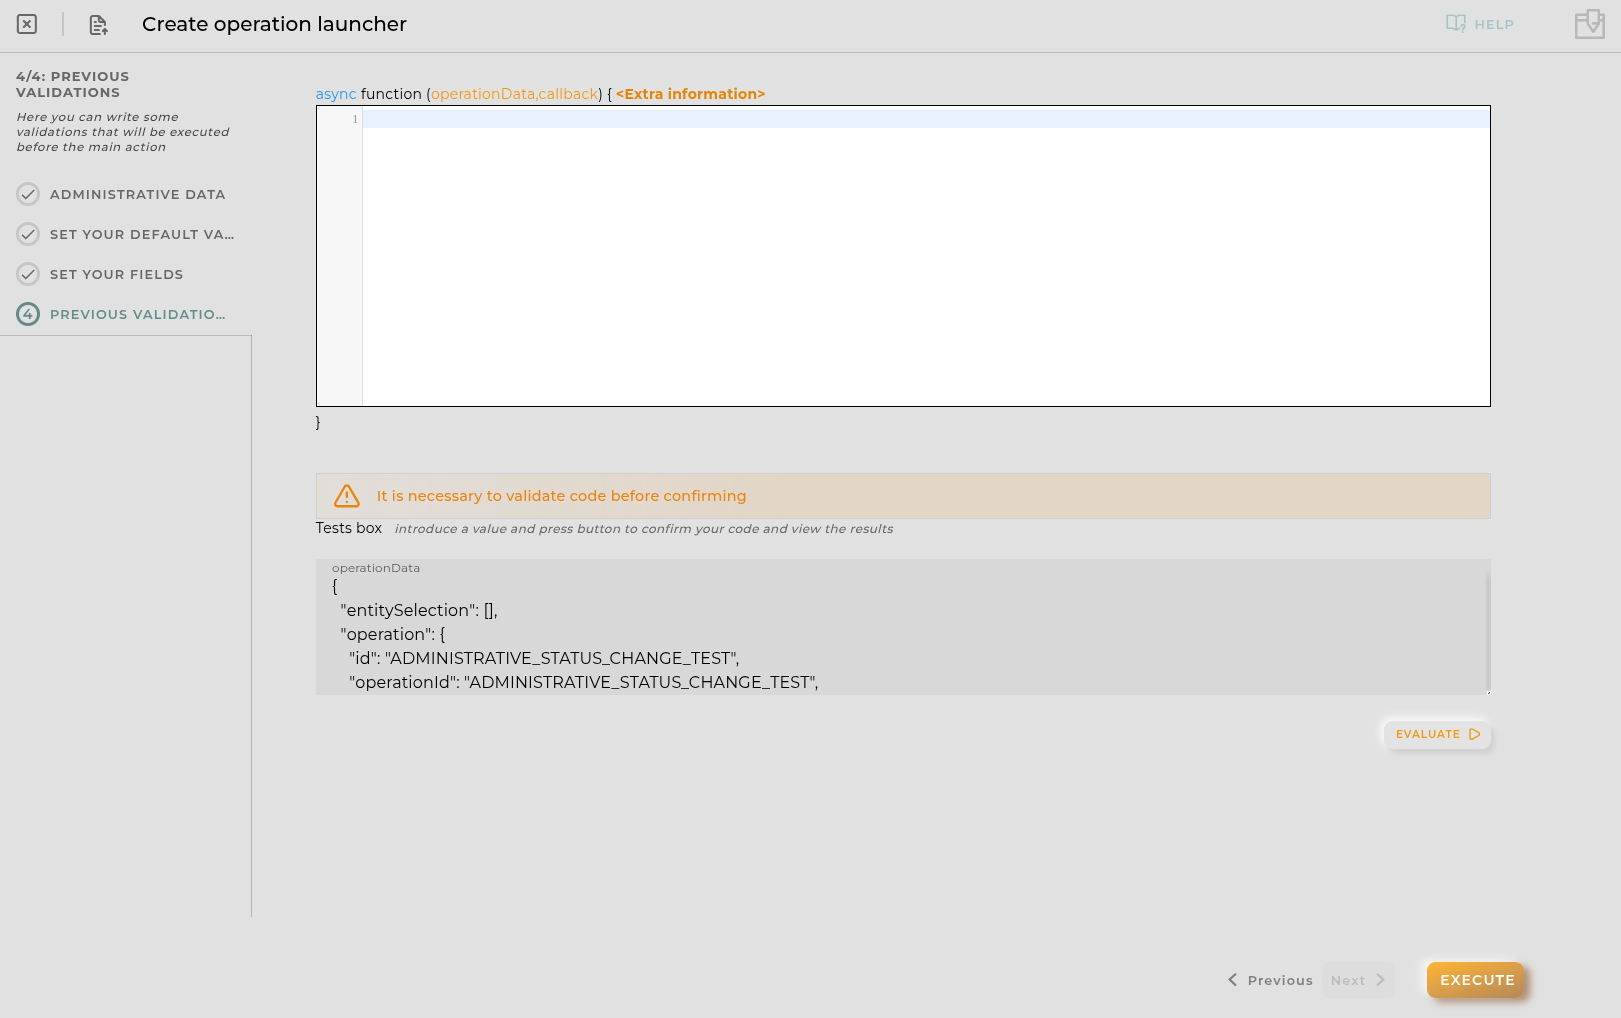
For this tutorial, the idea is to show you the power of this functionality, so let’s code a basic connector function that take the values of the payload (we will see later the payload and collect them to the device datastreams).
Check the code below, read the code comments to better understanding:
// Connector function start
// We have vailable the "entity" information which triggers the Connector Function so we can extract some data from it
constorgID=entity._value('provision.administration.organization');
constentityID=entity._value('provision.device.identifier');
vardate=new Date();
consttime=date.getTime().toFixed(0);
//The OpenGate "logger" is available for you to use with some levels like DEBUG or TRACE
logger.debug('Executing Connector Function...');
logger.debug('Payload received in ORG: ', orgID, 'for entityID: ', entityID, ' - payload: ', JSON.stringify(payload, null, 2));
// Datapoint collection using payload data
collection.addDatapoint('temperature', payload.temp, time);
collection.addDatapoint('humidity', payload.hum, time);
collection.addDatapoint('presence', payload.pres, time);
logger.debug("CF will collect the following: ", collection);
//Send the collection object with the datastreams information
collection.send()
Use this code, copy and paste into the code box and click on “VALIDATE CODE”
⚠️ IMPORTANT: Choose JSON as Payload type in the top part of the screen and click on validate code. Then, go to the next step.
5. Review the summary and EXECUTE!
You can check what we will do with this connector function from the summary. Click on “EXECUTE” to save it.
🐞 Step 2: Prepare for Debugging
Now that we have created our Connector Function, we want to ensure that it works so, for that OpenGate offers the possibility to debug it directly on the platform. We need a couple of things…
1. Use a Test Device
Remember our first device: [YourPrefix]-ps-001?
We’ll use it to test the connector function.
Go to OpenGate Management > Devices
Click EDIT from the entity menu
In the wizard:
Set Administrative Status to TESTING
Set Operational Status to TESTING
Click EXECUTE
2. Open Connector Function Logs
Go to OpenGate Management > Connector Functions
Click on OPEN LOG for your connector function (testCF)
In the log viewer, set the log level to DEBUG to see detailed execution traces that we configured previously.
🔌 Testing with the OpenGate REST API
OpenGate’s REST API provides full access to platform functionality, including data collection. The endpoint used by the Device Emulator is the same one your physical devices will use via the HTTP connector.
1. Prepare Your JSON Payload
For this tutorial, use the following example payload:
{
"temp": 23.5,
"hum": 48,
"pres": true}
2. Retrieve Your API Key
Each OpenGate user has a unique API key for authentication.
Go to the OpenGate Web Console
Click on your user icon (top right)
Copy your API key from the dropdown
⚠️ Important: Keep your API key secure and never share it.
3. Send the Request
Send a POST request to the collection endpoint replacing {{Device-ID}} with [YourPrefix]-ps-001:
If the response status is 201 Created, your data was successfully received.
📋 Check Connector Function Logs
Return to the Connector Function log viewer and inspect the execution trace.
If the function ran successfully, you’ll see the transformed payload and confirmation of data collection.
📊 Validate in Entity Details
Finally, go to OpenGate Management > Devices
Open the Entity Details Panel for the device "[YourPrefix]-ps-001"
You should see the collected values displayed in the corresponding datastreams.
🚀 Why Connector Functions Matter
Connector Functions are more than just a technical feature — they’re a gateway to flexibility, interoperability, and control.
In real-world IoT deployments, data rarely arrives in a perfect format or the firmware devices cannot be manipulated. Devices from different vendors, legacy systems, or custom firmware often send payloads that don’t match the expected schema. Without Connector Functions, this would mean costly integrations, manual preprocessing, or limited compatibility, as well as generate and deploy new software versions when devices or firmwares change…
With OpenGate’s Connector Functions, users can:
🧠 Transform incoming data to match their datamodels, regardless of origin for different supported protocols (HTTPs, COAPs, DLMs, etc.).
🧩 Enrich telemetry with metadata, calculated fields, or contextual information and fill other datastreams with values calculated in processing time.
🔄 Normalize formats across heterogeneous devices and protocols.
🛠️ Adapt to change — update logic as devices evolve or business rules shift directly from the OpenGate Web Console.
📈 Accelerate onboarding by removing friction between device and platform, or additional services.
Whether you’re integrating industrial PLCs, smart meters, or custom-built sensors, Connector Functions empower you to make OpenGate work for your data — not the other way around.
💡 Pro Tip: Use Connector Functions to build reusable logic across multiple devices or projects. They’re not just a patch — they’re a strategic tool for scalable IoT architecture.
7. Workspaces & Dashboards
🧭 Workspaces & Dashboards in OpenGate
In the previous steps, we’ve covered everything needed to collect data in OpenGate and make information from devices and assets available on the platform. We’ve provisioned entities, configured datastreams, and started receiving real-time data even adjusting the data using Connector Functions.
Now it’s time to shape that data so we can work with it effectively and build our IoT solution on top of OpenGate. To do this, we’ll use Workspaces, which allow you to visualize, organize and build your solution areas, and Dashboards, where you usually work to monitor, explore, and interact with entities data in real time.
A Workspace is a container that organizes dashboards around a specific context — such as a location, a functionality, a project, or a team.
A Dashboard is a visual canvas within a workspace, composed of customizable Widgets that display data from entities, datastreams, or assets and allows you to interact with your entities.
Widgets are the building blocks of dashboards. OpenGate has a huge catalog that includes customizable tables, maps, charts, gauges, HMIs, and more — each designed to present data in a specific format.
📌 Note: Workspaces can be shared with other users in your organization. This allows administrators to create curated views and make them available to operators, analysts, or any users group.
🏗️ Creating a Workspace and Dashboard
Let’s continue with our ongoing warehouse scenario. We’ve already provisioned sensors and collected data. Now, we’ll create a workspace and dashboard to visualize that information.
🗃️ Step 1: Create a Workspace
Go to OpenGate Management > Workspaces, you can open in new window
Click on New Workspace
Now fill the information required and click on “OK”:
Name: Use Warehouse Monitoring
Description: Enter something if you like, for example: Our awesome IoT solution
Choose an icon: OpenGate has a huge predefined library, use ogicon-industrial
Visualization: Check “Show at home” to be able to see this workspace on the home screen.
Banner: It is possible to redefine the banner or background image, keep it blank for this tutorial
👏 Done! OpenGate redirects you directly to the new workspace view
📊 Step 2: Create a Dashboard
Let’s continue. Inside the workspace, you just need to click on “+ NEW DASHBOARD”
Now, we need to configure our dashboard. For this tutorial we fill the following data.
Name: use Warehouse Overview
Icon: choose one, for example ogicon-WD
Image: Use default or something like this: 🖼️warehouse.jpg
Click on “OK” and your new dashboard is created
🧩 Adding Widgets
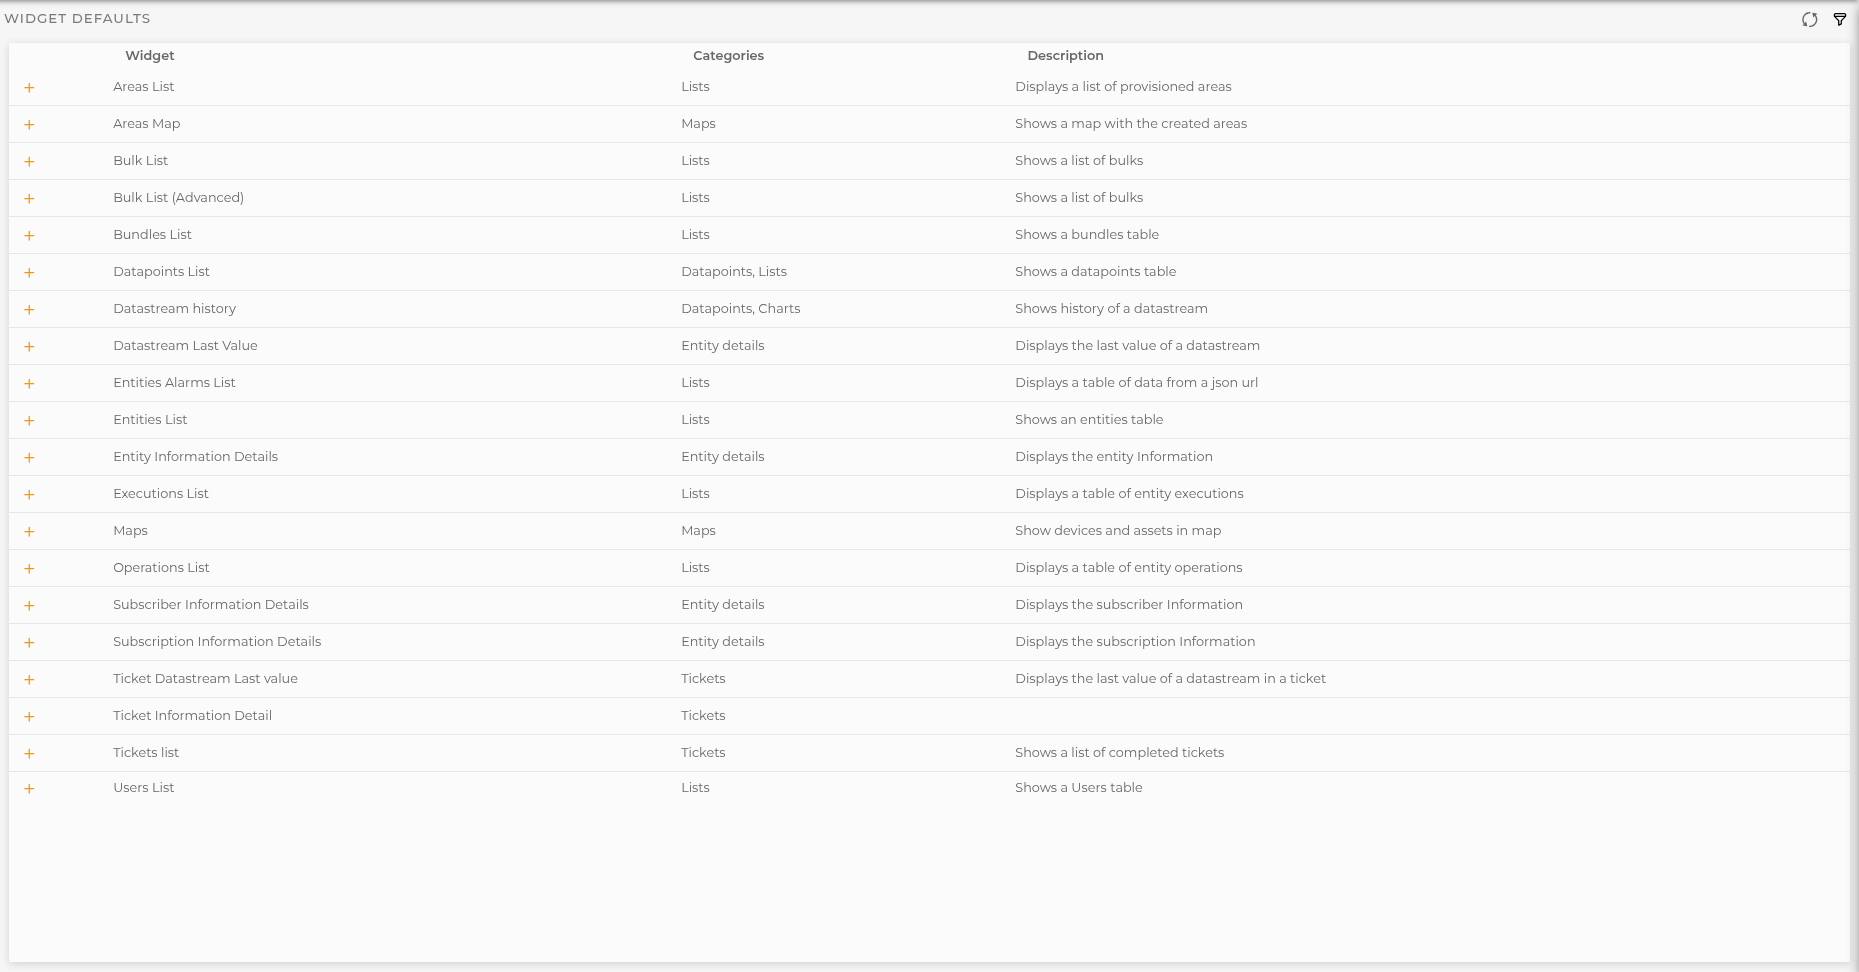
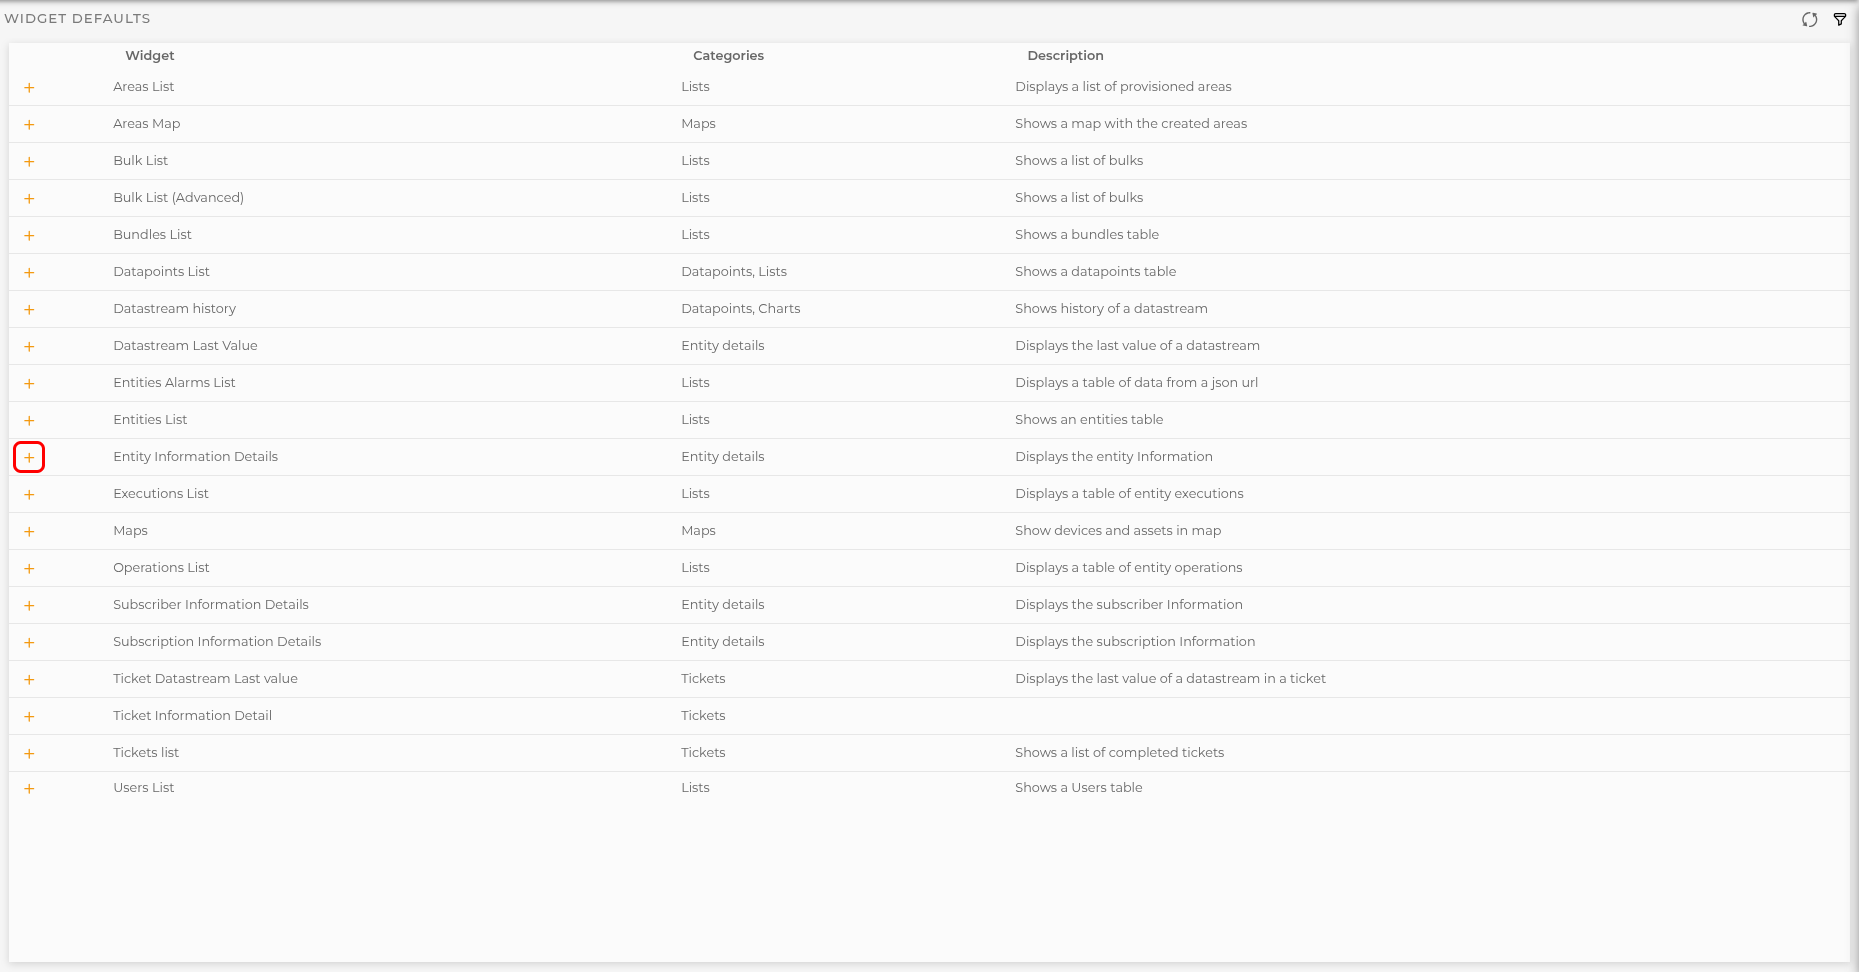
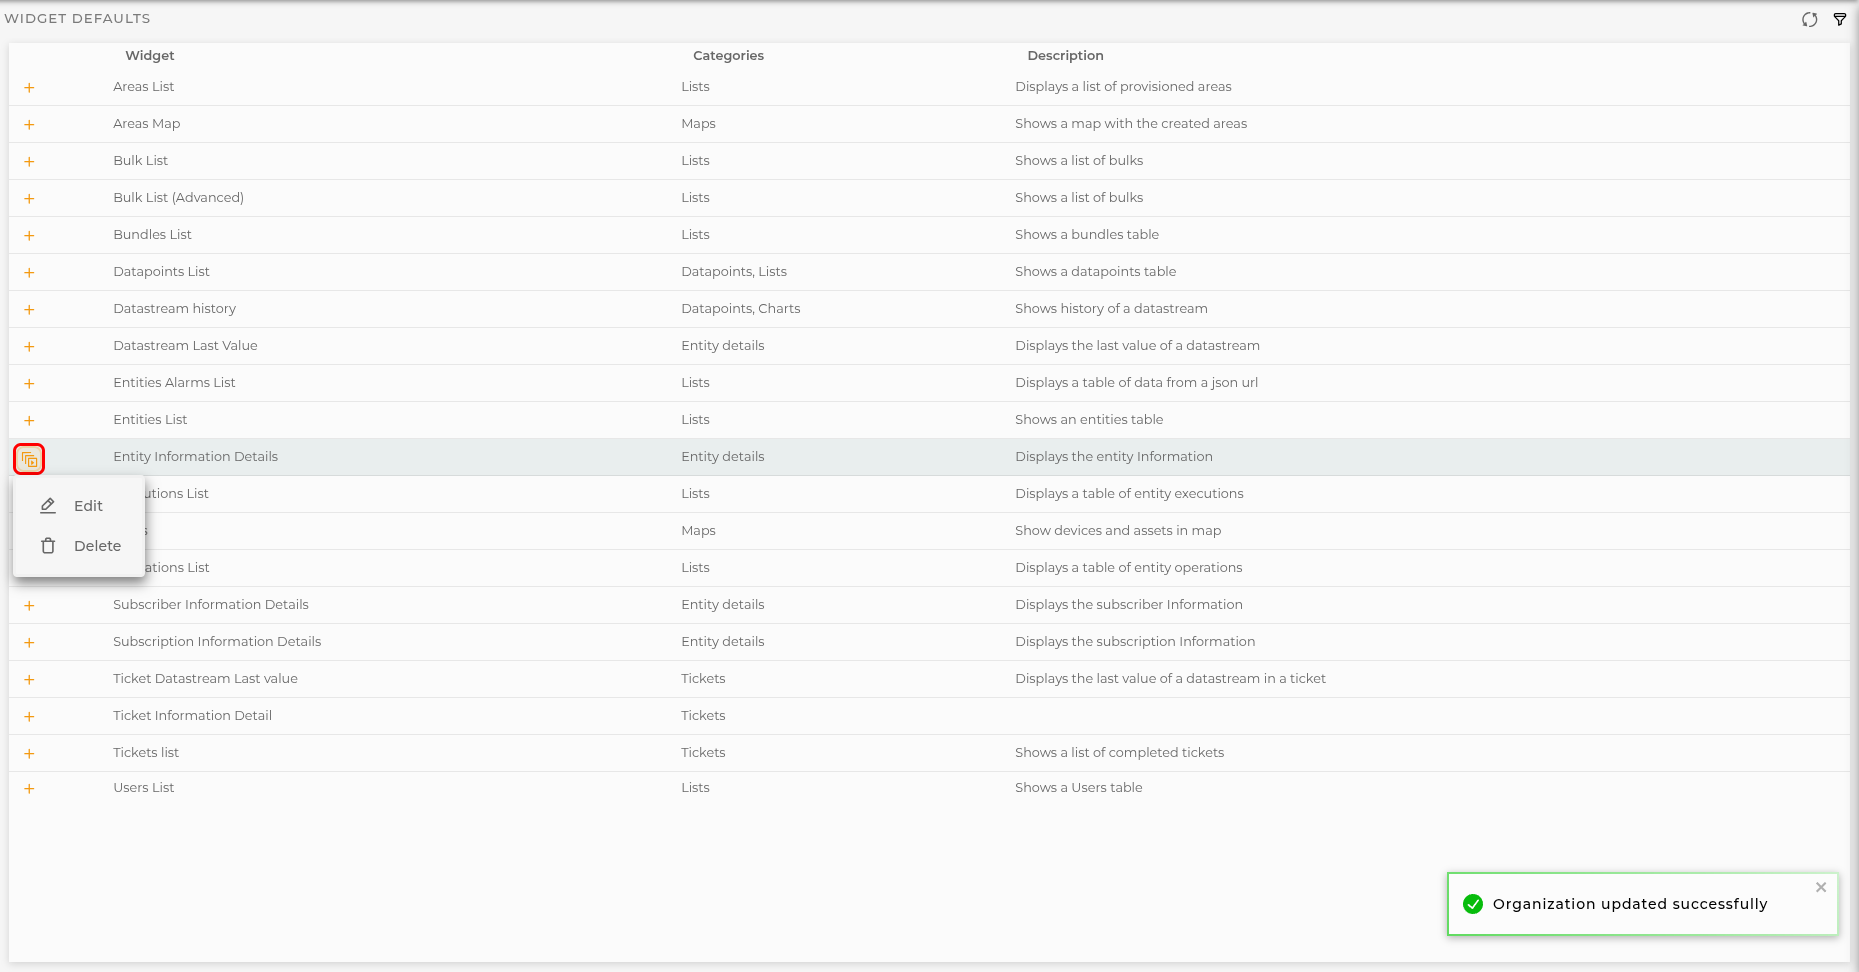
Empty right? Let’s add two basic widgets to visualize our data. click on “Add Widget” and check the catalog
📋 Entities list widget
This widget is a table which shows entities in table format we will use this to show all our entities and its more relevant data.
Click Add Widget and look for Entities List
Click on “Add” and the widget configuration appears. Let’s configure our new widget.
For this tutorial, we will focus in the warehouse rooms, so fill the following:
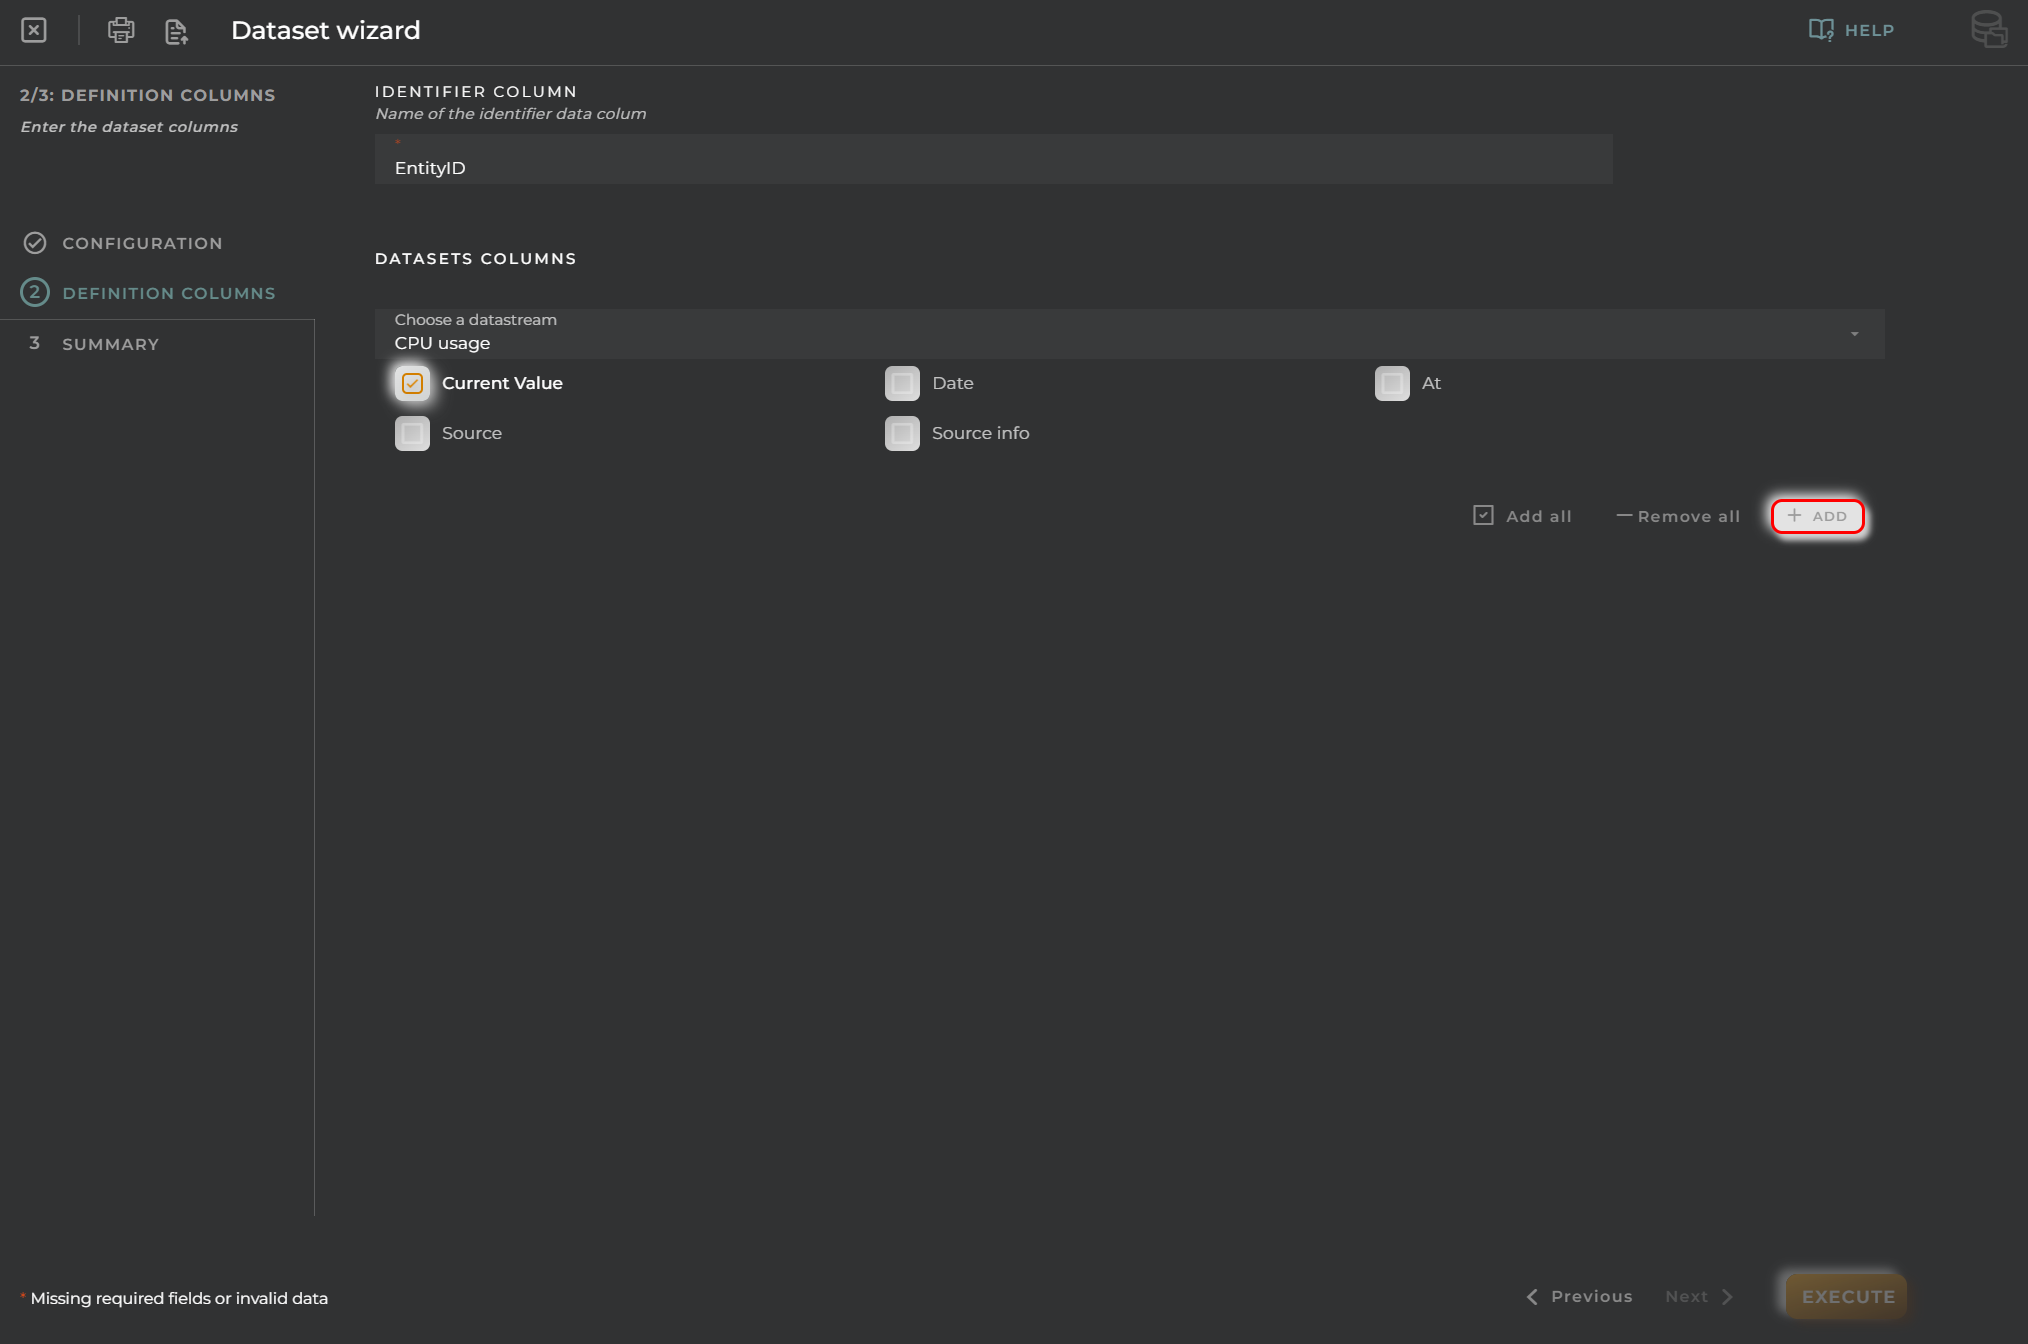
SELECT COLUMNS TO ADD: This allows you to indicate what columns you want to see. The information is selected from datastreams list, OpenGate standard and custom, for provision, and collection datastreams. Fill this with: temperature, humidity, presence from our datamodel “warehouse” and provision.device.specificType, provision.device.identifier, provision.asset.identifier from the OpenGate standard data models. You can choose what datastream property show in the table. Check on “Current Value” and click on “+ ADD”
PAGINATION: The standard value is 10, change it to 20.
Then you will see the columns that the widget will show. Keep it as is, but you can change some things such order, name or apply formaters, we will see this later
Save the widget and the widget will be added to the dashboard automatically.
Use the bottom-right arrow icon on the widget to adjust the widget size, and click on “SAVE” icon in the Dashboard toolbar.
🎉 Congratulations you have your first dashboard with one widget!!!
🗺️ Map Widget
Let’s continue by adding a map widget.
Like you performed before, click Add Widget and choose Maps
The “Maps” widget is another powerful tool that can be configured to show a lot of customizable information of your entities, directly over a geolocated map. For this tutorial, we keep the widget as default. But lets review what the widget will show:
“provision.device.location”: This marker represents the provision location of a device
“entity.location”: This marker represents the location collected for a device
Save the widget and move it to the right part. Try to achieve this
✅ Finish your work
I know, I know… we did not enter the location for all devices, but you can do it with what you have learned in this tutorial.
I give you a clue, you can do it in two ways depending on the information that you want to represent:
Use OpenGate Device Emulator, to collect the location of the entities
Use EDIT device option, from the menu of each entity in the widget table, to provision the location of the entities
Use both if you wish and refresh the dashboard, now you see the map position. Enjoy the Maps widget, move around, CNTRL+SCROLL to zoom in/out, and click on some device to see its information. Look this:
🔍 Applying Filters
We have configured a great dashboard, but we can adjust it to refine the dashboard view.
Because we want to use this dashboard as “Warehouse Overview”, we’ll create a basic filter to only see our warehouse rooms information.
🧮 Filter the “Entities list” widget
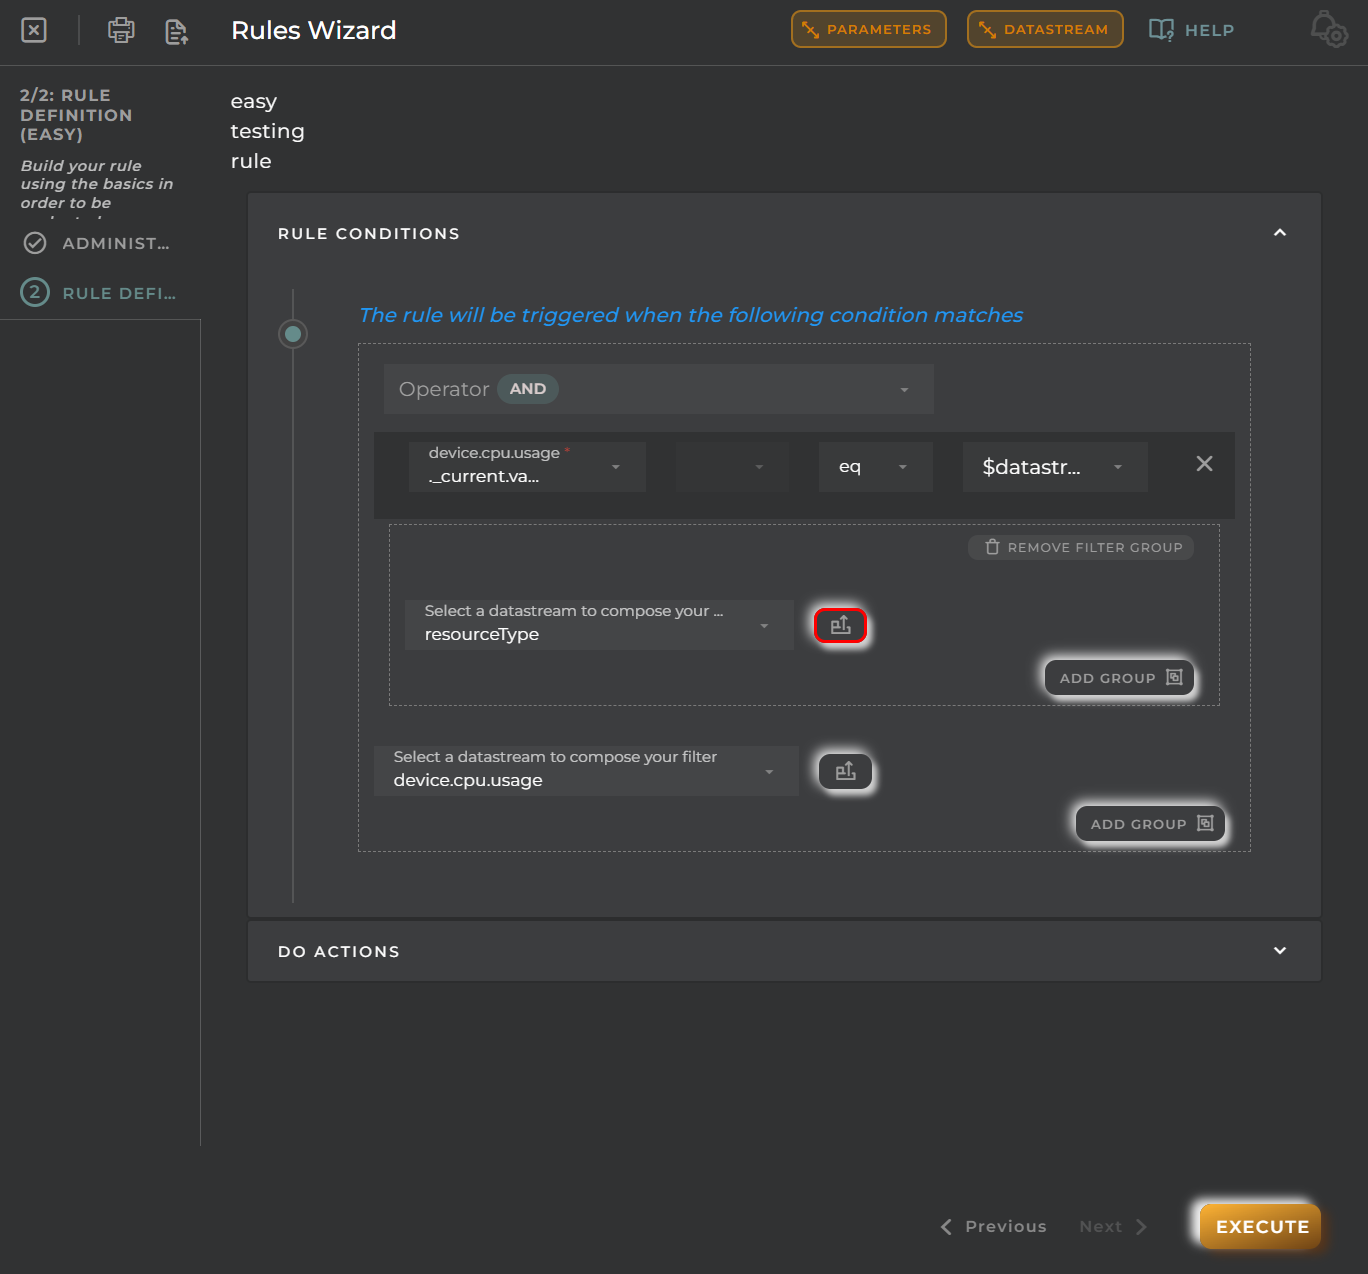
Remember, these entities are assets. The entity type is recorded in OpenGate standard datamodel using ‘resourceType’ datastream.
So that, lets reconfigure our widget to apply a filter:
Open the widget configuration from the widget menu:
Go to the “ADVANCED” tab and click on “Private filter”
Choose resourceType and click on “ADD CONDITION”
Choose “eq” (that means equals) for the condition operator, and fill entity.asset in the value. Click on “APPLY FILTER”
Let’s do a couple of things more.
Add a new column using asset.identifier datastream and choose at. This will create a new column that shows each time some asset information is updated by one of its related devices. Edit it and change its name to Last coms.
Remove columns provision.device.specificType and provision.device.identifier, note that these datastreams are relevant for devices, not for assets, so we can safely remove them from this view!
You should have something like this:
Click on “SAVE” to apply the changes. The widget will now display only assets, with the updated column layout
This will ensure that only assets (not devices or other entities) are shown in the dashboard.
🗺️ Do the same with the “Map” widget
Repeat the job with the map widget. All OpenGate widgets have similar configuration options so you know what you need.
You should accomplish something like this. Only the information from your assets is visible:
➕ Want more?
Repeat all the process and create another entities List widget filtered to show only devices and change the widget names to achieve this dashboard:
🎨 Applying Formatters
Although this may not be part of this basic tutorial, we think that will be relevant for you to know about this feature… Let’s improve our dashboard to another level of customization using “formatters”. This allows you to customize with all the power of web development and its native technologies HTML, CSS and javascript.
Here you have infinite possibilities so for this tutorial we will do the following to our “WAREHOUSE ROOMS” widget:
Format dates: The ISO format is not for everybody. Let’s convert a raw ISO timestamp like 2026-01-01T12:00:00Z into a readable date.
Temperature colors: Apply a code color for temperature datastream values
Presence indicator: Remark the presence detected
NOTE: We assume that you have knowledge in web development, HTML, CSS and javascript.
📅 1. Format dates
Formatters are both simple to use and incredibly powerful. Let’s start with a formatter code to change date appearance.
Open the widget configuration and click on “formatter” on the column ‘Last coms.’
Paste the code below, click on “EVALUATE” to check code errors, and “OK” to save your changes
//check if we have a value for the datastream
if (value) {
vardate=new Date(value);
if (date=="Invalid Date"){
//the value is not valid
cellFormatter.customValue="---";
}
else {
//format dat to the locale string
cellFormatter.customValue=date.toLocaleString();
}
}
🌡️ 2. Temperature colors
Repeat the process with the column Temperature and the code below
if (value) { //If value exists
if (value<18){
// Cold
cellFormatter.style='color:lightblue;';
}elseif (value>=18&&value<22 ){
// ideal temperature... using custom green color
cellFormatter.style='color:#20BB38FF;';
}elseif (value>=22){
//more than 22 ºC is hot...
cellFormatter.style='color:red;';
}else{
//grey
cellFormatter.style='color:#808080;';
}
}
👁️ 3. Presence indicator
One more time. Edit column Presence
if (value===true) {
//You can change the cell value for a custom one and even use emojis 🎉🎉!!
cellFormatter.style='color:green;';
cellFormatter.customValue="<strong title='TRUE'>TRUE 🟢</strong>";
} else {cellFormatter.customValue="<span title='FALSE'>FALSE 🔳</span>";cellFormatter.style='color:grey;';}
🎉 4. Check the result
Click on “SAVE” on the widget configuration and check the result… Pretty powerful, right?
8. Operations
⚙️ Operations in OpenGate
Once your dashboard is set up and filtered, it’s time to take action. OpenGate allows you to send operations to your devices directly from the dashboard using the Operations feature. But first, we need to configure a few operations to make them available.
📚 Understanding the Operations
Before sending any operation, it’s important to understand how operations are defined and managed in OpenGate:
Operations are predefined actions that can be executed on entities (devices, assets, etc.).
Each operation includes:
A name and description and target entity types
GUI Form definition and STEPS
Optional parameters
OpenGate offers a predefined Operations catalog out-of-the-box for: Reboot equipments, power on/off devices, refresh_info, refresh_presence, firmware update through bundles, and more.
You can create your own custom operations, but we do not deeper in this basic tutorial.
🛠️ Configuring a Sample Operation: REBOOT
Let’s create a simple operation to reboot a device. This Operation already exists on the OpenGate Operations catalog and it is a good approach to learn how operations work.
1. Create the REBOOT Operation
Go to OpenGate Management > Operations and click on “+ Create Operation”.
Click Clone from catalog and choose REBOOT_EQUIPMENT. Keep data as default and click on next
Name: REBOOT_EQUIPMENT
Title: Reboot Equipment
Check Operation configuration.
JSON Schema, Another powerful tool: OpenGate allows you to define custom Operation Wizards using JSON Schema forms.
Additionally, the “Operations” allows you to define STEPS. Because some actions may require a complex workflow in your devices, we design this method so you can notify the platform from the device when each step is completed or failed and then register the full operation traceability on the platfom. For this tutorial, because we used the “clone the operation” before, this operation has only one step and you cannot modify it.
Preview your JSON Schema Operations form:
You can click on “PREVIEW” tab to check how your form will be displayed and even test it.
Just to let you know, this operation has only an input field component, to choose between “hardware” or “software” reboot type to be send to the device.
Create your operation and check the confirmation message on the summary
Perfect! you have created your first Operation successfully. Let’s launch it, right?
2. Testing with the OpenGate Device Emulator:
Do you remember our OpenGate Device Emulator?? We can use it to emulate also operations responses from devices and test our operations workflow.
Open the OpenGate Device Emulator in a new window
Select one of our devices, for example the device [YourPrefix]-ps-001. and go to the “OPERATIONS” tab
Configure the responses. Fill the following information and click on “SAVE”:
Choose Operation: REBOOT_EQUIPMENT
Check the “ENABLE RESPONSE” option. This indicates if Device Emulator must respond or not
Copy/paste the code below to respond the operation request:
operaResponse= {
"operation": {
"response": {
"name":"REBOOT_EQUIPMENT",
"timestamp": Date.now(),
"resultDescription":"Success",
"steps": [
{
"timestamp": Date.now(),
"description":"The system will be rebooted",
"name":"REBOOT_EQUIPMENT",
"result":"SUCCESSFUL" }
],
"resultCode":"SUCCESSFUL",
"id":operaRequest.operation.request.id }
},
"version":"1.0"};
Now keep open the OpenGate Device Emulator log and return to our dashboard “Warehouse Overview”
🚀 Sending an Operation from the Dashboard
Now let’s send the operation from your dashboard and validate the result.
click on “EXECUTE OPERATION” in the device [yourPrefix]-ps-001 menu. This opens the Operation wizard
Choose our operation Reboot Equipment and click on “Next” (You can execute it directly, but then the predefined “HARDWARE” reset is send)
Choose SOFTWARE just to play with the component. There are more additional and powerful options in the wizard (you can review them with “next” button):
SCHEDULED: This allows you to decide when to execute the operation, Now, Later after some minutes or periodically. This last option converts this operation in a “Task” we will not cover this in this tutorial.
ADVANCED OPTIONS: Here you can configure Operation and Execution timeouts for this operation and even adjust optional parameters if the operation accept more.
But for this tutorial, we just keep them as default and click on the “EXECUTE”
The summary indicates that the operation has been launched
🧪 Monitoring Operation Results
After sending an operation, you can view its execution status and result.
1. Check Opengate Device Emulator log
Here you can see how the operation has been attended and processed by our emulator and the response is sent successfully to OpenGate
This confirms that our operation has been launched from the dashboard and then the device (our Device Emulator) respond to OpenGate.
2. Review in OSS - Operations Support System:
The final step is to check that the response is properly collected in OpenGate, but how?
Well, there is another more tool for you, “Operations Support System”, that allows you to check all your Operation executions. Of course, you can build your own dashboard using operations widgets that you will find on the catalog, but we want to offer you an out-of-the-box solution for operations management.
Go to the Operations Support System section of OpenGate, open in new window.
Click on “Operations List” and locate our operation (so easy, you should just have one…).
Because the operation is finished, Click on the menu and Device Execution List - Show history.
Click on Execution Details to inspect the execution traceability and result
Let’s review the Execution Details panel
From this panel you can check the summary result of the execution. Look the description “Success” that we coding in our OpenGate Device Emulator
Additionally, You can review the Steps tab, to check the times and result (remember that this operation only has one step)
Parameters tab shows what the user send to the device, we selected “software” during the wizard.
The last tab, Timing, shows a timeline with the execution times
💡 What’s Next?
This was a basic operation and response flow, but OpenGate supports much more. You can:
Send configuration updates to your devices
Trigger actuators (e.g., open/close valves)
Perform FOTA (Firmware Over-The-Air) upgrades
Or any other action your devices support!
Operations are a powerful way to turn your dashboards into control centers. Ready to build your next one?
9. Easy mode rules
🚦 Easy Mode Rules in OpenGate
Welcome to one of the most powerful features in OpenGate: the Rules Engine. This system allows you to automate responses based on incoming data, enabling smarter and more efficient workflows across your IoT ecosystem.
There are two rule-building modes available:
Easy Mode: A simplified, intuitive interface for quick rule creation. This allows you to create rules using an assisted interface.
Advanced Mode: A flexible editor for complex logic and custom flows. Use the power of JavaScript to configure your rule.
In this tutorial, we’ll focus on Easy Mode, using a practical example from our warehouse environment.
🛠️ Creating an Easy Rule
for this tutorial, we will consider that we want to monitor the temperature levels of our warehouse.
We’ll create a rule that triggers an alarm when the temperature reaches 25°C or more. The alarm message will be: “It’s hot!”
Go to OpenGate Management > Rules and click Create new rule
STEP 1: Rule Administration data
This is the first step of the Rules wizard. As the other wizards that we’ve achieve together, the first step allows you to set the basic info of the rule
New Rule: We will choose “NEW RULE” but as with the Operations, OpenGate offers you the possibility to clone an existing rule or use one from the product catalog. Because is our first rule, lets configure a new one together. Choose New Rule
Name: Use TemperatureRule
Description: It is optional but use Check temperature threshold
Rule mode: for this tutorial, we will use Easy Mode
Rule Type: We could configure rules to check “Operation Result” when are collected into de platform after perform any OpenGate Operation. For this tutorial, we are configuring a “Datastream Colection” rule. We want to check the received events. Choose DATASTREAM COLLECTION
STEP 2: Rule Definition
Here we are goint to define some things:
1. DATASTREAMS:
We need to define the datastreams that we use in the rule. Do you see the two buttons on the top part of the wizard?
We will use them to configure our rule basis
Choose temperature from our “warehose” datamodel and check the Prefilter option.
This rule only triggers when this datastream is received in any entity collection envent. This increase performance.
2. PARAMETERS:
This allows you to parametrize de values o the rule. If your rule is so complex, it is usefull to have all parameters together to check or edit them. This is not mandatory, but recommended.
3. RULE CONDITIONS:
Let’s configure our easy rule. As you can see you have some conditional tools available to configure the logic for the trigger of the rule.
This is the configuration of the condition to the rule results true, and so, execute the actions that we will configure later.
For this demo, we want to triger an alarm when any room facility register a temperature greater or equals 25ºC.
To accomplish this, we need to do the following:
Add a condition for resourceType with the operator eq to asset. This means that we only generate an alarm when the asset receive the value.
Add another condition with our datastream temperature from “warehouse” datamodel, and choose the opreator gte and then, choose our parameter.
Ensure that the GROUP condition is AND
4. DO ACTIONS:
Now we will decide what the rule must do when the condition occurs.
So let’s indicate tha we want to OPEN ALARM by clicking on “NEW ACTION”. Then configure the following:
Alarm name: It’s hot!
Alarm Description: temperature excedes the configured param
Severity: INFORMATIVE
Priority: MEDIUM
Ensures that the check is activated, if not, this action will never execute.
5. Save your changes
Click on “EXECUTE” to activate the rule
👏 Congratulations, you create your first rule!!
🧪 Testing the Rule
So easy right? Let’s verify that the rule behaves as expected.
Go to the “alarms list”
As always, you have a predefined solution to check your triggered alarms, but you can create your own dasboards.
Let’s try the predefined “Alarms List”. Just go to “Operations Support System > Alarms”, and open it in a new window
Send a normal value
Use the OpenGate Device Emulator to send a 21 value for temperature datastream, for the device [YourPrefix]-ws-stemp02, you know how.
Return to the Alarms List. Nothing happens, why? because we are under our threshold
Now enter a value above our threshold
Use again the “Opengate Device Emulator” to collect, this time, a 27 value
Return to the Alarms List and check what happens now
🚨 As you can see a new alarm appears.
This alarm is triggered because when you collected the 27 value for temperature, this value is populated to the asset and is above the alarm configured threshold.
🚨 Managing Alarms
Trigger alarms to aumomatically detect what is happening on your solution is great but if something is detected is for you to do something, right?
Now we understand how alarms works and how are generated, let’s explore the available options using the alarm we just triggered.
From the alarms list page, each alarm has its own menu to operate with the alarm:
Review the alarm details
Click on the alarm menu, then “Alarm detail”, to check all the alarm information
Here you can see all the history related with the alarm. The most relevant information is:
Openning time: The timestampt when the alarm is triggered by the rules engine
Status: The current status of the Alarm (OPEN or CLOSED)
Clossure time: Timestampt if the status is CLOSED
EntityID: The entityID that triggers the alarm
Rule Name: The name of the rule that triggers the alarm
Rule Description: The description of the rule. this ussually helps for better understanding
Severity: INFORMATIVE, as configured for this rule’s action
Alarm timeline: This view show different actions (available also from the alarm menu if you look the previous image in detail)
Attend the alarm
It is possible to attend the alarm to register some work by the users. By clicking on “Attend Alarm” option, you will be able to introduce some notes and so it keeps registered with the alarm information.
Close the alarm
You can close directly the alarm without attend it before. In any case, you can add some notes related with the alarm closure proccess.
10. Analytics and Datalab
🧪 Analytics and Datalab
🚀 What is Jupyter Lab and Why Is It Useful?
OpenGate comes with Jupyter Lab pre-installed and ready to use — no setup required.
You can access it directly from the Analytics section in the Web Console.
Jupyter Lab is an interactive development environment that lets you:
Create and run jupyter notebooks with Python code
Visualize data in real time
Document your analysis step by step
Combine text, code, and graphics in a single workspace
It’s perfect for exploratory data analysis, rapid prototyping, and technical documentation.
Once it’s open, you will access to the OpenGate Jupyter Lab interface to work with your notebooks:
🛠️ OpenGate Data: Your Python Superpower
The data generated or the results of your experiments with python can be reinjected in OpenGate!! but how? Easy… Using the opengate-data library…
The opengate-data library is a Python package designed to integrate OpenGate into your Python projects which is available by default on your OpenGate Data Lab instance.
It provides tools to interact with OpenGate’s APIs efficiently and intuitively.
Key features include:
🔍 Reading data from OpenGate
✍️ Writing data back to OpenGate
🧬 Automatic conversion to pandas.DataFrame
This means you can leverage the full power of pandas for advanced data manipulation, filtering, and visualization within your notebooks.
🖥️ Install it locally
Do you want to play locally? Installation is simple:
pip install opengate-data
📊 Why Is pandas So Powerful?
pandas is the go-to library for data analysis in Python.
The fact that opengate-data works seamlessly with DataFrame objects unlocks a wide range of possibilities:
Filter data by time, entity, or value
Group and summarize information
Create visualizations using matplotlib, seaborn, or other tools
Export to CSV, Excel, or databases
💡 This transforms OpenGate from a data collection platform into a full-fledged analytics engine.
✅ What You’ve Learned
With this final tutorial, you’ve completed the full journey through OpenGate:
From accessing the platform and navigating the console
To modeling, provisioning, and visualizing data
Through rules, operations, and connectors
And finally, to advanced analytics using notebooks and Python
🎓 You now have everything you need to build end-to-end IoT solutions — from device to insight.
OpenGate API
Introduction to OpenGate API
Welcome to the OpenGate API, an integral part of the OpenGate IoT Platform by amplía))) soluciones. We are a recognised company at the forefront of Industrial Internet of Things (IoT) solutions. This API is the backbone for connecting, managing and optimising a wide range of IoT devices and systems, providing unparalleled flexibility and control in industrial environments. Whether you are new to IoT or a seasoned professional, our documentation will guide you through the capabilities and features of the OpenGate API, enabling you to harness the full potential of IoT in your industrial applications.
The Management section of the OpenGate REST API, an essential part of Amplía Soluciones’ OpenGate IoT platform, is designed to facilitate comprehensive and efficient management of IoT resources and configurations. It encompasses a broad array of functionalities that cater to various aspects of IoT management:
Organizations: This is the core where you can manage Channels and Entities, including entity types, statuses, devices, subscriptions, and more. It provides tools for Bulk Provisioning, both classic and using provision functions with a JavaScript API, along with Rules management including a default rules catalog.
Work Groups: Critical for team collaboration, it includes managing work group relations, geo-clusters, bundles, and users, along with user login and profile settings.
Geo-Areas, Data Models, and Tags: These features allow for geo-spatial organization, data structuring, and categorization of IoT elements.
Tickets: Handle customer service and operational issues efficiently.
Manufacturers & Models: Manage and catalog various manufacturers and their respective models.
Usage Plans and Certificates: Essential for securing and governing the use of IoT devices.
Mobile Operators: This includes management of APNs and GGSNs, crucial for cellular network-based IoT devices.
This section of the API is geared towards providing administrators and developers with the tools needed for detailed and organized management of IoT infrastructure and services, ensuring smooth operation and effective utilization of IoT resources.
This document presents a comprehensive overview of the OpenGate Organization API, a pivotal component of the OpenGate IoT platform. As defined in the OpenAPI 3.0.0 specification, this API plays a crucial role in the holistic management of OpenGate organizations, which represent the highest-level and most crucial entities within the OpenGate platform.
The Role of Organizations in OpenGate
Foundation of the IoT Ecosystem: In the OpenGate system, an organisation is the fundamental unit from which all other entities are derived. The aforementioned entities comprise users, devices, assets, channels (i.e., device groups), work groups, and sub-organizations.
Central Control and Coordination Point: The utilisation of this API enables the effective control and coordination of the entire spectrum of an organisation’s IoT infrastructure within the OpenGate ecosystem.
Key Functionalities
Comprehensive API Endpoints
/north/v80/search/organizations: Facilitates organization searches with customizable formats and filters.
/north/v80/search/organizations/summary: Offers summarised data about organisations for quick overviews.
/north/v80/provision/organizations: Enables the creation of new organisations with detailed JSON requests.
/north/v80/provision/organizations/{organizationId}: Manages specific organisation details, including retrieval, updates, and deletion.
Security and Access
Secured Access: Employs the use of “ApiKeyAmplia” and “BearerAuthJWT” for the purpose of ensuring secure interactions with the API, thereby guaranteeing the integrity and confidentiality of the data.
Consistent Endpoint: The API services are accessible at https://api.opengate.es, providing a stable and efficient gateway for organizational management.
This application programming interface (API) serves as the central nervous system of the OpenGate platform, offering sophisticated tools and interfaces for the administration of organisations. By mastering this API, users can effectively orchestrate the diverse components of their Internet of Things (IoT) solutions, ensuring seamless integration and optimal performance of their IoT ecosystem.
Plan feature
The Plan feature is a fundamental component of OpenGate, the function of which is to define the organisational usage limits. Each organization will have a specific plan setting, which may take the following forms:
The maximum number of devices, gateways or assets the organization can have.
The maximum time the collected data will be stored until it is evicted.
The maximum number of events collected by the platform in a period.
Comprehensive API actions
Updating an organization
It should be noted that the domain is not an updatable field; therefore, its inclusion in the put will result in an error.
Searching organizations summary
In its default state, the summary displays the total counter, the counter for the organisational grouping, and the counter for the channel grouping.
API specification
Subsections of Organizations
Channels - Device Groups
Introduction
The OpenGate API provides a solution for the management and organisation of Internet of Things (IoT) devices and assets. At the core of this organisational structure are the channels, which are a vital component of an efficient device and asset management system, enabling streamlined operations and enhanced oversight.
Understanding OpenGate Channels
The Channels feature of the OpenGate group unifies the categorisation of devices and assets, thereby simplifying the management of complex systems and providing a powerful tool for the application of policies, the execution of commands and the analysis of data across a fleet of devices. The use of Channels allows for the straightforward management and interaction with devices that share common characteristics or are part of a specific project or geographic location.
Key Benefits of Using Channels
Simplified Management: Organise devices and assets into manageable groups.
Targeted Operations: Execute commands and policies on a specific group of devices efficiently.
Enhanced Analytics: Analysing data at the group level allows you to gain insights that may otherwise be overlooked when looking at the data individually.
Importance of User and Work Group Assignments
In order to gain access to and assume control of channels, it is necessary for the user account associated with OpenGate to be incorporated into a workgroup. This method of access control, which is based on a multi-layered structure, guarantees that only those individuals who have been duly authorised will be able to interact with the devices and assets within a given channel. This approach ensures that the environment is secure and under the control of the relevant authorities.
How to Assign Work Groups to Channels
Access the OpenGate User Management interface.
Select the workgroup to be assigned to a Channel.
Specify the Channels to which the workgroup is to be granted access.
Save the changes to implement the new access permissions.
By meticulously assigning work groups to channels, it is possible to maintain a high level of security and ensure that users only have access to the devices and assets that are relevant to their role or of interest to them.
In the context of the Internet of Things (IoT), an entity represents any monitoring element.
OpenGate offers four types of entities: asset, device, subscription, and subscriber. The resourceType field is used to set the entity type. The following table illustrates the process for setting each entity type:
Entity
ResourceType attribute
Description
Provision
Asset
entity.asset
The software enables users to create new entities that are distinct from the device environment.
OpenGate supports a variety of entities, each of which is identified by a unique identifier.
Administrative data attributes
id: Each Internet of Things (IoT) entity on the platform is assigned a unique identifier automatically by the platform.
provision.device.identifier: The customer-generated ID is a string that identifies a device in a specific organisation. HTTP/1.1 201 Created Location: http://api.opengate.es/north/v80/provision/organizations/{organizationName}/devices/device_1 It is imperative that you use this identifier as a URL suffix when you wish to retrieve, update or delete your device.
provision.device.communicationModules[].identifier: The customer-generated ID is a string that identifies a communication module.
provision.device.communicationModules[].subscription.identifier: It is a customer-generated identifier comprising a string that identifies a subscription.
provision.device.communicationModules[].subscriber.identifier: It is a customer-generated identifier comprising a string that identifies a subscriber.
Administration object attributes
It is a requirement for all OpenGate entities to operate within an administrative context.
Attributes
organization: the organization that owns the entity.
Forbidden in entity update operation
Required in entity insert operation
Constraints: [a-zA-Z0-9] max 50 chars
channel: an administrative grouping method for your entities.
Required in entity insert operation.
Constraints: [a-zA-Z0-9] max 50 chars
administrativeState: see administrativeStatevalues
Organization ID as URL parameter
In entity POST and PUT operations, OpenGate ignores the organisation field because its value is mandatory in the URL.
serviceGroup: Service configuration: configuration of services, operations available, etc.
Constraints: [a-zA-Z0-9] max 50 chars
Forbidden in bundle operations.
workgroup: the workgroup is the way to establish the relationships between devices and users. It’s used, for example, when you want to create software bundles.
Constraints: [a-zA-Z0-9] max 50 chars
This field only applies to OpenGate users.
plan (optional): an administrative concept that allows limiting the number of events sent by the device. This concept only applies to devices.
Constraints: [a-zA-Z0-9] max 50 chars
Forbidden in bundle operations.
Optional in entity insert and update operation.
Click to show administrative data as JSON document into a device entity…
It is of the utmost importance to select the correct entity service group. The service group you choose will determine how OpenGate behaves when managing your devices in the following ways:
Permitted operations.
This document outlines the process by which the platform transmits scheduled operations to devices.
Always: This type is designed for devices that are continuously connected. In this scenario, OpenGate will initiate operations on the devices in accordance with the pre-defined schedule. In the event that the target device is not connected, the operation will be cancelled and an error message will be generated.
On-session-connection: In this instance, the platform saves operations for subsequent use. Upon establishing a connection with the platform, the device will be notified of any pending operations and these will be sent to the device. This mode is applicable to devices utilising web sockets or MQTT connectors.
On-demand: In this instance, the device will request any outstanding operations. This approach enables devices to conserve battery power and retrieve pending operations when active.
Details
Should you wish for your devices to request all pending operations, you may utilise MQTT connections with the on-demand configuration.
Trusted boot: It is a requirement that all messages received by the platform include a field with the trusted boot value. In the absence of this field, OpenGate will reject the message.
Device security mode: This option allows you to select the desired security level for communications between the device and platform. The available options are:
None: communications are not encrypted.
Level 1: One-way authentication (or platform authentication). The platform is the sole entity responsible for authenticating itself to the client. It issues the client a certificate to confirm the platform’s authenticity.
At Level 2, both the client and the server authenticate themselves to each other, ensuring the veracity of the certificate presented by the platform.
At Level 3, both the client and the server authenticate themselves to each other, confirming the availability of the platform’s device certificate.
Service groups available on OpenGate cloud instance
As outlined in the organization’s plan, usage limits are to be established for the OpenGate platform. In the case of entities, if your organization has not defined a collection event limit, it must be set at the time of entity creation.
Flattened format
It is possible to create and search for data stream values (see default data models) using the flat format. This format is the same as that used on the South API. To indicate if data streams are in a flattened form, use the Boolean parameter ‘flattened’ in the URL.
The following examples demonstrate the process of transforming a hierarchical JSON format into a flattened JSON format. There are two types of values: simple and complex.
We will also demonstrate how to transform the existing normalised/flattened JSON examples into CSV format. The above examples will be joined together in a single CSV file comprising three lines, one for each example (a straightforward example and two complex examples).
Transforming the flattened format into CSV format is a relatively straightforward process, as the CSV file’s content adheres to the same guidelines as the flattened format. The first line (header) contains the name of the data stream, separated by “;”, and the following lines represent the different entities, with the field value of the data stream separated by “;” in the same order as the first line.
The following lines illustrate the format of a CSV file.
In the event that an entity contains a unique communication module, it is possible to indicate the name without the use of square brackets and without the inclusion of an identifier. In light of this, it can be seen that the two strings in question, namely [commsMod_battery_name(commsMod_battery_id)] and commsMod_battery_name, are identical.
Comprehensive API actions
Searching entities
This API enables the retrieval of a comprehensive list of entities, offering a multitude of options for:
Filtering (see Specific Filter Fields)
Sorting (see Sorting)
Selecting Required Fields (see Selecting)
Summarising (see Summary)
The results can be obtained in two distinct formats:
JSON Format (Default)
CSV Format
Additionally, the results can be obtained in a flattened format through the use of flattened parameters.
API specification
Subsections of Entities
Entity types & statuses
Entity type list
GATEWAY: M2M device like a concentrator or smart router, modem or gateway, etc.
ASSET: Business entity, usually have one or more devices connected.
COMMUNICATIONS_MODULE: Internal modem or interface for communications.
SUBSCRIPTION: Logical identifier for a communication channel as a GMS line.
SUBSCRIBER: Physical device associated with a Logical subscription.
Default device administrative statuses
REQUESTED: Entity requested to the supplier
READY: Entity ready for installation
REPAIR: Entity under repair
TESTING: Entity in tests
ACTIVE: Entity deployed on field
SUSPEND: Suspended its operation
DELETED: Entity removed from available stock
RETIRED: Entity retired from field
BANNED: Entity banned, no data is going to be collected for devices with this status
Alarms for BANNED entities
The default rules catalog has an automation rule to elevate an alarm when a BANNED device shows activity. Besides that, you can run a job or schedule a task over entities with a BANNED administrative state.
Device operational statuses
UNKNOWN: Not known
NORMAL: Normal Operation
ALARM: The device has active alarms
TESTING: The device is under test. Could be running but it is not performing its normal operation.
DOWN: The device is not operative. Could be running but it is not performing its operation.
SAFE_MODE: The device is in Safe Mode (Sleeping, etc.)
TAMPER: The device was tampered
TEST: The device is working in test mode
Communication modules operational status
UNKNOWN: The module status is not known
STOPPED: The module is not working
STARTING: The module is booting
RUNNING: The module is working
STOPPING: The module is shutting down
ERROR: The module has an error
Devices
Introduction
A device represents the physical element (communications devices, concentrators, machines, sensors, etc.) through which data is collected.
Relation between devices and assets
A device can be linked to an asset through the provision.device.related data stream, which must contain the identifier of the asset in question.
When these entities are related, the asset is able to collect data from the related device. In order to do this, it is necessary to define an available data model for the Devices and Assets resources, and then define all the data streams that you want to copy from the device. Once this has been done, the asset will then automatically start collecting these values from the device.
Comprehensive API actions
Creating a device
New devices can be created by sending a POST request that includes a correctly formatted JSON document in the body.
A device may contain or not contain subscriptions and subscribers. Furthermore, these can exist independently (please refer to create subscriptions or create subscribers for more information).
It is essential that the subscription or subscriber is located within the communication modules on the device. Consequently, there are various use cases for managing device relations, depending on whether there are existing subscriptions or subscribers.
The following options are available for creating a device:
Create a device without subscriptions or subscribers.
Create a device with subscriptions or subscribers that do not exist in the platform.
Create a device with subscriptions or subscribers that exist in the platform. In this instance, the following steps must be completed:
A device must be created (please refer to the ‘Create a device without subscriptions or subscribers’ section below for further details).
The device must then be updated with the relevant subscriptions or subscribers that are already present on the platform (please refer to the ‘Associate a subscription or subscriber to the device’ section below for further details).
Furthermore, a device can be linked to an asset. Please refer to the section entitled Relation between devices and assets for additional details.
Updating a device
Updates can be made to the following:
Device data
Device subscription or subscriber associations
Device subscription or subscriber disassociations
The JSON object passed will vary depending on the desired update.
Patching a device
It is possible to patch the following:
Only the device data
Associate a subscription or subscriber to the device
The JSON object passed will be different depending on the desired patch.
Furthermore, a device can be related to an asset. Please refer to the section entitled ‘Relation between devices and assets’ for more information.
Deleting a device
To delete a complete device with all associated subscriptions, send a DELETE request using the provided URL. The request should include a Boolean parameter, “full,” to indicate that you wish to delete the entire device.
Note
The default value of the field ‘full’ is set to ‘false’. In this case, if a device with a subscription or subscriber is deleted, only the device will be removed. Neither the subscription nor the subscriber will be deleted. After this, they will exist on the platform independently, without being associated with a device.
Searching device
This API enables the retrieval of a comprehensive list of devices, offering a multitude of options for:
Filter (See Specific Filter Fields)
Order (see Sorting)
Select Required Fields (see Selecting)
Summary (see Summary)
The results can be obtained in two different formats, as detailed in the HTTP Header Options.
JSON Format (Default)
CSV Format
As an alternative, the result can be obtained in a flattened format thanks to the flattened parameter (see device parameters).
API specification
Subscriptions
Introduction
A subscription stores information regarding the contracts with your communication operators. It can exist as a standalone entity or integrated within the device.
Comprehensive API actions
Patching a subscription
Please note that the administration channel value is mandatory for securitisation purposes in patch operation.
In the event of patching complex objects, any non-passed object attributes will be patched as non-existent. Therefore, it is advisable to include previous unchanged values to avoid any loss of data.
Searching subscriptions
The results can be obtained in two different formats, as detailed in the HTTP Header Options:
JSON Format (the default)
CSV Format
Searching subscriptions summary
The summary will always display the total counter, the organisation grouping counter and the channel grouping counter by default.
API specification
Subscribers
Introduction
The Subscriber Entity Store contains information regarding a specific communication channel. It can exist independently or within the device.
Comprehensive API actions
Patching a subscriber
Please note that the administration channel value is mandatory for securitisation purposes in patch operation.
In the event of patching complex objects, any non-passed object attributes will be patched as non-existent. Therefore, it is advisable to include previous unchanged values to avoid any loss of data.
Searching subscribers
The results can be obtained in two different formats, as detailed in the HTTP Header Options:
JSON Format (the default)
CSV Format
Searching subscribers summary
The summary will always display the total counter, the organisation grouping counter and the channel grouping counter by default.
API specification
Assets
Introduction
The software enables the creation of entities that are not devices, allowing users to emulate any type of entity they require, such as a worker or a spool.
Concurrently, a device may be associated with an asset. To illustrate, a worker may utilise a device that monitors a range of parameters.
These devices can take the form of a bracelet that monitors battery levels, pulse rate, temperature and position, or a vest that measures a range of other parameters.
An asset is able to identify its associated devices through the provision.asset.related data stream. This data contains an array of identifiers for the associated devices.
Should you wish to receive all information pertaining to the device in the asset, you must add a data model with dual data streams. Once both are related in this way, the assets will be able to receive all common data streams from the device. This ensures that all datastreams and data points collected will be in the cycle of life for both.
The platform is set up by default to offer the Entity data model, which contains two dual data streams: ’entity.location’ and ’entity.areas’. Please refer to the Default Datamodels section for more information.
Asset object structure
An asset is a repository of information about the new entity created by the user.
In regard to provisioned data, the following attributes are applicable:
Minimum attributes:
provision.administration.
provision.asset.identifier.
resourceType.
Recommended attributes by OpenGate:
provision.asset.administrativeState.
provision.asset.specificType.
provision.asset.name.
provision.asset.description.
Extended attributes:
provision.asset.location.
Defined attributes in human datamodel.
Defined by the user in his new datamodels. For example photo, position
Note
The specificType field is used to differentiate new entities. For instance, a worker is classified as an entity.asset with the specificType WORKER.
Comprehensive API actions
Creating an asset
New assets can be created by sending a POST request, including a correctly formatted JSON document in the POST body using the generic URL for entities
Please be advised that there is no requirement to include an organisation field in the JSON, as this information is already available in the URL.
It is not possible to create a list of devices associated with an asset. These must be added from the Devices section.
Updating an asset
Please be advised that an asset can be modified by sending a PATCH request using the generic URL for entities.
It is necessary to replace {identifier} with the identifier of the asset you wish to modify. Additionally, a boolean parameter, flattened, must be included to enable the sending of a flattened JSON format.
Warning
Please be advised that it is not possible to patch the list of devices associated with the asset. The devices must be patched from the list.
When patching complex object values, non-passed object attributes will be patched as non-existent. Therefore, it is advisable to include previous unchanged values to avoid any loss of data.
Please note that the Resource Type and Administration Channel values are mandatory in asset patch operations for securitisation purposes.
Deleting an asset
Note that it is not possible to delete the list of devices associated with an asset. Instead, you will need to delete them from the devices list.
Please be advised that an asset can be deleted by sending a DELETE request using the generic URL for entities.
The bulk function enables the provisioning of a list of entities or tickets in a single operation, in either synchronous or asynchronous mode.
Bulk Object Structure
Bulk requests and responses can be formatted in four different ways, which can be selected through the Content-Type HTTP header. The default format is JSON, but the other formats are also available:
CSV format
XLS Excel format
XLSX Excel format
Attaching Files as Multipart
The Async API enables the creation of multipart files. In this instance, the Content-Type HTTP header will be multipart/form-data, and the file type will be indicated in the attached content.
HTTP Header Options
The API enables the indication of the format in which the request content is to be sent, either JSON or CSV, via the HTTP header option “Content-Type”. Similarly, the API allows the indication of the format in which the response content is to be received, either JSON or CSV, via the HTTP header option “Accept”.
It is possible to send a request and receive a response in different formats. For example, a request sent in JSON format can be received in CSV format.
Content-type header
The bulk input can be provided in different formats, depending on the file type. The Content-Type header should indicate the format of the input data. The following formats are supported for both synchronous and asynchronous operations:
Please be advised that the bulk processing results will be created in the format indicated in the ACCEPT header of the POST call, for both synchronous and asynchronous operations. To achieve the desired result with the GET call, it is essential to ensure that the ACCEPT header is identical to that used in the POST call.
In the event that the POST is not completed with the correct MIME type in the ACCEPT header, an error message will be displayed. Similarly, if the GET is not completed with the correct MIME type in the ACCEPT header, the same error message will be displayed.
Comprehensive API actions
Synchronous bulk
Creating a synchronous bulk for entities
The Synchronous Bulk Creation process allows you to create multiple entities in a single request. This bulk operation applies to the following entities:
Assets
Devices
Subscriptions
Subscribers
Creating a synchronous bulk for tickets
The Synchronous Bulk Creation process for tickets allows you to create multiple ticket records in a single request.
Asynchronous bulk
Creating an Asynchronous bulk for entities
In the case of asynchronous calls, the POST method will return an empty body and the URL of the created bulk process in the Location header. To monitor the progress and outcome, a GET request should be made to the URL returned by the POST method.
Asynchronous searching
A comprehensive search is being conducted across all previously created bulk processes, whether completed or still in progress.
API specification
Provision functions for bulk provisioning
Limited access API
Limited access
Please note that the provision API of this feature is only available to the root profile. Similarly, the execution API (plan or bulk) of this feature is only available to the following profiles: root, admin, admin_domain, advanced and super_admin_domain. In contrast, the searching API is accessible to all users. Should you require further information, please consult your administrator.
Introduction
This API enables users to perform bulk provisioning using Provision Processors. These processors allow users to define their own Excel formatting using a JavaScript script, which adapts the formatting to align with the OpenGate APIs.
Provision Processor object structure
A Provision Processor will include a JSON object with a script field, which contains the JavaScript code responsible for processing inbound data and determining the appropriate actions for provisioning the relevant entities, such as JSON objects, devices, subscriptions and subscribers. When creating or updating a Provision Processor, only minimal parsing of the script will be performed.
Comprehensive API actions
Provision processors
Creating a provision processor
Please note that the Accept field should be set to application/JSON.
Updating a provision processor
All actions are based on application/JSON data formats.
Searching provision processors
Please search for all completed and ongoing bulk processes.
Executing provision processors
Executing plan from selected provision processor
As with the Bulk creation process, files will be attached as multipart, with only XLS and XLSX formats permitted.
In this instance, the Accept header must be set to application/JSON.
Rather than creating a bulk process, it would be more efficient to return the provision process planning for specified entries. This is a synchronisation process that does not result in changes to the database.
Executing bulk from selected provision processor
Files used for bulk processing will be attached to the request as multipart.
The attached file must contain a specific Content-Type property to indicate the format of the file.
Only XLS and XLSX formats are permitted.
The Accept header must match the attached file’s Content-Type.
Reading the bulk summary
Please note that the Accept field should be set to application/JSON.
Reading the bulk details from selected bulk
Please note that the Accept field should be the same used in the bulk creation request.
API specification
Subsections of Provision functions for bulk provisioning
JavaScript API
Introduction to provision processors
This API’s purpose is to facilitate the development of Provision Processors in the simplest possible way.
The API is divided into several modules/scripts:
Provision_Processor / provision_processor.js: This is the entry point from Java. It defines a template for Provision Processor execution.
Entities_Utils / provision_entity_utils.js: Utility class to facilitate the entities building.
Action_Utils / provision_actions_utils.js: Utility functions to create the actions to be returned to Java process.
V8_Api / provision_JavaV8_api.js: Functions used to invoke Java V8 methods.
V8_Utils / provision_JavaV8_utils.js: Some generic functions to use V8_API. When developing a new Provision Processor, instead of calling directly V8_Api functions is better to use the methods defined here.
Error_Api: Facility class to manage and transform caught OpenGate provision error.
Provision Processor
One Provision Processor is a script that, using Provision Javascript API, implements the business logic to transform inbound data into several actions to be done by Java to do correct provisioning actions.
How to Implement Provision Processor
When implementing a Provision Processor it is mandatory to implement two specific functions. These functions are called from Provision_Processor.processRow function:
normalizeRawObject(rawObject): This function receives a map with the data to be processed. For example, a map with the data read from an excel file. It takes the inbound parameter and transforms it into an object to be used to calculate and build the actions for this row. In this function, values validation and transformation should be done.
Input parameter: JSON object with raw keys and values.
Output: JSON object with the desired structure.
actionsPlanning(normalizedObject): Takes the result from normalizeRawObject function and calculates the actions to be done in Java.
Input parameter: Normalized object.
Output: Array of Actions.
It is possible to define extra functions to manage and transform provision errors. This function will be called from Main_Module.transformErrorMessage:
customErrorTransformer(errorManager): This function will be called when some provision error is caught (for example: duplicated entity). The goal is to create a customized error message for the Excel row update. This function is not mandatory, and if it is not defined, a default message will be returned by Main_Module.transformErrorMessage.
Input parameter: Object with error information (caught exception, failed action specification, and default message) and useful methods to manage this information.
Output: This function must return a String with the customized message.
Example of Provision Processor for creating devices and assets with some fields. It uses the functions and classes defined in Provision Javascript API.
/* *******************
MANDATORY FUNCTIONS
******************* */functionnormalizeRawObject(rawObject) {
try {
varnormalizedObject= {
/*
In this case, raw object data comes from an excel
and to specify the full key, we use the header name and column letter
*/organization:readMapValue(rawObject, 'Organization', '', 'A'),
channel:readMapValue(rawObject, 'Channel Name', '', 'B'),
/* maybe some values can be defined in the script as constants */service_group:'emptyServiceGroup',
/* We can do values validation and transformations. For example remove blanks from the value. */device_identifier:readMapValue(rawObject, 'Serial number', '', 'D').replace(/\s/g, ''),
asset_identifier:readMapValue(rawObject, 'Asset Id', '', 'C').replace(/\s/g, '')
};
returnnormalizedObject;
} catch (e) {
printLog('>> normalizeRawObject(): exception: '+e);
throwe;
}
}
functionactionsPlanning(normalizedObject) {
varactions= [];
/*
In this case, we will create an asset and a device.
In the case of the device, if it exists, we are going to update it.
*//* we check if the asset exists before creating it. */varassetExist=checkAsset(normalizedObject.asset_identifier);
if(!assetExist){
varassetEntity=generateAssetEntity(normalizedObject)
actions.push(CREATE_ASSET_ACTION(assetEntity));
}
/* we check if the device exists. */vardeviceExist=checkDevice(normalizedObject.device_identifier);
vardeviceEntity=generateDeviceEntity(normalizedObject)
if(!deviceExist){
actions.push(CREATE_DEVICE_ACTION(deviceEntity));
}else{
actions.push(UPDATE_DEVICE_ACTION(deviceEntity));
}
returnactions;
}
/* ******************************************
OPTIONAL FUNCTION for error transformation
****************************************** *//* This function will be called when a provision exception is caught to get a customized message for excel row update */functioncustomErrorTransformer(errorManager) {
return'This is customized message for error code: '+errorManager.getFirstErrorCode() +' and message: '+errorManager.getFirstErrorMessage();
}
/* *************************
Other auxiliary functions
************************* */functiongenerateDeviceEntity(normalizedObject) {
try {
vardeviceEntity=newEntity()
.addDatastream('provision.administration.channel', normalizedObject.channel)
.addDatastream('provision.administration.serviceGroup', normalizedObject.service_group)
.addDatastream('provision.administration.organization', normalizedObject.organization)
.addDatastream('provision.administration.identifier', normalizedObject.device_identifier)
.addDatastream('provision.device.related', normalizedObject.asset_identifier);
returndeviceEntity.entityJson;
} catch (e) {
printLog('>> generateDeviceEntity: Exception: '+e);
throwe;
}
}
functiongenerateAssetEntity(normalizedObject) {
try {
varassetEntity=newEntity()
.addDatastream('resourceType', 'entity.asset')
.addDatastream('provision.administration.channel', normalizedObject.channel)
.addDatastream('provision.administration.serviceGroup', normalizedObject.service_group)
.addDatastream('provision.administration.organization', normalizedObject.organization)
.addDatastream('provision.administration.identifier', normalizedObject.asset_identifier);
returnassetEntity.entityJson;
} catch (e) {
printLog('>> generateAssetEntity: Exception: '+e);
throwe;
}
}
Important tips when writing a Provision Processor script
To add the script to Provision Processor JSON, it is necessary to take into these rules:
For strings, use single quotes (’) instead of double quotes (")
Use block comments (/**/) instead of line comments (//)
Format the script in a unique line script.
Action format
actionsPlanning returns an array of objects specifying the action to be done. Actions must be built with the functions defined in Action_Utils. Just to see the output format and following the previous example:
Sometimes, it could be necessary to stop processing and abort all provision processes. For example, because some validation is not passed. In that case, an error must be thrown with a descriptive message. For example:
functionactionsPlanning(normalizedObject) {
varactions= [];
...
if(!someValidation(normalizedObject)){
thrownew Error("Provision Processor Error: some validation not passed");
}
...
returnactions;
}
Main Module
Main Module
Main Script: Defines Provision Processor template to be called from Java
Global parameter with a received map of params from the java process.
This parameter is set at the beginning of processRow and it can be used in any function in the script.
This is the function that will be called from the Java process.
To work correctly this function, it is mandatory to implement in the provision processor script the following functions:
normalizeRawObject(rawObject): This function will read and transform inbound rawObject and transform to normalizedObject object that will be used in actionsPlanning() function.
actionsPlanning(normalizedObject): This function has to apply business rules and calculate the actions array to be done by the Java process.
Kind: inner method of Main_Module Returns: String - Json with following properties:
scriptDirectResult: OK or descriptive error text,
actionsToDo: Array with the list of Actions to be done in Java Process. This array can be empty.
Param
Type
Description
rawObject
Object
Json with excel row data
processorParamsMap
Object
Processor extra params map: can contain necessary parameters for odm api calls (key, organization) or useful parameters to define specific behaviors
Init entityJson property with an entity identifier. Use new Entity(entityIdentifier) to create a new Entity.
Param
Type
Description
entityIdentifier
String
identifier for current entity.
Example of use:
constentity=newEntity("entityIdentifier");
entity.withPrefix(prefixToBeUsed)
Define the prefix of the datastreams to be used by addDatastream method.
Adding a new prefix will override the previously added one.
Use this method with an empty or undefined parameter to stop using any prefix.
Kind: instance method of Entity Returns: Entity - Current Entity instance
Param
Type
Description
prefixToBeUsed
String
The prefix that will be used in next addDatastream calls. If it is empty the prefix will be removed.
Example of use:
entity.withPrefix("prefix");
entity.getDatastream(datastream, _index)
Search specified datastream and returns value. This function requires always complete datastream (ignores withPrefix functions calls).
Kind: instance method of Entity Returns: * - Found datastream’s value, it can be complex. Null if not found.
Param
Type
Description
datastream
String
Datastream complete flattened name.
_index
String
If datastream is an array, index should be provided, if not, first element will be returned.
Example of use:
entity.getDatastream("datastream");
entity.deleteDatastream(datastream, _index)
Delete specified datastream. This function requires always complete datastream (ignores withPrefix functions calls).
Kind: instance method of Entity Returns: * - Found datastream’s value, it can be complex. Null if not found.
Param
Type
Description
datastream
String
Datastream complete flattened name.
_index
String
If datastream is an array, index should be provided, if not, first element will be returned.
Example of use:
entity.deleteDatastream("datastream");
entity.addDatastream(datastream, value, _index)
Method to be used to add datastreams to current entity.
Calling this method more than one time for the same datastream will have two different behaviors:
If _index parameter is defined, a new value will be added or updated to the array.
If _index parameter is not defined, the previous datastream will be overridden.
Kind: instance method of Entity Returns: Entity - Current Entity instance
Param
Type
Description
datastream
String
Datastream flattened name.
value
String
Value for the datastream.
_index
String
If provided, it will create special indexed datastream (for communicationModules[] datastreams).
Example of use:
entity.addDatastream("datastream", "value");
entity._addToEntity(datastream)
Internal method.
Attach provided datastream to current Entity’s JSON.
Kind: instance method of Entity Returns: Entity - Current Entity instance.
Internal method.
Generates an object with datastream as field and provided array as value.
This method is helpful for communicationModules[] datastreams.
Internally calls _cleanArray method to add good array.
Kind: instance method of Entity Returns: Object - Json object with built datastream.
Internal method.
Generates an object with datastream as field and provided value.
In this case, value can be a plain value (for example, String) or a complex JSON
Internally calls _generateJsonCurrentValue to build basic json structure.
Kind: instance method of Entity Returns: Object - Json object with built datastream.
Auxiliary method to read values from the specified map.
A key will be created with headerName and headerColumn and the value for this key will be retrieved.
If there is no entry for this key or the value is empty or undefined, defaultValue will be returned.
If headerColumn is null, only headerName will be used as the key.
Kind: inner method of Entities_Utils Returns: * - Obtained value for specified header name and column or at least defined default value.
Param
Type
Description
map
Object
map from which to read values.
headerName
String
Header name for mapped row.
defaultValue
*
If no value is read or it is empty or undefined, default value will be returned.
headerColumn
String
Header column letter for mapped row (if null, only headerName will be used as key).
Internal method.
Searches for duplicated datastreams in other entities than the specified one.
Kind: inner method of V8_Utils Returns: boolean - If duplicated Datasteams are found in other entities.
Param
Type
Description
currentEntityIdentifierDatastream
String
Datastream used to specify the Entity id with the datastreams to be checked.
currentEntityIdentifierValue
String
Value for currentEntityIdentifierDatastream field.
…datastreamsToCheck
Object
Datastreams to be checked if they are duplicated. Each datastream is defined as a pair {“datastreamId”: “datastreamValue”}.
Example of use:
if (_checkDuplicatedDS(normalizedObject.subscription_identifier, normalizedObject.subscription_identifier, normalizedObject.datastreams)) {
printLog('Check returned true');
}
Error API
Error_Api
This module contains ErrorManager class specification.
ErrorManager
Class used to manage and extract information from caught provision action exception.
Internally contains following objects:
platformErrors: list of ApiPlatformError representation.
Returns provision action type (POST, PUT, PATCH, DELETE) from OdmProvisionAction
Kind: instance method of ErrorManager Returns: string - It can be undefined or null.
Example of use:
varaction=errorManager.getAction();
errorManager.isPost()
Kind: instance method of ErrorManager Returns: boolean - true if provision action is POST.
Example of use:
varisPost=errorManager.isPost();
errorManager.isPut()
Kind: instance method of ErrorManager Returns: boolean - true if provision action is PUT.
Example of use:
varisPut=errorManager.isPut();
errorManager.isPatch()
Kind: instance method of ErrorManager Returns: boolean - true if provision action is PATCH.
Example of use:
varisPatch=errorManager.isPatch();
errorManager.isDelete()
Kind: instance method of ErrorManager Returns: boolean - true if provision action is DELETE.
Example of use:
varisDelete=errorManager.isDelete();
errorManager.getEntityType()
Returns provision entity type (asset, device, subscription, subscriber) from OdmProvisionAction
Kind: instance method of ErrorManager Returns: string - It can be undefined or null.
Example of use:
varentityType=errorManager.getEntityType();
errorManager.isSubscription()
Kind: instance method of ErrorManager Returns: boolean - true if provision entity is subscription.
Example of use:
varisSubscription=errorManager.isSubscription();
errorManager.isSubscriber()
Kind: instance method of ErrorManager Returns: boolean - true if provision entity is subscriber.
Example of use:
varisSubscriber=errorManager.isSubscriber();
errorManager.isDevice()
Kind: instance method of ErrorManager Returns: boolean - true if provision entity is device.
Example of use:
varisDevice=errorManager.isDevice();
errorManager.isAsset()
Kind: instance method of ErrorManager Returns: boolean - true if provision entity is asset.
Example of use:
varisAsset=errorManager.isAsset();
Rules
Introduction
A rule is primarily composed of conditions and actions. When a rule is defined, a rule type can be specified, which determines the structure of the rule.
DATASTREAM: This type of rule would be evaluated if data were collected in the South API.
OPERATION: This type of rule would be evaluated if an operation were executed on the Opengate platform.
EVENT: This type of rule would be evaluated if an event were sent to the Opengate platform.
Automation rules
The set of conditions and actions can be defined in EASY mode using a JSON structure, or alternatively, an advanced rule can be written in JavaScript code.
Easy mode
The “easy mode” allows users to define new rules using the JSON format. Firstly, the rule type must be specified, as this will determine the structure of the rule.
Data stream: If this option is selected, the rules engine will evaluate data stream rules if an entity is modified using the north OpenGate API or when OpenGate collects data through any of the south connectors. In this case, the data streams that the rule will use must be configured in the condition.
Operation: If this option is selected, the rules engine will evaluate operation responses after they have been managed by the OpenGate operations engine.
Configure data stream and parameters in the rule
It is possible to utilise data streams and parameter values within the configuration of rules. This can be done in a number of ways, including in conditions and some attributes in rule actions.
Further examples can be found in the schemas’ objects.
Comprehensive API actions
Updating a rule
All fields may be updated in accordance with the same validations as a POST request, with the exception of identifier, organisation and channel. Furthermore, an ADVANCED rule cannot be changed to EASY mode.
API specification
Subsections of Rules
Advanced Rules Mode
Rules in Advanced Mode
In advanced rules, you can write conditions and actions in javascript language.
In this javascript code, it is possible to call some defined functions to execute the same actions that you can do in easy mode. On the other hand, we also have some help functions. We will explain them below.
One of those helpers is documented outside this section, because connector functions are given the very
same object: logger, for writing TRACE, DEBUG, INFO, WARN and ERROR traces from a rule. See
JS Logging API for the reference, and
Functions Logger Service for the WebSocket that streams those
traces live, which serves rules and connector functions alike.
The rule code is given a flattened entity representation, adding the _received and _previous values to each datastream. It reaches the code as a global named entity, not as a parameter: rule code reads it directly, and helper functions that work on the current entity — such as isInsertAction() — take no argument because they already see it. The _received field is a simple object in provision datastreams and an array object in any other case.
Deprecated: Use alarm.open instead, which
takes a single configuration object. This function takes no extra information: a seventh argument
is ignored by the platform. The alarm.open object carries an extraInfo field, which is where that
data belongs now.
Opens an alarm for the selected entity.
Kind: global function Returns: void
Param
Type
Description
subEntityIdentifier
String
You can open an alarm on device, subscription or subscriber identifier. With subEntityIdentifier you define selected identifier. Pass null to open on provision.administration.identifier identifier.
alarmName
String
Name that you want to see in opened alarm
ruleName
String
Name of rule that produce opening of alarm.
severity
String
Alarm severity. Values can be INFORMATIVE, URGENT or CRITICAL.
priority
String
Alarm priority. Values can be LOW, MEDIUM or HIGH.
alarmDescription
String
Alarm description.
Examples of use
This example open alarm apnMismatch to subscription.
Closes an alarm for the selected entity using rule name.
Kind: global function Returns: void
Param
Type
Description
entityIdDatastream
String
You can close an alarm on device, subscription or subscriber identifier. With entityIdDatastream you define selected identifier. Pass null to close on provision.administration.identifier identifier.
Closes an alarm for the selected entity using alarm name.
Kind: global function Returns: void
Param
Type
Description
entityIdDatastream
String
You can close an alarm on device, subscription or subscriber identifier. With entityIdDatastream you define selected identifier. Pass null to close on provision.administration.identifier identifier.
Deprecated: Use notification object functions instead.
Sends email notification to defined recipients.
Kind: global function Returns: void
Param
Type
Description
recipients
Array
Array of recipients to send email. This param has same format as defined in easy mode.
notificationName
String
Name of notification that will be received in subject field.
notificationBody
String
Mustache template with email’s body
ruleName
String
Name of rule that launch email request.
mailParameters
Object
Json object with key-value pairs that will be replaces in mustache evaluation.
Example of use:
The example send email to example@recipient.es with highTemperature notification.
parameters= {};
parameters['deviceIdentifier'] =getDatastreamFromEntity('device.identifier')._current.value;
parameters['deviceTemperature'] =getDatastreamFromEntity('device.temperature')._current.value;
addEmailNotification(['example@recipient.es'], 'highTemperature', 'Received high temperature from {{deviceIdentifier}} with value {{deviceTemperature}}', 'highTemperatureRule', parameters);
Deprecated: Use notification object functions instead.
Sends http notification to defined recipients.
Kind: global function Returns: void
Param
Type
Description
httpJson
Object
Same json that easy mode.
Example of use:
The example send http request to http://myService/request with highTemperature notification.
httpJson= {
'url':'http://myService/request',
'method':'POST',
'headers': {
'Content-type':'application/json' },
'queryParams': {
'deviceId':entity['provision.device.identifier']._value._current.value },
'body':'New alert received by high temperature received. Current value: '+entity['device.temperature']._value._current.value};
sendHttp(httpJson);
Deprecated: Use operation object functions instead.
Executes selected operation to received identifier.
Kind: global function Returns: void
Param
Type
Description
subEntityIdentifier
String
You can execute operation on device, subscription or subscriber identifier. With subEntityIdentifier you define selected identifier. Pass null to execute on provision.administration.identifier identifier.
operationType
String
Operation Identifier. You can get this values getting operation catalog. Mandatory field. The rule will be created, but the operation will not.
operationTimeout
Number
Operation timeout in milliseconds. Default: 60000 milliseconds
jobUser
String
User apiKey that launch this operation. Mandatory field. The rule will be created, but the operation will not.
retries
Number
Operation retries number. Default: 0.
ackTimeout
Number
ACK timeout in milliseconds. Default: null.
retriesDelay
Number
Delay in seconds between retries. Default: null.
stopValue
Number
Stop value, this value depends of stop mode selected. Default: Operation timeout + 5000.
stopMode
String
Stop mode. Default: delayed. Possible values: date (stop value is a date in YYYY-MM-DDThh:mm:ssTZD format) and delayed (stop value is a time defined in milliseconds).
parameters
Object
This value is a json with accepted value in selected operation. You can see parameters getting operation catalog.
callback
String
URI where the result of the operation execution is received. Optional: if not provided, null is used.
NOTE: The Job of the operation will be created with an active status by default.
Example of use:
The example execute REFRESH_PRESENCE operation to received device.
Cancels active delayed action produced by another rule activation.
Kind: global function Returns: void
Param
Type
Description
ruleName
String
Name of rule that produce delayed actions.
Example of use:
The example cancel delay of ‘highTemperatureRule’ rule.
cancelDelay('highTemperatureRule');
Alarm utils
Alarm
The alarm object is the main object for managing alarms.
alarm.open(alarmConfig)
Opens an alarm.
Returns: void
This function takes as parameter an object with the following fields:
Property
Type
Default
Mandatory
Description
subEntityIdentifier
String
entityId
No
You can open an alarm on device, subscription or subscriber identifier. With subEntityIdentifier you define selected identifier. If is undefined it will open on provision.administration.identifier identifier
alarmName
String
No
Name that you want to see in opened alarm
ruleName
String
No
Name of rule that produce opening of alarm
severity
String
‘INFORMATIVE’
No
Severity of alarm. Values can be INFORMATIVE, URGENT or CRITICAL
priority
String
‘LOW’
No
Priority of alarm. Values can be LOW, MEDIUM or HIGH
description
String
No
Alarm description
extraInfo
String
No
Extra information.
Example of use:
This example open alarm apnMismatch to subscription.
And this example open alarm highTemperature to device.
alarmConfigDevice= {
alarmName:"highTemperature",
ruleName:"highTemperatureRule",
severity:"URGENT",
priority:"MEDIUM",
description:"Device temperature is high"}
alarm.open(alarmConfigDevice);
alarm.closeByRuleName(closeByRuleConfig)
Closes alarm by rule name.
Returns: void
This function takes as parameter an object with the following fields:
Property
Type
Default
Mandatory
Description
ruleName
String
Yes
Rule name that open alarm.
entityIdDatastream
String
No
You can close an alarm on device, subscription or subscriber identifier. With entityIdDatastream you define selected identifier. If is undefined it will close on provision.administration.identifier identifier.
Example of use:
The example close alarm generated by highTemperatureRule to device.
This function takes as parameter an object with the following fields:
Property
Type
Default
Mandatory
Description
alarmName
String
Yes
Opened alarm name.
entityIdDatastream
String
No
You can close an alarm on device, subscription or subscriber identifier. With entityIdDatastream you define selected identifier. If is undefined it will close on provision.administration.identifier identifier.
Example of use:
The example close opened alarm apnMismatch to device.
The notification object is the main object for managing notifications.
notification.addEmailNotification(emailConfig)
Sends an email notification to defined recipients.
Returns: void
This function takes as parameter an object with the following fields:
Property
Type
Default
Mandatory
Description
jsRecipients
List
Yes
Array of recipients to send email. This param has same format as defined in easy mode
notificationName
String
Yes
Name of notification that will be received in subject field
notificationBody
String
Yes
Mustache template with email’s body
ruleName
String
Yes
Name of rule that launch email request
mailParameters
Object
No
Json object with key-value pairs that will be replaces in mustache evaluation
Example of use:
The example send email to example@recipient.es with highTemperature notification.
emailNotifConfig= {
jsRecipients: ['example@recipient.es'],
notificationName:'highTemperature',
notificationBody:'Received high temperature from {{deviceIdentifier}} with value {{deviceTemperature}}',
ruleName:'highTemperatureRule',
mailParameters: {
deviceIdentifier:getDatastreamFromEntity('device.identifier')._current.value,
deviceTemperature:getDatastreamFromEntity('device.temperature')._current.value }
}
notification.addEmailNotification(emailNotifConfig);
notification.addTrapNotification(trapConfig)
Sends an SNMP trap notification to defined recipients.
This function takes as parameter an object with the following fields:
Property
Type
Default
Mandatory
Description
jsRecipients
List
Yes
Array of recipients (<ip>:<port>) to send trap. This param has same format as defined in easy mode
jsVariables
Object
Yes
Map of variables. Each pair defines OID variable and sent value for this OID
notificationName
String
Yes
Name of notification
trapOID
String
Yes
OID of trap
enterpriseOID
String
Yes
OID of enterprise
ruleName
String
Yes
Name of rule
Example of use:
The example send trap to 25.35.98.5:8585 with highTemperature notification.
Sends an HTTP request notification to a specified URL.
Returns: void
This function takes as parameter an object with the following fields:
Property
Type
Default
Mandatory
Description
url
String
Yes
URL to which the HTTP request will be sent
method
String
Yes
HTTP method to be used for the request
headers
Object
No
Key-value pairs representing HTTP headers
queryParams
Object
No
Key-value pairs representing query parameters
body
String
No
Body of the HTTP request
Example of use:
The example sends http request to http://myService/request with highTemperature notification.
httpJson= {
'url':'http://myService/request',
'method':'POST',
'headers': {
'Content-type':'application/json' },
'queryParams': {
'deviceId':entity['provision.device.identifier']._value._current.value },
'body':'New alert received by high temperature received. Current value: '+entity['device.temperature']._value._current.value};
notification.sendHttp(httpJson);
Operation utils
Operation
The operation object is the main object for executing operations.
operation.execute(operationConfig)
Execute selected operation to received identifier.
Returns: void
This function takes as parameter an object with the following fields:
Property
Type
Default
Mandatory
Description
subEntityIdentifier
String
No
You can execute operation on device, subscription or subscriber identifier. With subEntityIdentifier you define selected identifier. Default: If is undefined it will open on provision.administration.identifier identifier.
operationType
String
Yes
Operation Identifier. You can get this values getting operation catalog. Mandatory field. The rule will be created, but the operation will not.
operationTimeout
Number
60000
No
Operation timeout in milliseconds.
jobUser
String
Yes
User apiKey that launch this operation. Mandatory field. The rule will be created, but the operation will not.
retries
Number
0
No
Operation retries number.
ackTimeout
Number
null
No
ACK timeout in milliseconds.
retriesDelay
Number
0
No
Delay in seconds between retries.
stopValue
String
operationTimeout + 5000
No
Stop value, this value depends of stop mode selected.
stopMode
String
delayed
No
Stop mode. Possible values are: date: If this mode is selected, stop value is a date in YYYY-MM-DDThh:mm:ssTZD format. delayed: If this mode is selected, stop value is a time defined in milliseconds.
parameters
Object
{}
No
This value is a json with accepted value in selected operation. You can see parameters getting operation catalog.
callback
String
null
No
URI where the result of the operation execution is received.
NOTE: The Job of the operation will be created with an active status by default.
Example of use:
The example execute ADMINISTRATIVE_STATUS_CHANGE operation to received device.
This function returns date with current date, but with 2:00:00 hours. For example, if current day is 2021-06-30, the returned date in previously called function is 2021-06-30T02:00:00Z
getMonthlyResetDate()
Obtains date to reset monthly counters.
This function returns date with first day of current month and 00:00:00 hours.
Kind: global function Returns: Date
Example of use:
vardate=getMonthlyResetDate();
getMonthlyResetDateWithZuluHour(hour)
Obtains date to reset monthly counters with defined hour in gmt+0.
This function returns date with first day of current month, but with 2:00:00 hours. For example, if current day is 2021-06-30, the returned date in previously called function is 2021-06-01T02:00:00Z
This function returns date of the day 21 of current month, but with 2:00:00 hours, when day of the month is null, then return first day of the month. For example, the returned date in previously called function is 2023-02-21T02:00:00Z
By default, this field will be set to “NONE”. If you wish to deactivate the 2FA, please set the property 2FaType to NONE and perform a PUT on the user.
Please refer to the schema for each attribute used.
Log in with Two-Factor Authentication (2FA)
In the event that two-factor authentication (2FA) has been enabled for a particular user, it is necessary to incorporate the code generated by the associated application into the “2FaCode” attribute of the JSON.
Configure your application
Upon initial login following the configuration of two-factor authentication (2FA), the LOGIN service will respond with a URL location in the headers containing the configuration parameters. These parameters should be used to configure your application to generate the codes.
The URL will be as follows: otpauth://totp/2FA?secret=CAX3VP5O7GWZXUDWQOK4267DGXXSFIDQ&issuer=OpenGate&algorithm=SHA1&digits=6&period=30
Description of the attributes of the URL
secret: Contains the secret key to generate codes.
period: Defines the time validation period of the code.
digits: Defines the length of the generated code.
algorithm: Defines the algorithm used to generate the codes.
issuer: Defines the subject, the name of the server.
Some applications only require the secret field, while others may need all parameters.
Comprehensive API actions
Reading a user
Please replace {id} with the email address of the user you wish to retrieve.
There are two ways to use the GET method:
Administrative: This is the standard use of the GET method as defined in HTTP. In this case, you use GET with the Apikey.
Login: You can use the method GET to log in, adding the password in the field of the header X-ApiPass. The Apikey is not necessary.
Updating a user
An administrator is able to modify another user’s API key or password, update their own API key, or update their own password.
To update the ApiKey or password of another user by an administrator
Any user with administration role is allowed to change the ApiKey / password of any managed user (excluding himself), the same way as any other user’s field.
In this case, the ApiKey or password will be considered as any other basic user data. In this case, it’s allowed to change the ApiKey or password with any other user’s field. If the administrator needs to change his own ApiKey/password, it must be done as explained bellow.
To update your own ApiKey
Any user with an administrative role is permitted to modify the ApiKey/password of any managed user (excluding themselves), in a manner consistent with the process for modifying any other user’s field.
In this instance, the ApiKey or password will be treated in the same way as any other basic user data. It is therefore permitted to change the ApiKey or password with any other user’s field. If the administrator wishes to change their own ApiKey/password, this must be done in accordance with the instructions set out below.
To update your own password
As with updating your own ApiKey, any user is able to change their own password. This is the only method available, regardless of whether the user has an administration profile. In this case, the current user’s password must be included in the X-ApiPass field of the REQUEST HEADERS section (the X-ApiKey field is not required). Additionally, the JSON of the REQUEST BODY should include only the new password as shown in the “Change the user’s own password” option. Please note that it is not permitted to change any other user’s field.
When setting a password…
The password must meet the following criteria for both creating and updating users:
It must be between 12 and 25 characters long.
It must include upper case letters.
It must include lowercase letters.
It must include numbers.
It must include special characters: !"#$%&’()*+,-./:;<=>?@[]^_`{|}~
The password will have an expiration time of 6 months, by default.
Logging in OpenGate platform.
Note
It is not a requisite to include an API key or JWT token in the header of the request.
The JWT token will be validated by OpenGate under the following conditions:
The JWT token will have an expiration time, typically 24 hours.
The JWT token will be signed with an OpenGate encrypted key. If the token received is not signed with the same encrypted key or has been modified, it will be rejected.
API specification
Subsections of Users
User login
For you are authenticate in OpenGate you have to do LOG-IN to obtain a token JWT or an ApiKey:
Do login
Basic login
Do you need an email and password.
flowchart TD
CU["CREATE User"] --> V{"Valid User"}
V -- No --> E400["ERROR 400<br>Json malformed"]
V -- "Yes, LOG-IN" --> LOGIN["Do LOG-IN<br>email and password"]
LOGIN --> VC{"Valid<br>email and password"}
VC -- No --> E401["ERROR 401<br>Bad credentials"]
VC -- Yes --> OK["Return: 200 OK<br>Return data (JWT and ApiKey)"]
classDef error fill:#f9d0d0,stroke:#c85a5a,color:#000
classDef ok fill:#a8ecd0,stroke:#2b9c6e,color:#000
class E400,E401 error
class OK ok
Login with Two Factor Authentication
Do you need an email, password and an 2FA Code generated.
How can you generate the 2FA code?
First, you have to configure your application to generate codes.
Configure your application
When you do login in OpenGate, the first time after configuring 2FA, the LOG-IN service responds with an error code 401, but in the headers contains an URL in the attribute location with the parameters of configuration.
You have to use this parameters to configure your application to generate the codes.
The URL of location will be like this otpauth://totp/2FA?secret=CAX3VP5O7GWZXUDWQOK4267DGXXSFIDQ&issuer=OpenGate&algorithm=SHA1&digits=6&period=30
Description of the attributes of the URL:
secret: contain the secret key to generate codes.
period: define the time of validation of the code.
digits: define the length of the code generated.
algorithm: define the Algorithm used to generate the codes.
issuer: define the subject, the name of the server.
Some applications only need the secret field, and others need all parameters.
You can see the flow of this process in follow diagram:
flowchart TD
CU["CREATE or UPDATE USER<br>with 2FA"] --> V{"Valid User<br>with 2FA type"}
V -- No --> E400["ERROR 400<br>Json malformed"]
V -- "Yes, LOG-IN" --> LOGIN["Do LOG-IN<br>without 2FA Code"]
LOGIN --> FIRST{"First time"}
FIRST -- No --> E401A["ERROR 401<br>Bad Credentials<br>or Bad 2Fa Code sent"]
FIRST -- Yes --> HDR["Return: ERROR 401<br>Headers with URL 2FA"]
HDR --> APP["With URL - Configure APP"]
APP --> GEN["Generate 2FA code<br>with the application"]
GEN --> LOGIN2["Do LOG-IN with 2FA"]
LOGIN2 --> VC{"Valid<br>email and password"}
VC -- No --> E401B["ERROR 401<br>Bad Credentials"]
VC -- Yes --> EXP{"Code expired<br>Code invalid"}
EXP -- No --> OK["Return 200 OK<br>Return data (JWT and ApiKey)"]
EXP -- Yes --> E401C["401 ERROR<br>Invalid Code"]
classDef error fill:#f9d0d0,stroke:#c85a5a,color:#000
classDef ok fill:#a8ecd0,stroke:#2b9c6e,color:#000
classDef step fill:#addcf8,stroke:#2b7cb8,color:#000
class E400,E401A,E401B,E401C,HDR error
class OK ok
class LOGIN,APP,GEN,LOGIN2 step
2FA error responses
Every 2FA failure returns 401 Unauthorized, so the error code is what tells the cases apart:
Code
Situation
Context
0x000065
First login after configuring 2FA. Read the location header to configure your application.
2FA
0x000065
2FA is configured but no code was sent.
2FaCode is null
0x000066
The code sent is invalid or expired.
2FaCode
0x000067
A code was sent but the user has no 2FA configured. Log in without the TOTP code.
2FaCode
An expired password is a different case: it returns 403 with code 0x010063.
User profiles
OpenGate by default incorporates a set of user profiles which is listed below:
New adhoc user profiles can be added to adapt to specific needs.
Profiles
root
super_admin_domain
admin_domain
admin
advanced
viewer
root
Total control for managing all resources in the platform
super_admin_domain
super_admin_domain access to the Provision API
Domains (create, update, delete)
Subdomains (create and update)
Organizations (create, update, delete)
Work groups (create, update, delete)
Channels (create, update, delete)
Users (create, update, delete)
Certificates (create, update, delete, download)
Data models (create, update, delete)
Areas (create, read, update, delete)
Bulk of Assets, Devices, subscriptions (create, update, delete)
flowchart TD
START(("Start")) --> B["POST bundle"]
B --> DE["POST deployment element<br>to the bundle"]
DE --> Q{"Should the bundle have<br>more deployment elements?"}
Q -- Yes --> DE
Q -- No --> END(("End"))
classDef step fill:#addcf8,stroke:#2b7cb8,color:#000
classDef terminal fill:#a8ecd0,stroke:#2b9c6e,color:#000
class B,DE step
class START,END terminal
We want to make sure you understand the bundle management workflow, because the update operations will use your bundles.
First of all, you must POST a bundle.
Then you must upload, i.e. POST, as many deployment elements as the bundle should have.
Finally, you must set up the state bundle attribute to ACTIVE.
Deployment element
What is a deployment element? A bundle is formed by deployment elements, each of these elements can have files associated or not, depending on the operation associated with the deployment element. In a bundle, through the deployment elements, you can define different actions that you want to perform in the device, such as installing software, updating it, and more.
The operations allowed for a deployment element are:
Install - With this operation, you are trying to include a new deployment (of any type) in the device.
Uninstall - With this operation, you are trying to uninstall a deployment element in the device.
Upgrade - With this operation, you are trying to change the version of a deployment element.
In order to attach a deployment element to a bundle in the OpenGate API, you must replace {bundle_name} and {version_name} with the identifiers of the bundle and version you want to attach the deployment element to. Because deployment elements need to be uploaded, this POST request differs from others in the OpenGate API. The request must be encoded according to RFC 1867, “Form-based File Upload in HTML”, which OpenGate can parse to “attach” the deployment element to the bundle.
When creating a deployment element, you have three options for attaching a file:
Filling only the downloadUrl field: In this case, the file will be located at the path provided in the downloadUrl field.
Attaching a file without filling the downloadUrl field: Here, the file is uploaded, and the downloadUrl field is automatically populated with the URL of the OpenGate internal file repository.
Attaching a file and filling the downloadUrl field: This option combines the previous two; the file is uploaded to the default path, and the device downloads the file from the path specified in the downloadUrl field.
Important
You must upload at least one deployment element, or your bundle cannot be activated.
Additionally, there is an optional parameter called FileValidationRequired, which forces the platform to validate the file’s integrity. This parameter is only relevant when a valid validator parameter is passed within the accompanying JSON file.
Note that the deployment element file has a maximum size, which can be configured administratively. By default, this limit is set to 22,020,096 bytes.
For the POST request, you must include either the downloadUrl parameter, the associated file, or both.
Comprehensive API actions
Creating a bundle
There are two different ways for creating a bundle:
Step by step creating in the first step the bundle and after that creating the different
deployment elements included in the bundle
Introducing in the post request a zip file with the complete structure of the bundle.
The zip file will have the next content:
A file called “manifest.txt” where the content of the bundle is explained
The files that will become deployment elements within the bundle.
Updating a bundle
You must replace {bundle_name} with the identifier of the bundle you want to update and {version_name} with the selected version to be updated.
Note
You cannot update a bundle using the file option available in the create option.
You cannot update all the fields of a bundle. The following fields are allowed:
description
preaction
postaction
userNotes
active
Some fields of the deployments elements
Important
If a bundle has been used in an update operation, you can only update the following fields:
description
userNotes
active
Software, firmware, configuration. You can rely on OpenGate to update the software, the firmware, or the configuration files of your remote devices.
The updates can be executed using the operations API, but first of all, OpenGate must know the structure of your update bundles.
The following sections show you how to feed OpenGate with your software, firmware, and configuration files.
Deleting a bundle
Important
If a bundle has been used in an update operation, it can’t be deleted.
API specification
Geo-areas
Introduction
A geographical area is defined as a geographic zone delineated by a GeoJSON. The detection of device entry or exit at a specific location can be facilitated through the utilisation of these areas. Furthermore, automation rules can be devised to generate alerts when a device enters or exits a designated area.
Comprehensive API actions
Creating an area
An area can be created based on the methodology by which the geographic zone is determined: either by a GeoJSON or a group of devices. Subsequently, the option to retrieve information from both (GeoJSON and device group) is provided. Further details can be found in the section on creating an area specification.
Updating an area
It is permissible to modify all of the fields, with the exception of the identifier.
Searching areas
The OpenGate API query enables the retrieval of various platform areas, contingent on the user’s visualization capacity for their respective organization.
API specification
Manufacturers & Models
Each organization has its own hardware manufacturers and model catalogue. This information can be related to entities like devices.
Limited access API
Limited access
The provisioning API of this feature is only available to admin_domain and super_admin_domain profiles; on the other hand, anyone can use the searching API. Ask your administrator for proper user role profiling.
Some information of interest
Unique manufacturer name restriction
When a manufacturer is created, this can be assigned to entities in the same organization, including this one’s children; the non-name repeating restriction applies to the entire tree where that organization is located.
Hardware models and their relationships with entities
Entities such as devices can have their hardware model stored as part of their information. These models will be the ones belonging to the manufacturers available for the organization where the entity is.
When you edit or delete manufacturers’ or models’ information, you can choose whether you want this reflected in the entity’s information.
Follow the following links to check out the OpenAPI specs:
This is an API that allow to provide and manage the list of hardware models
and manufacturers used in an organization. Here you can register manufacturers and
models data to be referenced in devices information.
See Manufacturer object bellow on schemas.
Comprehensive API actions
Updating a manufacturer
‘UpdateDevices’ parameter
It is possible that entities may contain references to models that were previously manufactured by a now-deleted manufacturer. Consequently, deleting the manufacturer may result in a new discrepancy between its information and that of the entities. The updateDevices parameter allows the user to choose whether this action should be reflected or not. However, this only affects the manufacturer’s information; models remain unaffected.
Deleting Manufacturer
Warning
In the event that a manufacturer has already deployed models within the OpenGate framework, it is not possible to remove them.
‘UpdateDevices’ parameter
It is possible that entities may contain references to models that were previously manufactured by a now-deleted manufacturer. Consequently, deleting the manufacturer may result in a new discrepancy between its information and that of the entities. The updateDevices parameter allows the user to choose whether this action should be reflected or not. However, this only affects the manufacturer’s information; models remain unaffected.
Reading the organization manufacturer list
Visibility parameter
There are multiple methods for retrieving manufacturer lists, which are controlled by the “visibility” parameter. This parameter has the following possible values:
default: In the event that the aforementioned parameter is not transmitted, or if it is transmitted with the default value, the list of manufacturers that are part of the specified organisation, as indicated in the URL, will be returned.
assignable: The aforementioned value will yield a list of manufacturers that can be assigned to entities within the specified organisational structure, as indicated by the URL. This list comprises the manufacturers within the aforementioned organisational structure, along with their respective parents.
administrable: Upon transmission of this value, a list of manufacturers that can be managed will be returned. In the event that permissions are lacking for the specified action, or if the manufacturer is part of the organisation indicated in the URL and its subsidiaries, the list will be empty.
API specification
Models
Introduction
This API enables the provisioning and management of hardware models that are utilized to associate with the entities within an organizational structure.
Comprehensive API actions
Reading a model
It is possible that entities may contain references to models that were previously manufactured by a now-deleted manufacturer. Consequently, deleting the manufacturer may result in a new discrepancy between its information and that of the entities. The updateDevices parameter allows the user to choose whether this action should be reflected or not. However, this only affects the manufacturer’s information; models remain unaffected.
Deleting a model
It is possible that entities may contain references to models that were previously manufactured by a now-deleted manufacturer. Consequently, deleting the manufacturer may result in a new discrepancy between its information and that of the entities. The updateDevices parameter allows the user to choose whether this action should be reflected or not. However, this only affects the manufacturer’s information; models remain unaffected.
API specification
Data models
Introduction
A data model can be defined as a set of data stream templates. It defines all the variables associated with a device or type of entity for its management and monitoring. These variables represent the information about an individual “measure” that evolves over time, and thus define the main features of a data stream. Further details on this concept can be found in the default data model catalogue. This API enables the management of data models.
Comprehensive API actions
Updating a datamodel
Regarding the datastream (templates), the behavior of this request is:
All new data streams are incorporated into the existing data model.
For all existing data streams that have been provisioned and are included in the JSON request, all fields can be modified except for the identifier.
Please note that all datastreams that have already been provisioned and are not present in the JSON request will be removed. This is only the case if they have not previously been collected as datapoint instances. In the event that at least one datastream with previously collected datapoints is not present in the put option, an error is returned for the entire request.
Default data model catalog edition
Although the above fields are restricted from modification, the following fields of the data model can be adjusted:
datamodel.description
datamodel.category.datastream.description
datamodel.category.datastream.storage
datamodel.category.datastream.tags
datamodel.category.datastream.unit
datamodel.category.datastream.qrating
datamodel.category.datastream.views
datamodel.category.datastream.icon
The datamodel.category.datastream.schema field can also be modified, but only for the next datastreams:
Description: Specific Datamodel to provision a ticket
Allowed resource types:
ticket
Categories:
ticketInfo
Data streams:
Identifier
Identifier:
provision.ticket.identifier
Unit: basicSI
Period: PULSE
Storage: NEVER
Tags:
ticket
Name
Identifier:
provision.ticket.name
Unit: basicSI
Period: PULSE
Storage: NEVER
Tags:
ticket
Description
Identifier:
provision.ticket.description
Unit: basicSI
Period: PULSE
Storage: NEVER
Tags:
ticket
Location
Identifier:
provision.ticket.location
Unit: basicSI
Period: INSTANT
Storage:
Tags:
dmm
| provision
Label
Identifier:
provision.ticket.label
Unit: basicSI
Period: PULSE
Storage: NEVER
Tags:
ticket
Type
Identifier:
provision.ticket.type
Unit: basicSI
Period: PULSE
Storage: NEVER
Tags:
ticket
Severity
Identifier:
provision.ticket.severity
Unit: basicSI
Period: PULSE
Storage:
Tags:
ticket
Priority
Identifier:
provision.ticket.priority
Unit: basicSI
Period: PULSE
Storage:
Tags:
ticket
Reporter
Identifier:
provision.ticket.reporter
Unit: basicSI
Period: PULSE
Storage: NEVER
Tags:
ticket
Owner
Identifier:
provision.ticket.owner
Unit: basicSI
Period: PULSE
Storage:
Tags:
ticket
Assignee
Identifier:
provision.ticket.assignee
Unit: basicSI
Period: PULSE
Storage:
Tags:
ticket
Status
Identifier:
provision.ticket.status
Unit: basicSI
Period: PULSE
Storage:
Tags:
ticket
Specific type
Identifier:
provision.ticket.specificType
Unit: basicSI
Period: PULSE
Storage:
Tags:
ticket
Section
Identifier:
provision.ticket.section
Unit: basicSI
Period: PULSE
Storage: NEVER
Tags:
ticket
Entity
Identifier:
provision.ticket.entity
Unit: basicSI
Period: PULSE
Storage:
Tags:
ticket
Creation date
Identifier:
provision.ticket.creationDate
Unit: basicSI
Period: INSTANT
Storage: NEVER
Tags:
ticket
Reporter date
Identifier:
provision.ticket.reporterDate
Unit: basicSI
Period: INSTANT
Storage: NEVER
Tags:
ticket
Assigned date
Identifier:
provision.ticket.assignedDate
Unit: basicSI
Period: INSTANT
Storage:
Tags:
ticket
Answered date
Identifier:
provision.ticket.answeredDate
Unit: basicSI
Period: INSTANT
Storage:
Tags:
ticket
Updated date
Identifier:
provision.ticket.updatedDate
Unit: basicSI
Period: INSTANT
Storage:
Tags:
ticket
Restoration date
Identifier:
provision.ticket.restorationDate
Unit: basicSI
Period: INSTANT
Storage:
Tags:
ticket
Resolution date
Identifier:
provision.ticket.resolutionDate
Unit: basicSI
Period: INSTANT
Storage:
Tags:
ticket
Closed date
Identifier:
provision.ticket.closedDate
Unit: basicSI
Period: INSTANT
Storage: NEVER
Tags:
ticket
Parent ticket
Identifier:
provision.ticket.parentTicket
Unit: basicSI
Period: PULSE
Storage: NEVER
Tags:
ticket
Identifier
Identifier:
provision.ticket.isOnSLA
Unit: basicSI
Period: PULSE
Storage: NEVER
Tags:
ticket
Assignation time
Identifier:
provision.ticket.assignationTime
Unit: basicSI
Period: INSTANT
Storage: NEVER
Tags:
ticket
Answering time
Identifier:
provision.ticket.answeringTime
Unit: basicSI
Period: INSTANT
Storage: NEVER
Tags:
ticket
Restoration time
Identifier:
provision.ticket.restorationTime
Unit: basicSI
Period: INSTANT
Storage: NEVER
Tags:
ticket
Resolution time
Identifier:
provision.ticket.resolutionTime
Unit: basicSI
Period: INSTANT
Storage: NEVER
Tags:
ticket
Confirmation time
Identifier:
provision.ticket.confirmationTime
Unit: basicSI
Period: INSTANT
Storage: NEVER
Tags:
ticket
Closed time
Identifier:
provision.ticket.closedTime
Unit: basicSI
Period: INSTANT
Storage: NEVER
Tags:
ticket
Data streams default schemas
It is possible to utilise the predefined types (JSON schemas) for custom OpenGate data streams.
Tags
Tag entity object structure
In certain instances, it may be desirable to execute the same operation on a multitude of devices simultaneously.
The question then arises as to how one might select all the target devices. In this context, the answer lies in the use of tags.
It is possible to tag all the devices and other entities that are to be included in the operation, and then to execute it.
The tag is employed as the target.
This section will demonstrate the process of creating tags and applying them to OpenGate entities.
The provisioning API.
Further information on the utilisation of tags can be found in the operations section.
Comprehensive API actions
Creating a tag
There are two alternatives to include entities in a tag:
Choose a specific list of entities
Using a previously created tag.
Warning
In regard to operational issues, the service is constrained by a limitation in the array size of the JSON.
The aforementioned limit may be configured at the administrative level.
The default limit is 5,000 elements in the array. It is recommended that you consult with your administrator to ascertain the configured limit.
In order to ascertain the configured limit, it is necessary to consult with the administrator.
In the event that a large number of entities must be operated upon, the recommended course of action is to utilise the updating function.
A PUT operation may be employed to append new entities to the target, taking the aforementioned limit into accoun
It is not possible for a user to include entities that are not in the same workgroup as themselves in the label that they create.
API specification
Tickets
Introduction
A ticket is a resource type on the platform. It allows users to register and track on-field deployments, incidents or requests (required needs).
Comprehensive API actions
Updating a ticket
Please note that the following fields cannot be modified:
identifier
type
reporter
entity: If the ticket does not contain the entity, it can be updated.
Please be advised that the dates will be updated by the platform internally, depending on the status of the ticket. Please note that these dates cannot be modified.
creationDate
assignedDate
answeredDate
updatedDate
restorationDate
resolutionDate
closedDate
Searching tickets
The OpenGate API query enables the retrieval of the list of tickets.
The results can be obtained in two different formats, as detailed in the HTTP Header Options:
JSON Format (default)
CSV Format
API specification
Manufacturer & Model Catalog
OpenGate has its own hardware manufacturers and models catalog, available for being queried by users. You are allowed to use this information to extend your organization’s catalog.
Limited access API
Limited access
The provision API of this feature is only available to root profile, on the other hand, anyone can use the searching API. Ask your administrator for proper user role profiling.
Catalog Provision
API specification
Search the global hardware catalog (manufacturers and models) and get a summary count of results.
Subsections of Manufacturer & Model Catalog
Manufacturers catalog API Spec
Introduction
The application programming interface (API) permits the provision of hardware manufacturers as a foundation for organisational catalogues.
Images can be associated with the manufacturers as logos or documentation.
Manufacturer Media Files
A media file is defined as a file that is associated with a particular manufacturer, typically through the use of a manufacturer logo. There is no limit to the number of files that can be added, and the process is straightforward. For further details on the structure of a media object, please refer to the relevant schemas.
Comprehensive API actions
Reading a single media file element
The process of downloading a previously uploaded media file is a relatively straightforward one. In order to do so, it is simply necessary to send the same GET request that was used to extract the media file meta-information, with the addition of a format parameter equal to raw.
Updating a manufacturer
It is possible to update all manufacturer fields, with the exception of the identifier field.
API specification
Models catalog API Spec
Introduction
The application programming interface (API) permits the provision of hardware manufacturers as a foundation for organisational catalogues. Images can be associated with the manufacturers as logos or documentation.
Comprehensive API actions
mediaTypes
Reading a single media file element
The process of downloading a previously uploaded media file is a relatively straightforward one. In order to do so, it is simply necessary to send the same GET request that was used to extract the media file meta-information, with the addition of a format parameter equal to raw.
Models
Updating a model
With the exception of the Identifier field, all model fields may be updated.
API specification
Usage plans
Introduction
The OpenGate API query enables the retrieval of the available plans that have been provisioned under the domain of the user who has initiated the request.
API specification
Certificates
Introduction
The application programming interface (API) enables the administration of security certificates, which may be utilised for a variety of purposes, including file signing validation, communication encryption, access control, and others.
Supported File Types
type: PEM
mime-type: x-pem-file
file extension: .pem
How trustChains parameter works
The trustChains parameter represents an array of trust chains.
The initial array comprises a series of string arrays, arranged from left to right, which collectively represent the path traversed by a certificate’s parents from the root or self-signed certificate to the certificate’s immediate parent.
To illustrate, if a certificate C is signed by a certificate B, which in turn is signed by a certificate A, the path will be A→B→C. The trustChain will contain the identifier of the certificate A in the initial position of the array, followed by the identifier of the certificate B in the subsequent position. Please refer to the example below, which assumes that:
Identifier of A: 1427353136
Identifier of B: 1427353426
trustChains parameter single path example
“trustChains” : [ [ “1427353136”, “1427353426” ] ]
In the aforementioned example, if the same C certificate is present but with an alternative trust chain, namely A→B2→C,
It is possible for devices to establish a connection with OpenGate through the utilisation of an authentication system based on a Public Key Infrastructure (PKI). The Certificate Provision API facilitates the administration of certificates.
Creating a certificate
Warning
It is necessary to upload the files (JSON request and certificate) with the content-type header as multipart/form-data. For further information regarding supported file types, please refer to the Supported File Types section.
In order to create new certificates, it is first necessary to be aware of the following tips:
A user is permitted to upload a certificate to the platform, which may be in their own domain or in any of the domains with a low hierarchy that are managed by the user.
A certificate can only be signed by a certificate uploaded to the platform with the usage code CERT_SIGN. Furthermore, the aforementioned certificate must be in the same domain or in a domain with a visible upper hierarchy.
It is permissible to upload the same certificate to the platform on numerous occasions, provided that the identification data is different on each occasion.
In the event of a change to the domain of a certificate, the trust chain will be updated in a manner that is consistent with the principle of least privilege. This entails the inclusion of only those certificates that are associated with visible domains within the new domain.
Reading a certificate
A user is only permitted to access the certificates in their possession.
Deleting a certificate
A user is only permitted to remove certificates in respect of which they are the owner.
Searching certificates
Fetch parameter
The fetch parameter in the URL request, /north/v80/search/certificates?fetch={value}, enables the retrieval of different response objects. The value of this parameter can be any of the following:
0: In the absence of the aforementioned parameter, the default value is as stated. The result is delineated in the section pertaining to the Certificate object structure.
1: A comprehensive account of the data pertaining to the certificates exhibited in the “trust chains” object, inclusive of the “entities” object.
Visibility parameter
The utilisation of the visibility parameter within the URL request, /north/v80/search/certificates?visibility={value}, enables the retrieval of disparate response objects. The value of the parameter, {value}, can be:
assignable: In this instance, the relevant certificates will be issued, which can then be assigned to domains, channels and devices. It should be noted that these certificates are associated with the user’s domain or, where applicable, the user’s domain or domains with a visible upper hierarchy.
administrable: In the absence of the parameter, the default value is returned. Consequently, the user will receive the certificates that can be administered, that is to say, the certificates that can be managed, including the option to update or delete them. The certificate in question belongs to the user’s domain or to domains with a low hierarchy managed by the user.
Note
It is anticipated that the option with a summary will be available in future versions.
This feature is only available to root and super_admin_domain profiles. Ask your administrator for proper user role profiling.
Introduction
An APN (Access Point Name) functions as a conduit between a mobile network and the Internet. The APN entity stores information pertaining to the access point names of M2M networks, which devices utilise to establish a connection with IoT applications.
API specification
GGSN
Limited access
This feature is only available to root and super_admin_domain profiles. Ask your administrator for proper user role profiling.
Introduction
The OpenGate platform has the capacity to receive information regarding the operational status of M2M communications networks from either the Remote Access Servers or delegated Radius Servers.
These diverse types of nodes are able to relay Radius information to the platform, specifically Radius Accounting packets.
GGSN - RADIUS clients
Gateway GPRS support nodes are integral components of the mobile operator’s network, possessing the capability to forward RADIUS requests.
API specification
Data retrieval
Everything OpenGate stores about your fleet is queryable through one consistent mechanism: POST a JSON
query, get rows back. There is no query string to assemble and no SQL to learn — the resource lives in the
URL, and the conditions live in a JSON body.
How a query is built
flowchart LR
URL["<b>The URL</b><br>what you are querying<br>/north/v80/search/devices"] --> REQ(["POST"])
BODY["<b>The JSON body</b><br>which rows you want<br>filter, select, sort, group, limit"] --> REQ
REQ --> RES["<b>Rows</b><br>JSON or CSV"]
Two things to learn, and this section is organized around exactly that:
What you can query — the index of every search endpoint, so you know which URL
to POST to.
Data Lake — the query language: filter, select, sort, group and limit.
Then, because three kinds of storage answer slightly differently, Query dialects
lays their differences side by side.
Your first query in 60 seconds
Ask for your devices. No filter, no options — just the resource:
You get an array named after the resource. Each row is a flat map of dotted field paths, and each value
is wrapped in _value._current.value — the same shape the platform uses to hold a current value and its
metadata:
Run the query with an empty body first. The paths you see in the response are exactly the paths you can
filter, sort and select on — which is the fastest way to learn any resource’s fields.
Swap devices in the URL for datapoints, entities/alarms or any resource from
What you can query, and the same body shape applies — only the field names change.
Every query in OpenGate is a POST to a URL that names what you are querying, with a JSON body that
says which rows you want. This page is the index of that first half: find your resource, take the URL,
and write the body using the query language.
The URL pattern
POST https://api.opengate.es/north/v80/search/<resource>
That covers most resources, which are global or scoped by your API key. Two families depart from it, and
knowing which one you are in saves a lot of guessing.
Time series and data sets — you query one named store, so the organization and its identifier are part
of the URL:
POST /north/v80/timeseries/provision/organizations/{organization}/{identifier}/data
POST /north/v80/datasets/provision/organizations/{organization}/{identifier}/data
Operations — note the missing north prefix, which the operations service predates:
Most search endpoints have a twin ending in /summary that returns aggregated counters instead of rows.
Same URL, same body, different answer: use it when you want how many, not which ones. See
Summary. Endpoints offering it are marked below.
Paths in the tables below
Paths are shown relative to /north/v80, except in the operations table, where they are relative to
/v80. A + in the Summary column means the endpoint also has a /summary twin. {org} is the
organization name and {id} the identifier of the time series or data set.
The clause syntax is the same everywhere, but the field names depend on the resource. They are dotted
paths, and entity searches expose two families of them:
Data sets and time series, where you define the columns yourself
Arrays are addressed with [], optionally indexed:
provision.device.communicationModules[].mobile.imei.
Each resource’s filterable fields are listed in its own API specification, rendered on the page named in the
tables above. The fastest shortcut, though, is to run the query with an empty body {} and read the paths
off the response: those are exactly the paths you can filter, sort and select on.
Data Lake
Searching data with OpenGate API
The searching API lets you retrieve provisioned and collected information from the entities registered on the platform.
Using search API, you can manage many situations in which you need to get information, collected by OpenGate, about your remote devices.
Some examples of questions you can answer using the searching API are:
Where is my lost truck?
Is my vending machine connected to Internet?
What is the software version of this smart meter which is rebooting all the time?
How is the signal strength of this weather station which is off-line most of the time?
What are the latest operations launched over different devices and their current status?
What are the latest raised alarms associated with my in-field resources?
What is the latest value and history of different sensors and machine parameters?
Searching Features
Where are the FROM and WHERE?
Well, if you’re still thinking in SQL, then you’ll expect to find the word FROM anywhere. Remember, OpenGate exposes its API through a REST interface, so in this case the word FROM is in the URL suffix.
That suffix is the resource you are querying, and every available one is listed in
What you can query. The WHERE — and the ORDER BY, the SELECT and the
GROUP BY — is the JSON body described below.
In all response cases, you must POST a valid JSON query and you’ll get an array with the matched specific resources. The query could have next main objects:
filter: Allows to select the resources that meets with desired information, see Filtering
limit: Allows paginating the response, see Pagination
sort: Allows sorting the results, see Sorting
select: Allows selecting only the parameters you need, see Selecting
Searching in OpenGate platform is pretty easy. You have to send a HTTP request to the API using the POST method, the prefix always is /north/v80/search. Optionally you can attach a JSON file (in the HTTP body) if you need to use paging, sorting, selecting, grouping or filtering features.
You can use the URL above for searching information. So for the impatient, let’s suppose you’re trying to search over your previously provisioned device list, and you’re thinking in a SQL WHERE clause like that:
name like'device_name'AND (
serialNumber like'82A75D494B0EBF7A95587285AE78E83F'OR serialNumber like'08D83B1864A1F9CFED76DAF426EB04D7')
Where the clauses behave differently: time series and data sets
accept the same syntax with stricter rules and a different response shape. The differences are collected
in Query dialects.
Subsections of Data Lake
Filtering
The search API uses the following filtering options to facilitate the search and allow to perform a wide range of consultations.
Several techniques solve the filtering issue when you’re querying over a RESTful interface. For example, you can use standard HTTP parameters to add filtering capabilities to your query. It’s pretty simple but doesn’t cover complex needs. We require a SQL-like approach, with typical operators like AND, OR, EQUAL, NOT EQUAL, etc. OpenGate allows you to filter your queries by sending a POST request to a specific URI. In the POST request, you must send a JSON document with a fashionable DSL structure. It is a command pattern approach in contrast with the entity/collection pattern used in the provisioning API.
Filtering operators
Filtering comparison operator list
eq: Equals.
neq: Not equals.
like: Regex pattern like.
gt: Greater than.
lt: Lower than.
gte: Greater than or equals.
lte: Lower than or equals.
in[]: Included in a concrete group.
nin[]: Not included in a concrete group.
exists: Exists.
within: Included in an areas.geometry GeoJson (exclusive for Area search).
See supported identifiers for existing comparison operator.
Let’s suppose we want to filter devices with device.operationalStatus equals to NORMAL and with device.communicationModules[].mobile.imei starting with 351873000102290.
If we were dealing with a SQL database we’d write the following SQL sentence:
SELECT*FROM device
WHERE device.operationalStatus LIKE'NORMAL'AND device.communicationModules[].mobile.imei LIKE'351873000102290'
Note
Remember, you can use all the data streams defined in the default data models and your own data streams in the WHERE clause.
Translating the previous SQL sentence to OpenGate searching API we’ll have:
{
"filter": {
"and": [
{
"like": {
"provision.device.administrativeState": "NORMAL" }
},
{
// The result will contain all devices with collected operational Status that
// contains NORMAL and are related with communications modules with collected
// imei containing 351873000102290
"like": {
"provision.device.communicationModules[].mobile.imei": "351873000102290" }
}
]
}
}
The result will contain all devices with collected operational Status that contains NORMAL and are related to communications modules with collected imei containing 351873000102290.
Another example comparing SQL to JSON, searching all devices except the one with serialNumber equal to 82A75D494B0EBF7A95587285AE78E83F:
SELECT*FROM device WHERE serialNumber <>'82A75D494B0EBF7A95587285AE78E83F'/north/v80/search/devices
By default, the search response includes all the data streams of the searched entities. You can retrieve only the information you need using the select sub-document in the search JSON.
The select sub-document can be used only on entity searching and must not be empty.
You can also use this sub-document when you search for information in CSV format.
Warning
If the size of the CSV file exceeds 18MB, you must paginate your searchings using the following parameters as HTTP headers:
page: It sets the CSV page you want.
size: It sets the number of rows you want in the CSV.
If the select clause isn’t in the filter, the behavior is the following:
In JSON format, the response will contain all the data streams collected or provisioned in the devices you are searching.
In CSV format, the search API raises an error in the response, asking for the select clause.
As described above, any data stream of the default data models or data models defined by the user can be used as select fields.
The order to apply the filters is securitization and next the following fields whenever there are resourceType, sort, filter, select (the data streams to show)
Select JSON object
select[]: Array of parameters to be selected.
name: String. Data stream name in the default or user-defined data models.
fields[]: Array of strings with the name of the fields to be retrieved.
The possible values are: (See current object attributes table for field description):
value
date
at
from
tags
feedId
scoring.performance
scoring.qrating
provType
value.simplexAttribute: where simplexAttribute is an attribute of the complex object. For example, the provision.device.location is a complex data stream. If you need only de postal code, the value would be value.postal
alias: String. Shortname replaces the parameter’s full name when a CSV format is required. Example:
Using “alias”=“imei”
The device.communicationModules[].mobile.imei becomes imei in the CSV header
The complete data stream name in the CSV header will appear if this field doesn’t exist. The CSV format shows this field, but the JSON format ignores it.
Select examples
Here’s how to search devices with a filter with a select clause
The following snippet shows the request using curl:
The API allows you obtaining the response to a search in blocks with predefined number of results.
limit:
start: Page number you request. The count starts with the number 1
size: The number of entities that you can see on the page
Default number of items returned
The search API limits the page size to 50 items by default, but you probably have thousands of devices. How do you walk through all your devices?
Well, let’s suppose you have exactly 2500 devices matching your query. Obviously, your result exceeds the default limit. In this case, you’ll find a page object in your response.
Please, take the resources field on the previous example as a placeholder for any reserved word into the scope of the searched resource: entities, devices, subscriptions, data models, bundles, data streams, data points, etc.
The number attribute is the current number of pages based on the limit setup.
What can you do to get the following page? It’s easy. You only have to include a limit object in your query. See next example.
See previous warning about the resources word in the example.
You can change the page limit from the beginning. Supposing you want to retrieve 50 items per query, you must set up the limit object with a starting point and the page size you want.
Paginated example request
Changing the starting page and the limit
{
"limit": {
"start": 2,
"size": 50 }
}
The top margin for the page size in the limit object is 1000. You’ll receive a server error response if you set up a size attribute over this limit.
See previous warning about the resources word in the example.
Summary
Responses to all search requests include a summary object with different counters regarding the results obtained. It is closely related to the grouping feature.
By default, the summary always shows the total count, the organization’s grouping counter, and the channel grouping counter.
count (field): number of occurrences found in the whole search
summaryGroup []: array of type of summarized specific object structure
SpecificObjectParameterDatamodel: object inside the Parameter of the data models
count: number of these specific elements found
list: array of each type of summarized element
count: number of these specific elements found
name: value of the parameter of the data model
Here’s how to search devices with a summary without a group clause
The five clauses — filter, select, sort, group, limit — look the same everywhere, but three
kinds of store answer them slightly differently. This page is the diff, so you do not have to read three
long pages to find it.
An object of parameters, each a field and a direction
A string: the identifier of a sort declared in the definition
A string: the identifier of a sort declared in the definition
group
Supported
Not applicable
Does not exist
limit
start and size
Same, with CSV caveat below
Same, with CSV caveat below
Response
Array named after the resource
columns plus data matrix
columns plus data matrix
CSV output
—
Yes
Yes
Why time series and data sets are stricter
Both are pre-computed projections: you declare their columns up front, and the platform builds indexes
for exactly those. That is what makes them fast, and it is also why you cannot filter or sort on an arbitrary
field.
Sorting is declared, not composed. A generic search accepts any field in its sort object. A time series
or a data set accepts only the identifier of a sort declared in its definition — a named, ordered list of
columns with directions — plus the reverse of each one, which the platform exposes automatically because the
same index serves it backwards. There is no per-column sortable flag and no cap on how many sorts a
definition may hold.
The real limit is a budget, not a number. Each filterable column and each declared sort consumes
optimization units, and each definition has a budget of them. Both stores offer an optimizationPlan
endpoint that reports what a definition would consume before you commit, and expose
usedSearchOptimizationUnits and freeSearchOptimizationUnits on the definition itself.
Filters have four modes, not two: NO, YES for optional equality, ALWAYS for a filter every query
must supply, and RANGE for >, < and BETWEEN. RANGE applies to numeric columns only; date-time
columns are always range-searchable.
The matrix response
Generic searches return objects, one per row. Time series and data sets return a matrix instead: a
columns array naming the fields, and a data array of rows, each row an array of values in that same
order.
Read the values off columns rather than hardcoding positions. If you do rely on the order, this is what it
is when you omit select:
Store
Column order without select
Time series
bucketColumn, then identifierColumn, then the context columns, then the aggregated columns
Data sets
identifierColumn, then the defined columns.name in declaration order
Time series additionally offer an aggregated read, POST .../{id}/dataset, which collapses every bucket
of a device into a single output row. There select.columns takes a column, an alias and an
aggregation function per output variable, and the result is always sorted ascending by identifierColumn,
which is included whether you ask for it or not. See Time series.
CSV output changes the rules
Time series and data sets can answer in CSV instead of JSON, and that switch changes two behaviours that
surprise people:
limit flips meaning. In JSON, omitting limit applies the configured defaults. In CSV, omitting it
means give me everything:
Sorting is disabled. CSV retrieval turns sorting off deliberately, to keep large exports fast. If you need
ordered output, either sort downstream or use the JSON response.
Complete retrieval is expensive
Omitting limit in CSV mode downloads the entire store. On a large time series that is a long, heavy request.
Page it unless you genuinely want everything.
CSV formatting — the quoting character, the escape character, the end-of-line sequence and how nulls are
represented — is customizable through HTTP header options, and you are responsible for the result being
well-formed CSV.
Undocumented header names
The specific header names for those CSV options are not currently published in the API specification. Until
they are, ask your platform contact for the exact names.
What stays the same
Worth stating plainly, because it is most of the surface:
POST with a JSON body, always.
X-ApiKey for authentication.
The filter operators — eq, neq, like, gt, lt, gte, lte,
in, nin, exists, and, or — behave identically in all three dialects.
limit uses start and size everywhere.
The utc=true header option returns date fields in UTC in all of them.
Alarms
An alarm is what OpenGate raises when a rule detects something worth a human’s attention: a device that
stopped reporting, a value out of range, an identification conflict. This API is how a back-office
application finds them, counts them, and records that somebody dealt with them.
The alarm life cycle
stateDiagram-v2
direction LR
[*] --> OPEN: a rule raises the alarm
OPEN --> ATTENDED: action ATTEND
OPEN --> CLOSED: action CLOSE
ATTENDED --> CLOSED: action CLOSE
CLOSED --> [*]
Status
Meaning
OPEN
The alarm is active
ATTENDED
An operator is dealing with it
CLOSED
The alarm is closed
Two more attributes tell you how much it matters:
Attribute
Values
severity
INFORMATIVE (only informative) · URGENT (needs attention soon) · CRITICAL (critical for service operation)
priority
LOW · MEDIUM · HIGH
Endpoints
To
POST to
Search alarms on any entity
/north/v80/search/entities/alarms
Search alarms on devices
/north/v80/search/entities/devices/alarms
Search alarms on subscriptions
/north/v80/search/entities/subscriptions/alarms
Count instead of list
The same three URLs with /summary
Attend or close alarms
/north/v80/alarms
Searches follow the standard query language: filter, select, sort, group and
limit, with results in JSON by default or CSV through header options.
Everyday queries follow from those: everything still open and critical, everything a given operator
attended, everything raised on one device last week.
Summaries group by alarm.name, alarm.rule, alarm.status and alarm.severity. Any other field
returns 400 Bad Request.
Attending and closing
Alarms are not deleted, they are moved along their life cycle. One request handles a batch, and the notes
field records why — which is what makes the alarm history auditable afterwards:
curl --request POST \
--header "X-ApiKey: <your-api-key>"\
--header "Content-Type: application/json"\
--data '{"action": "CLOSE", "alarms": ["50dca9ab-f552-4805-9cff-019090d5b92b"], "notes": "notes of the reason"}'\
https://api.opengate.es/north/v80/alarms
Field
Holds
action
ATTEND or CLOSE
alarms
The identifiers to act on, one or many
notes
The reason, stored as attentionNote or closureNote
The user performing the action is recorded in attentionUser or ClosureUser, with its timestamp, so you
can query later who handled what.
API specification
Data points
Deprecated — superseded by Time series
Data points are superseded by time series, and their availability in future versions
of OpenGate is not guaranteed.
Do not build new integrations on this API. If you are querying data points today, plan the move: define a
time series with the columns and aggregation you need, and query that instead.
What a data point is
A data point is one instance of a data stream at one instant. Its at attribute is when the measurement
was taken, and the whole set of data points for a data stream is the raw history of that measurement.
The practical difference shows up at fleet scale: asking a month of readings for ten thousand devices means
millions of data points to transfer and reduce yourself, versus a pre-aggregated table that answers in one
request.
Querying data points
While the API remains available, it is a standard Data Lake search:
Filter fields are prefixed datapoints., so datapoints.datastreamId, datapoints.entityIdentifier and
the _current fields of the value.
Response format
Results come back as JSON by default or as CSV through header options. A flattened parameter returns each
data point flat instead of nested, which is easier to feed into a table — see the datapoint parameters in the
specification below.
API specification
Data sets
Limited access
This feature is only available to root and super_admin_domain profiles. Ask your administrator for proper user role profiling.
What a data set is
A data set is a flat table over your devices: one row per device, one column per value you chose. You
pick the data streams that become columns, and the platform keeps the table current.
It is the answer to “give me a spreadsheet of my fleet” — the identifier, the model, the ICC, the last
reading — without writing a query that walks each device’s data streams and flattens the result.
Column values are limited to strings, numbers and booleans. If a data stream holds an object or an
array, the column definition has to include a path down to one of those primitive values. Devices with
communication modules need one column per module.
The two halves of the API
Defining a data set is administration: choose the columns, their paths, and which of them
are filterable, and declare the sorts a query may ask for. Done once.
Querying a data set is the daily work: POST a filter, read rows back as JSON or CSV.
Defining a data set means choosing which data streams become columns. This is administration work, done
once per data set.
The identifier column
Every data set needs an identifierColumn. It maps to
provision.administration.identifier._current.value, with filtering enabled and sorting available, and it
identifies the device each row belongs to.
Column paths
A column’s path has three parts, and the third is only required when the data stream is not a primitive
value.
1. The data stream identifier — the datastreamId you want. If it contains communicationModules[],
include the index of the module you mean:
3. The value path — when the data stream holds an object or an array, a path down to a primitive value.
What a column can be filtered by
Every column carries a filter value that decides how queries may use it:
Value
Meaning
NO
Not filterable. The default
YES
Optional equality filter
ALWAYS
Required equality filter: every query must constrain this column
RANGE
Range filter, >, < and BETWEEN, as well as equality
RANGE is only allowed on numeric columns, integer and number. Columns of type date-time are
always range-searchable whatever the value says.
The sorts section
Sorting is declared in the definition, not composed at query time. The sorts section holds a list of
named sorts, each an ordered list of columns with a direction, and a query asks for one by its
identifier.
Required, unique within the list. Letters, digits, spaces, _ and -. Generated as a UUID if omitted, so name it
description
Optional free text
columns
Required, at least one. A column name from the columns section plus ASC or DESC
At least one sort is mandatory, and the order inside columns is the sort precedence.
The reverse of every sort comes for free
For each sort you declare, OpenGate also exposes its reverse, served by the same index through a reverse
scan. Those come back marked derived: true, which is read-only: the platform sets it and the web console
uses it. Never declare a derived sort yourself — flipping the direction of one you already have just spends
optimization units on an index you were given.
Limits
There is no fixed maximum number of filterable columns or declared sorts. Each filterable column and
each declared sort consumes optimization units, and the data set has a budget of them — that budget is
the limit.
Where to look
What it tells you
The searchOptimizationInfo of a data set
usedSearchOptimizationUnits and freeSearchOptimizationUnits
POST .../optimizationPlan
What a definition would consume, before committing to it
POST /north/v80/datasets/provision/organizations/{organizationName}/optimizationPlan
Creating
POST /north/v80/datasets/provision/organizations/{organizationName}
Updating
PUT /north/v80/datasets/provision/organizations/{organizationName}/{identifier}
Updating can affect the data already stored or the structure holding it, which starts an adaptation process.
Until it completes, dirty values may be present.
These fields can be modified:
Name · Description · IdentifierColumn · Columns · Sorts
Rules for columns:
Names are unique. You cannot add or rename a column to a name already in use.
filter: ALWAYS is immutable. You cannot add or remove a column that has it, you cannot set it on an
existing column, and you cannot change it away once set.
Paths cannot be edited. Remove the column and create it again, which gets you the same result.
The optimization unit budget applies to updates as well, so run optimizationPlan before adding filterable
columns or sorts to a definition that is already close to it.
Listing and deleting
GET /north/v80/datasets/provision/organizations/{organizationName}GET /north/v80/datasets/provision/organizations/{organizationName}/{identifier}DELETE /north/v80/datasets/provision/organizations/{organizationName}/{identifier}
Read the organization’s data sets:
curl --request GET \
--header "X-ApiKey: <your-api-key>"\
https://api.opengate.es/north/v80/datasets/provision/organizations/{organizationName}
Querying a data set
Reading a data set is a POST with the data set identifier in the URL:
POST /north/v80/datasets/provision/organizations/{organizationName}/{identifier}/data
Without a select clause, columns holds the identifier column first, then the defined columns in
declaration order.
The request body
Data set queries use the same clauses as any other search, with two differences worth memorising:
Clause
In a data set query
filter
Standard operators, keyed by identifierColumn or a column name
sort
A string: the identifier of a sort declared in the data set — see below
select
An array of column names, not the object form used elsewhere
limit
start and size, as everywhere else
group
Does not exist for data sets
The full comparison against the other query dialects is in Query dialects.
Asking for a sort
You do not compose an ordering in the request. You name one that already exists:
{ "filter": {}, "sort": "sortByDeviceAsc" }
Valid values are the identifier of any sort in the data set definition, plus the automatically exposed
reverse of each one, so declaring an ascending sort gives you the descending direction too.
Omit sort and results come back sorted by the identifier column, ascending.
There is no fixed limit on how many sorts a definition can hold; the constraint is the optimization unit
budget, described in Defining a data set.
Pagination and CSV
Data sets answer in JSON or CSV, and the format changes what an absent limit means:
CSV retrieval turns sorting off on purpose: it is what makes large exports fast, and CSV output is
usually consumed by something that will sort it anyway.
Complete retrieval is expensive
Omitting limit in CSV mode downloads the whole data set. Page it unless you truly want everything.
CSV formatting is customizable through HTTP header options — the quoting character (double quotes by
default), the escape character (a backslash by default), the end-of-line sequence (\n by default) and how
nulls are represented. You are responsible for the combination producing well-formed CSV. The exact header
names are not currently published, so ask your platform contact for them.
The other data set endpoints
Three more endpoints exist, and one of them is not what its URL suggests:
POST /north/v80/search/catalog/datasets
POST /north/v80/search/organizations/{organizationName}/datasets/{datasetId}POST /north/v80/search/organizations/{organizationName}/datasets/{datasetId}/summary
search/catalog/datasets lists the data sets available to you.
The other two are not a mirror of the .../data read above: they take a different request body. The
.../data endpoint uses the data set’s own dialect — sort as a declared identifier, select as an array
of column names, no group. These two take the generic Data Lake search body, with sort as the
{"parameters": [{"name": ..., "type": ...}]} object, select in its object form, and group available.
Endpoint
Request body
datasets/provision/.../{identifier}/data
Data set dialect: sort is a declared sort identifier
Use .../data unless you specifically need the generic clauses. Which of the two is intended to be the
long-term path has not been confirmed by the product team.
Data streams
A data stream is one measurement of a device — battery percentage, temperature, signal strength — and
this API returns its current value, not its history.
Each instance has an alphanumeric identifier unique within its device. When that identifier matches a data
stream template of the device’s data model, the instance inherits the template’s characteristics: units,
period, tags and the rest. That is why a response carries not just a value but the metadata to interpret it.
Label, symbol and type, so the number is interpretable
period
How often the value is expected, INSTANT for on-change values
datamodelId
The data model the definition comes from
access
Whether the stream is readable, writable or both
_current.value
The value itself
_current.date
When the platform recorded it
_current.at
When the measurement was actually taken
The distinction between date and at matters when a device buffers readings and reports them later: at
is the truth about the measurement, date is when OpenGate learned about it.
Filter fields are prefixed datastreams., and results come back as JSON by default or as CSV through header
options.
API specification
Time series
Limited access
This feature is only available to root and super_admin_domain profiles. Ask your administrator for proper user role profiling.
What a time series is
A time series turns the stream of values a device sends into a table of rows over time: one row per
device per time period, with each column holding a value aggregated over that period.
Ask for the average temperature per hour of ten thousand devices for the last month. Over
data points that is millions of raw values to fetch and aggregate yourself. Over a
time series it is already computed — the engine aggregated each hour as the data arrived.
That is the trade: you declare up front what you want aggregated and how, and in exchange the query is
cheap.
Time buckets
The aggregation period is called a time bucket, and two fields define it:
Field
Meaning
origin
The starting date of the time series
timeBucket
The length of each period in seconds, counted from origin
With an origin of 2022-01-01T00:00:00.000Z and a one hour bucket, the first period runs from
2022-01-01T00:00:00.001Z to 2022-01-01T01:00:00.000Z, the second from 2022-01-01T01:00:00.001Z to
2022-01-01T02:00:00.000Z, and so on:
Setting timeBucket to 0 seconds switches the engine into a different mode, storing every value instead
of aggregating:
With only context columns defined, one record is saved per event received, and only when a column
value actually changed — so you get a change log over time.
With aggregated columns defined, data is grouped by the at field of the incoming data points, and
the aggregation function is applied when a new event arrives with the same at.
Defining a time series is administration: you declare the columns, their aggregation
functions, the bucket length and the retention. Done once, usually by an administrator.
Querying a time series is what applications do every day: POST a filter and read rows
back, as JSON or CSV.
The aggregation functions available to columns come from the
time series functions catalog, which also lets you register your own.
Defining a time series is declaring, up front, what the engine should compute as data arrives. This is
administration work: done once, changed rarely, and with consequences for data already stored — the last
section of this page covers those.
Columns
A time series has four kinds of column, and only the first two are yours to name freely.
Aggregated columns (columns)
These hold a value aggregated over each time bucket. Each one names an aggregation function, and the
engine re-applies it every time new data lands in an existing row. The available functions come from the
time series functions catalog.
When timeBucket is 0, all received data is stored instead of aggregated, and only FIRST (keep the
first value) or LAST (overwrite with the newest) make sense. Two consequences worth knowing:
The search endpoint returns all the historical data collected.
Several data streams can land in different columns of the same row when they share an at value.
When timeBucket is greater than 0, bucketColumn becomes required: it names the column the engine
adds to search responses holding the end date of each bucket.
Context columns (context)
Context columns capture the value at the moment the bucket was created, and are never updated
afterwards even if the aggregated columns keep changing. That is why they take no aggregation function.
Use them for the things you want to know about the device at that point in time — its serial number, its
firmware version, its subscription — so that a row is self-describing.
Identifier column (identifierColumn)
Required. It names the column that identifies the device, and always maps to
provision.administration.identifier._current.value with filter=YES. The engine adds it to every row of
every search result, using the name you chose.
Bucket columns (bucketColumn, bucketInitColumn)
Named by you, filled by the engine, holding the end and start instants of the bucket.
The path field
Every column and context needs a path, which the engine uses as a query to extract a data stream value
and project it into the column. A path has two or three parts:
1. The data stream identifier — a data stream defined in an OpenGate data model.
Communication modules need an index
If the data stream id contains communicationModules[], the index is required:
device.communicationModules[0].subscription.mobile.imsi
2. The data stream field — appended with a dot, one of:
3. The value path — only when the data stream holds a JSON object or array, a JSONPath down to a
primitive value.
What a column can be filtered by
Every column and context carries a filter value that decides how queries may use it:
Value
Meaning
NO
Not filterable. The default
YES
Optional equality filter
ALWAYS
Required equality filter: every query must constrain this column
RANGE
Range filter, >, < and BETWEEN, as well as equality
RANGE is only allowed on numeric columns, integer and number. Columns of type date-time are
always range-searchable whatever the value says, so you do not need RANGE for a bucket or a timestamp.
Retention
retention sets how long rows stay in the time series, in seconds. It cannot exceed the retention allowed
by your organization’s policies.
The sorts section
Sorting is declared in the definition, not composed at query time. The sorts section holds a list of
named sorts, each one an ordered list of columns with a direction, and a query then asks for a sort by its
identifier.
"sorts": [
{
"identifier": "signalStrengthAsc",
"description": "Sort by average signal strength ascending",
"columns": [
{ "name": "Average Signal strength", "direction": "ASC" }
]
},
{
"identifier": "bucket_id_desc",
"columns": [
{ "name": "bucket_id", "direction": "DESC" }
]
}
]
Field
Rules
identifier
Required, unique within the list. Letters, digits, spaces, _ and -. Generated as a UUID if you omit it, which makes it awkward to use, so name it
description
Optional free text, for whoever reads the definition later
columns
Required, at least one. Each entry is a column name from the columns or context sections plus a direction of ASC or DESC
At least one sort is mandatory. Order matters inside columns: the list is the sort precedence.
The reverse of every sort comes for free
For each sort you declare, OpenGate also exposes its reverse, served by the same index through a reverse
scan. Those appear in the definition marked derived: true, which is read-only: the platform sets it and
the web console uses it. Never declare a derived sort yourself on create or update — flip the direction of
an existing one and you are duplicating an index you already have.
Filtering and sorting limits
There is no fixed maximum number of filterable columns or declared sorts. Instead, each filterable
column, each context and each declared sort consumes optimization units, and each time series has a
budget of them. That budget is the real limit, and it is what keeps queries fast.
Where to look
What it tells you
The searchOptimizationInfo section of a time series
usedSearchOptimizationUnits and freeSearchOptimizationUnits
POST .../optimizationPlan
What a definition would consume, before you commit to it
Simulate with optimizationPlan while you are still designing. It is much cheaper than discovering the
budget is spent after the fact — and since the reverse of each sort is free, declaring both directions
wastes units for nothing.
Creating and updating
Creating a time series starts collecting data from devices into it. Updating one is where care is needed:
changes can affect the data already stored or its structure, which triggers an adaptation process. Until
that process finishes, dirty values can be present.
PUT accepts an onlyPlan query parameter. With onlyPlan=true nothing is modified: the response is a
plan that summarizes the changes you asked for and explains their consequences, warning you where
necessary. Default is false.
Use it on any non-trivial change. It is the difference between reading about dirty values and causing them.
Rules for columns and contexts:
Names are unique across all columns, contexts, the identifier and both bucket columns. You cannot
rename something to a name already in use.
filter: ALWAYS is immutable. You cannot add or remove a column or context that has it, you cannot
set it on an existing one, and you cannot change it away once it is set.
Paths cannot be edited. Remove the column and create it again, which gets you the same result.
Creation example
A daily time series (timeBucket: 86400) retained for 30 days, with one context column and one aggregated
column summing the bytes a device sent:
The reverse of that sort, oldest bucket first, is available without declaring it.
Changing the time bucket
Buckets have a fixed length, so changing timeBucket changes the length of new ones. As a precaution,
buckets in the future are deleted when you do this. The situations below are the edge cases worth
understanding before you change it on a live time series.
Buckets that started before the change and end after it
The engine closes them at the instant of the update, and if needed the next bucket starts at that same
instant and runs until the following one would start according to the new definition.
Changing the time bucket to a lower value
Changing the time bucket to a bigger value
Devices with no buckets yet
Adaptation only applies to devices that collected data before the change. A device whose first data arrives
after the update simply gets a bucket following the new definition.
Changing the time bucket before the first data collection of a device
Both at once
Combine the two and different devices end up with buckets that do not line up with each other. A device can
also collect data belonging to a bucket in the past: if that bucket exists the engine uses it as is,
otherwise it creates a new one following the new definition. Both are the price of changing the bucket
length.
Two devices with different buckets after changing the time bucket
Two devices with different buckets in the past after changing the time bucket
From zero to a higher value
Going from timeBucket: 0 to a real length means each collection now creates a bucket of the new length.
Zero-length buckets that the new bucket would overlap are absorbed rather than left behind, and their
values feed the aggregation functions of each column.
Changing the time bucket from zero to a higher value
The standard operators, keyed by bucketColumn, identifierColumn, columns.name or context.name
sort
A string: the identifier of one of the sorts declared in the time series, not a list of fields
select
The same keys as filter
limit
start and size, as everywhere else
Two things differ from a plain Data Lake search, and both come from the time series being pre-computed:
you can only filter on columns declared filterable, and you can only sort by sorts declared in the
definition. See Defining a time series for how those are declared, and
Query dialects for the full comparison.
Column order when you omit select
columns tells you the order, so read values off it rather than hardcoding positions. If you do depend on
the order, it is:
The bucketColumn, holding the end date of the bucket
The identifierColumn, holding provision.administration.identifier._current.value
The context columns
The aggregated columns
Asking for a sort
You do not compose an ordering in the request. You name one that already exists:
{ "filter": {}, "sort": "bucket_id_desc" }
Valid values are the identifier of any sort in the time series definition, plus the automatically
exposed reverse of each one. So a definition declaring bucket_id_desc gives you both directions without
declaring the second.
Read the definition to see what is available — GET the time series, or use expand=sorts, and the sorts
list comes back with the derived ones included. There is no fixed limit on how many sorts a definition can
hold; the constraint is the optimization unit budget, described in
Defining a time series.
Pagination and CSV
The response format changes what limit means, which catches people out:
CSV retrieval also turns sorting off, deliberately, so that large exports stay fast. If you need ordered
output, sort downstream or read JSON.
Complete retrieval is expensive
Omitting limit in CSV mode downloads the whole time series. Page it unless you truly want everything.
The CSV formatting itself — quoting character, escape character, end-of-line sequence and how nulls are
represented — is set through HTTP header options, and you are responsible for the result being well-formed.
The exact header names are not currently published, so ask your platform contact for them.
Aggregated read: one row per device
Besides reading buckets, you can collapse every bucket of a device into a single row:
POST /north/v80/timeseries/provision/organizations/{organizationName}/{identifier}/dataset
Here select.columns describes the output variables, each with the source column, an alias for the
output name, and the aggregation function to apply across buckets:
filter and limit behave as above, and CSV output is available too. Two rules are specific to this
endpoint:
The output is always sorted ascending by identifierColumn.
The identifierColumn is always included, added as the first column if you did not ask for it.
Parquet export
For bulk analytical work, a time series can be exported to a Parquet file:
POST /north/v80/timeseries/provision/organizations/{organizationName}/{identifier}/export
GET /north/v80/timeseries/provision/organizations/{organizationName}/{identifier}/export
POST starts the export, GET reports the state of the current one. The output order is decided
internally and cannot be changed.
Time Series Functions
Limited access
This feature is only available to root and super_admin_domain profiles. Ask your administrator for proper user role profiling.
Introduction
The objective of custom time series functions is to augment the capabilities of the default functions (see Common Platform Functions) through the addition of bespoke functions written in JavaScript. These functions will be managed through the creation of a catalogue tailored to the specific requirements of each organisation.
Common Platform Functions
A common catalogue will be established for all organisations, comprising default platform time series functions. The following functions have been defined:
FIRST: Please note that the engine will store only the first received value per time bucket. Consequently, the collection engine will ignore the following values obtained in the same time bucket.
LAST: Please note that the engine will store only the last received value per time bucket, overwriting the previous ones.
AVG: The engine will calculate the arithmetic mean of all values received within the specified time interval. This feature is only available for numeric values.
MAX: The engine will save the maximum value of all received values within the configured time frame. Please note that this feature is only available for numeric values.
MIN: The engine will save the lowest value of all received values within the configured time frame. This feature is only available for numeric values.
SUM: The engine will accumulate the total of all received values within the specified time interval. This feature is only available for numeric values.
COUNT: The engine will record the total number of values received in each time bucket for subsequent analysis.
MEDIAN: The engine will calculate the median of all received values within the configured time bucket. Please note that this feature is only available for numeric values.
GEO_AVG: The engine will calculate the geometric average of all received values within the configured time bucket. Please note that this feature is only available for numeric values.
VARIANCE: The engine will calculate the variance of all received values within the configured time bucket. Please note that this feature is only available for numeric values.
STD_DEVIATION: The engine will calculate the standard deviation of all received values within the configured time bucket. Please note that this feature is only available for numeric values.
Note
Please note that these functions will be available for querying with the API defined below. However, please be aware that it will not be possible to modify or delete them.
Custom Catalog
Each organisation will have access to a custom time series functions catalogue, which will enable them to manage their functions effectively. These functions can be used to define time series columns, which can then be referenced in the aggregationFunction field. The following example illustrates this process:
The defined API enables the modification of the script for the custom aggregation function. It should be noted that such modifications may result in changes to the aggregated data. Consequently, there is a possibility of inconsistencies between the new aggregated data and the previous values.
Note
The defined API permits the deletion of a custom aggregation function, provided that it is not utilised in any time series.
Custom Time series Function script
Considerations when developing Custom Aggregation Function:
The following are the code’s implicit input parameters:
receivedValues: an array of new values to be used for the final value calculation.
currentValue: the column’s current value.
extra: JSON object containing the current extra variables for the column, used for the value calculation.
The code should utilise implicit input values to calculate the final value and subsequently construct the result object.
It will be possible to use helper functions defined in the JS API.
The code must return a JSON with three specific properties:
executionResult: If the execution was completed successfully, the OK value must be returned. If not, an error description must be provided.
Any datetime values included in the ‘receivedValues’ input parameter will be formatted as an ISO string.
Note
For further details on how to implement custom aggregation functions, please refer to the JavaScript API documentation, specifically the section on aggregation functions.
Functions values types
To confirm that a time series function can be assigned to a time series column, the valueTypes field will be used. This field is an array of strings that accepts the following values:
integer
number
string
boolean
date-time
These types are the same as those specified for time series column type fields. When assigning a time series function to a specific column, the system will verify that the time series function in the array matches the type specified for that column.
Note
Please note that this field is not mandatory. If it is not defined by default, it will be set to an empty array.
In the event that the time series function has empty valueTypes, no validation will be carried out when assigning to a column.
Note
Please note that it will not be possible to update the time series function and remove one of the ‘valueTypes’ if the function is being used by some column whose type is the removed value. However, if all valueTypes are removed, this should not cause any issues.
Comprehensive API actions
Existing Timeseries Functions List
Getting custom timeserie functions full catalog
In both instances, only the metadata will be retrieved (no script) from both the organisations’ custom timeseries functions and the platform timeseries functions.
Usage examples
Get the full time series functions catalog (organization custom functions plus platform functions, metadata only):
curl --request GET \
--header "X-ApiKey: <your-api-key>"\
https://api.opengate.es/north/v80/timeseries/provision/organizations/{organizationName}/catalog
Trimmed JSON response:
[
{
"id": "01234567890abcdeffffffff",
"name": "customAvg",
"description": "Custom implementation for avg function.",
"valueType": ["integer", "number"],
"catalog": "ORGANIZATION" },
{
"id": "AVG",
"name": "AVG",
"description": "The engine will calculate the arithmetic average of all received values in the configured time bucket. Only available in numeric values.",
"valueType": ["integer", "number"],
"catalog": "PLATFORM" }
]
Create a new custom function (multipart request with a metadata JSON part and a script plain text part):
curl --request POST \
--header "X-ApiKey: <your-api-key>"\
--form 'metadata={"name": "customAvg", "description": "Custom implementation for avg function."};type=application/json'\
--form 'script=@custom_avg.js;type=text/plain'\
https://api.opengate.es/north/v80/timeseries/provision/organizations/{organizationName}/catalog
API specification
Subsections of Time Series Functions
JavaScript API
Timeseries functions JS API guide
This guide describes how to write Custom Timeseries Functions and the contents of the JS API.
The API contains both the implementation of some predefined timeseries functions and some useful functions that can be used when writing Custom Aggregation Functions.
Writing Custom Aggregation Function
Input parameters
All functions will have three implicit input parameters that must be used for value calculation.
receivedValues: Array of Json of collected values. Each value will have two fields:
value: collected value. value type depends on Column’s datastream type (please note that any datetime value will be formatted as an ISO string).
at: datetime of collected value. This value will be defined in ISO string.
currentValue: Columns current aggregated value. The type depends on aggregation function behavior.
extra: Json with useful data for aggregated value updating. In some cases, when aggregated value must be updated, some previous auxiliary data must be used to calculate new values. The fields and their format will be defined taking into account the requirements of the function. For example, if an average data must be updated, previously received number of elements and their sum are necessary to calculate correctly new average value.
There is an auxiliary function that takes value and extra fields as parameters and returns the json with correct format. For further description of this function check documentation.
Result example using auxiliary function:
returnresult.ok(5, {"sum":30}, {"count":6});
If some timeserie function execution throws an exception it will be internally caught. In this case result object will be like this:
The engine will store only the first received value per time bucket. The collection engine ignores the following values obtained in the same time bucket.
Kind: global function Returns: Object - Json with result.
Param
Type
Description
receivedValues
Array
Array of objects with new values to be used for final value calculation.
currentValue
any
Column’s current value.
extra
Object
JSON with auxiliary parameters for final value calculation.
This feature is only available to root and super_admin_domain profiles. Ask your administrator for proper user role profiling.
Analytic tasks
An analytic task is a JSON document that describes an analysis over your stored data. The platform turns
that document into the query it runs against the data store, so the task is a declaration of what to compute
rather than code you write. Some of its fields are mandatory.
Where analytics actually happens
Analytics in OpenGate spans more than this API, and the working documentation lives elsewhere:
To
Go to
Write and run analysis interactively, in Jupyter Lab
If you are looking for how to analyse your data, the Datalab how-to and the notebook scheduler are the
practical route. This page covers only the analytic task API object.
Specification not currently published
The API specification for analytic tasks is not shipped with the documentation at the moment, so the endpoint
reference is unavailable here. Ask your platform contact for the endpoint details in the meantime.
Notebook scheduler
Limited access
This feature is only available to root and super_admin_domain profiles. Ask your administrator for proper user role profiling.
What it is for
The notebooks you write in the OpenGate Data Lab are interactive by nature: you open Jupyter Lab, run cells,
look at results. The notebook scheduler takes a notebook out of that interactive loop and runs it
unattended — once, or on a repeating schedule — with parameters supplied from outside and an optional report
kept for a number of days.
That turns a notebook into a scheduled job: a nightly aggregation, a weekly report, a periodic model
retraining. See the Analytics and Datalab how-to for writing the
notebooks themselves.
Each scheduled execution becomes a cron job in the platform’s Kubernetes cluster, which is why the API talks
about cron jobs and cron patterns.
Endpoints
Authentication uses the Authorization header, not X-ApiKey.
To
Call
List the notebooks available to you
GET /planner/notebooks
Run one notebook now
POST /planner/notebooks/{notebookId}/execute
Schedule a notebook
POST /planner/schedulers
List your scheduled executions
GET /planner/schedulers
Delete a scheduled execution
DELETE /planner/schedulers/{cronjobId}
Check the service is up
GET /planner/health-check
Read the service version
GET /planner/nsversion
Running a notebook once
The body carries the parameters the notebook needs and what to do with its report:
*/5 * * * * runs every five minutes. The five fields are, in order, minute, hour, day of month, month and
day of week.
Reading your scheduled executions
GET /planner/schedulers returns the cron jobs belonging to the current user. Each one reports:
Field
Holds
id
The cron job identifier, which is what DELETE takes
notebook
The notebook being run
schedule
The cron pattern
lastExecutionTime
When it last ran
params
The parameters it passes
generateReport, reportRetentionDays
The report settings
user
The owner
A 204 No Content means you have no scheduled executions, not an error.
API specification
Operations
What is an operation?
An operation is an action that OpenGate executes on a remote entity: reboot a device, update its
firmware, read or write its configuration parameters, run a diagnostic, change its administrative
status. If data collection is how the platform reads from the field, operations are how it writes
to it.
Operations are the answer to a question every IoT deployment eventually asks: I have fifty thousand
devices in the field — how do I make them all do something, and how do I know whether it worked?
Why operations matter
They work at fleet scale. A single API request can target one device or every device matching a
tag or a filter. OpenGate explodes that request into one operation per entity, tracks each one
independently, and gives you both an aggregated summary and the per-entity detail.
They are asynchronous by nature, and modelled as such. A device may be asleep, roaming, or out of
coverage. Operations have their own life cycle, with timeouts, retries, pause and resume, so a
request that cannot be served right now is not a request that failed.
They are extensible without touching your code. An operation is identified by a name and a
parameter object. Adding a new operation type to your organization does not change the API contract:
the same POST endpoint executes REBOOT_EQUIPMENT today and your own CALIBRATE_SENSOR tomorrow.
They report progress, not just outcomes. Operations can be multi-step. A firmware update reports
download progress, installation start and end, and the final result — so a two-hour update over a
narrowband link is observable while it runs.
They are transport-agnostic. Back-office applications always talk to the same north API. How the
operation actually reaches the device (HTTP, MQTT, a connector function) is resolved by the platform.
Operations act on the real world
A single request with a tag or a filter can reach thousands of entities, and cancelling a job does
not roll back steps that already executed. Verify the target selection before activating a job.
The operation model
Five concepts carry the whole service:
flowchart TB
OT["Operation type<br>REBOOT_EQUIPMENT<br>(what can be requested)"]
TASK["Task<br>(a schedule)"]
JOB["Job<br>(one execution over a target)"]
OP1["Operation<br>device_1"]
OP2["Operation<br>device_2"]
OPN["Operation<br>device_N"]
ST["Steps<br>progress and result<br>reported per entity"]
OT --> JOB
OT --> TASK
TASK -->|"one job per scheduled run"| JOB
JOB --> OP1
JOB --> OP2
JOB --> OPN
OP1 --> ST
OP2 --> ST
OPN --> ST
Concept
What it is
Where it lives
Operation type
The definition of an action: its name, its parameter schema and its steps. Cloned from the platform catalog or created by your organization.
Start date + repetition period or calendar pattern
Produces
One set of operations
One job per scheduled execution
Changes apply to
The job itself, while it has not started
The next executions, never the job already running
Run your first operation
Create a job that reboots two devices. The operation name and its parameters come from your
organization’s operation types; everything else configures how the execution is managed:
A job is one execution of an operation type over a target set of entities. Creating a job is the
normal way to run an operation: you POST a job request, and OpenGate turns it into one operation per
target entity.
POST /v80/operation/jobs
Anatomy of a job request
Section
Purpose
name
The operation type to execute, for example REBOOT_EQUIPMENT.
Whether the job starts. false creates the job without launching it.
schedule
When the job runs and when it gives up.
operationParameters
Timeouts and retry policy applied to each individual operation.
notify
Whether to notify the operation result by email or trap. Defaults to false.
callback
URI to be notified on job progress instead of polling. See Callbacks.
userNotes
Free-text notes attached to the job instance.
Selecting the target
There are three ways to reference the entities a job acts on, and they are mutually exclusive —
a single job cannot mix entity lists, tags and filters.
The same parametrization is applied to every entity in the list. Two limits apply:
Entities per array: 100 by default.
Request body size: 300 KBytes by default.
Both are configurable per platform, so check the values with your administrator. To launch an
operation over a larger list, create the job with active set to false and use PUT requests to
append entities in batches, activating the job in the last call.
Only one tag name can be passed. OpenGate resolves the tag into the target set and builds the
internal structure of the job; when that work finishes the job waits in IDLE if it is not active,
or in SCHEDULED if it is.
The filter is evaluated by the platform to resolve the target set. Previously created filters cannot
be reused here — the filter must be inlined in the request.
The optional resourceType query string parameter restricts the filter to one entity type:
Value
Entities considered
entity.device
Devices
entity.asset
Assets
entity.commsModule
Communication modules
entity.subscription
Subscriptions
entity.subscriber
Subscribers
Filter targets cannot be updated
The target section of a filter-based job cannot be modified afterwards. To change the target set,
deactivate the job and create a new one with the new filter.
Scheduling
The schedule block controls when the job runs. start accepts either an exact date or a
delayed value in milliseconds; stop sets the deadline after which pending operations are
cancelled.
Two optional modes refine how the operations are distributed inside that window.
Window
window restricts execution to given weekdays and a daily time range — useful when field
interventions are only acceptable during a maintenance window.
Periods must be whole hours; intermediate periods are rejected:
Window
Allowed
"start": "09:00:00Z" — "stop": "15:00:00Z"
Yes
"start": "09:30:00Z" — "stop": "15:30:00Z"
Yes
"start": "09:00:00Z" — "stop": "15:30:00Z"
No
Scattering
scattering spreads the individual operations across the available time instead of firing them all
at once. It exists to protect shared infrastructure — typically a mobile operator cell that would
collapse if thousands of devices woke up simultaneously.
Field
Meaning
maxSpread
Percentage (0–100) of the job’s effective time used to spread operations. 0 runs as fast as possible, 100 spreads over the whole window. Default 0.
strategy.field
Entity field used to group operations. Currently only subscription.collected.cellInfo.
strategy.factor
Dispersion level (0–100) applied within each group. 0 clusters maximally, 100 scatters maximally. Default 0.
strategy.warningMaxRate
Speed control in operations per second, to verify the resulting rate stays within maxSpread.
Per-operation timeouts and retries
operationParameters applies to each individual operation, not to the job as a whole:
Field
Meaning
ackTimeout
Milliseconds to wait for the device to accept the operation. On expiry the operation is cancelled.
timeout
Milliseconds to wait for the operation to finish. Default 60000.
retries
Number of retries when the operation gets no acknowledgement or times out. Default 0.
retriesDelay
Milliseconds between retries.
retryResultList
Results that trigger a retry. ERROR_TIMEOUT is always included.
Minimum internal timeout
OpenGate enforces a minimum internal timeout of 40 seconds, so timeout plus ackTimeout must be
greater than that. The default of 60 seconds is a good starting point.
Job life cycle
A job’s status reflects the aggregate progress of all its operations:
stateDiagram-v2
direction TB
[*] --> IDLE: active=false
[*] --> SCHEDULED: active=true<br>start delayed
[*] --> IN_PROGRESS: active=true<br>start now
IDLE --> SCHEDULED: active=true<br>start delayed
IDLE --> IN_PROGRESS: active=true<br>start now
SCHEDULED --> IDLE: active=false
SCHEDULED --> IN_PROGRESS: start time<br>reached
IN_PROGRESS --> PAUSED: active=false
PAUSED --> IN_PROGRESS: active=true
IN_PROGRESS --> FINISHED: all ok
IN_PROGRESS --> FINISHED_WITH_ERRORS: with errors
IN_PROGRESS --> CANCELLING_BY_USER: cancelled<br>by a user
IN_PROGRESS --> CANCELLING_BY_ENGINE: timeout<br>reached
SCHEDULED --> CANCELLING_BY_USER: cancelled<br>by a user
CANCELLING_BY_USER --> CANCELLED: all operations<br>cancelled
CANCELLING_BY_ENGINE --> TIMEOUT_CANCELLED: all operations<br>cancelled
FINISHED --> [*]
FINISHED_WITH_ERRORS --> [*]
TIMEOUT_CANCELLED --> [*]
CANCELLED --> [*]
Transition
Trigger
Into IDLE
The job is created or updated with active set to false.
Into SCHEDULED
The job is active and its schedule.start is a date or a delay.
Into IN_PROGRESS
The job is active with an immediate start, or the scheduled start time is reached.
IN_PROGRESS → PAUSED
active set to false on a running job.
PAUSED → IN_PROGRESS
active set to true on a paused job.
Into FINISHED
Every operation reached a final state successfully.
Into FINISHED_WITH_ERRORS
Operations failed or were cancelled.
Into CANCELLING_BY_USER
A user cancels the job, through the console or the API.
Into CANCELLING_BY_ENGINE
The job’s timeout is reached, so the platform cancels it.
Into CANCELLED
Every entity operation of a user-cancelled job finished cancelling.
Into TIMEOUT_CANCELLED
The same, for a job the timeout cancelled.
Both cancelling states are transient: the job stays there until every one of its operations has finished
cancelling, which on a job targeting thousands of entities is not instant.
One detail still unconfirmed
The specification defines what each state means but not which terminal state the engine path ends in. The
pairing above — a user cancellation ending in CANCELLED, a timeout ending in TIMEOUT_CANCELLED — follows
from their descriptions and is pending confirmation.
See the status reference for the complete list of job, operation and step
values.
Reading the result
An execution involves as many entities as the target references, so one job explodes into many
results. The API exposes both levels:
flowchart LR
JOB["Job"] --> SUM["report.summary<br>one aggregated view<br>counters per state"]
JOB --> RES["operations<br>one result per entity<br>status, result, steps"]
Endpoint
Returns
GET /v80/operation/jobs/{jobId}
The job request plus report.summary
GET /v80/operation/jobs/{jobId}/operations
Paginated per-entity results
GET /v80/operation/jobs/{jobId}/operations/{id}
A single entity’s result
The per-entity list is paginated with start and size parameters — necessary when a job targets
thousands of entities. Each operation object carries its own status, result, description and
steps array.
To be notified when the job starts and when it finishes instead of polling these endpoints, configure
a callback.
Updating a job
PUT /v80/operation/jobs/{jobId}
A job can only be modified while active is falseand it has not started. What you can change:
The target entity list, by appending or removing entities.
The same JSON size limit as in creation applies. In the last PUT, set active to true to start
the execution.
Pause and resume
The same endpoint controls a running job through the active field:
Pause: set active to false on a job in IN_PROGRESS. The job moves to PAUSED. While
paused, the job’s features cannot be modified.
Resume: set active to true on a paused job. The job returns to IN_PROGRESS.
Cancelling a job
DELETE /v80/operation/jobs/{jobId}
The job moves to CANCELLING_BY_USER first — or to CANCELLING_BY_ENGINE when the platform itself
cancels it — and to CANCELLED once all of its operations are cancelled.
Cancellation does not roll back
Cancelling a job does not undo steps that already executed on the devices. A firmware update
cancelled halfway leaves the device halfway. Be deliberate.
Searching jobs and operations
Job and operation searches follow the platform’s standard search pattern, with support for filtering,
sorting, field selection and summaries:
POST /v80/search/jobs
POST /v80/search/jobs/summary
POST /v80/search/entities/devices/operations
POST /v80/search/entities/operations/history
Equivalent endpoints exist for subscribers and subscriptions. Results are returned as JSON by
default, or as CSV through HTTP header options. The full parameter list is in the
API reference.
Tasks
A task is a schedule that creates jobs. Where a job runs an operation once, a task runs
it again and again — every night, every Monday, the first day of every month — creating one job per
execution.
POST /v80/operation/tasks
A task wraps a complete job request in its job.request field, so everything you know about jobs
applies: the operation name, its parameters, the target, the per-operation timeouts and the callback.
What the task adds on top is when and how often.
flowchart LR
T["Task<br>schedule + job template"] --> J1["Job<br>run 1"]
T --> J2["Job<br>run 2"]
T --> JN["Job<br>run N"]
J1 --> O1["operations<br>per entity"]
J2 --> O2["operations<br>per entity"]
JN --> ON["operations<br>per entity"]
The task schedule
Field
Purpose
schedule.start
First execution. Defaults to now when omitted.
schedule.stop
When to stop: a date, a number of executions, or nothing at all — which means forever.
schedule.repeating.period
Repeat every n time units.
schedule.repeating.pattern
Repeat on a calendar pattern: weekly, monthly or yearly.
active
When false, no jobs are launched.
state
Current task state: ACTIVE, INACTIVE, FINISHED, CANCELLING, CANCELLED.
Repeating by period
period repeats on a fixed interval — each time units of unit, where unit is one of SECONDS,
MINUTES, HOURS or DAYS.
Repeating by calendar pattern
pattern targets specific calendar positions, optionally pinned to a time of day in
hh:mm:ssTZD format:
Pattern
Fields
Values
weekly
days
MON, TUE, WED, THU, FRI, SAT, SUN — at least one
monthly
day, months
Day 1–31; months JAN … DEC
yearly
day, months
Day 1–31; months JAN … DEC
Example: a reboot every Monday and Wednesday at 10:30 UTC, stopping after 10 executions.
Inside job.request.schedule, the only valid form of start and stop is delayed — an exact
date cannot be used, because the task itself decides when each job starts.
If id is omitted at creation, OpenGate generates a UUID. If provided, it must be unique.
Selecting the target
Target selection works exactly as in jobs, inside job.request.target: an explicit list of
entities, a tag, or an inlined filter — never a combination of them. The same 300 KByte request size
limit applies, and large target lists can be built up with successive PUT requests.
The optional resourceType query string parameter restricts a filter to a single entity type
(entity.device, entity.asset, entity.commsModule, entity.subscription, entity.subscriber).
See selecting the target for the full description of the three modes
and their limits.
Modifying a task
PUT /v80/operation/tasks/{taskId}
Changes apply to the next executions of the task, never to the job that is already running. This
includes appending or removing target entities.
Listing the jobs created by a task
GET /v80/operation/tasks/{taskId}/jobs
GET /v80/tasks/{taskId}/entities
The first endpoint returns the jobs the task has produced, which is how you audit a recurring
operation over time. Each of those jobs is read exactly like a standalone job.
Cancelling a task
DELETE /v80/operation/tasks/{taskId}
The task is marked CANCELLED. If the cancellation arrives while one of its jobs is running, the task
stays in CANCELLING until that job finishes cancelling all of its operations.
Cancellation does not roll back
As with jobs, cancelling a task does not undo steps already executed on the devices.
Searching tasks
POST /v80/search/tasks
Tasks are searchable with the platform’s standard filter, sort and select clauses. Every field of the
task object is available as a filter field, prefixed with tasks. — for example
tasks.schedule.repeating.period.unit or tasks.job.request.name. See the
API reference for the complete list.
Operation parameters
Parameters are what turn a generic operation type into a concrete instruction: not just reboot, but
reboot the hardware; not just update, but install bundle 1.0.
There are two distinct parameter blocks in a job request, and confusing them is a common mistake:
Block
Configures
Defined by
parameters
The operation itself — what the device must do
The operation type’s JSON schema
operationParameters
How the platform manages the execution — timeouts, retries
The platform, identical for every operation type. See Jobs
Declaring parameters with JSON schema
As an operations administrator you declare an operation’s parameters with
JSON Schema when creating or editing an
operation type. JSON Schema gives you the whole range from a single enumerated
string to nested objects and arrays, with validation and defaults.
Taking REBOOT_EQUIPMENT from the catalog as an example, its parameters are declared as:
Validation: a job requesting "type": "WARM" is rejected before reaching any device.
Defaults: omitting type yields HARDWARE.
A usable interface: title is what the OpenGate web console renders when a user launches the
operation by hand, so a well-written schema also produces a well-formed form.
Setting additionalProperties to false, as above, rejects unknown parameters instead of silently
ignoring them.
Filling parameters in a north API call
Back-office applications pass parameters as a plain JSON object matching the schema:
If the operation type declares no parameters, the block can be omitted entirely.
How parameters reach the device
The platform does not forward your JSON object verbatim. It translates it into the south API format
before delivering it to the device, where each parameter travels as a named, typed value inside the
operation request.
Polling a job to know whether it has finished works, but it does not scale and it wastes time. A
callback inverts the flow: OpenGate notifies your application over HTTP as the job progresses.
Enabling callbacks
Set the callback field of the job request to the URI you want to be notified on:
The URI follows the RFC 3986 format, and only HTTP
transport is supported.
OpenGate appends the name of the specific callback to this URI when notifying, so a single base URI
serves both notifications.
The HTTP method is always POST, with the payload as the request body.
An empty value disables callback notification.
Callbacks work for tasks too: configure callback inside task.job.request, and every job the task
creates will notify.
The two notifications
sequenceDiagram
participant App as Your application
participant OG as OpenGate
participant Dev as Devices
App->>OG: POST /v80/operation/jobs
OG-->>App: 201 Created + location
Note over OG: target set resolved,<br>operations created,<br>schedule reached
OG->>App: POST callback — job started
OG->>Dev: operations dispatched
Dev-->>OG: results per entity
Note over OG: all operations finished,<br>cancelled or timed out
OG->>App: POST callback — job finished
Callback
Fired when
Payload carries
Started
The job begins executing — immediately, or when its schedule says so.
id, request, report.execution
Finished
The job is over: schedule terminated, job cancelled, or all operations completed.
id, request, report.execution, report.summary, result with the first page of per-entity operations
Creating a job is not itself notified: the 201 Created response to your POST already tells you the
job exists, and report.summary is available from GET /v80/operation/jobs/{jobId} from that moment
on.
Job started callback
Fired when execution actually begins. For a scheduled job this happens when the scheduling parameters
say so, which may be long after creation:
The most complete of the three. Besides the summary counters it includes the first page of
per-entity results, so a small job needs no follow-up request at all. For larger jobs, page through
the remaining results with GET /v80/operation/jobs/{jobId}/operations.
Note that a job reaching the finished callback is not necessarily a job that succeeded: in this
example status is FINISHED, but of the three operations one was cancelled by timeout and one
finished out of time. Always read the counters, not just the status. See the
status reference for what each value means.
Notifications versus callbacks
callback and notify are different mechanisms and can be used together:
Field
Recipient
Purpose
callback
Your application, over HTTP
Machine-to-machine job progress notification
notify
The platform’s notification channels (email, trap)
Human notification of the operation result
Execution flows
Everything on the jobs and tasks pages describes the north side of the
service, the API your back-office application talks to. This page explains what happens on the
south side, between OpenGate and the device — because that is what determines how long an
operation takes, what progress you can observe, and why an operation can sit in
WAITING_FOR_CONNECTION for hours.
Every operation has at least a minimum workflow to be fulfilled. Beyond that minimum, the flow depends
on what the device is capable of.
Who starts the conversation
Flow
Who initiates
When it fits
Platform-driven
OpenGate contacts the device
The device is reachable and exposes an endpoint
Device-driven
The device asks OpenGate for pending operations
The device sleeps, sits behind NAT, or has no public address
Device-driven operations are why an operation may report WAITING_FOR_CONNECTION: the work is queued
and waiting for the device to show up.
Platform-driven flows
Synchronous
The whole operation is resolved in a single HTTP request and response. The device does the work and
answers with the final result:
sequenceDiagram
participant OG as OpenGate
participant Dev as Device
OG->>Dev: Operation request (HTTP POST)
Note over Dev: executes the operation
Dev-->>OG: Final response with result and steps (HTTP 201)
Simple and cheap, but it holds the connection for the whole execution — unsuitable for anything slow,
such as a firmware download.
Asynchronous with a simple response
The device acknowledges the request immediately and reports the result later, in a request of its own:
sequenceDiagram
participant OG as OpenGate
participant Dev as Device
OG->>Dev: Operation request (HTTP POST)
Dev-->>OG: ACK (HTTP response)
Note over Dev: executes the operation
Dev->>OG: Response notification with result (HTTP POST)
OG-->>Dev: ACK (HTTP 200)
Asynchronous with multiple responses
The device reports partial progress as it goes, and closes with a final response. This is what makes a
long operation observable:
sequenceDiagram
participant OG as OpenGate
participant Dev as Device
OG->>Dev: Operation request (HTTP POST)
Dev-->>OG: ACK (HTTP response)
Dev->>OG: Partial response — STEP in progress (HTTP POST)
OG-->>Dev: ACK (HTTP 200)
Dev->>OG: Partial response — next STEP (HTTP POST)
OG-->>Dev: ACK (HTTP 200)
Dev->>OG: Final response — last STEP and result (HTTP POST)
OG-->>Dev: ACK (HTTP 200)
Each partial response updates the operation’s steps array, so a north API client polling the job — or
receiving callbacks — sees the progress accumulate.
Device-driven flow
The device polls OpenGate for work, executes what it gets, and reports back:
sequenceDiagram
participant Dev as Device
participant OG as OpenGate
Dev->>OG: Ask for pending operations (HTTP GET)
OG-->>Dev: Pending operation request
Note over Dev: executes the operation
Dev->>OG: Response notification with result (HTTP POST)
OG-->>Dev: ACK (HTTP 200)
Single-step versus multi-step operations
The flow strategy above is about transport. Independently of it, an operation is either atomic or
composed of steps:
Structure
What the device reports
Observability
Simple request/response
One result, no intermediate stages
Success or failure, nothing in between
Multi-step
A declared list of steps, each with its own result and timestamp
Progress while the operation runs
A multi-step operation can report all its steps in one response, or spread them across partial
responses until the final step is reached. The step list belongs to the
operation type definition: it is declared once, and every execution reports
against it.
Where to go from here
The diagrams above are summaries. The complete south API — endpoints, ports, request and response
schemas, security requirements and the full flow diagrams — lives in the device integration section:
Every value OpenGate can report about an operation, in one place. Use this page when you are reading a
job report, a per-entity result or a callback payload and need to know what a value
means.
Three levels report status independently, and they answer different questions:
flowchart LR
J["Job status<br>how is the whole execution going?"] --> O["Operation status and result<br>what happened on this entity?"]
O --> S["Step results<br>which stages ran, and how?"]
Job status
The aggregate state of a job, in report.summary.status. See the
job life cycle for the transitions between them.
Value
Meaning
IDLE
The job has been created but not started, because it is not active.
SCHEDULED
The job is active and waiting for its scheduled start.
IN_PROGRESS
The job has started.
PAUSED
The job has been paused by setting active to false while running.
FINISHED
All operations in the job have finished.
FINISHED_WITH_ERRORS
The job finished with errors. Some operations may have succeeded while others failed or were cancelled, or all of them may have failed. errorCode and errorDescription are present in the summary.
TIMEOUT_CANCELLED
The job was cancelled because the maximum timeout defined expired.
CANCELLING_BY_USER
A user cancelled the job, and it is still cancelling its operations.
CANCELLING_BY_ENGINE
The job’s timeout was reached, and it is still cancelling its operations.
CANCELLED
The job and all of its operations have been cancelled.
Cancellation records who caused it
There is no plain CANCELLING: a job in the middle of cancelling always reports which side started it,
CANCELLING_BY_USER or CANCELLING_BY_ENGINE. The two differ in cause, not in mechanics — a user asked, or
the timeout ran out — and the same distinction appears at operation level in the finished.cancelled
counters.
Operation status
The state of the operation on one entity, in each element of the operations list.
Value
Meaning
PENDING
The operation is pending to be started.
QUEUED
The operation has been launched but has not reached the device yet.
WAITING_FOR_ACK
The operation is waiting for an acknowledgement from the device to be started.
WAITING_FOR_CONNECTION
The operation is waiting for the device to connect, when that option is enabled.
IN_PROGRESS
The operation has started and is waiting for completion.
FINISHED
The operation has been completed.
FINISHED_OUT_OF_TIME
The operation finished and its result was collected, but outside the allowed time.
TIMEOUT_CANCELLED
The operation was cancelled because the maximum timeout defined expired.
NOT_ALLOWED
The operation cannot be executed over this entity.
CANCELLED
The operation has been cancelled.
Operation result
Why an operation ended the way it did, in the result field. A FINISHED status with a non-successful
result is normal: the execution completed, the outcome was negative.
Value
Meaning
SUCCESSFUL
The operation completed with success.
PARTIAL_SUCCESS
The operation completed with partial success.
OPERATION_PENDING
The operation is queued to be executed.
ERROR_IN_PARAM
The operation cannot be executed because of an error in the parameters passed.
NOT_ALLOWED
The operation execution is not allowed for this entity.
NOT_SUPPORTED
The operation is not supported by the entity.
ALREADY_IN_PROGRESS
The operation is already being executed.
ERROR_PROCESSING
The operation finished with an unknown error.
ERROR_TIMEOUT
The operation could not be completed because the device response timed out.
TIMEOUT_CANCELLED
The operation was cancelled because the maximum timeout defined expired.
CANCELLED
The operation was cancelled by a user or through the API.
CANCELLED_INTERNAL
The operation was cancelled by the internal engine. Consult your platform administrator.
UNKNOWN_RESULT
The operation returned a result the platform does not recognize. Consult your platform administrator.
Retry policy
Any of these results can be listed in the job’s operationParameters.retryResultList to trigger a
retry. ERROR_TIMEOUT is always part of that list, whether you include it or not.
Step result
Each element of an operation’s steps array carries a name, a timestamp, an optional
description, an optional response, and one of:
Value
Meaning
SUCCESSFUL
The step completed successfully.
ERROR
The step failed.
SKIPPED
The step was skipped.
NOT_EXECUTED
The step did not run.
Not every declared step appears in every execution: a device only reports the steps it actually goes
through. See execution flows for how steps are reported.
The task is launching jobs according to its schedule.
INACTIVE
The task exists but launches no jobs, because active is false.
FINISHED
The task reached its stop condition — its end date or its number of executions.
CANCELLING
The task has been cancelled and one of its jobs is still finishing.
CANCELLED
The task has been cancelled.
Job summary counters
report.summary counts the operations of a job by state. The counters are what tell you whether a
FINISHED job actually did what you wanted.
Counter
Contains
total
Total operations attempted.
inProgress.total
Operations not finished yet.
inProgress.scheduled
Operations scheduled but not launched.
inProgress.pendingExecution
Operations queued for execution.
inProgress.waitingForConnection
Operations waiting for the device to appear.
inProgress.started
Operations already started.
finished.total
Operations that reached a final state.
finished.successful
Operations that finished successfully.
finished.error
Operations that finished with an error.
finished.cancelled.total
Cancelled operations, broken down by cause below.
finished.cancelled.byUser
Cancelled by a user or through the API.
finished.cancelled.byEngine
Cancelled by the platform engine.
finished.cancelled.byTimeout
Cancelled because the operation timeout expired.
finished.cancelled.byExternalTimeout
Cancelled because an external system timed out.
finished.cancelled.byExternal
Cancelled by an external system.
finished.cancelled.byAlreadyInProgress
Cancelled because the same operation was already running on that entity.
finishedOutOfTime.total
Operations whose result arrived outside the allowed time.
finishedOutOfTime.successful
Of those, the ones that succeeded.
finishedOutOfTime.error
Of those, the ones that failed.
errorCode, errorDescription
Present only when the job status is FINISHED_WITH_ERRORS.
Every counter above is also available as a search filter field, prefixed with
jobs.report.summary. — so you can query, for example, all jobs with
jobs.report.summary.finished.cancelled.byTimeout greater than zero. See the
API reference for the complete field list.
Operation types
An operation type is the definition of an action: its name, its title and description, the entity
types it applies to, its parameter schema and its steps. Nothing can be executed until an operation
type for it exists in your organization.
There are two ways to get one:
Clone it from the platform catalog, for the operations OpenGate already implements. See the
default operations catalog.
Create it from scratch, for actions specific to your devices.
Only your organization’s types are executable
Operation types from the platform catalog that have not been cloned into your organization cannot be
executed. The catalog is a source to inherit from, not a set of ready-to-run operations.
Retrieve the list of operations available to be cloned.
Create operations for an organization, either by cloning from the catalog or from scratch.
Retrieve a single operation from the catalog by name.
Update an operation previously created.
Delete an operation previously created.
Search the operations of an organization using the platform’s filters.
Viewer profile
GET and SEARCH are the only actions available to the viewer profile.
Creating an operation type
The response returns a location header with the URL of the new resource.
When the operation is cloned from the catalog, only name, description and title can be
modified — the parameter schema, the steps and the applicability of a catalog operation are fixed. When
created from scratch, you define all of it, including the
parameter schema.
Restricting execution by profile
The optional profiles list names the user profiles authorized to execute the operation. By default,
every profile except viewer can execute custom operations.
Available profile names:
advanced
admin_domain
super_admin_domain
admin
root
The list can be set at creation time or updated later. If omitted, the default access rules apply.
Invalid profiles return 400 Bad Request with error detail; viewer is never permitted and also
returns 400 if included.
Updating an operation type
For operations derived from the catalog, only name, description and title can be modified.
Searching operation types
Five filter fields are available, all optional:
Filter
Selects by
name
Operation name
applicableTo
Entity type the operation applies to
models
Device models the operation supports
fromCatalog
Whether the operation was cloned from the platform catalog
profile
Profiles authorized to execute it
Extended operation fields
Any parameter of the ExtendedOperation object can also be used as a filter field in operationTypes
searches.
Usage examples
Read the operation types catalog:
curl --request GET \
--header "X-ApiKey: <your-api-key>"\
https://www.amplia-iiot.com/v80/operationTypes/catalog
Read a single operation type of your organization by its name:
curl --request GET \
--header "X-ApiKey: <your-api-key>"\
https://www.amplia-iiot.com/v80/operationTypes/provision/organizations/{organizationName}/REBOOT_EQUIPMENT
API specification
Default operations catalog
OpenGate ships a catalog of operations covering the actions devices commonly implement: reboots, factory
resets, firmware and configuration updates, diagnostics, parameter reads and writes, clock setting,
communications control. Each entry below is a definition you can clone into your organization as an
operation type.
Name
Description
Applicable to
Steps
ADMINISTRATIVE_STATUS_CHANGE
Allows to change the administrative status of an entity
Catalog entries must be cloned into your organization before they can be executed. See
operation types.
The operations available in your organization can differ from the list above. OpenGate administrators
can enable more operations or disable some of them.
The SMS capability is only available for the on-premise solution, and requires integration with an
external service provider.
Besides this list, new operation types can be created from scratch to adapt
OpenGate to specific solution needs.
Examples
Worked examples of complete operations. Each one shows the JSON documents exchanged through the north
API, used by back-office applications, and through the south API, used by devices — so you can see
how a single job request turns into what the device actually receives.
Software and firmware update is the most complete operation OpenGate models: it is long-running,
multi-step, and its progress matters as much as its outcome. It is therefore a good example of the
asynchronous flow with multiple responses.
Flow diagram
OpenGate suggests a complete flow covering all the possible stages of a device update. In the real world
a device may implement only part of these steps — any number and kind of steps implemented by your
device is supported.
Each notification is an HTTP POST from the device carrying the operation response, and each ACK is
OpenGate’s HTTP 200 reply. Every notification updates the operation’s steps array, so the north API
sees the download percentage advance in real time.
The UPDATE operation type declares the following steps: ACCEPTED, BEGINUPDATE, DOWNLOADFILE,
BEGINPREACTION, ENDPREACTION, BEGININSTALL, ENDINSTALL, BEGINPOSTACTION, ENDPOSTACTION and
ENDUPDATE. See the status reference for the results a step can
report.
North API invocation
Back office applications invoke device update operations through the ordinary
jobs API — everything you know about jobs applies. What is specific to updates is the
operation name and its parameters:
This is the document the device receives from the platform. The deploymentElements array is what makes
an update different from any other operation: it tells the device what to download, where to put it, in
which order, and how to verify it.
The complete specification of the operations service: creating, reading, updating and cancelling
jobs and tasks, retrieving per-entity operation results, and searching jobs,
tasks and operation history.
Endpoint group
Purpose
/v80/operation/jobs
Create, read, update and cancel jobs
/v80/operation/jobs/{jobId}/operations
Per-entity operation results of a job
/v80/operation/tasks
Create, read, update and cancel tasks
/v80/operation/tasks/{taskId}/jobs
Jobs produced by a task
/v80/search/jobs, /v80/search/tasks
Search jobs and tasks, with summary variants
/v80/search/entities/{type}/operations
Search operations by entity type
/v80/search/entities/operations/history
Search historical operations
Data formats
OpenGate uses JSON as the interchange format in its RESTful interface.
Numbers
A number is an integer or a double-precision float. The property name is a string in double quotes, the
value is not quoted:
Example property
Value
time
1356695180301
value
299.99
maxValue
1.23e11
minValue
-10.5
A number can be prefixed with a minus sign. The exponent portion, denoted by e or E, comes after
the value and may carry an optional sign. Leading zeroes, octal and hexadecimal values are not allowed.
Dates
Dates and times follow ISO 8601:2004, and UTC is the time standard for all dates. The full
format is YYYY-MM-DDThh:mm:ss.sTZD, for example 2021-07-16T19:20:30.00+01:00, as described in the
ISO 8601 standard and in
Date and Time Formats of W3C.
Precision
Format
Example
Year
YYYY
2015
Year and month
YYYY-MM
2015-10
Complete date
YYYY-MM-DD
2015-10-06
Date plus hours and minutes
YYYY-MM-DDThh:mm
2015-10-06T17:35
Date plus hours, minutes and seconds
YYYY-MM-DDThh:mm:ss
2015-10-06T17:35:21
Date plus fraction of a second
YYYY-MM-DDThh:mm:ss.s
2015-10-06T17:35:21.45
YYYY — four-digit year
MM — two-digit month, 01 for January
DD — two-digit day of month, 01 to 31
hh — two-digit hour, 00 to 23; am/pm is not allowed
mm — two-digit minute, 00 to 59
ss — two-digit second, 00 to 59
s — one or more digits for the decimal fraction of a second
Specification
Debugging
Two features of OpenGate let you run your own JavaScript inside the platform:
connector functions, which translate what devices say, and
rules, which react to what arrives. Both run server-side, on
events you did not trigger, which makes the usual debugging reflexes useless — there is no console to watch.
This section is that console.
How it works
flowchart LR
JS["Your JavaScript<br>connector function or rule"] -->|"logger.info(...)"| SVC["Functions logger<br>service"]
SVC -->|"WebSocket stream"| YOU["Your terminal<br>or application"]
classDef mine fill:#addcf8,stroke:#2b7cb8,color:#000
class JS mine
Two halves, one page each:
Half
What it is
Page
Writing
The logger object your script calls: trace, debug, info, warn, error
Everything else — the mandatory X-ApiKey parameter, the level filter and the message format — is
identical for both. See Functions Logger Service for the complete URIs.
Debugging in practice
A workflow rather than a list of features:
Start with the script disabled. A connector function’s
operationalStatus exists
precisely so a half-written script never touches production devices: create it DISABLED, move to TEST
against a test device, and only then to PRODUCTION.
Log the inputs you did not expect, not the ones you did. The payload your script receives is
whatever the device really sent, which is rarely what the datasheet promised.
Subscribe at TRACE while you iterate, then raise the level. Each level includes the ones above it:
WARN delivers ERROR and WARN, and nothing below.
Remember the REST API barely parses your JavaScript. A script that was accepted at creation can still
fail at runtime, and this is where you find out.
Levels filter delivery, not writing
level controls what the service sends you, not what your script writes. Leaving logger.trace calls in
place costs nothing once you stop subscribing at TRACE, so there is no reason to strip them out when you
are done debugging.
Connector functions logger feature is available on this URL: wss://api.opengate.es/north/functions-logger/connectorFunctions/organizations/{organization_name}/channels/{channel_name}/{cf-id}
Rules logger feature is available on this URL: wss://api.opengate.es/north/functions-logger/rules/organizations/{organization_name}/channels/{channel_name}/{rf-id}
Websocket requires mandatory X-ApiKey url parameter to work
Another parameter to be set is logging level, used to define which traces must be sent to the client. This parameter is not mandatory and by default the INFO level will be used.
Here is a complete URI example for the connector functions logger:
your-api-key: API key of a valid user with permissions over the defined function.
logging-level: Specify logging granularity. Valid logging levels: ERROR, WARN, INFO, DEBUG, TRACE. If incorrect value is defined, INFO level will be used by Functions Logger service. Same level or higher level messages will be received. For example if WARN is defined in the path, ERROR and WARN traces will be received, but not INFO, DEBUG or TRACE.
After opening Websocket connection, the client will receive log messages with following format:
level: Trace level. Possible values: ERROR, WARN, INFO, DEBUG, TRACE.
timestamp: Trace UTC timestamp in milliseconds.
JS Logging API
JS API guide for logging
This file provides methods to write logging traces.
How the message is built
Every logging function takes an arbitrary number of parameters (...msg) and concatenates them into a
single message. Each one is turned into text according to what it is:
Primitive values — strings, numbers, booleans — are written as their text representation.
Objects and JSON are serialised with JSON.stringify.
Error objects contribute their message plus the context that helps locate the failure.
Tip
Rather than passing several parameters, you can build the message yourself with a template literal and
string interpolation:
logger.info(`Operation payload: ${payload}`);
Logger Object
The logger object is the main object for logging functions.
logger.trace(…msg)
Creates TRACE level logging messages. It concatenates msg parameters to compound message to be logged.
Kind: global function Returns: Void
Param
Type
Description
…msg
any
The function takes as parameters a list of elements to be concatenated to generate the string message to be printed.
Example of use:
logger.trace('Operation sent to', host_var, ' and port ', port_var, '. Operation content: ', operation_var);
logger.debug(…msg)
Creates DEBUG level logging messages. It concatenates msg parameters to compound message to be logged.
Kind: global function Returns: Void
Param
Type
Description
…msg
any
The function takes as parameters a list of elements to be concatenated to generate the string message to be printed.
Example of use:
logger.debug('Operation sent to', host_var, ' and port ', port_var, '. Operation content: ', operation_var);
logger.info(…msg)
Creates INFO level logging messages. It concatenates msg parameters to compound message to be logged.
Kind: global function Returns: Void
Param
Type
Description
…msg
any
The function takes as parameters a list of elements to be concatenated to generate the string message to be printed.
Example of use:
logger.info('Operation sent to', host_var, ' and port ', port_var, '. Operation content: ', operation_var);
logger.warn(…msg)
Creates WARN level logging messages. It concatenates msg parameters to compound message to be logged.
Kind: global function Returns: Void
Param
Type
Description
…msg
any
The function takes as parameters a list of elements to be concatenated to generate the string message to be printed.
Example of use:
logger.warn('Operation sent to', host_var, ' and port ', port_var, '. Operation content: ', operation_var);
logger.error(…msg)
Creates ERROR level logging messages. It concatenates msg parameters to compound message to be logged.
Kind: global function Returns: Void
Param
Type
Description
…msg
any
The function takes as parameters a list of elements to be concatenated to generate the string message to be printed.
Example of use:
logger.error('Error connecting to host ', host_var, ' and port ', port_var, '. Stop processing');
Device integration
This is the south side of the platform: everything that happens between OpenGate and the things in the
field. Where the north APIs are consumed by your applications, these are spoken by devices,
gateways, sensors and machines.
The two conversations
Every integration comes down to two of them, in opposite directions:
flowchart LR
DEV["Device"] -->|"data collection<br>pushes readings"| OG["OpenGate"]
OG -->|"operations<br>asks for actions"| DEV
Conversation
The device
Documented in
Data collection
Pushes inventory and business data: serial number, ICC, MSISDN, location, temperature, pressure, consumption
Plus RADIUS, where the counterpart is the operator’s network rather than a device.
Supported protocols is the full matrix: every protocol, who initiates, what it
carries and where its documentation lives. Start there if you are deciding how to connect something.
Real fleets are not uniform. Two mechanisms absorb that:
Connector Functions let you run your own JavaScript inside the platform to
translate between OpenGate and whatever the device actually speaks. This is the answer to almost every
“our devices do it differently” problem.
Topology covers devices that are not reachable directly: gateways, mesh networks and the
path that addresses a device several hops away.
Also here
Deployment Elements — downloading the files a device needs for a firmware or
configuration update, the south counterpart of the update operation.
OpenGate does not ask your devices to change. It speaks eleven protocols, and the first thing to know about
any of them is which side opens the conversation, because that decides your network architecture.
Devices that call OpenGate
The platform listens. The device needs outgoing connectivity and nothing else — no public address, no
inbound firewall rule. This is what fits sleeping devices, NAT and mobile networks.
Protocol
Carries
Documented in
HTTP
Data collection and operations, in both directions
Here the platform opens the conversation, from a connector function. The device
must be reachable at an IP address — directly, through a VPN, or through a
gateway.
Note that here the counterpart is not the device but the operator’s network, which is why it is provisioned
as a mobile-operator concern rather than a device one.
The one that is not a device protocol
Carries
Documented in
Kite
Querying and changing the status of a mobile subscription, through the operator’s connector
Modbus and SCADA appear in the product overview but have no technical documentation at all — not
even a connector function reference. If you need either, ask your platform contact.
HTTP
The OpenGate Devices API is a REST interface that integrates devices, sensors and machines into the
platform. It is the broadest of the south transports: it carries both conversations, in both directions.
The device
Over HTTP it can
Read
Pushes what it measured
POST inventory data (serial number, ICC, MSISDN) and business data as data streams: location, temperature, pressure, consumption
This section shows how to use OpenGate HTTP connector for data collection.
The endpoint allows devices to send raw data to OpenGate.
It can be done by:
sending data points with their respective timestamps in different datastreams in a single request
sending data points without timestamp in different datastreams in a single request
Note about data streams with special platform processing
Besides the spec info you can find below, it’s worth considering that there are two data streams with special platform processing rules: device.identifier and device.topology.path.
These data streams match fields outside the list of data streams in the collection JSON. Due to this special treatment, these data streams will never be collected from the list of data streams; they will be collected from their fields in the collection JSON.
If you want to collect the data stream device.topology.path you have to fill in the field path of the collection JSON. Or, in case of the device is directly behind a gateway, you can remove the field path and fill in the field device in the collection JSON, OpenGate will collect the data stream device.topology.path with the gateway identifier.
Also, if you want to collect the data stream device.identifier you have to fill in the field device of the collection JSON. If you don’t fill in this field, OpenGate will collect the data stream device.identifier from the device_id (that is, the gateway) in the URI, and all the data in the data streams array will be stored in the gateway collected info.
Usage examples
Send the latest value of each data stream (no timestamp):
OpenGate’s Operations feature is a powerful tool for managing and interacting with remote devices. By leveraging this feature, you can seamlessly integrate and control a wide array of remote devices, enabling unparalleled efficiency and flexibility in your IoT ecosystem.
Key Benefits of OpenGate Operations
Remote Configuration: OpenGate allows you to configure devices remotely, ensuring that settings and updates can be applied without physical access. This feature reduces downtime and operational costs while enhancing device performance and reliability.
Action Requests: With OpenGate, you can issue commands and requests to remote devices in real time, putting you in control and ensuring a responsive system. Whether it’s initiating a firmware update, performing diagnostics, or executing specific tasks, OpenGate ensures that your devices respond promptly and accurately.
Enhanced Integration: The Operations feature seamlessly integrates with your existing systems, respecting and utilizing your current setup. This provides a unified platform for device management, simplifying workflows and enhancing the overall efficiency of your operations.
By utilizing OpenGate’s Operations feature, you can remotely manage, configure, and interact with your devices. This empowers you to maintain optimal performance and achieve greater control over your IoT network. This capability transforms how you manage remote devices, making your operations more agile and responsive to changing needs.
Flexible Operation Control with OpenGate
OpenGate’s Operations feature provides the flexibility to initiate and control operations from both the OpenGate platform and the remote devices themselves. This dual capability ensures that you can maintain optimal control and responsiveness, regardless of your operational needs or the specific scenarios you encounter.
Operation Initiation
Platform-Driven Operations: Initiate and manage operations directly from the OpenGate platform, allowing centralized control over device configurations, updates, and actions.
Device-Driven Operations: Remote devices can also ask for pending operations, providing a decentralized approach that can be tailored to specific device requirements and conditions.
Additional Resources
For more detailed information on how to utilize these capabilities, please refer to the following links:
These resources offer comprehensive guidance on initiating and managing operations securely, ensuring that your interactions with remote devices are both efficient and safe. By following these guidelines, you can maximize the potential of OpenGate’s Operations feature while maintaining robust security standards.
Subsections of Operations
Operations driven by platform
Introduction
OpenGate initiates communication with the device, requesting the execution of a specific operation. Upon receiving this request, the device can respond in either a synchronous or asynchronous manner, utilising the HTTP protocol.
Devices can expose this endpoint so that OpenGate can request operation executions on them.
Synchronous
The entirety of the operation is driven by a single HTTP request and response: the device executes the
operation and returns the result in the response body of the same exchange.
sequenceDiagram
participant OG as OG Connector
participant Dev as Device
rect rgb(240, 246, 255)
Note over OG,Dev: Platform generated command
OG->>+Dev: COMMAND (HTTP REQUEST -> POST)<br>Command Info (JSON)
Note over Dev: executes the operation
Dev-->>-OG: RESPONSE (HTTP RESPONSE) 201 Ok<br>Response Info (JSON)
end
Asynchronous
In this instance, OpenGate transmits the operation to the device via an HTTP request, and the device responds with an acknowledgement through the utilisation of an HTTP response. Subsequently, OpenGate is capable of receiving one or multiple HTTP requests transmitted by the device. These HTTP requests can be employed by the device to convey the subsequent steps that the operation necessitates.
For further information on the endpoints exposed by OpenGate for the management of asynchronous operation communications, please refer to the section on operations driven by device.
Simple response
The device transmits a sole response message in order to respond to the request.
sequenceDiagram
participant OG as OG Connector
participant Dev as Device
rect rgb(240, 246, 255)
Note over OG,Dev: Platform generated command
OG->>+Dev: COMMAND (HTTP REQUEST -> POST)<br>Command Info (JSON)
Dev-->>-OG: COMMAND ACK (HTTP RESPONSE) 201 Ok
end
Note over Dev: executes the operation
rect rgb(240, 246, 255)
Note over OG,Dev: Device generated response
Dev->>+OG: RESPONSE (HTTP REQUEST -> POST)<br>Response Info (JSON)
OG-->>-Dev: RESPONSE ACK (HTTP RESPONSE) 201 Ok
end
Multiple responses
The device can transmit a number of partial responses and a final response at the conclusion of the sequence.
Partial responses carry no resultCode: that is what marks them as intermediate. The final response
includes it, closing the operation.
sequenceDiagram
participant OG as OG Connector
participant Dev as Device
rect rgb(240, 246, 255)
Note over OG,Dev: Platform generated command
OG->>+Dev: COMMAND (HTTP REQUEST -> POST)<br>Command Info (JSON)
Dev-->>-OG: COMMAND ACK (HTTP RESPONSE) 201 Ok
end
rect rgb(240, 246, 255)
Note over OG,Dev: Device generated partial response
Dev->>+OG: PARTIAL RESPONSE (HTTP REQUEST -> POST)<br>Response Info (without resultCode)
OG-->>-Dev: RESPONSE ACK (HTTP RESPONSE) 201 Ok
end
Note over OG,Dev: one exchange per partial response
rect rgb(240, 246, 255)
Note over OG,Dev: Device final response
Dev->>+OG: RESPONSE (HTTP REQUEST -> POST)<br>Response Info (JSON)
OG-->>-Dev: RESPONSE ACK (HTTP RESPONSE) 201 Ok
end
Operation structure
Simple request/response
The operation is comprised of a single request and a single response, which together constitute its entirety. There are no intermediate steps. It can be executed in either a synchronous or asynchronous manner, with the latter resulting in a simple response.
Multi-step response
In order to facilitate the monitoring of the operation, it is necessary to define a list of steps. The device is capable of providing information regarding these steps in a single response or in a series of partial responses until the final step is reached. The device can respond using either a synchronous or an asynchronous (simple or multiple responses) flow strategy.
Response structure
In regard to the JSON format, there is no distinction between synchronous and asynchronous responses.
Synchronous: The device incorporates the JSON payload into the HTTP response.
Asynchronous: The device incorporates the JSON payload into a new HTTP POST, which is initiated by the device itself.
API specification
Device HTTP ports
Unsecure (deprecated): 1123
Secure: 11235
Usage example
In this flow the device acts as the HTTP server: OpenGate sends the operation request
to the endpoint exposed by the device. Request body sent by OpenGate:
The typical use case is when the remote device, having been in a long sleep period, requests the pending operation requests stored in OpenGate.
sequenceDiagram
participant OG as OG Connector
participant Dev as Device
rect rgb(240, 246, 255)
Note over OG,Dev: Device polls for pending operation
Dev->>+OG: Retrieve Op. Request (HTTP POST)
OG-->>-Dev: RESPONSE ACK (HTTP RESPONSE) 201 Ok
end
rect rgb(240, 246, 255)
Note over OG,Dev: Platform generated command
Dev->>+OG: COMMAND (HTTP REQUEST -> POST)<br>Command Info (JSON)
OG-->>-Dev: COMMAND ACK (HTTP RESPONSE) 201 Ok
end
rect rgb(240, 246, 255)
Note over OG,Dev: Device generated response
Dev->>+OG: RESPONSE (HTTP REQUEST -> POST)<br>Response Info (JSON)
OG-->>-Dev: RESPONSE ACK (HTTP RESPONSE) 201 Ok
end
A valid request returns HTTP 201 with a Location header.
API specification
Security tips for operations
Tips to Ensure Security When Using OpenGate Operations
To ensure the security of your operations with OpenGate, follow these recommended practices:
Use Encrypted Communication: Always use secure HTTP (HTTPS) for communication, utilizing the default TCP port 443. Unsecured HTTP communication (default TCP port 80) is deprecated and will soon be unsupported.
Authentication Mechanisms: OpenGate requires authentication for all operations. There are two mechanisms you can use simultaneously for enhanced security:
API Key Authentication: Include the X-ApiKey HTTP header with the API key of a valid user in every request.
Mutual Authentication: Implement mutual authentication based on secure HTTP PKI infrastructure for an additional layer of security, ensuring the integrity and confidentiality of your communications.
By following these guidelines, you can enhance the security and reliability of your interactions with the OpenGate platform.
MQTT
OpenGate provides an MQTT connector that lets devices exchange messages with the platform
using a single TCP connection: publish collected data, receive operation requests, send
operation responses and ask for pending operations. The following sections describe how to
connect, the default OpenGate topics, and how to handle data collection and operations
over MQTT.
This section shows how to use OpenGate MQTT connector for data collection.
Using MQTT, your devices only need one TCP connection to exchange messages with the platform: publish collected data, receive operation requests, send operation responses, ask for pending operations, etc.
How to connect to OpenGate MQTT connector
These are the parameters to establish a MQTT connection with OpenGate:
Host: api.opengate.es
Port: 1883
User: your-device-id
Password: your-api-key
Obtaining your API key
Login onto the OpenGate web interface
Click on the cogs that are at the top-right of the OpenGate home page
Click on the User option
Click on the “Click to show” link
Collecting data using mosquitto CLI tool
mosquitto is an open source MQTT client and server. The following example shows how to connect and publish data using OpenGate MQTT connector:
To subscribe to incoming operations from OpenGate: odm/request/your-device-id
To publish operation responses: odm/response/your-device-id
You have to replace your-device-id with the OpenGate unique identifier of your device.
Data collection payload
The payload definition in the section HTTP integration to collect data is entirely valid. You only have to add a "device": "your-device-id" field, filled with your OpenGate device unique identifier, at the top level of the JSON document with the collected values.
See the following example:
Publish to odm/iot/your-device-id topic this JSON:
Each example shows the complete flow of an operation over MQTT: the North API request that
creates the operation job, the request message the device receives on its
odm/request/your-device-id topic, and the response message the device publishes on its
odm/response/your-device-id topic.
You must be connected to OpenGate MQTT connector as a subscriber to topic odm/request/your-device-id,
if so, then you’ll receive an operation request like this:
Because this operation requests a full info refresh to your device, it must publish a new message with all the requested information to the topic odm/iot/your-device-id the message:
You must be connected to OpenGate MQTT connector as a subscriber to topic odm/request/your-device-id,
if so, then you’ll receive an operation request like this:
You must be connected to OpenGate MQTT connector as a subscriber to topic odm/request/your-device-id,
if so, then you’ll receive an operation request like this:
A WebSocket session keeps one connection open in both directions, which suits devices that need low-latency
two-way messaging without re-establishing a connection for every message.
Replace your-device-id and your-api-key with the values of your environment.
What travels over the session
The messages themselves are shaped by a connector function: the URI of the
session is matched against the function’s southCriterias with the wss:// scheme, and the function
decides what to do with each incoming message. To send a message back down an already open connection, use
the WebSocket JavaScript API.
The contextParams your script receives include the session’s uri, its relative path and the
sessionIp, which is how a single function can serve several session paths and tell them apart.
CoAP
The Constrained Application Protocol (CoAP) is a lightweight web transfer protocol (RFC 7252) designed for constrained nodes and networks. OpenGate operates exclusively as a CoAP listening server, receiving incoming request messages (e.g. for data collection or operational responses) sent by devices.
Note: OpenGate does not initiate outbound CoAP requests to external CoAP servers running on devices. All CoAP communications must be initiated by the device towards OpenGate.
Endpoints
OpenGate listens for CoAP requests on both unencrypted UDP and secure DTLS ports.
Scheme
Port
Transport / Security
Example URI
coap://
5683
Unencrypted (UDP)
coap://api.opengate.es:5683/{meter_id}/{path}
coaps://
30013
DTLS (Datagram Transport Layer Security)
coaps://api.opengate.es:30013/{meter_id}/{path}
URI structure and south criteria
All CoAP URIs targeted by devices must place the device’s unique identifier ({meter_id}) at the beginning of the URL path:
{meter_id}: The unique OpenGate identifier of the device.
{path}: The resource path matched against the south criteria in your connector functions.
For example, a connector function configured with south criteria = "coaps://data" will match requests sent to either coap://api.opengate.es:5683/{meter_id}/data or coaps://api.opengate.es:30013/{meter_id}/data.
Each manufacturer or device implementation defines its own specific paths ({path}) and payload formats (JSON, binary, etc.), which are translated into OpenGate data structures by corresponding connector functions.
Authentication
Every CoAP request sent to OpenGate must include API key authentication (X-ApiKey). In CoAP, authentication is delivered as a custom CoAP Option:
Property
Value
CoAP Option Number
2502
Value Format
A string containing your OpenGate API key
Requirement
Required
Requests received without CoAP Option 2502 or with an invalid API key will be rejected by OpenGate as unauthorized.
Message processing and connector functions
Incoming CoAP requests are evaluated against configured connector functions:
Routing: The request scheme (coap:// or coaps://) and URI path are matched against the south criteria defined in your connector functions.
Execution: The matching connector function processes the request payload (such as JSON, binary data, etc).
Response: OpenGate returns a CoAP response to the device. To customize the status code, content format, or body of the response sent back to the device, use the CoAP JavaScript API.
OpenGate matches the request to the connector function with southCriterias = "coaps://data".
The connector function parses the payload, extracts data points for device METER-12345, and formats the response status using the CoAP JavaScript API:
// Example connector function snippet returning status 2.04 (CHANGED)
coap.server.response.status=204;
coap.server.response.send();
Operations
Introduction
Because OpenGate operates exclusively as a CoAP listening server, the platform cannot initiate outbound CoAP connections to devices. Operation management over CoAP is therefore device-driven: devices periodically poll OpenGate for pending operation requests and report execution results back to the platform.
URI Structure & Device-Driven Workflow
All CoAP operation URIs must begin with the device unique identifier ({meter_id}):
The operation workflow is typically split into two interaction endpoints defined via southCriterias:
1. Polling for Pending Operations
Devices periodically query OpenGate to check if there are pending operations queued for execution (e.g., firmware update requests, configuration changes, or remote commands).
Example Device URI: coaps://api.opengate.es:30013/{meter_id}/askForOperations
Matching southCriterias: coaps://askForOperations
Flow:
The device sends a CoAP request (e.g., POST or GET) to /askForOperations with CoAP Option 2502 containing the API key.
The connector function matching coaps://askForOperations retrieves pending operations assigned to {meter_id} from OpenGate.
The connector function formats and returns the pending operations to the device in the CoAP response payload.
2. Reporting Operation Execution Results
Once a device finishes executing an operation, it sends a CoAP request back to OpenGate to report the execution outcome (e.g., SUCCESS, ERROR, or progress status).
Example Device URI: coaps://api.opengate.es:30013/{meter_id}/operationResults
Matching southCriterias: coaps://operationResults
Flow:
The device sends a CoAP request (e.g., POST or PUT) containing the operation result payload.
The connector function matching coaps://operationResults parses the result payload and updates the operation status in OpenGate.
OpenGate returns a confirmation status (e.g., 2.04 Changed) via the CoAP JavaScript API.
Manufacturer & Payload Flexibility
Specific URIs and payload structures are defined per manufacturer or integration requirement. Different device models may use different relative paths (e.g., /pending-tasks, /report-outcome) and payload formats (JSON, CBOR, or binary).
Custom connector functions bridge the device-specific formats with OpenGate’s operation processing engine.
Authentication
All operation requests must carry API key authentication in CoAP Option 2502:
Property
Value
CoAP Option Number
2502
Value Format
String containing the OpenGate API key
Requirement
Required
Meter and industrial protocols
These are the protocols where OpenGate opens the conversation. There is no south endpoint waiting for the
device: a connector function reaches out, talks the protocol, and turns the answer
into data points or an operation result.
The polling model
flowchart TB
JOB["A job or task<br>launches an operation"] --> REQ["REQUEST connector function"]
REQ -->|"opens the connection"| DEV["Meter or network device"]
DEV -->|"attribute values"| REQ
REQ --> OUT["Operation result<br>and collected data points"]
classDef cf fill:#addcf8,stroke:#2b7cb8,color:#000,font-weight:bold
class REQ cf
Three consequences worth planning for:
The device must be reachable at an IP address: directly, over a VPN, or through a
gateway using a path.
Reading is an operation. You schedule meter readings with jobs and tasks, which
is also how you get retries, timeouts and per-device results.
Connection parameters live in your script, taken from the device’s provisioned data. Keep credentials
out of the code: read them from the entity object.
DLMS
The only protocol here that works in both directions.
Direction
What happens
Device to platform
The meter sends a DLMS message. A COLLECTION connector function receives it, with the obisCode and templateId of the message in contextParams and the attribute values in payload
Platform to device
dlms.connect() opens a session, then dlms.addAttr() builds a list of attributes by class id, OBIS code and attribute id, and dlms.get() or dlms.set() executes it
Attributes are addressed the DLMS way — a class id, an OBIS code and an attribute id — and values carry
explicit DLMS types such as octet-string, which the reference explains how to convert to dates and back.
Smart Gas meters differ enough between manufacturers to make a generic DLMS script painful. dlms_gas
absorbs that: it carries per-manufacturer behaviours — currently pietro, watertech, honeywell and
spark — over a common default, and is designed to be extended with new ones.
Electricity meters. iec102.connect(registerType) does more than open a socket:
registerType
Meaning
IP
Direct IP connection. The default when you do not specify one
VPN
Through a VPN
GSM
Over a GSM call, sending the commands needed to register
ATR
Over ATR, likewise
With GSM or ATR, connecting also collects a presence data point,
device.communicationModules[].subscription.mobile.presence.gsm, with OK or NOK — so the attempt itself
tells you whether the meter is alive.
Connection properties are set on the object before connecting:
On failure, connect sets the response status to ERROR_PROCESSING with the error description. Check the
returned status and return the response object instead of carrying on — otherwise the operation reports
something misleading.
Once connected, work is expressed as ASDUs: clock reading, load curves, profiles. They can be executed
directly, defined from the operation’s parameters, or declared by hand.
Sometimes the integration is not a protocol the device speaks on your behalf — it is you, on the device,
running commands. OpenGate opens these connections from a connector function, so
the device must be reachable at an IP address, directly or through a gateway.
SSH and Telnet
Both follow the same three-step shape, and the object properties are set before connecting:
connect and send both take a waitFor list: the strings that tell the client the device has finished
talking. Getting those right is most of the work with a shell integration, because there is no framing to
rely on — a prompt is the only end-of-message marker you have.
Prefer identity over password where the device supports it, and read either from the provisioned
entity rather than hardcoding it in the script.
A ping, which answers the one question every other integration depends on: is this device reachable at all?
Property
Meaning
ip
Address to ping
retries
Delivery retries, default 5
timeout
Milliseconds per retry, default 2500
async
true by default: the request does not block the function
Because async defaults to true, the result usually does not come back in the same execution. It
arrives at a separate RESPONSE connector function, which receives the outcome as its payload — that is
what the ICMP Response reference documents.
Set async to false when you want the answer inline and are prepared to wait for it.
The other protocols on this section connect OpenGate to a device. RADIUS connects it to the network:
the platform can receive RADIUS accounting packets from Remote Access Servers or delegated RADIUS servers,
and learn the operational state of M2M communications from the operator side rather than from the device.
That matters because it answers questions the device cannot. A device that stopped reporting looks identical
whether it is broken, out of coverage, or its SIM was suspended — network-side accounting tells them apart.
Who sends what
Sender
GGSN nodes, Remote Access Servers, or delegated RADIUS servers
Carries
RADIUS accounting packets about network sessions
Direction
Into OpenGate: the node reports, the platform receives
Gateway GPRS support nodes are part of the mobile operator’s network and are the usual source, which is why
this is provisioned as a mobile-operator concern rather than a device one.
Where it is provisioned
RADIUS clients are registered under mobile operators, not per device or channel:
OpenGate platform supports different device connection strategies. The following sections explain these connection strategies.
Direct connection strategy
Direct connection strategy is the most common connection scenario. Gateways and devices use it.
flowchart BT
GA["GatewayA"]
GB["GatewayB"]
NET(["Internet"])
OG["OpenGate Platform"]
GA -.-> NET
GB -.-> NET
NET -.-> OG
classDef platform fill:#fde8c8,stroke:#c98f2b,color:#000
classDef node fill:#e2e4e8,stroke:#8a8f98,color:#000
class OG platform
class GA,GB node
Each device reaches the platform on its own, with no intermediate node to traverse: deviceId alone
identifies the destination, and path is empty.
Indirect connection strategy
Devices behind gateways and complex connection scenarios like non-transparent mesh networks use an indirect connection strategy.
OpenGate supports these scenarios using a path. The path is an array of nodes (devices) to be traversed to reach the destination:
flowchart BT
D11["Device_1_1"]
D12["Device_1_2"]
MESH2(["mesh network"])
D1["Device_1"]
MESH1(["mesh network"])
GA["GatewayA"]
GB["GatewayB"]
NET(["Internet"])
OG["OpenGate Platform"]
D11 -.-> MESH2
D12 -.-> MESH2
MESH2 -.-> D1
D1 -.-> MESH1
MESH1 -.-> GA
GA -.-> NET
GB -.-> NET
NET -.-> OG
classDef platform fill:#fde8c8,stroke:#c98f2b,color:#000
classDef node fill:#e2e4e8,stroke:#8a8f98,color:#000
class OG platform
class D11,D12,D1,GA,GB node
The endpoint device, in case of operations, diagnostics sent by the platform.
The platform, in case of events, responses, etc., sent by the on-field device.
Indirect connection scenarios
Taking an indirect connection scenario, we have:
A gateway device with the id: GatewayA
An intermediate device connected to the gateway with the id: Device_1
Two endpoint devices connected to the intermediate device with the ids: Device_1_1 and Device_1_2 respectively.
From a platform point of view, the path and deviceId parameter values are:
To reach the Gateway:
"deviceId": "GatewayA"
"path": []
To reach the intermediate device:
"deviceId": "Device_1"
"path": ["GatewayA"]
To reach an endpoint device:
"deviceId": "Device_1_1"
"path": ["GatewayA", "Device_1"]
Deployment Elements
Comprehensive API actions
Getting deployment elements
Endpoint to download deployment element files from the platform.
Usage examples
Download a deployment element file (replace {file_path} with the path of the deployment
element you want to retrieve):
A valid request returns HTTP 200 with the file content.
API specification
Connector Functions
Devices rarely speak the protocol you wish they did. A meter answers DLMS, a legacy gateway needs a Telnet
command, a sensor posts a binary frame nobody else understands. A connector function is your own
JavaScript, running inside the platform, that translates between OpenGate and that reality.
No middleware to deploy, no service to keep alive: you POST the script, and OpenGate runs it at the
moment the data or the operation passes through.
What one looks like
A connector function is a JSON document with a javascript field holding the code, plus the metadata that
tells OpenGate when to run it:
Each function belongs to exactly one channel, and its name must be unique within that channel.
The three types
The type answers which direction is this translating?
flowchart TB
APP["Back-office application"] -->|"launches an operation"| REQ["REQUEST"]
REQ -->|"speaks the device protocol"| DEV["Device"]
DEV -->|"answers the operation"| RES["RESPONSE"]
DEV -->|"pushes data"| COL["COLLECTION"]
RES -->|"operation result"| OUT["Operation updated"]
COL -->|"data points"| STO["Platform storage"]
classDef cf fill:#addcf8,stroke:#2b7cb8,color:#000,font-weight:bold
class REQ,RES,COL cf
The three blue boxes are the connector functions: your JavaScript, at the point where each translation
happens.
Type
Runs when
Must return
REQUEST
The platform has an operation to send to the device
Nothing is required. Return null, or omit the return, and the operation stays open until a response arrives. Return the response object and the operation finishes right there
RESPONSE
Something arrives from the device at a south URI, answering an operation
The OpenGate standard response object. Return nothing and no operation update happens
COLLECTION
Something arrives from the device at a south URI, carrying data
The OpenGate standard collection object. Return nothing and nothing is collected
The core JavaScript API gives you the response and collection objects to build
those returns without assembling JSON by hand.
Criteria: how OpenGate picks your function
Criteria
Used by
Meaning
northCriterias
REQUEST only, mandatory
Matches the operation coming from the platform. Two functions cannot share the same list
southCriterias
RESPONSE and COLLECTION, mandatory
One or more URIs the device talks to. Each URI can belong to only one connector function
A REQUEST function also needs operationName, which must be an operation type you are allowed to use,
and must leave southCriterias unset. RESPONSE and COLLECTION functions are the mirror image: south
criteria set, northCriteria and operationName unset.
South criteria are URIs carrying the protocol, and the accepted set is configurable:
operationalStatus is what keeps a half-written function from touching your fleet:
Value
OpenGate runs the function
DISABLED
Never
TEST
Only on devices whose operational status is TEST
PRODUCTION
Only on devices whose operational status is PRODUCTION
The natural order is therefore: create it DISABLED, move it to TEST against a test device, and only
then to PRODUCTION.
Chaining functions
A function can hand over to another when it finishes, using cf.response and cf.collection. Only these
hand-offs are honoured — anything else is silently ignored:
From
Can invoke
REQUEST
RESPONSE, COLLECTION, or both
RESPONSE
COLLECTION
COLLECTION
Nothing
That is what lets a single device message both close an operation and collect the readings it carried. See
Concatenated Connector Functions.
Where to go next
To
Read
Write the script: what it receives, what it must return
Creating or updating a connector function performs only minimal JavaScript parsing. A script that is
syntactically odd but parseable will be accepted and fail at runtime, which is why TEST status and
debugging matter.
These objects are available to every connector function, whatever protocol the device speaks. Start
with the JavaScript API — it explains what your script receives and what it must
produce — and come back here for the object you need.
One more global is always there and is documented outside this section, because rules use the very same
object: logger, for writing TRACE, DEBUG, INFO, WARN and ERROR traces. It is the way to see
what a running function is doing — see Debugging, which covers both the
logger API and the
WebSocket service that streams the traces live.
Reserved names
Because these helpers are injected as globals, their names are reserved. Do not declare variables called
cf, collection, response, snmp, utils, dlms, dlms_gas, provision, operation or logger in your
script.
In this javascript code, it is possible to use some defined functions to define the connector function. We will explain
them below.
Input parameters
The main script will have access to the following main vars:
entity: json with flattened operation target device entity representation.
gateway: json with flattened gateway entity representation. It can be null.
response: json with default response data (device identifier, request id (if known)…)
collection: json with default collection data (device identifier if known)
payload: it can be of different types: json object, binary content or flat text. It can contain different types of information: request or response information, collected data….
contextParams: json object with execution context information. It can have some of this params:
apiKey: device or user apikey.
remoteIp: remote host when HTTP Rest Resource is invoked.
uri: opened Websocket complete uri or invoked HTTP Rest Resource complete uri.
path: opened Websocket relative path or invoked HTTP Rest Resource relative path. This is the path used as south criteria to filter CFs.
topic: MQTT Topic where the message arrived.
sessionIp: device session IP
Protocol clients and APIs: clients such as mqtt, ssh, snmp, dlms, dlms_gas, provision, and operation will be available for being used.
Depending on the type of CF, the script must have different outputs (regardless of whether other calls are
concatenated).
REQUEST CF
No output is mandatory, so return null; can be used, or no return statement defined at all. In this case the operation will not be finished until the response event is processed.
Although the return statement is not mandatory, it is possible to return the response object. If returned, it will be processed and the operation can be finalized directly.
RESPONSE CF
In this case, OpenGate Standard Response object must be returned. If nothing or null is returned, then no operation
update will be done.
response object functions can be used to complete full data.
COLLECTION CF
In this case, OpenGate Standard Iot Data Collection object must be returned. If nothing or null is returned, then no
collection will be done.
collection object functions can be used to complete full data.
Connector function execution concatenation
In some cases, it is possible to invoke the execution of other CFs once the current CF execution is finished.
These are allowed cases:
From REQUEST CF:
Invoke RESPONSE CF
Invoke COLLECTION CF
Invoke RESPONSE CF and COLLECTION CF
From RESPONSE CF:
Invoke COLLECTION CF
Other invocations will be ignored (for example, invoke RESPONSE CF from COLLECTION CF).
There are two help functions for this:
cf.response
cf.collection
JS API
cf.operationParameters(operationObj)
Extract from operationObj parameters field. This function could be used in REQUEST CFs, when the payload is Operation Request json.
Kind: global function Returns: * - Returns parameters field. It can be a complex object. If operationObj is not a correct Request object, null will be returned.
Deprecated: Use cf.collection instead. Note the arguments are in the opposite order: cf.collection takes the criteria first and the payload second.
Used in Request or Response connector functions to define a concatenated Collection action.
Kind: global function
Param
Type
Description
collectionData
*
data to be used as payload in Collection Connector Function.
collectionFunctionCriteria
String
the criteria to be used to search collection connector function.
publishOnTopic(payload, topic, deviceId)
Deprecated: Use the mqtt object instead: set mqtt.topic and mqtt.device, then call mqtt.publish.
Publish specified payload for specified topic and device.
Kind: global function
Param
Type
Description
payload
*
Data to be published. It will be converted to string.
topic
String
topic uri.
deviceId
String
device id.
ogCollection(datastreams, device, version)
Deprecated: Build collections with the collection object instead. The object is not a function-for-function replacement: it simplifies what these globals did by hand.
Creates OG collection main object.
Kind: global function Returns: Object - Json with Opengate Data Collection object.
Param
Type
Description
datastreams
Array
Array of datastreams objects. Pass null for an empty array.
device
String
String with deviceId. Pass null if there is none.
version
String
String with version. If not specified, “1.0.0” value will be used.
Deprecated: Build collections with the collection object instead. The object is not a function-for-function replacement: it simplifies what these globals did by hand.
Creates OG collection datastream object.
Kind: global function Returns: Object - Json with Opengate Data Collection Datastream object.
Param
Type
Description
datastreamId
String
String with datastreamid. If not provided null will be set.
feed
String
String with feed name. If not provided null will be set.
datapoints
Array
Array of datapoints objects. If not provided empty array will be set.
Deprecated: Build collections with the collection object instead. The object is not a function-for-function replacement: it simplifies what these globals did by hand.
Creates OG collection datapoint object.
Kind: global function
Param
Type
Description
value
*
collected value. If not provided null will be set.
at
number
Number with collection timestamp. If not provided null will be set.
source
String
String with source name. If not provided null will be set.
sourceInfo
String
String with source description. If not provided null will be set.
Deprecated: Build collections with the collection object instead. The object is not a function-for-function replacement: it simplifies what these globals did by hand.
Adds datapoint to specified datastream in the collection object, if datastream does not exist, it creates the datastream.
Kind: global function
Param
Type
Description
datapoint
Object
Datapoint object to be added.
ogCollection
Object
Opengate collection object with current collection data.
datastreamId
String
Datastream object identifier in collection object. If not exist, it will be created.
feed
String
feed name, only used if the datastream must be created.
Deprecated: Build operation responses with the response object instead. The object is not a function-for-function replacement: it simplifies what these globals did by hand.
Creates OG response object
Kind: global function Returns: Object - OG response object
Param
Type
Description
id
String
operation request id. Pass null if there is none.
name
String
launched operation name. Pass null if there is none.
deviceId
String
operation request device id. Pass null if there is none.
resultCode
String
operation result code. Pass null if there is none.
resultDescription
String
operation result description. Pass null if there is none.
steps
Array
Pass null for an empty array.
timestamp
String
Operation response timestamp. Pass null to use the current timestamp.
Deprecated: Build operation responses with the response object instead. The object is not a function-for-function replacement: it simplifies what these globals did by hand.
Creates OG step object used in opengate response object.
Kind: global function Returns: Object - OG step object
Param
Type
Description
name
String
step name. If not provided null will be set.
result
String
step result. If not provided null will be set.
description
String
description string. If not provided, null will be assigned.
stepResponseList
String
array of stepResponse objects. If not provided, empty array will be assigned.
ogStepResponse([name], [value])
Deprecated: Build operation responses with the response object instead. The object is not a function-for-function replacement: it simplifies what these globals did by hand.
Creates OG step response object, used in step object.
Kind: global function Returns: Object - OG step response object
Param
Type
Description
name
*
step name. If not provided null will be set.
value
Object
object with value. If not provided empty object will be assigned.
httpRequest(request, [payload])
Deprecated: Use the http.client object instead. It is not a single call: the object is configured first and then one of its methods — get, post, put, patch, delete or request — is invoked.
Executes specified request with specified payload.
Kind: global function Returns: Object - JSON with response. It will have two fields: ‘statusCode’ with http result code and ‘body’ with response body content.
Param
Type
Description
request
Object
Object with requests parameters: ‘method’, ‘uri’ and ‘headers’. - ‘method’: GET, POST, PUT, DELETE. - ‘uri’: request uri. - ‘headers’: json with http request headers.
data to be published. It will be converted to string.
deviceId
String
Device identifier with the opened websocket
entityValue(entity, datastream, index)
Deprecated: Use entity._value instead — the entity is the receiver, so the first argument goes away. The same method works on gateway.
Extract from entity specified datastream “value” field value.
Kind: global function Returns: * - Specified datastream “value” field. It can be complex object. null if datastream does not exist.
Param
Type
Description
entity
Object
entity Object with flattened entity.
datastream
String
Datastream name, for example: ‘provision.device.identifier’.
index
number
Array Index. If provided datastream is an array (i.e. comm module), element index must be specified.
entitiesValue(entities, datastream, index)
Deprecated: Use utils.odm.entitiesValue instead. It moved to utils because, unlike the rest of this group, it acts across several entities rather than one.
Extract from the first entity of entities array specified datastream “value” field value.
Kind: global function Returns: * - Specified datastream “value” field. It can be complex object. null if datastream does not exist.
Param
Type
Description
entities
Array
Array of objects with flattened entity.
datastream
String
Datastream name, for example: ‘provision.device.identifier’.
index
number
Array Index. If provided datastream is an array (i.e. comm module), element index must be specified.
entityAt(entity, datastream, index)
Deprecated: Use entity._at instead — the entity is the receiver, so the first argument goes away. The same method works on gateway.
Extract from entity specified datastream “at” field value.
Kind: global function Returns: * - Specified datastream “at” field. It can be complex object. null if datastream does not exist.
Param
Type
Description
entity
Object
entity Object with flattened entity.
datastream
String
Datastream name, for example: ‘provision.device.identifier’.
index
number
Array Index. If provided datastream is an array (i.e. comm module), element index must be specified.
entityDate(entity, datastream, index)
Deprecated: Use entity._date instead — the entity is the receiver, so the first argument goes away. The same method works on gateway.
Extract from entity specified datastream “date” field value.
Kind: global function Returns: * - Specified datastream “date” field. It can be complex object. null if datastream does not exist.
Param
Type
Description
entity
Object
entity Object with flattened entity.
datastream
String
Datastream name, for example: ‘provision.device.identifier’.
index
number
Array Index. If provided datastream is an array (i.e. comm module), element index must be specified.
entitySource(entity, datastream, index)
Deprecated: Use entity._source instead — the entity is the receiver, so the first argument goes away. The same method works on gateway.
Extract from entity specified datastream “source” field value.
Kind: global function Returns: * - Specified datastream “source” field. It can be complex object. null if datastream does not exist.
Param
Type
Description
entity
Object
entity Object with flattened entity.
datastream
String
Datastream name, for example: ‘provision.device.identifier’.
index
number
Array Index. If provided datastream is an array (i.e. comm module), element index must be specified.
entitySourceInfo(entity, datastream, index)
Deprecated: Use entity._sourceInfo instead — the entity is the receiver, so the first argument goes away. The same method works on gateway.
Extract from entity specified datastream “sourceInfo” field value.
Kind: global function Returns: * - Specified datastream “sourceInfo” field. It can be complex object. null if datastream does not exist.
Param
Type
Description
entity
Object
entity Object with flattened entity.
datastream
String
Datastream name, for example: ‘provision.device.identifier’.
index
number
Array Index. If provided datastream is an array (i.e. comm module), element index must be specified.
log(…msg)
Deprecated: Use logger.debug instead, or another level of the logger object where it fits better.
Creates Info level logging messages. It concatenates msg parameters in the final string to be logged.
Kind: global function
Param
Type
Description
…msg
any
The function takes as parameters a list of elements to be concatenated to generate the string message to be printed.
Builds a datapoint object and adds it to the specified datastream in the datastreams list in the collection global object.
Kind: global function Returns: Void
Param
Type
Description
datastreamId
string
Datastream identifier by which the datapoint will be identified.
value
any
Collected value. If not provided null will be set.
at
number
Number with collection timestamp in seconds. If not provided null will be set.
source
string
String with source name. If not provided null will be set.
sourceInfo
string
String with source description. If not provided null will be set.
Example of use:
varnow= Date.now() /1000;
collection.addDatapoint('device.name', 'collected name from cf', now,'mySource','mySourceInfo');
collection.setFeed(datastreamId, feed)
Sets the feed name to a specific datastream in the datastreams list in the collection global object.
Kind: global function Returns: Void
Param
Type
Description
datastreamId
string
Datastream identifier by which the datapoint will be identified.
feed
string
The feed name to set to the specified datastream.
Example of use:
collection.setFeed('device.name', 'myFeed');
collection.send()
Sends a collection message to the OpenGate’s collection messages flow using the datastreams list in the collection global object, after that this list is cleaned.
Kind: global function Returns: Void
Example of use:
collection.send();
collection.getValue(datastream, [dpIndex])
Searches for a datapoint value for the specified datastreamId. It is possible to specify the datapoint index inside the datastream. If not found, a null value will be returned.
Kind: global function Returns: *
Param
Type
Description
datastream
string
Datastream identifier which value must be returned
dpIndex
number
Datapoint index. If not defined first datapoint will be returned
Example of use:
vardpValue=collection.getValue('device.name');
// dpValue will be 'collected name from cf'
Operation Steps API
Connector functions JS API guide for the response object and immediate operation steps notification
This API provides methods on the response global object to build operation step results, notify them immediately, and set the operation result code.
This method sets the UNKNOWN_RESULT statusCode with the provided description.
Kind: global function Returns: Void
Param
Type
Description
statusDescription
string
Descriptive text for result.
Example of use:
response.unknownResult("Unknow result from CF");
response will contain the following data:
{
"operation": {
"response": {
//...
"resultCode": "UNKNOWN_RESULT",
"resultDescription": "Unknow result from CF",
//...
}
}
}
Operation JavaScript API
Connector functions - Active Operation JS API guide
This API allows users to read and activate operations from a connector function.
operation – Main Object
The operation object is the main object. It allows making requests to the Operations API.
To do the request, the object operation use the HTTP-Client API, you can use all attribute of this interface, for example, to add a certificate http.client.certificate=XXX
operation – Object Properties
Property
Type
Description
deviceId
string
Target device id of the operation pending
apiKey
string
Api-Key to use in the request to the Operations-API
host
string
Host to use in the request to the Operations-API
By default, the attributes will be set with the value of the context.
operation – Functions
operation.getAllPending()
Read and return the selected device operations pending (with status WAITING_FOR_CONNECTION) of the user to execute the CFx
This function does not require parameters.
The operation.getAllPending function returns an object, described as follows:
Property
Type
Attributes
Description
error
null or string
Message
Description of the exception error caught, or error sent by the request. It will be null when the request contains no errors
opResult
Object
statusCode, Object
Contains statusCode, and the result list object of the request, when it’s OK
Example of use with default values:
varopResult=operation.getAllPending();
operation.getNotFinished()
Read and return the selected device operations that are not finished
This function does not require parameters.
Function operation.getNotFinished return object, descript like:
Property
Type
Attributes
Description
error
null or string
Message
Description of the exception error caught, or error sent by the request. will be null, when the request no contains errors
opResult
Object
statusCode, Object
Contains statusCode, and the result list object of the request, when it’s OK
Example of use:
varopResult=operation.getNotFinished();
operation.getByCustomCondition(customCondition)
Read and return the selected device operations that match a custom filter condition
This API allows users to manage entity provisioning (creation and retrieval) from a connector function.
provision – Main Object
The provision global object provides properties and methods to interact with the Provisioning API.
provision – Object Properties
Property
Type
Default
Description
apiKey
string
If available, current connection’s apikey
API Key for the request.
host
string
Frontend’s default endpoint
Host for the Provisioning API.
identifier
string
null
Identifier of the entity to act upon.
organization
string
Device`s organization
Organization to which the entity belongs.
serviceGroup
string
"emptyServiceGroup"
Service Group for the entity.
defaultChannel
string
"defaultChannel"
Channel to which the entity belongs.
plan
string
null
Provisioning plan to apply.
extraDatastreams
Array
[]
Extra data as an array of objects like {datastreamId:value} pairs.
provision – Functions
provision.get(id)
Retrieves an existing entity from the database with specified identifier.
Kind: global function Returns: Object - If entity is found, entity data will be returned in result. If it is not found, result field will be null. If some error happened, it will be returned in error field.
Param
Type
Default
Description
id
string
this.identifier
(Optional) Entity identifier. If not defined identifier field will be used.
Example with provision.identifier:
provision.identifier="device_123";
constresp=provision.get();
if (!resp.error&&resp.result) {
logger.info("Entity identifier:", resp.result._value("provision.administration.identifier"));
}
Example with parameter:
constresp=provision.get("device_123");
if (!resp.error&&resp.result) {
logger.info("Entity identifier:", resp.result._value("provision.administration.identifier"));
}
Example with unexepected error:
constresp=provision.get("device_123");
if (resp.error) {
logger.error("Some error:", resp.error);
}
The object resp.result contains then same functions than entity object.
provision.create(fullBody)
Creates a new entity in the platform.
Kind: global function
Param
Type
Description
fullBody
Object
(Optional) Complete JSON body for the creation request. If not provided, it is generated from the object properties.
Returns: Object - An object containing either result (201 status) or error.
Sets a call for a RESPONSE connector function, if there is one that matches the south criteria indicated in responseFunctionCriteria, setting its input payload to the value of responsePayload.
Kind: global function Returns: Void
Param
Type
Description
responseFunctionCriteria
string
The south criteria that will be used to find a RESPONSE connector function.
responsePayload
any
It can be a String or a JSON object. In case it is null or not provided, the current connector function response object will be used instead. It is the in payload for the concatenated RESPONSE connector function.
Sets a call for a COLLECTION connector function, if there is one that matches the south criteria indicated in collectionFunctionCriteria, setting its input payload to the value of collectionPayload.
Kind: global function Returns: Void
Param
Type
Description
collectionFunctionCriteria
string
The south criteria that will be used to find a COLLECTION connector function.
collectionPayload
any
It can be a String or a JSON object. In case it is null or not provided, the current connector function response object will be used instead. It is the in payload for the concatenated COLLECTION connector function.
The address which the type will be calculated for.
Example of use:
varaddressType=utils.odm.getAddressTypeFromAddress("[IP_ADDRESS]");
//addressType will be: ipv4
varaddressType=utils.odm.getAddressTypeFromAddress("2001:0db8:85a3:0000:0000:8a2e:0370:7334");
//addressType will be: ipv6
Executes specified request with specified payload.
Kind: global function Returns: Object - JSON with response. It will have two fields: ‘statusCode’ with http result code and ‘body’ with response body content.
Param
Type
Description
request
Object
Object with requests parameters: ‘method’, ‘uri’ and ‘headers’. - ‘method’: GET, POST, PUT, DELETE. - ‘uri’: request uri. - ‘headers’: json with http request headers.
Connector functions JS API guide for crypto utility
This file provides methods for different crypto utilities using crypt global object.
Encrypt and decrypt messages with AES algorithms
The crypt.aes global object provides all the functions for encryption and decryption using the AES algorithm.
These JavaScript functions use the cipher algorithm identifier required by the Java method javax.crypto.Cipher.getInstance(algorithm), composed of {CipherName}/{cipherMode}/{CipherPadding}. Some examples are:
AES/CBC/NoPadding
AES/CBC/PKCS5Padding
AES/ECB/NoPadding
AES/ECB/PKCS5Padding
AES/GCM/NoPadding
Data hashing
The crypt.hmac global object provides functions for hashing data.
Encrypt the data using the selected AES algorithm with the provided shared key.
Kind: global function Returns: Uint8Array
Param
Type
Description
algorithm
string
algorithm identifier, as required in java javax.crypto.Cipher.getInstance(algorithm). For example: AES/CBC/PKCS5Padding
key
Uint8Array
key used to encrypt the data. In AES algorithms. The key size must match the selected algorithm. For example, AES algorithms support keys of 16 bytes (AES-128), 24 bytes (AES-192), or 32 bytes (AES-256).
ivParam
Uint8Array
Initialization vector (IV) used in encryption. Only allowed or required depending on the selected algorithm.
Decrypt the data using the selected AES algorithm with the provided shared key.
Kind: global function Returns: Uint8Array
Param
Type
Description
algorithm
string
algorithm identifier, as required in java javax.crypto.Cipher.getInstance(algorithm). For example: AES/CBC/PKCS5Padding
key
Uint8Array
key used to decrypt the data. In AES algorithms. The key size must match the selected algorithm. For example, AES algorithms support keys of 16 bytes (AES-128), 24 bytes (AES-192), or 32 bytes (AES-256).
ivParam
Uint8Array
Initialization vector (IV) used in encryption. Only allowed or required depending on the selected algorithm.
You only need the page for the protocol your device actually speaks. Each of these injects one global
object into your script, on top of the core API that is always there.
This API allows users to execute HTTP related actions from a connector function.
HTTP Object
The http object is the main object of the HTTP client. It allows perform different actions such as do http request or define http response for Operation Response or Iot Collections requests through http protocol.
http object is divided in two objects:
server: Only for CFs called from http requests. Gives access to received request and allows to specify http response to be sent.
client: Configure and make http requests.
server Object Properties
Read only properties with received HTTP request and response object to define HTTP response to be sent.
Property
Type
Default
Description
headers
JSON
Received http request headers
uri
string
Received http request uri (without host)
body
*
Received http request body (the same content as the payload property)
response
JSON
{}
Object to be used to define http response to be sent when CF finishes
server.response Object Properties
Property
Type
Default
Description
status
integer
201
Response HTTP code
body
*
null
Response body
headers
JSON
null
Response HTTP headers
server.response Object Methods
http.server.response.send()
Creates HTTP Response with defined properties. The response will be sent once the CF is finished correctly.
In this case, after CF execution, the Http response to be generated will have 200 status code with specified body ({'msg': 'OK'}) and no specific headers.
client Object Properties
Property
Type
Default
Description
method
string
null
One of http methods: POST, GET, …
uri
string
null
Request uri
headers
JSON
null
Request headers in json format
body
*
null
Response body
alias
string
null
Used to set custom https context, alias to be used for keystore
certificate
string
null
Used to set custom https context, certificate content
privateKey
string
null
Used to set custom https context, private key content
redirectPolicy
string
null
Overrides default redirection policy
clientVersion
string
null
Overrides default client version configured
timeOut
integer
null
Overrides default timeout configured. Defined in seconds
client Object Methods
Following methods return Http Request result JSON with these fields:
Field
Description
statusCode
Received response HTTP code
body
Received response body
headers
Received response headers
http.client.post()
Performs POST using defined configuration. Overrides defined method.
Connector functions JS API guide for the CoAP protocol
This file provides methods and properties to specify a custom return code and a custom body in the CoAP response that is sent from the OpenGate platform to the device.
coap.server.response Object: Specifying a custom CoAP response to the device.
The coap.server.response global object provides all the necessary functionality to be able to specify both the state and the body of the CoAP response to return to the device.
coap.server.response Object Properties
Property
Type
Default
Description
status
number
204
The returned status, as a three digits number without dots
body
Uint8Array
[]
The body of the returned CoAP response, as array of bytes
contentFormat
number
Indicates the representation format of the response body
coap.server.response Object Methods
coap.server.response.send()
The status, body and contentFormat are saved for inclusion in the CoAP response.
Example of use
// sending CHANGED status (2.04), and a number 1 as body (two bytes unsigned integer - little endian)
coap.server.response.status=204;
coap.server.response.body=newUint8Array([01, 00]);
coap.server.response.send();
DLMS JavaScript API
Connector functions DLMS JS API guide
This JavaScript code provides predefined functions to execute DLMS requests from the connector function. They are explained below.
Tip
For Smart Gas devices, there is a specialized extension of this API called DLMS Gas API which simplifies many common operations.
Types of south criteria for your DLMS connector function:
Description
Format
Example
Identification via OBIS code for notifications that contain a description element
dlms://obis/<obis-code>
dlms://obis/0.0.66.0.48.255
Identification via template ID for notifications containing only 1 or more octet-string values and taking first byte of each octet-string as template ID
dlms://template/<template-id>
dlms://template/48
Warning
The OBIS Code needs to be specified using only dots as separator, don’t use the complex form 0-0:66.0.48.255 or the Connector Function will not be called.
Input parameters in Collection Connector Function
The main script will have access to three main vars:
entity: json with flattened operation target device entity representation.
gateway: json with flattened gateway entity representation. It can be null.
payload: json that represents the DLMS message received from the device.
contextParams: json object with execution context information. It can have some of this params:
apiKey: device or user apikey.
remoteIp: remote host where DLMS message is invoked.
obisCode: OBIS code of the message arrived.
templateId: Template identifier of the message arrived.
ContextParams for COLLECTION Connector function for DLMS connection:
For REQUEST Connector Functions we will use the functions described below. You have an object, named dlms, with all the functions described. You must use dlms.<function>.
If you want to collect data after executing any of these function you can hand it over to a COLLECTION connector function with cf.collection, setting various obis code in the south criteria as you can see in the next example:
// After connection has been established
dlms.addAttr(1, "1.2.3.4.5.6", 2, "unsigned", 254)
varsetResult=dlms.set() // More details on set next
dlms.addAttr(classId, obisCode, attrId, data)
Applicable for normal sets.
Param
Type
Description
classId
Array
The class ID of the object to access
obisCode
string
The name of the object to access
attrId
number
The attribute index of the object
data
object (with type and value)
The data with both type and value to set
where:
data attribute
Type
Description
type
string
The data type of the value to set
value
see data types
The data value to set
This is an alternate way of using addAttr(classId, obisCode, attrId, type, value) with the data parameters in an object.
// After connection has been established
//dlms.addAttr(1, "1.2.3.4.5.6", 2, "unsigned", 254)
dlms.addAttr(1, "1.2.3.4.5.6", 2, {"type":"unsigned", "value":254}) // This is similar to the previous addAttr (commented)
varsetResult=dlms.set() // More details on set next
It’s helpful when used in combination with get().
// After connection has been established
dlms.addAttr(1, "1.2.3.4.5.6", 2)
vargetResult=dlms.get() // More details on get next
dlms.addAttr(1, "1.2.3.4.5.255", 2, getResult[0]) // Set on object 1.2.3.4.5.255 the value (and data type) retrieved from object 1.2.3.4.5.6
varsetResult=dlms.set() // More details on set next
The proper access selector and parameters depend on the manufacturer and object type. Some may implement by range and by entry defined in the DLMS Blue Book - Parameters for selective access to the buffer attribute (section 4.3.6 in Blue Book 12).
// For normal get
dlms.addAttr({classId:1, obisCode:"1.2.3.4.5.6", attrId:2})
// For normal set
dlms.addAttr({classId:1, obisCode:"1.2.3.4.5.6", attrId:2, type:"unsigned", value:254})
// For get with selective access
dlms.addAttr({classId:1, obisCode:"1.2.3.4.5.6", attrId:2, accessSelector:1, accessParameters: {type:"unsigned", value:254}})
data types
Name
Value type
Compatible type in set
Description
Example
null-data
null
null
array
Array of object
Complex data, all elements must be of the same type
224..252 reserved, 253 2nd last day of month, 254 last day of month, 255 not specified
dayOfWeek
1..7 (mon-sun)
255 not specified
hour
0..23
255 not specified
minute
0..59
255 not specified
second
0..59
255 not specified
hundredthsOfSecond
0..99
255 not specified
deviation
-720..720 (in minutes of local time to UTC)
32768 not specified
status
8 bit flags
255 not specified
Info
For more information see DLMS Blue Book - Date and time formats (section 4.1.6.1 in Blue Book 12)
To transform this object to a Date see getDate(). Keep in mind that sets of date-time, date, time and octet-string do not accept a Date object. To transform it to a dateTime object use getDateTime().
dlms.get(descriptive, forceWithoutList)
Executes a multi DLMS get attribute request with the previously specified payload (addAttr(classId, obisCode, attrId)).
Kind: global function Returns: Array - Array of JSONs with responses. Each JSON will have six fields: result of the get operation, the requested classId, obisCode and attrId, type with the data type of the received value and the value received from the device. An optional error field may be returned for any error that happened during the get.
Param
Type
Mandatory
Default
Description
descriptive
boolean
true
Descriptive mode returns complex data as Array of object containing type and value for each object, non descriptive mode flattens the returned array
forceWithoutList
boolean
false
Whether to force the get to request elements one by one instead of using a list when MULTIPLE_REFERENCES conformance is enabled (if it’s not set the global forceGetWithoutList will be used)
Example for descriptive get:
// After connection has been established
dlms.addAttr(1, "0.0.0.0.0.0", 2) // Example for null-data
dlms.addAttr(1, "0.0.0.0.0.1", 2) // Example for array
dlms.addAttr(1, "0.0.0.0.0.2", 2) // Example for structure
dlms.addAttr(1, "0.0.0.0.0.3", 2) // Example for boolean
dlms.addAttr(1, "0.0.0.0.0.4", 2) // Example for bit-string
dlms.addAttr(1, "0.0.0.0.0.5", 2) // Example for double-long
// Rest on number examples are omitted because they are similar to double-long
dlms.addAttr(1, "0.0.0.0.0.6", 2) // Example for octet-string
dlms.addAttr(1, "0.0.0.0.0.7", 2) // Example for visible-string
// utf8-string example is omitted because it's similar to visible-string
varresult=dlms.get() // Descriptive (true can also be passed)
log(result[0]) // Expected output: {"result":"success","classId":1,"obisCode":"0.0.0.0.0.0","attrId":2,"type":"null-data","value":null}]
log(result[1]) // Expected output: {"result":"success","classId":1,"obisCode":"0.0.0.0.0.1","attrId":2,"type":"array","value":[{"type":"long-unsigned","value":1},{"type":"long-unsigned","value":2},{"type":"long-unsigned","value":3}]}
log(result[2]) // Expected output: {"result":"success","classId":1,"obisCode":"0.0.0.0.0.2","attrId":2,"type":"structure","value":[{"type":"unsigned","value":1},{"type":"long-unsigned","value":2},{"type":"array","value":[{"type":"visible-string","value":"one"},{"type":"visible-string","value":"two"}]}]}
log(result[3]) // Expected output: {"result":"success","classId":1,"obisCode":"0.0.0.0.0.3","attrId":2,"type":"boolean","value":true}
log(result[4]) // Expected output: {"result":"success","classId":1,"obisCode":"0.0.0.0.0.4","attrId":2,"type":"bit-string","value":[true,false,true]}
log(result[5]) // Expected output: {"result":"success","classId":1,"obisCode":"0.0.0.0.0.5","attrId":2,"type":"double-long","value":1}
log(result[6]) // Expected output: {"result":"success","classId":1,"obisCode":"0.0.0.0.0.6","attrId":2,"type":"octet-string","value":[116,101,115,116]}
log(result[7]) // Expected output: {"result":"success","classId":1,"obisCode":"0.0.0.0.0.7","attrId":2,"type":"visible-string","value":"test"}
Example for non descriptive get
// After connection has been established
// Simple value types are returned exactly the same as descriptive mode, null-data is included to viasually see this
dlms.addAttr(1, "0.0.0.0.0.0", 2) // Example for null-data
// Simple value types are returned exactly the same as descriptive mode, null-data is included to viasually see this
dlms.addAttr(1, "0.0.0.0.0.1", 2) // Example for array
dlms.addAttr(1, "0.0.0.0.0.2", 2) // Example for structure
varresult=dlms.get(false) // Non descriptive
log(result[0]) // Expected output: {"result":"success","classId":1,"obisCode":"0.0.0.0.0.0","attrId":2,"type":"null-data","value":null}]
log(result[1]) // Expected output: {"result":"success","classId":1,"obisCode":"0.0.0.0.0.1","attrId":2,"type":"array","value":[1,2,3]}
log(result[2]) // Expected output: {"result":"success","classId":1,"obisCode":"0.0.0.0.0.2","attrId":2,"type":"structure","value":[1,2,["one","two"]]}
Non descriptive get
Complex values returned in a non-descriptive get cannot be passed as value in a set.
get results
success
hardware-fault
temporary-failure
read-write-denied
object-undefined
object-class-inconsistent
object-unavailable
type-unmatched
scope-of-access-violated
data-block-unavailable
long-get-aborted
no-long-get-in-progress
long-set-aborted
no-long-set-in-progress
data-block-number-invalid
other-reason
dlms.set(descriptive)
Executes a multi DLMS set attribute request with the previously specified payload (addAttr(classId, obisCode, attrId, type, value)).
Kind: global function Returns: Array - Array of JSONs with responses. Each JSON will have six fields: result of the set operation, the requested classId, obisCode and attrId, type with the data type of the received value and the value received from the device. An optional error field may be returned for any error that happened during the set.
Param
Type
Mandatory
Default
Description
descriptive
boolean
true
Does not matter on set(). It’s included to have the same signature as get() and in case a device returns something in a set.
forceWithoutList
boolean
false
Whether to force the set to request elements one by one instead of using a list when MULTIPLE_REFERENCES conformance is enabled (if it’s not set the global forceSetWithoutList will be used)
Info
Normally, a set request should always return a null-data as type and null as value.
Warning
A set request for complex data must always specify the value in a descriptive manner (as Array of Object containing both type and value for each and all elements and sub-elements in case of more nested complex elements).
// After connection has been established
dlms.addAttr(1, "0.0.0.0.0.0", 2, "null-data", null) // Example for null-data
dlms.addAttr(1, "0.0.0.0.0.1", 2, "array", [{"type":"long-unsigned","value":1},{"type":"long-unsigned","value":2},{"type":"long-unsigned","value":3}]) // Example for array
dlms.addAttr(1, "0.0.0.0.0.2", 2, "structure", [{"type":"unsigned","value":1},{"type":"long-unsigned","value":2},{"type":"array","value":[{"type":"visible-string","value":"one"},{"type":"visible-string","value":"two"}]}]) // Example for structure
dlms.addAttr(1, "0.0.0.0.0.3", 2, "boolean", false) // Example for boolean
dlms.addAttr(1, "0.0.0.0.0.4", 2, "bit-string", [true, false, true, false]) // Example for bit-string as boolean array (default type)
dlms.addAttr(1, "0.0.0.0.0.4", 2, "bit-string", "1010") // Example for bit-string as string with the bit-string representation (alternative set value type, a get will always return it as boolean array)
dlms.addAttr(1, "0.0.0.0.0.5", 2, "double-long", 1) // Example for double-long
// Rest on number examples are omitted because they are similar to double-long
dlms.addAttr(1, "0.0.0.0.0.6", 2, "octet-string", [116, 101, 115, 116]) // Example for octet-string as byte array (default type)
dlms.addAttr(1, "0.0.0.0.0.6", 2, "octet-string", "test") // Example for octet-string as string (alternative set value type, a get will always return it as byte array)
dlms.addAttr(1, "0.0.0.0.0.7", 2, "visible-string", "test") // Example for visible-string
// utf8-string example is omitted because it's similar to visible-string
varresult=dlms.set() // Descriptive mode does not really matter, because return should always be null-data.
log(result[0]) // Expected output: {"result":"success","classId":1,"obisCode":"0.0.0.0.0.0","attrId":2,"type":"null-data","value":null}]
// All remaining results are similar, including returning null-data.
Executes a multi DLMS method (or action) request with the previously specified payload (addMethod(classId, obisCode, methodId, type, value)).
Kind: global function Returns: Array - Array of JSONs with responses. Each JSON will have six fields: result of the method operation, the requested classId, obisCode and methodId, type with the data type of the received value and the value received from the device. An optional error field may be returned for any error that happened during the method (for example an error decoding the optional return parameters).
Param
Type
Mandatory
Default
Description
descriptive
boolean
true
Descriptive mode returns complex data as Array of object containing type and value for each object, non descriptive mode flattens the returned array
Info
A method request may need and/or return whatever type and value it’s needed. Check Method description section of a COSEM IC specification.
// After connection has been established
dlms.addMethod(7, "1.0.99.1.0.255", 2) // Example for method needing null-data as parameter (default type and value)
dlms.addMethod(7, "1.0.99.1.0.254", 2, "unsigned", 0) // Example for method needing 0 (unsigned) as parameter
varresult=dlms.method()
log(result[0]) // Expected output: {"result":"success","classId":1,"obisCode":"1.0.99.1.0.255","methodId":2,"type":"null-data","value":null}]
log(result[1]) // Expected output: {"result":"success","classId":1,"obisCode":"1.0.99.1.0.254","methodId":2,"type":"boolean","value":true}
Sets the invocation counter of the ciphering to the next value of the received frame counter. This is used for devices that maintain two separate frame counters (one for transmit and one for receive). Usually the current Management Frame Counter - On-line is received in a CompactFrame notification and that value is the one that needs to be passed to this function for that device.
Kind: global function
Param
Type
Mandatory
Description
currentFrameCounter
number
The current frame counter sent by the device.
dlms.getInvocationCounter()
Returns the current invocation counter of the ciphering.
Kind: global function
Returns: Number - number (integer).
Extract the compact data serialized in a byte array according to the description given.
Kind: global function Returns: Object - Object containing result and/or error. On success, result contains the parsed compact data (either in descriptive (with type in each value) or non-descriptive (direct values) format depending on the descriptive parameter). On error, the error will contain the error description and result may be null or contain a best-effort decoding of the compact data that may be incorrect.
Param
Type
Mandatory
Default
Description
typeDescription
Object
Object with the description of the data. The attributes of the object will be different according to the data expected’
value
Array of number (or Object containing an octet-stringtype with its value)
Array of bytes with the compact data (for example the DLMS notification data or element received)
descriptive
boolean
true
Descriptive mode returns complex data as Array of object containing type and value for each object, non descriptive mode flattens the returned array
italianMode
boolean
false
Determines if the compact data decoding of arrays must be in italian mode or not (explicitArrayLengthInContent)
Simple data types just need to define the type as seen in data types.
array type description must define a subtype, which is a typeDescription, and a length when not using italianMode. italianMode (or explicitArrayLengthInContent) does not need the length because it’s encoded in the received data.
structure type description must define an array of items, which are each a typeDescription.
compact-array is not supported inside a compact data.
Here is an example of the function result in descriptive and non descriptive modes:
Extract the Date of a dateTime object or an octet-string. Some dateTime objects or octet-string may not contain a complete date and this method will return a date that may not be as accurate as you expect. You should check the dateTime object for unspecified value.
Kind: global function
Returns: Date
Param
Type
Mandatory
Default
Description
value
dateTime object or Array of number (or Object having typedate-time, date, time or octet-string with its value)
Extract the dateTime object of a Date or an octet-string. The resulting dateTime objects generated from a Date will use UTC time specifying a deviation of 0. If you need something else construct the dateTime object manually.
Kind: global function
Returns: Object
Param
Type
Mandatory
Default
Description
value
Date or Array of number (or Object having type of octet-string with its value)
The dlms_gas API provides a unified framework for managing Smart Gas meters from various manufacturers.
Manufacturer-based behavior
This API is designed to abstract behavior based on different manufacturers. Currently, the following behaviors have been specified:
pietro
watertech
honeywell
spark
There is a common or default behavior that serves as a basis for all manufacturers and that they overwrite when they need to. In addition, the API is designed to be extended and customized with new behaviors in the development of new CFs.
Connector Functions Implementation
Some use cases for how to implement a CF are explained below.
Standard connector function implementation with already defined behaviors
In this case, the call to dlms_gas.init() will initialize the initial parameters based on the device information and the configuration specified in the organization’s default entity. For more details on the behavior of dlms_gas.init(), see the dlms_gas.config properties and dlms_gas.init() function.
Next, when executing dlms_gas.decode(), the received Compact Frame will be decoded based on the standard specification of the already known compact frames (47, 48, 49, 51, 97). For more details on the behavior of dlms_gas.decode(), see the dlms_gas.decode section.
The next step is to execute the actions corresponding to the session (OpenGate operations, information requests, time change…). For more details on the actions performed, see the dlms_gas.pendingActions section.
Finally, dlms_gas.collect() is invoked, which is responsible for collecting data from the three entities involved in gas device communications: meter, network cell, and organizational unit. For more details on the behavior of dlms_gas.collect(), see the dlms_gas.collect section.
Configuration initialization
The following examples show some cases of how to vary the initial configuration.
The first case shows how to initialize the session using a configuration entity different from the organization’s. In this case, it starts from the idea that the entity representing the organization contains a suffix.
Another option is to modify the configuration once initialized. In this example, we see how the maxClockSkewAllowedSec and italianMode parameters are overwritten. The dlms_gas.config parameters are explained in the dlms_gas.config section.
It is also possible to force some of the actions to be performed even if the conditions for their normal behavior are not met. For example, the request for certain information is only made when a device connects for the first time to the platform in order to collect some of its initial configuration. However, it is possible to force this request every time it connects:
For all options, see the dlms_gas.actions section. Although initially with this configuration the order of the actions cannot be changed (see the dlms_gas.pendingActions section), it is possible to overwrite the order or even change the actions to be performed with more advanced programming that we will see later.
Customization of compact frames decoding
Currently, the following Compact Frames are considered: 47, 48, 49, 51, and 97.
Tip
CF 22 is also considered, but only as part of the FOTA process and it is not expected to be used as push notification compact frame.
The specification for decoding a CF is based on objects with the following specification:
The template property is a JSON following what is specified in the DLMS API documentation for the dlms.getCompactData function and the typeDescription parameter. The dlms_gas.decode function calls the getCompactData function with the specified template.
The initAndCollect method is responsible for loading the decoded values of the compact frame into the devCollection object. It is not mandatory to implement this method if it is not necessary to collect the decoded CF. This method can also be used to initialize other variables of interest for the session. For example, it is common to initialize the variables dlms_gas.recUnixTime, dlms_gas.recMetEventsCounter, and dlms_gas.recNonMetEventsCounter.
The dlms_gas.decode function internally uses the corresponding template specification object (see default properties) to decode the received template, but it is possible to pass a specific object as a parameter in which to specify a different specification.
In this example, we will see what the (made-up) decoding of a compact frame identified with number 32 could look like:
Another possibility is simply to change the decoding behavior of an already specified compact frame (47, 48, 49, 51, 97). In this case, there are several options to carry this out.
The first one is to create a completely new specification using the original template and defining the initAndCollect function:
constcustom48= {
"template":dlms_gas.default["48"].template,
"initAndCollect":function (data) {
logger.trace(`Collecting data from cf 48 with custom behavior`);
dlms_gas.devCollection.addDatapoint(...);
dlms_gas.devCollection.addDatapoint(...);
dlms_gas.devCollection.addDatapoint(...);
dlms_gas.devCollection.addDatapoint(...);
dlms_gas.devCollection.addDatapoint(...);
...
}
};
constdecodeResult=dlms_gas.decode(custom48);
Following this line, it is also possible to implement the initAndCollect method using the default behavior but extending or altering that behavior as much as possible. An example could be the following, where the default behavior is used but then additional actions are performed:
constcustom48= {
"template":dlms_gas.default["48"].template,
"initAndCollect":function (data) {
logger.trace(`Collecting data from cf 48 extending default behavior`);
dlms_gas.default["48"].initAndCollect(data);
// extra actions: for example, adjust received time.
dlms_gas.recUnixTime=dlms_gas.recUnixTime- (60*60*1000);
}
};
constdecodeResult=dlms_gas.decode(custom48);
Fully customized behaviors
The dlms_gas API includes objects responsible for encapsulating the functions and properties of different behaviors:
dlms_gas.default: contains all the properties and functions used to perform all actions.
dlms_gas.pietro: overwrites the functions and properties necessary to support the behavior of Pietro-type meters.
dlms_gas.honeywell: overwrites the functions and properties necessary to support the behavior of Honeywell-type meters.
dlms_gas.watertech: overwrites the functions and properties necessary to support the behavior of Watertech-type meters.
dlms_gas.spark: overwrites the functions and properties necessary to support the behavior of Spark-type meters.
Each behavior is specified at initilization time according to device manufacturer. If the device manufacturer is unknown, the dlms_gas.default behavior will be used.
Info
Check dlms_gas.behavior object’s properties and functions to understand how internally works behaviors management.
A simple way to test different behaviors is to overwrite the dlms_gas.behavior property. In the following example, the behavior is forced to be honeywell regardless of the manufacturer:
Once dlms_gas.behavior is specified as honeywell, the rest of the logic is executed with the Honeywell behavior.
Finally, it is possible to define or extend the complete behavior of the API. It may be that with the configurations or specifications seen so far, it is not possible to adapt to a particular case. In this case, it will be necessary to define a new behavior to be used in the rest of the connector function. This is done as follows:
constnewBehavior= {/*actions and properties*/};
dlms_gas.customBehavior(newBehavior);
dlms_gas.init();
dlms_gas.decode();
dlms_gas.pendingActions();
dlms_gas.collection();
When calling dlms_gas.customBehavior(newBehavior), the dlms_gas.behavior variable is initialized with the value 'custom' and the dlms_gas.custom object is initialized with the specified parameter. From here on, all other actions will be done based on what is specified in newBehavior. See dlms_gas.customBehavior for more information.
It is possible to specify “base” behavior for a custom one using the baseBehavior property. In this case, it will try to look for defined functions and properties in newBehavior and if not found, it will try to find them in baseBehavior. Finally if it is not found in baseBehavior it will try to find it in dlms_gas.default.
In next example, when looking for a function or property, it will follow next order to find it: newBehavior -> honeywell -> default.
Reviewing the decoding examples from the previous section, they could be incorporated using the concept of customBehavior.
The following example shows how to define a new compact frame specification, while maintaining the possibility for the connector function to support other compact frames because the decode method is not forced to use the specification passed as a parameter.
If you want to modify the behavior of initAndCollect of some known compact frame (47, 48, 49, 51, and 97), it is even simpler, as they internally have an overridable collection method, so you only need to define that method in the custom behavior.
The initAndCollect function of the predefined compact frames 47, 48, 49, 51, and 97 internally calls the corresponding initAndCollectCfxx method. Therefore, you only need to overwrite that method to alter its behavior.
The same concept applies to the dlms_gas.pendingActions and dlms_gas.collect functions. Internally, they call methods defined in default. Therefore, they can be easily modified. For example, the order in which actions are performed could be modified or even new actions could be added as in the following example, where the default actions are invoked first and then a custom action is invoked.
The previous example shows several important concepts:
The pendingActions function is overwritten for the new behavior, so when the main dlms_gas.pendingActions() method is invoked, the new custom function will be executed.
A new function customPendingAction is defined and will be executed when dlms_gas.pendingActions() is invoked.
To call to the default pendingActions function, it is done through the default object (dlms_gas.default.pendingActions();) since we want to execute all the default pending actions.
To invoke the new customPendingAction function, we do it through custom (dlms_gas.custom.customPendingAction();), which is the object containing the new behavior.
To learn about the existing functions and properties defined for the behaviors, see the specifications for each of them in the following sections.
dlms_gas api specification
The dlms_gas object is the main entry point for Smart Gas operations.
Current session timestamp in milliseconds. It is calculated in init method.
now_seconds
number
null
Current session timestamp in seconds. It is calculated in init method.
behaviorName
string
"default"
Active behavior name. It is calculated from device manufacturer in init method.
devCollection
Object
null
Main device collection object. It is initialized automatically with normal collection object in init method.
cellCollection
Object
null
Cellular network collection object. It is initialized automatically in init method.
uoCollection
Object
null
Organization collection object. It is initialized automatically in init method.
recUnixTime
number
null
Initiailized from received push notification.
EOGDTime
number
null
End of Gas Day Time. Initiailized from received push notification.
recMetEventsCounter
number
null
Metrological events counter. Initiailized from received push notification.
recNonMetEventsCounter
number
null
Non-metrological events counter. Initiailized from received push notification.
messagesCounter
number
0
Count of messages in current session.
numBlockErrorSession
number
0
Used to manage fota blocks transfer.
numBlockTransfSession
number
0
Used to manage fota blocks transfer.
restoreDefaultSchedule
boolean
false
Used to manage restoring the default schedule.
onlineMngFrmCntr
number
null
Online management frame counter. It is initialized from received push notification if available, otherwise is initialized from meter previously collected data.
messagesPerECL
number
null
Count of messages per ECL. It is initialized in init method from used behavior
dlms_gas functions
dlms_gas.init(confEntityName)
Initializes the DLMS Gas API context. It loads provisioned and collected data from meter entity and provisioned configuration data from configuratiion entity if it is found. By default it uses the meter’s organization name to find created configuration entity, if it was created with different name it must be passed as argument.
See dlms_gas.config for more information about configuration data.
Decodes received payload after identifying the template and collects data. Internally it calls to behavior specific decode method. See DLMS Manufacturer Behavior section below for full specification of that method.
Parameter
Type
Default
Description
customTemplate
Object
null
Template to force.
descriptive
boolean
false
Enable descriptive format.
Example:
varres=dlms_gas.decode();
dlms_gas.pendingActions()
Executes the full session flow. Internally it calls to behavior specific pendingActions method. See DLMS Manufacturer Behavior section below for full specification of that method.
By default it executes the following actions:
sync clock: check and sync device clock
retrieve initial data: used to retrieve data that is expected only once on device onboarding like firmware, apn configuration, etc. This data will be asked if it is not collected already.
retrieve push events configurations: like initial data retrieving but for push events configurations, it will be asked if it is not collected already.
periodic actions: used to retrieve data that must be retrieved periodically like statistics.
automatic actions: used to retrieve data depending on previously collected data and received data in push notification.
opengate operations: used to execute operations requested from opengate.
Previous actions execution can be controlled by dlms_gas.actions object properties. If the action is not enabled, it will not be executed. If it is forced it will ignore previous checks like statistics age or if initial data was already collected.
Examples:
//standard behavior
dlms_gas.pendingActions();
//skip statistics and force push events configuration retrieval
dlms_gas.actions.retrieveStatistics=false;
dlms_gas.actions.retrievePushEventsConfigurations=true;
dlms_gas.actions.forcePushConf=true;
dlms_gas.pendingActions();
dlms_gas.collect()
Used at the end of the script to send collected data for meter entity, cell enity and organization entity. Internally it calls to specific behavior collect method.
Example:
dlms_gas.collect();
Warning
It must used at the end of the Connector function to ensure that data collected during the execution is raised to opengate.
dlms_gas.customBehavior(behavior)
Changes the default behavior to a custom one. Internall it set dlms_gas.behaviorName property to "custom" and dlms_gas.custom property with the behavior provided as argument.
See DLMS Manufacturer Behavior section below for full specification of this method.
Property
Type
Default
Description
behavior
Object
{}
The behavior to use. If empty, is like using default behavior.
It executes specified standard dlms call (get, set, method). It will use the dType and uType for msRaw collection. It will return an object with the result from dlms standard function or with the error message. This method is just utility and is not intended to be used directly. Instead it must be used dlms_gas.get, dlms_gas.set, dlms_gas.method or dlms_gas.getByRange.
Internally this method will do several actions:
Call collectMsRaw before and after the dlms standard function call.
Increase dlms_gas.messagesCounter property before the dlms call.
Increase and collect onlineMngFrmCntr if the dlms call was successful.
At the end, cleans dlms.attrList and dlms.methodList arrays.
Property
Type
Default
Description
callType
string
Type of call to execute.
dType
number
mtype for messages sent to device.
uType
number
mtype for messages received from device.
Returned object will contain an object with the following properties:
error: Error message if some error occurs.
result: Return result from dlms standard function call. The result depends on the dlms method called (get, set, method).
dlms_gas.get(dType, uType)
It wrapes dlms.get calls adding extra behavior. dType and uType will be used for msRaw collection. The dlms.get response will be flattened in order to store the values in a single object. See examples below.
Property
Type
Default
Description
dType
number
mtype for messages sent to device.
uType
number
mtype for messages received from device.
Returned object will contain.
object with the following properties:
error: Error message if some error occurs.
[classid_obis_attrid]: Values for the requested attributes, if attribute request was successful.
If some attribute request fails, the error will be added to the error property.
{
"error":"...errors specification separated by ';'",
"1_0.0.94.39.58.255_2": ...returnedvaluefromdlms.get...
}
If the dlms.get request fails, the error property will be set and no attribute values will be returned.
{
"error":"... error message ..."}
dlms_gas.set(dType, uType)
It wrapes dlms.set calls adding extra behavior. dType and uType will be used for msRaw collection. The dlms.set response will be flattened in order to store the values in a single object. See examples below.
Property
Type
Default
Description
dType
number
mtype for messages sent to device.
uType
number
mtype for messages received from device.
Returned object will contain an object with the following properties:
error: Error message if some error occurs.
[classid_obis_attrid]: Results for the modified attributes.
If some attribute modification returns an error, the error will be added to the error property and the response will be “success” for the rest of the attributes.
If the dlms.set request fails, the error property will be set and no attribute values will be returned.
{
"error":"... error message ..."}
dlms_gas.method(dType, uType)
It wrapes dlms.method calls adding extra behavior. dType and uType will be used for msRaw collection. The dlms.method response will be flattened in order to store the values in a single object. See examples below.
Property
Type
Default
Description
dType
number
mtype for messages sent to device.
uType
number
mtype for messages received from device.
Returned object will contain.
object with the following properties:
error: Error message if some error occurs.
[classid_obis_attrid]: Results for the modified attributes, if attribute modification was successful.
If some method execution returns an error, the error will be added to the error property and the response will be “success” for the rest of the attributes.
It retrieves values by range using dlms.get with selective access. It retrieves all the values within the range, even if the device returns values in multiple pages. In case of any page retrieval fails, the error will be added to the error property and the response will be “success” for the rest of the pages.
Property
Type
Default
Description
classId
number
Class ID of the object.
obis
string
OBIS code.
attrId
number
Attribute ID.
accessSelector
number
Access selector (e.g., 1 for range).
paramClassID
number
Selector’s parameter Class ID.
paramObis
string
Selector’s parameter OBIS code.
paramAttrId
number
Selector’s parameter Attribute ID.
rangeType
string
Data type for range values (e.g., ‘double-long-unsigned’).
rangeFrom
number
Start of range.
rangeTo
number
End of range.
maxRangePerPage
number
Maximum range size. For event buffer ranges, the number of elements per page. For temporal ranges max period for page.
dType
number
mtype for messages sent to device.
uType
number
mtype for messages received from device.
It returns an object with the following properties:
There some objects to make easier the call to this method. Check the [Range retrieval configuration object section][#range-retrieval-configuration-object]
dlms_gas.config Object Properties
Following properties are loaded from device entity and from “configuration entity” when executing dlms_gas.init method. Some of them contain connected meter status and data and other contain configuration values from configuration entity.
Property
Type
Default
Description
orgName
string
null
Name of the organization that the meter belongs to.
confEntityName
string
null
Name of the entity that contins configuration parameters. See dlms_gas.init method to see how it is initialized
systemTitle
string
null
Meter System title.
cellPrefix
string
null
Prefix for the cell identification. It can be defined in the configuration entity.
apiKey
string
null
API Key for the platform. It must be defined in the configuration entity.
periodicDataAgeMillis
number
null
Maximum age of periodic data in milliseconds. It can be calculated from data in configuration entity.
maxSecondsWithoutCom
number
null
Maximum seconds without communication. It can be calculated from data in configuration entity.
cellPlanName
string
null
Name of the cell plan. It can be defined in the configuration entity.
maxClockSkewAllowedSec
number
null
Maximum difference in time for clock sync in seconds. It can be defined in the configuration entity.
maxClockCorrection
number
null
Maximum clock correction allowed. In this case it is filled for specified behavior
numBlockError
number
null
It contains meter’s FOTA process blocks number with transfer error.
numBlockTransf
number
null
It contains meter’s FOTA process successufully transferred blocks number.
badSessionsCounter
number
null
It contains meter’s FOTA process failed sessions counter
maxSessionsErrorsRate
number
null
It contains FOTA process maximum block errors rate allowed in a session. It can be defined in the configuration entity.
maxBadSessions
number
null
It contains FOTA process maximum bad sessions before FOTA abort. It can be defined in the configuration entity
manufacturer
string
null
Meter manufacturer.
italianMode
boolean
false
Enable Italian specific mode. Calculated from manufacturer.
deviceId
string
null
Meter identifier.
cellId
string
null
Cell identifier. It is filled from device collected cell identifier.
fotaBlockSize
number
null
FOTA block size for current meter. It is filled from collected data.
fotaEnabled
boolean
false
Indicates if the meter has FOTA enabled. It is filled from collected data.
fotaNumberOfBlocks
number
null
FOTA total number of blocks for current meter. It is calculated and collected at the begining of FOTA process
lastEventCounter
number
null
Counter for the last event. It is filled from meter’s previously collected data.
lastCommunication
number
null
Timestamp for the last communication. It is filled from meter’s previous last notification.
Next table indicates which datastreams are used to init these properties:
Property
Entity
Datastream
Default value
orgName
Meter
provision.administration.organization
null
manufacturer
Meter
provision.device.model
null
deviceId
Meter
provision.device.serialNumber
null
systemTitle
Meter
provision.administration.identifier
null
lastEventCounter
Meter
metCount
null
cellId
Meter
NBcellID
null
fotaBlockSize
Meter
fotaBlockSize
null
fotaNumberOfBlocks
Meter
firmwareTotalBlock
null
fotaEnabled
Meter
fotaEnabled
null
numBlockError
Meter
numBlockError
0
numBlockTransf
Meter
numBlockTransf
0
badSessionsCounter
Meter
badSessionsCounter
0
lastCommunication
Meter
mType
null
cellPrefix
Configuration
provision.ACR
orgName_
periodicDataAgeMillis
Configuration
provision.periodicDataAgeDays
1296000000 (15 days in milliseconds)
maxSecondsWithoutCom
Configuration
provision.maxDaysWithoutCom
259200 (3 days in seconds)
maxClockSkewAllowedSec
Configuration
provision.maxClockSkewAllowedSec
120
maxSessionsErrorsRate
Configuration
provision.maxSessionsErrorsRate
0.2
maxBadSessions
Configuration
provision.maxBadSessions
3
cellPlanName
Configuration
provision.cellPlanName
null
apiKey
Configuration
provision.administration.apiKey
null
Warning
Datastream used to initialize periodicDataAgeMillis and maxSecondsWithoutCom contains time in days and they are converted to milliseconds and seconds respectively.
It is possible to override this values after init calling to dlms_gas.init():
It contains the behavior chain used to resolve function or property call. It is initilized in dlms_gas.init
dlms_gas.behavior Object Functions
dlms_gas.behavior.getName(manufacturer)
Calculates and returns behavior name from manufacturer parameter (Not case session). This method is called from dlms_gas.init function only if dlms_gas.behaviorName is null.
Parameter
Type
Default
Description
manufacturer
string
null
Meter provisioned manufacturer name.
Next table explains current behaviors:
Behavior name
Manufacturer
pietro
If manufacturer contains ‘pietro’
honeywell
If manufacturer contains ‘honeywell’
spark
If manufacturer contains ‘spark’
watertech
If manufacturer contains ‘watertech’
default
If manufacturer is null or contains none of the above
Internall utility to calculate recursively the behavior chain. It is called from dlms_gas.init and it will return a Set with all behaviors to be checked when a function or property is called. It will take into account that specified behavior exists, if not it will return default behavior as last element of the chain. Something similiar will happen if there is a circular baseBehavior reference.
Parameter
Type
Default
Description
behaviorName
string
null
The name of the behavior to calculate the chain for. If null, it uses dlms_gas.behaviorName
visited
Set<string>
new Set()
A set of behavior names that have already been visited. Used to detect circular references
For example, if custom behavior is defined with pietro as baseBehavior:
constchain=dlms_gas.behavior.calculateChain('custom');
//it will return following chain: ['custom', 'pietro', 'default']
In case that custom behavior has invalid baseBehavior (it doesn’t exist), it will return following chain:
//having custom behavior with invalid baseBehavior, for example 'nonExistentBehavior'
constchain=dlms_gas.behavior.calculateChain('custom');
//it will return following chain: ['custom', 'default']
dlms_gas.behavior.property(propertyName)
Returns property value from behavior chain in order to call it. It will return the property value if exists in any behavior in the chain, if not it will return null.
Warning
This method should be used when specifying a custom behavior to ensure that the value returned is the best match for the current behavior chain.
Parameter
Type
Default
Description
propertyName
string
null
The name of the property to retrieve
dlms_gas.behavior.function(functionName)
Returns function from behavior chain in order to call it. It will return the function if exists in any behavior in the chain, if not it will empty function.
Warning
This method should be used when specifying a custom behavior to ensure that the function returned is the best match for the current behavior chain.
Parameter
Type
Default
Description
functionName
string
null
The name of the function to retrieve
Example of function calling using behavior management:
When overriding one function in custom behavior take care to not call itselsf using this method because it will throw exception due to infinite recursion
Example of bad use of function method and how to override correctly the function:
constcb= {
"retrieveStatistics":function(data){
dlms_gas.behavior.function('retrieveStatistics')(); //Bad practice: Infinite recursion
dlms_gas.default.retrieveStatistics(); //the correct way to do it
dlms_gas.honeywell.retrieveStatistics(); //the correct way to do it
//... extra code ...
}
}
dlms_gas.actions Object Properties
Control flags to enable or disable specific automated tasks.
Property
Type
Default
Description
setClock
boolean
true
Enable automated clock synchronization.
retrieveInitialData
`boolean"
true
Enable FW and static config retrieval.
retrievePushEventsConfigurations
boolean
`true"
Enable PUSH event config retrieval.
periodicActions
boolean
`true"
Enable statistics and diagnostic retrieval.
automaticActions
boolean
`true"
Enable logs and profile retrieval.
operations
boolean
`true"
Enable pending operation execution.
forceInitialData
boolean
false
Force retrieval of initial data.
forcePushConf
boolean
false
Force retrieval of push configuration.
forceStatistics
boolean
false
Force retrieval of statistics.
dlms_gas.default object Properties
Following properties are defined in dlms_gas.default and used when no manufacturer specific property is defined.
Property
Type
Value
Description
47
Object
Specification for Compact Frame 47. Includes template and initAndCollect. See decoding section.
48
Object
Specification for Compact Frame 48. Includes template and initAndCollect. See decoding section.
49
Object
Specification for Compact Frame 49. Includes template and initAndCollect. See decoding section.
51
Object
Specification for Compact Frame 51. Includes template and initAndCollect. See decoding section.
97
Object
Specification for Compact Frame 97. Includes template and initAndCollect. See decoding section.
22
Object
Specification for Compact Frame 22. Used in FOTA process.
cwport
number
1
Used to define dlms.cwport when initializing client
swport
number
1
Used to define dlms.swport when initializing client
hesSystemTitle
string
5341435341435341
Used to define dlms.hesSystemTitle when initializing client
Used to define dlms.conformance when initializing client
forceGetWithoutList
boolean
false
Used to define dlms.forceGetWithoutList when initializing client
forceSetWithoutList
boolean
false
Used to define dlms.forceSetWithoutList when initializing client
ignoreSystemTitleInCiphering
boolean
true
Used to define dlms.ignoreSystemTitleInCiphering when initializing client
onlineFramCounterRetryInc
number
5
Used to synchronize meters counter with collected frame counter.
onlineFramCounterRetryMax
number
3
Used to synchronize meters counter with collected frame counter.
maxClockCorrection
number
900
Default maximum clock correction allowed.
messagesPerECL
object
{ "0": 20, "1": 20, "2": 0 }
To limit fota blocks depending on ECL value.
isItalianModeManufacturer
boolean
true
Indicates if manufacturer follows Italian mode by default.
eclAttribute
number
3
Attribute ID for ECL retrieval.
errorIfWrongFotaBlockMapSize
boolean
true
Specify if fota operation must finish immediately with error if block map length retrieved in CF22 does not match with calculated number of blocks. If false, block map array will be resized to the calculated number of blocks.
statisticsRefDs
string
"MetBattRemUseTime"
Data stream reference for statistics retrieval.
supportedOps
Array
List of supported operations and their priority for execution. see operations spec.
Range retrieval configuration object
To simplify metrological events, non-metrological events, daily profiles and hourly profiles retrieval customization following object is used to define range selection parameters. It is used internally when calling getByRange function.
Property
Type
Description
classId
number
Data to be retrieved class id.
obis
string
Data to be retrieved obis.
attrId
number
Data to be retrieved attribute id.
accessSelector
number
Data to be retrieved attribute id.
paramClassID
number
Range parameter specification classID.
paramObis
string
Range parameter specification obis.
paramAttrId
number
Range parameter specification attrId.
rangeType
string
Range parameter specification rangeType.
maxRangePerPage
number
Used to specify pagination
Next are default configurations for specified retrievals:
supportedOps is used to specify Opengate operations execution. This property is an array of objects that contains operation name and function to be called. Operations will be executed following the order they are defined in the array.
Property
Type
Description
name
string
Opengate operation name.
funcName
string
Function to be called when specified operation is executed.
On one hand it is possible to specify custom array with custom functions. On the other hand it is possible just to override specified function (for example "valveManagement" function) just to customize specific operation behavior.
dlms_gas.default object Functions
dlms_gas.default.apnConfig(op)
Apn configuration operation logic. Configures the SIM APN and PLMN code on the device and processes the operation response.
Parameter
Type
Description
op
Object
Object returned by operation api.
dlms_gas.default.automaticActions()
Orchestrates automatic data retrieval functions. These functions retrieve data from the device depending on last collected data and new received data. Following functions are called in order:
Called at then end of pendingActions function. In this case (default behavior) it is empty.
dlms_gas.default.collect()
Sends the gathered datapoints for the device, cell, and organizational unit. It takes into account if dls_gas.devCollection, dls_gas.cellCollection or dls_gas.uoCollection are defined and they have identifier field is defined.
Warning
In the case of cellCollection it will check if cell entity exists and create if necessary.
Internal utility to collect raw messages. It adds msRaw datapoint to device, cell and organizational unit collections. Datapoint is composed by provided arguments.
Parameter
Type
Description
mType
number
Message type.
payload
string
Raw hex payload.
payloadSize
number
Payload size in bytes.
Examples:
// For received compact frame
dlms_gas.manufacturer.function("collectMsRaw")(contextParams.templateId, utils.bytes.toHexString(payload.value), payload.value.length);
// For dlms request sent to device
dlms_gas.manufacturer.function("collectMsRaw")(-22);
// For dlms response received from device
dlms_gas.manufacturer.function("collectMsRaw")(22);
Collects from received daily profiles with specified source and sourceInfo. Each element of array must be an object with the following fields:
Parameter
Type
Description
loadProfiles
Array
Array of daily profiles to collect.
source
string
Optional source identifier.
sourceInfo
object
Optional source information.
Each element of the array is an array with 4 elements:
Element Index
Type
Description
0
number
End of Gas day timestamp.
1
number
End of Gas day cumulative diagnostic
2
number
End of Gas day volume
3
number
End of Gas day volume under alarm.
dlms_gas.default.commsBatStatus(op)
Comms bat status retrieval operation logic. Retrieves battery status and communication statistics from the device and processes the operation response.
Parameter
Type
Description
op
Object
Object returned by operation api.
dlms_gas.default.configClient()
Initializes the dlms client parameters for sending requests to the device. This method is called from dlms_gas.init function.
dlms_gas.default.createCellIfNecessary()
Automatically provisions a new NBIoT Cell entity in Opengate if it doesn’t exist. It uses NBcellID as entity name.
dlms_gas.default.dateToDateOctet(date)
Converts a JavaScript Date object into DLMS octet-string format for date (5 bytes).
The main entry point for Compact Frame decoding. It identifies the correct template based on the templateId in the context (or it uses the provided customTemplate), performs the decoding, and triggers the collection logic.
If customTemplate is provided, it is used to decode the compact frame, otherwise predefined templates will be used.
Decodes a 6-byte array into a descriptive firmware version string including version numbers, build commit (hex), and date.
Returned version will be something like this: Version:${major}.${minor}.${patch};Build:0x${commitField.toString(16).toUpperCase().padStart(4, "0")};Fecha:${year}-${String(month).padStart(2, "0")}-${String(day).padStart(2, "0")}
Parameter
Type
Description
fwBytes
Array<number>
Array of 6 bytes representing the firmware version.
Returns an object with following fields:
Field
Type
Description
result
string
Decoded firmware version string. It is returned with next template:
Event DLMS schedule array generation logic. Generates the event schedule array for push events configuration. Adds the 4 events with corresponding periodicity and hour specification including disabled events.
Parameter
Type
Description
scheduleData
Object
Object with event’s day periodicty value and hour specification value from operation paraemeters.
Returns an array of objects with date and time octet. Example:
FOTA configuration operation logic. It manages specific scheduling, fota process initialization, blocks transfers by sessions and different process status management. It manage the operation status allong all the process.
Recalculates and returns blocks map according to the expectedNumberOfBlocks calculated at the FOTA operation beginig. If received array shorter than expected it is filled with false values. If it is larger, it is truncated to the expected number of blocks.
Parameter
Type
Description
imageTransferBlocksMap
Array
List of blocks retrieved in CF22
expectedNumberOfBlocks
number
Expected number of blocks calculated in FOTA process initialization.
Returns an array with the adjusted blocks status map.
Orchestrates the transmission of multiple firmware blocks in a single session, respecting the maximum messages allowed for the current ECL. It manages specially first and last block sent to update operation status. It also manages errors per session.
Verifies if the device is correctly configured for FOTA (valid block size and FOTA enabled). It updates operation status according to the validation.
Parameter
Type
Description
op
Object
Object returned by operation api.
dlms_gas.default.fotaCheckBadSessions()
Aborts the FOTA process if the number of consecutive bad sessions reaches the maximum allowed threshold and throws an error. It uses badSessionsCounter and maxBadSessions from dlms_gas.config.
dlms_gas.default.fotaCheckSessionBlocksErrors()
Just checks session errors rate and updates bad sessions counter.
dlms_gas.default.fotaContinueProcess(op)
Internal function used to continue FOTA operation from different sessions: it manage different process status, sends blocks and finalizes operation according to final status (including device default scheduling).
It updates operation status using op parameter.
Parameter
Type
Description
op
Object
Object returned by operation api.
dlms_gas.default.fotaImgActivate(op)
Function intended to invoke image activation DLMS method, but actually is empty function in default behavior. It can be implemented in specific behaviors.
Parameter
Type
Description
op
Object
Object returned by operation api.
dlms_gas.default.fotaImgVerify(op)
Function intended to invoke image verification DLMS method, but actually is empty function in default behavior. It can be implemented in specific behaviors.
Parameter
Type
Description
op
Object
Object returned by operation api.
dlms_gas.default.fotaImgTransferInitiate(op)
Invokes image transfer process initiation DLMS method and calculates the total number of blocks based on the firmware size and configured block size. It updates operation status.
Parameter
Type
Description
op
Object
Object returned by operation api.
dlms_gas.default.fotaRestoreDefaultSchedule(op)
Restores the default push strategy schedule after the FOTA process is finished or cancelled. It updates operation status.
Parameter
Type
Description
op
Object
Object returned by operation api.
dlms_gas.default.fotaScheduleForFota(op)
Temporary updates the push strategy schedule to a more aggressive frequency (every hour) during the FOTA process to speed up block transmission. It updates operation status.
Parameter
Type
Description
op
Object
Object returned by operation api.
dlms_gas.default.fotaStartProcess(op)
Internal function used to complete first steps of FOTA operation: device status validation, device special scheduling and fota process initialization in the meter.
It updates operation status using op parameter.
Parameter
Type
Description
op
Object
Object returned by operation api.
dlms_gas.default.fotaStateFromCf22(op)
It retrieves CF22 and updates session data to continue with FOTA proess.
Parameter
Type
Description
op
Object
Object returned by operation api.
It returns an object with transfer status and transfered blocks map.
Example:
Executed when the devices Compact Frame 22 retrieve status 0. Actually it calls fotaStatusUnknown function because this function is not supposed to be executed.
Parameter
Type
Description
op
Object
Object returned by operation api.
fotaState
object
FOTA status object with returned by fotaStateFromCf22 function.
dlms_gas.default.fotaStatus1(op, fotaState)
Executed when the devices Compact Frame 22 retrieve status 1. Try to send pending blocks or call image verification function.
Parameter
Type
Description
op
Object
Object returned by operation api.
fotaState
object
FOTA status object with returned by fotaStateFromCf22 function.
dlms_gas.default.fotaStatus2(op, fotaState)
Executed when the devices Compact Frame 22 retrieve status 2. In default behavior it does nothing.
Parameter
Type
Description
op
Object
Object returned by operation api.
fotaState
object
FOTA status object with returned by fotaStateFromCf22 function.
dlms_gas.default.fotaStatus3(op, fotaState)
Executed when the devices Compact Frame 22 retrieve status 3. It just calls to fotaImgActivate function.
Parameter
Type
Description
op
Object
Object returned by operation api.
fotaState
object
FOTA status object with returned by fotaStateFromCf22 function.
dlms_gas.default.fotaStatus4(op, fotaState)
Executed when the devices Compact Frame 22 retrieve status 4. It finishes the FOTA process with image verification error.
Parameter
Type
Description
op
Object
Object returned by operation api.
fotaState
object
FOTA status object with returned by fotaStateFromCf22 function.
dlms_gas.default.fotaStatus5(op, fotaState)
Executed when the devices Compact Frame 22 retrieve status 5. In default behavior it does nothing.
Parameter
Type
Description
op
Object
Object returned by operation api.
fotaState
object
FOTA status object with returned by fotaStateFromCf22 function.
dlms_gas.default.fotaStatus6(op, fotaState)
Executed when the devices Compact Frame 22 retrieve status 6. Asks to device for new firmware data, restores default scheduling and finlizes FOTA operation.
Parameter
Type
Description
op
Object
Object returned by operation api.
fotaState
object
FOTA status object with returned by fotaStateFromCf22 function.
dlms_gas.default.fotaStatus7(op, fotaState)
Executed when the devices Compact Frame 22 retrieve status 7. It finishes the FOTA process with image activation error.
Parameter
Type
Description
op
Object
Object returned by operation api.
fotaState
object
FOTA status object with returned by fotaStateFromCf22 function.
dlms_gas.default.fotaStatusUnknown(op, fotaState)
Executed when the devices Compact Frame 22 retrieve an unexpected status. In default behavior it just incresaes bad sessions counter.
Parameter
Type
Description
op
Object
Object returned by operation api.
fotaState
object
FOTA status object with returned by fotaStateFromCf22 function.
Search in passed operation object if the step is already completed. If checkInCurrentResponse is not specified, it will check only in steps completed in the operation. If checkInCurrentResponse is specified and it is true, it will check also in the steps added in current execution.
Parameter
Type
Description
op
Object
Object returned by operation api.
stepName
string
Name of the step to search.
checkInCurrentResponse
boolean
Whether to check in the current step response. Default value is false
dlms_gas.default.hourlyValues(op)
Horly values retrieval operation logic. Retrieves hourly incremental volume values from the device by range and processes the operation response.
Parameter
Type
Description
op
Object
Object returned by operation api.
dlms_gas.default.initAndCollectCf47(data)
Function called from dlms_gas.decode after decoding 47 compact frame from received notification. Initialize parameters to be used later and collects received fields.
Parameter
Type
Description
data
Object
Object with decoded compact frame data return from dlms.getCompactData() method.
dlms_gas.default.initAndCollectCf48(data)
Function called from dlms_gas.decode after decoding 48 compact frame from received notification. Initialize parameters to be used later and collects received fields.
Parameter
Type
Description
data
Object
Object with decoded compact frame data return from dlms.getCompactData() method.
dlms_gas.default.initAndCollectCf49(data)
Function called from dlms_gas.decode after decoding 49 compact frame from received notification. Initialize parameters to be used later and collects received fields.
Parameter
Type
Description
data
Object
Object with decoded compact frame data return from dlms.getCompactData() method.
dlms_gas.default.initAndCollectCf51(data)
Function called from dlms_gas.decode after decoding 51 compact frame from received notification. Initialize parameters to be used later and collects received fields.
Parameter
Type
Description
data
Object
Object with decoded compact frame data return from dlms.getCompactData() method.
dlms_gas.default.initAndCollectCf97(data)
Function called from dlms_gas.decode() after decoding 97 compact frame from received notification. Initialize parameters to be used later and collects received fields.
Parameter
Type
Description
data
Object
Object with decoded compact frame data return from dlms.getCompactData() method.
Warning
In this case, because received compact frame does not contain onlineFrameCounter it will try to recovery from the device using previously collected frame counter to initilialize client. See default.restoreOnlineFrameCounter() function
dlms_gas.default.operations()
Dispatches and executes active operations from the Opengate platform. Retrieves all alive operations for the device using Operations JS Api. It iterates through supportedOps and executes the process for any matching active operation.
dlms_gas.default.pendingActions()
The main entry point for a standard communication session. It orchestrates the actions to be performed in a session. It uses dlms_gas.actions object to determine which actions to perform.
Push configuration operation logic. Configures the push communication strategy (Compact Frame selection, platform address/port, and scheduling) for the four supported push events and process the operation response.
Parameter
Type
Description
op
Object
Object returned by operation api.
dlms_gas.default.requestNonMetroLogs(op)
Non metrological logs retrieval operation logic. Retrieves non-metrological event logs from the device by range and processes the operation response.
Parameter
Type
Description
op
Object
Object returned by operation api.
dlms_gas.default.resetDiagnostic(op)
Reset diagnostic operation logic. Resets the device’s diagnostic status flags by executing the corresponding DLMS method and process the operation response.
Parameter
Type
Description
op
Object
Object returned by operation api.
dlms_gas.default.restoreOnlineFrameCounter()
This method is used when received compact frame does not contain onlineFrameCounter and it is necessary to request it to the device in order to set correct values for next requests.
In uses previously collected online onlineFrameCounter to initilialize the client’s online frame counter and then it requests the device to retrieve its actual value. If the device does not response it tries again increasing used frames counter with the value specified in onlineFramCounterRetryInc property. It will try to request onlineFrameCounter to the device up to onlineFramCounterRetryMax times.
dlms_gas.default.retrieveDailyProfiles()
If the device does not communicate in last days it will ask for all missing daily profiles.
dlms_gas.default.retrieveInitialData(force)
Retrieves one-time device information. It will check if device.software datastream is not collected or force parameter is true. If so it will retrieve following data:
Metrological and Non-metrological Firmware versions.
APN configuration.
FOTA block configuration.
Parameter
Type
Description
force
boolean
If true, retrieves the data even if it was previously collected.
dlms_gas.default.retrieveMetrologicalEvents()
Retrieves missing metrological events from the device by range, starting from the last collected counter.
Retrieves configuration for all push events (1-4) configuration. It will check for each event if confCFx datastream is not collected or force parameter is true. If so it will retrieve push event configuration.
dlms_gas.default.retrieveStatistics(force)
Retrieves periodically communication statistics (Signal Power, RSRQ, RSRP, ECL, Battery remaining time….). It will check statisticsRefDs datastreams at value and if the data is too old (using periodicDataAgeMillis as reference).
Statistics retrieval can be forced using force parameter.
Parameter
Type
Description
force
boolean
If true, retrieves the data even if the data is not too old.
dlms_gas.default.rsrqFromRaw(raw)
Returns converted raw RSRQ to dB/dBm following standard dlms specfication.
dlms_gas.default.rsrpFromRaw(raw)
Returns converted raw RSRQ to dB/dBm following standard dlms specfication.
dlms_gas.default.setClock()
Checks drift and synchronizes device time.
dlms_gas.default.signalQualityFromRaw(raw)
Converts raw CSQ value to dBm following DLMS specification.
Parameter
Type
Description
raw
number
Raw signal quality value (0-31).
dlms_gas.default.strategy(b1, b0)
Decodes the communication strategy from two bits.
Parameter
Type
Description
b1
number
First bit.
b0
number
Second bit.
Return a string with composed strategy.
dlms_gas.default.tauInSecondsFromRaw(raw)
Decodes TAU timer to seconds following DLMS specification.
Event DLMS schedule array generation logic. Generates the event schedule array for push events configuration. Adds just the events not disabledwith corresponding periodicity and hour specification.
Parameter
Type
Description
scheduleData
Object
Object with event’s day periodicty value and hour specification value from operation paraemeters.
Returns an array of objects with date and time octet. Example:
Used to define dlms.conformance when initializing client
ignoreSystemTitleInCiphering
boolean
false
Used to define dlms.ignoreSystemTitleInCiphering when initializing client
dlms_gas.watertech object Functions
There are no specific properties for dlms_gas.watertech.
IEC102 JavaScript API
Connector functions IEC102 JS API guide
This API allows users to execute operations in the IEC102 client from a connector function.
iec102 Object
The iec object is the main object of the IEC102 client. It allows to connect
to communicate with devices using IEC102 protocol.
Establish connection
iec102.connect(registerType)
There is a connect method used to establish the connection with the device. When this method is called, it internally completes several actions:
Depending on the registerType parameter (IP, VPN, GSM, ATR), not only will the connection be made, but it may also be necessary to send some commands to establish the connection correctly. If not defined, the IP registration type will be used.
Once connection and registration is completed, connection status datapoints will be collected:
If ATR or GSM connection types are used, device.communicationModules[].subscription.mobile.presence.gsm with OK or NOK status.
In case of error, response status will be set to ERROR_PROCESSING and obtained error description will be added.
After connect method call, returned status must be checked to know if it is possible to continue. If not, response object should be returned.
Connection example:
iec102.ip="127.0.0.1";
iec102.port="3000";
iec102.linkAddress="1";
iec102.useMeasurePoint="1";
iec102.usePasswordAccess="1";
iec102.source="DEVICE_GSM_DATACALL";
iec102.sourcesInfo="Accessing Register through GSM data call to Device";
iec102.msisdn="123412341324";
iec102.userName="userName";
iec102.password="password";
iec102.portConfig="portConfig";
varconnectionStatus=iec102.connect("GSM");
if(!connectionStatus.connected) {
/* Connection not established.
At this point response object is fulfilled
with error code and description and skipped steps.
*/returnresponse;
}
In previous example, in case of error, there will be an implicit data collection with some data similar to this:
{
"datastreams": [
{
"id": "device.communicationModules[].subscription.mobile.presence.gsm",
"datapoints": [
{
"value": "NOK",
"at": 1698793200000,
"source": "DEVICE_GSM_DATACALL",
"sourceInfo": "Accessing Register through GSM data call to Device" }
]
}
]
}
And the response will be something similar to this:
{
"version": "8.0",
"trustedBoot": null,
"operation": {
"response": {
"id": "request_id",
"name": "GET_METER_INFO",
"deviceId": "device_id",
"resultCode": "ERROR_PROCESSING",
"resultDescription": "Called meter responded an ERROR",
"steps": [
{
"name": "timeRequest",
"result": "SKIPPED",
"description": "Unable to make a data call" }
],
"timestamp": 1698793200000 }
}
}
ASDUs definition and execution.
Once the connection is established, it is possible to execute the desired ASDUs. There are three ways to execute ASDUs:
Execute directly one ASDU.
Define one by one all iec102.asdus and then execute.
Define iec102.asdus to be executed from operation params and then execute.
ASDUs execution behavior specification
Each ASDU to be executed must be defined with some extra params to specify correctly its behavior. For this configuration a JSON object will be used:
Field
Type
Description
period
json
Depending on the ASDU, it is necessary to specify a PERIOD
sleepTimeBeforeExec
number
Wait time in milliseconds before ASDU is executed. If not defined or 0 value, no wait will be done.
step
json
Specify if related step must added and sent to response object. If not defined, no step will be added to response object
collection
json
Specify if related collection must added and sent to collection object. If not defined, no datastream will be added to collection object. If defined, default datastreams will be added.
period format:
Field
Type
Description
initial
number
Initial instant of the period in milliseconds
final
boolean
Final instant of the period in milliseconds
type
string
Period type. This type can be one of: previousQuarter, previousDay, previousWeek, previousMonth, custom, lastMinutes, lastHours, lastDays
There are several utils methods to calculate this period. See date utils
step format:
Field
Type
Description
name
string
Step’s name, if not defined default step will be added.
sent
boolean
If added step must be sent directly after ASDU execution
collection format:
Field
Type
Description
sent
boolean
If added datastreams must be sent directly after ASDU execution
If launched operation has specific parameters and steps, it will be possible to calculate ASDUs from these parameters using iec102.asdus.addFromParams().
Expected parameters are:
Booleans with following names to know which iec102.asdus to execute.
doTimeRequest
doParameters
doDeviceAndManufacturer
doLoadCurveAbsolut
doLoadCurveIncremental
doStoredPricing
doConfiguration
doCurrentPricing
dataPeriod.period[0].tipo that is a string with one of following values:
previousQuarter
previousDay
previousWeek
previousMonth
custom
If dataPeriod is custom, following parameters must be defined with dates ISO string:
dataPeriod.period[0].parameters[0].startDate
dataPeriod.period[0].parameters[0].finishDate
If operation params do not match previous content, no ASDUs will be calculated.
Taking previous operation parameters specification and taking entities datastreams status into account, ASDUS to be executed will be calculated based on some predefined conditions to avoid losing data and avoid unnecessary retries.
By default, login and logout ASDUs will be added to the list.
In this case, when executing all ASDUS, depending on executed ASDU, default steps could be sent directly and default collection could be done.
As explained, this method implements default behavior for ASDUs executions. If this behaviour is no valid, ASDUs to be executed must be defined manually. See ASDUs manual definition.
ASDUs manual definition:
iec102.asdus.add(name, execConfig)
It is possible to add manually using iec102.asdus.add method. This method expect following parameters to define ASDU execution correctly:
In this case, after executing this ASDU default step will be sent with execution result and default datastream will be collected:
// Step to be sent
{
"version": "8.0",
"trustedBoot": null,
"operation": {
"response": {
"steps": [
{
"name": "TIME_REQUEST",
"result": "SUCCESS",
"description": "Success." }
],
}
}
}
// Collection to be sent
{
"datastreams": [
"id":"device.clock",
"datapoints":[
{
"value": {
"date": "2023-11-01",
"time": "12:00:00",
"timezone": "GMT+1",
"dst": 0 },
"at": 1698793200000 }
]
]
}
Defined ASDUs execution
If ASDUs are not executed one by one, but they are added from operation params or defining them one by one, iec102.asdus.execute() method must be used to execute all defined ASDUs.
iec102.asdus.execute() method will execute all added ASDUs one by one, and depending ASDU specification related steps and collection will be send.
For example, first we define manually following ASDUs and then we do execution:
In this example, we will suppose that timeRequest ASDU finish correctly:
First, login ASDU will be executed. After execution, no step or collection will be sent.
Before executing timeRequest, 1000 milliseconds wait will be done.
After timeRequest execution, default TIME_REQUEST step will be added because no name has been specified and it will be sent because step.send has been defined to true. This is the step to be sent directly:
After timeRequest execution, following datastream will be added to collection object because collection is defined and it will be sent directly because collection.send is true. Datastream to be collected:
Before executing loadCurve, 1000 milliseconds wait will be done.
After loadCurve execution, instead of adding default STEP_NAME_LOAD_CURVE_ABSOLUT step, a step with name CUSTOM_LOAD_CURVE_STEP will be added because name parameter has been specified. In this case, the step will be added to response, but not sent send has been defined to false. This is the step added to response object:
Although, login, timeRequest, and loadCurve finished correctly, because logout ASDU failed, status is failed.
timeRequest, loadCurve ASDUs finished correctly and returns obtained data. Returned data depends on each ASDU.
Default steps for ASDUs
These are defined default steps for each ASDU:
ASDU
STEP
login
logout
timeRequest
TIME_REQUEST
configuration
CONFIGURATION
parameters
PARAMETERS
dayLightSavingTime
loadCurve
LOAD_CURVE_ABSOLUT
loadCurveQuarter
LOAD_CURVE_ABSOLUT
loadCurveIncremental
LOAD_CURVE_INCREMENTAL
loadCurveIncrementalQuarter
LOAD_CURVE_INCREMENTAL
deviceManufacturer
DEVICE_AND_MANUFACTURER
currentPricing
CURRENT_PRICING
storedPricing
STORED_PRICING
Default datastreams for ASDUs
ASDU
Field
Datastream
login
logout
timeRequest
DateTime
device.clock
configuration
ManufacturerCode
manufacturerCode
configuration
Model
device.model
configuration
Firmware
device.software
configuration
SerialNumber
device.serialNumber
configuration
StandardDate
protocolRevDate
configuration
Datetime
protocolDate
configuration
BatteryPercentage
device.powersupply
configuration
SerialPort1Baudrate
serialPort1Speed
configuration
SerialPort1Codification
serialPort1Conf
configuration
SerialPort1Mode
serialPort1ShipMode
configuration
SerialPort1StartingAsciiString
serialPort1AsciiString
configuration
SerialPort2Baudrate
serialPort2Speed
configuration
SerialPort2Codification
serialPort2Conf
configuration
VoltagePrimary
voltPrim
configuration
VoltageSecondary
voltSec
configuration
IntensityPrimary
intenPrim
configuration
IntensitySecondary
intenSec
configuration
IntegrationPeriod1
IntPerLoadCurve1
configuration
IntegrationPeriod2
IntPerLoadCurve2
configuration
IntegrationPeriod3
IntPerLoadCurve3
configuration
ContractType
contractType
configuration
Contract1
contractState
parameters
LinkAddressCollected
elinkAddress
parameters
MeasurePointsQuantity
measurePointsQuantity
parameters
MeasurePoint
measurePoint
parameters
AccessPassword
accessPass
parameters
IntegrationPeriod
intPeriod
parameters
RegistryDepth
regDepth
deviceManufacturer
ManufacturerCode
manufacturerCode
deviceManufacturer
DeviceId
contIdentifier
dayLightSavingTime
ToDaylightSavingTime
dayLightSavingTime
ToStandardTime
loadCurve
Timestamp
loadCurve
ImportedActive
eImpActTotDia
loadCurve
ExportedActive
eExpActTotDia
loadCurve
Quadrant1Reactive
eImpReQ1TotDia
loadCurve
Quadrant2Reactive
eImpReQ2TotDia
loadCurve
Quadrant3Reactive
eImpReQ3TotDia
loadCurve
Quadrant4Reactive
eImpReQ4TotDia
loadCurveQuarter
frames[].Timestamp
loadCurveQuarter
frames[].ImportedActive
eImpActTot
loadCurveQuarter
frames[].ExportedActive
eExpActTot
loadCurveQuarter
frames[].Quadrant1Reactive
eImpReQ1Tot
loadCurveQuarter
frames[].Quadrant2Reactive
eImpReQ2Tot
loadCurveQuarter
frames[].Quadrant3Reactive
eImpReQ3Tot
loadCurveQuarter
frames[].Quadrant4Reactive
eImpReQ4Tot
loadCurveIncremental
frames[].Timestamp
loadCurveIncremental
frames[].ImportedActive
eImpActIncDia
loadCurveIncremental
frames[].ExportedActive
eExpActIncDia
loadCurveIncremental
frames[].Quadrant1Reactive
eImpReQ1IncDia
loadCurveIncremental
frames[].Quadrant2Reactive
eImpReQ2IncDia
loadCurveIncremental
frames[].Quadrant3Reactive
eImpReQ3IncDia
loadCurveIncremental
frames[].Quadrant4Reactive
eImpReQ4IncDia
loadCurveIncrementalQuarter
frames[].Timestamp
loadCurveIncrementalQuarter
frames[].ImportedActive
eImpActInc
loadCurveIncrementalQuarter
frames[].ExportedActive
eExpActInc
loadCurveIncrementalQuarter
frames[].Quadrant1Reactive
eImpReQ1Inc
loadCurveIncrementalQuarter
frames[].Quadrant2Reactive
eImpReQ2Inc
loadCurveIncrementalQuarter
frames[].Quadrant3Reactive
eImpReQ3Inc
loadCurveIncrementalQuarter
frames[].Quadrant4Reactive
eImpReQ4Inc
currentPricing
frames[].Timestamp
currentPricing
frames[].RateIndex
({ri})
currentPricing
frames[].Memory
({m})
currentPricing
frames[].AbsoluteActive
eRate{ri}ActTot{m}
currentPricing
frames[].IncrementalActive
eRate{ri}ActInc{m}
currentPricing
frames[].AbsoluteInductiveReactive
eRate{ri}ReIndTot{m}
currentPricing
frames[].IncrementalInductiveReactive
eRate{ri}ReIndInc{m}
currentPricing
frames[].AbsoluteCapacitiveReactive
eRate{ri}ReCapTot{m}
currentPricing
frames[].IncrementalCapacitiveReactive
eRate{ri}ReCapInc{m}
currentPricing
frames[].MaximumPower
eRate{ri}PowerMaxVal{m}
currentPricing
frames[].ExcessPower
eRate{ri}PowerExVal{m}
currentPricing
frames[].InitPeriodDateAsDatetime
eRate{ri}PricInitPeri{m}
currentPricing
frames[].EndPeriodDateAsDatetime
eRate{ri}PricEndPeri{m}
storedPricing
frames[].Timestamp
storedPricing
frames[].RateIndex
({ri})
storedPricing
frames[].Memory
({m})
storedPricing
frames[].AbsoluteActive
eRate{ri}ActTot{m}
storedPricing
frames[].IncrementalActive
eRate{ri}ActInc{m}
storedPricing
frames[].AbsoluteInductiveReactive
eRate{ri}ReIndTot{m}
storedPricing
frames[].IncrementalInductiveReactive
eRate{ri}ReIndInc{m}
storedPricing
frames[].AbsoluteCapacitiveReactive
eRate{ri}ReCapTot{m}
storedPricing
frames[].IncrementalCapacitiveReactive
eRate{ri}ReCapInc{m}
storedPricing
frames[].MaximumPower
eRate{ri}PowerMaxVal{m}
storedPricing
frames[].ExcessPower
eRate{ri}PowerExVal{m}
storedPricing
frames[].InitPeriodDateAsDatetime
eRate{ri}PricInitPeri{m}
storedPricing
frames[].EndPeriodDateAsDatetime
eRate{ri}PricEndPeri{m}
iec102 Object Properties
Property
Type
Default
Description
ip
string
IP address to connect.
port
number
Port to connect
isTls
boolean
false
Specifies if secure protocol must be used
retries
number
5
Number of retries.
timeout
number
30000
Timeout in milliseconds.
linkAddress
number
Mandatory parameter used as part of IEC102 protocol
useMeasurePoint
number
Mandatory parameter used as part of IEC102 protocol
usePasswordAccess
number
Mandatory parameter used as part of IEC102 protocol
msisdn
string
Parameter used when connection is done with a data call through some caller
userName
string
Parameter used when connection is done with a data call through some caller
password
string
Parameter used when connection is done with a data call through some caller
referenceTime
number
Current
It will be used as reference time for period calculation and as datapoints ‘at’ value
readingState
string
Current
Internally used parameter to keep ASDUs execution status
portConfig
string
Parameter used when connection is done with a data call through some caller
source
string
It will be used as datapoints ‘source’ value
sourcesInfo
string
It will be used as datapoints ‘sourcesInfo’ value
manufacturerCodeName
object
Manufacturer code->name map
asdus.asdusToExec
array
Internal array with the list of ASDUs to be executed. It must be initialized before connecting
iec102 Object Methods
iec102.connect (registerType, waitFor) ⇒ Object
Establish connection with specified device. Before using this method connection parameters such as ip, port, timeout, etc. must be specified (some of them can have default values).
Establish connection with specified device trying different ports. Before using this method connection parameters such as ip, timeout, etc. must be specified (some of them can have default values). In this case, a list of ports will be passed as parameters. For each port of the list, the connect method will be called until the connection is established correctly.
Calculates all ASDUs to be executed from operations parameters adding them to asdus.asdusToExec array. This method only works if parameters object has specific properties.
This JavaScript code provides predefined functions to execute SNMP requests from the connector function. They are explained below.
JS SNMP API
For REQUEST Connector Functions we will use the functions get and set described below. You have an object, named snmp, with those functions described. You must use snmp.get or snmp.set.
If you want to collect data after executing any of these function you can hand it over to a COLLECTION connector function with cf.collection, setting various oids in the south criteria as you can see in the next example:
cf.collection("snmps://<oidValue>", result.data);
snmp.addOid()
Adds an OID to the list of OIDs to be retrieved/setted.
Param
Type
Description
oid
string
OID to add.
type
string
Type of the value.
value
string
Value to set.
Example of use:
// Example for get
snmp.addOid('1.3.6.1.4.1.2007.4.1.2.2.2.18.3.2.1.10.3');
snmp.get()
//Example for set
snmp.addOid('1.0.1.4.5.123456.1.6', 'INTEGER', '3');
snmp.set()
snmp.get()
Executes a multi SNMP get attribute request with specified payload. You must have previously given value to the properties snmp.ip, snmp.port (161 by default), snmp.community (in case of snmp version 1), snmp.version (3 by default), snmp.retries (3 by default), snmp.timeout (5000 by default) and security info in case of snmpv3 version (snmp.securityName, snmp.authentication, snmp.privacy, snmp.authPassphrase and snmp.privPassphrase).
In addition, you have to add the oids you want to get using the snmp.addOid function with the oid string as many times as you want.
Kind: global function Returns: String - A JSON with response. This JSON will have two fields: ‘result’ of the get operation and ‘data’ with response of the device.
SNMP Field
Type
Description
ip
string
IP address of the device you want to connect to.
port
number
Port of the device you want to connect to. By default is 161.
oids
Array
Array of strings with the list of wanted oids. To add items to the list, you must call the function ‘snmp.addOid’ with the oid as parameter as many times as you want oids.
community
string
The community octet string. This is a convenience method to set the security name for community based SNMP (v1 and v2c).
securityName
string
The security name of the user (typically the user name).
authentication
string
The authentication protocol ID to be associated with this user. If set to null, this user only supports unauthenticated messages.
authPassphrase
string
The authentication passphrase. If not null, authentication must also be not null.
privacy
string
The privacy protocol ID to be associated with this user. If set to null, this user only supports unencrypted messages.
privPassphrase
string
The privacy passphrase. If not null, privacy must also be not null.
version
number
Version number of the SNMP. By default is 3.
retries
number
Number of retries for the request. By default is 3.
timeout
number
Timeout of the request in millis. By default is 5000.
Here is an example of use for the snmp.addOid function for snmp.get:
Executes a multi SNMP set attribute request with specified payload. You must have previously given value to the properties snmp.ip, snmp.port (161 by default), snmp.community (in case of snmp version 1), snmp.version (3 by default), snmp.retries (3 by default), snmp.timeout (5000 by default) and security info in case of snmpv3 version (snmp.securityName, snmp.authentication, snmp.privacy, snmp.authPassphrase and snmp.privPassphrase).
In addition, you have to add the oids you want to set using the snmp.addOid function with the oid string, the type of the value and the value you want to set to as many times as you want.
Kind: global function Returns: String - A JSON with response. This JSON will have two fields: ‘result’ of the get operation and ‘data’ with response of the device. This ‘data’ contains pairs of (oid, value).
SNMP Field
Type
Description
ip
string
IP address of the device you want to connect to.
port
number
Port of the device you want to connect to. By default is 161.
oids
Array
Array of items with the list of oids you want to set. To add items to the list, you must call the function ‘snmp.addOid’ with the oid you want to set, the type of the value for that oid and the value you want to set as parameters as many times as you want oids.
community
string
The community octet string. This is a convenience method to set the security name for community based SNMP (v1 and v2c).
securityName
string
The security name of the user (typically the user name).
authentication
string
The authentication protocol ID to be associated with this user. If set to null, this user only supports unauthenticated messages.
authPassphrase
string
The authentication passphrase. If not null, authentication must also be not null.
privacy
string
The privacy protocol ID to be associated with this user. If set to null, this user only supports unencrypted messages.
privPassphrase
string
The privacy passphrase. If not null, privacy must also be not null.
version
number
Version number of the SNMP. By default is 3.
retries
number
Number of retries for the request. By default is 3.
timeout
number
Timeout of the request in millis. By default is 5000.
Here is an example of use for the snmp.addOid function for snmp.set:
This API allows users to execute operations in the SSH client from a connector function.
Ssh Object
The ssh object is the main object of the SSH client. It allows to connect
to an SSH server, send commands and receive responses and disconnect from the
SSH server.
Ssh Object Properties
Property
Type
Default
Description
ip
string
IP address of the SSH server.
port
number
22
Port of the SSH server.
retries
number
3
Number of retries.
timeout
number
5000
Timeout in milliseconds.
user
string
SSH user.
password
string
SSH password.
identity
string
Rsa key content.
Ssh Object Methods
ssh.connect(waitFor)
Establish a connection with the SSH server.
Property
Type
Default
Description
waitFor
List
Strings to wait for in the response.
Connects to the SSH server using the properties of the ssh object:
ip: IP address of the SSH server.
port: Port of the SSH server.
retries: Number of retries.
timeout: Timeout in milliseconds.
user: SSH user.
password: SSH password.
identity: Rsa key content.
Returns an object with the following properties:
result: true if the connection was successful, false otherwise.
message: Empty if the connection was successful, error message otherwise.
Example of use:
ssh.ip="[IP_ADDRESS]";
ssh.port=22;
ssh.user="sshuser";
ssh.password="password";
// this example shows how to connect to an SSH server and wait for the "Connection established" string.
varconnectResult=ssh.connect(["Connection established"]);
if (connectResult.result) {
// Connection was successful
} else {
// Connection failed
}
ssh.send(command, pattern, waitFor)
Sends a command to the SSH server and waits for the response.
Parameter
Type
Description
command
string
Command to send to the SSH server.
pattern
string
Pattern to extract response from sent command.
waitFor
List
Strings to wait for in the response.
retries: Number of retries.
timeout: Timeout in milliseconds.
Returns the response of the SSH server in string format.
Example of use:
// this example shows how to send a command to an SSH server and wait for the "/home/sshuser" string.
varsendResult=ssh.send("ls -la", "*", ["/home/sshuser"]);
ssh.disconnect()
Disconnects from the SSH server.
Example of use:
ssh.disconnect();
Telnet Javascript API
Connector functions Telnet JS API guide
This API allows users to execute operations in the Telnet connector from a connector function.
Telnet Object
The Telnet object is the main object of the Telnet connector. It allows to connect
to a Telnet server, send commands and receive responses, and disconnect from the
Telnet server.
Telnet Object Properties
Property
Type
Default
Description
ip
string
IP address of the Telnet server.
port
number
23
Port of the Telnet server.
retries
number
3
Number of retries.
timeout
number
5000
Timeout in milliseconds.
Telnet Object Methods
telnet.connect (waitFor)
Connects to the Telnet server using the properties of the Telnet object and the specified parameters.
Parameter
Type
Description
waitFor
string
String to wait for in the response.
ip: IP address of the Telnet server.
port: Port of the Telnet server.
retries: Number of retries.
timeout: Timeout in milliseconds.
Returns an object with the following properties:
result: true if the connection was successful, false otherwise.
message: Empty if the connection was successful, error message otherwise.
Example of use:
telnet.ip="[IP_ADDRESS]";
telnet.port=23;
varconnectResult=telnet.connect(">");
if (connectResult.result) {
// Connection was successful
} else {
// Connection failed
}
telnet.send (command, pattern, waitFor)
Sends a command to the Telnet server and waits for the response with the specified parameters:
Parameter
Type
Description
command
string
Command to send to the Telnet server.
pattern
string
String to pattern match in the response. In RegExp format.
waitFor
string
String to wait for in the response. If not specified, the default is >.
retries: Number of retries.
timeout: Timeout in milliseconds.
Returns the response of the Telnet server in an array of strings.
Example of use:
varsendResult=telnet.send("ls -la", "*", ">");
telnet.disconnect ()
Disconnects from the Telnet server.
Example of use:
telnet.disconnect();
ICMP JavaScript API
Introduction
This API allows users to send PING operations to an IP address.
Icmp Object
The icmp object is the main object of the ICMP client. It allows sending a PING operation to an IP address, and receiving the response (in synchronous or asynchronous mode).
Icmp Object Properties
Property
Type
Default
Description
ip
string
(*)
IP address to send PING.
retries
number
5
Number of PING delivery retries.
timeout
number
2500
Timeout in milliseconds of retry.
async
boolean
true
Decide if the request is asynchronous (true) or synchronous (false).
(*) By default, select the IP of the device or the provisioned subscription.
Icmp Object Methods
icmp.send()
Send PING using the properties of the icmp object:
ip: IP address to send PING.
retries: Number of PING delivery retries.
timeout: Timeout in milliseconds of retry.
async: Decide if the request is asynchronous or synchronous.
RETURN: If the async property is false, then returns an object with the following properties:
result: String. The value will be “OK” when the result is successfull or “NOK” when the result of the request had error, for example, timeout.
deviceId: String. Entity receiving the ping.
datastreams: An array with the information of the request result.
The Connector Functions Catalog API enables users to perform CRUD operations on the Connector Functions Catalog, which comprises a default set of Connector Functions.
A new field, cloneable, has been introduced in this Connector Functions Catalog to indicate whether a Connector Function can be replicated for a specific organization and channel.
Comprehensive API actions
Permissions
CREATE, UPDATE, DELETE: users with root profile.
GET and GET List: users with admin, admin_domain, super_admin_domain or root profiles.
API specification
Artificial Intelligence
Limited access
This feature is only available to root and super_admin_domain profiles. Ask your administrator for proper user role profiling.
What OpenGate AI does
OpenGate can train a machine-learning model on the data it already collects, package the trained model as an
inference service and wire that service into the rules engine — so that every new reading is scored the moment
it arrives, and an anomaly becomes an alarm without anyone writing a line of Python.
You do not bring a model. You pick a training plan from the platform catalogue — a ready-made recipe for a
concrete problem, such as anomalous data sessions on a mobile APN or defective parts in an image — point it at
your data, and OpenGate takes it from there: it exports the data, runs the training, versions the result, builds
an inference container and, if you ask it to, creates the rule that calls it.
flowchart LR
D["Your data<br>time series or files"]:::ext --> T["<b>Trainer</b><br>runs a training plan"]
T --> M["Model version"]
M --> I["<b>Inferencer</b><br>deployed inference service"]
R["<b>Rule</b><br>on new readings"] --> I
I --> R
R --> A["Datastreams<br>and alarms"]:::ext
classDef ext fill:#e9edfa,stroke:#486ac9,color:#101010
Four things carry the whole feature:
Concept
What it is
Where it is documented
Training plan
A recipe for one kind of problem: the algorithm, the data it needs, the configuration it accepts and the container image that runs it. Curated by the platform.
The ordinary OpenGate rule that sends each new reading to the inferencer and turns the answer into datastreams and alarms. Created for you by the training plan.
Two platform services do the plumbing and are worth knowing about because they are reachable on their own:
the scheduler, which runs anything on a cron expression or an interval — REST requests, container
images, pipelines of both — and is what actually launches a training; and the file connector,
which gives each organization a file space where training files and images live.
Two ways to use it
From the web console. The Artificial Intelligence section of the OpenGate console walks you through
choosing a plan, pointing it at a time series or an uploaded file, naming the model and deciding whether it
retrains. When the training finishes, the same screen shows the inferencer, its versions and their metrics, and
lets you switch versions on and off. See The web console.
From the REST API. Everything the console does is a call to one of five services under /ai, /scheduler
and /fileConnector on the platform host. The pages of this section document each of them, with its OpenAPI
specification at the bottom. Read How it works first: it follows one training from the POST
that schedules it to the alarm that a rule raises, and names every moving part along the way.
Defective items in photographs, with a heat map of where the defect is
Two folders of images: correct and incorrect
Every plan on the platform follows the same contract, so what you learn about scheduling, versions and rules
for one applies to all of them. Building a new one is the platform team’s job; Building training plans
explains what that involves.
Trainings and inferencers consume platform resources
A training is a container job that runs until it finishes or hits its timeout, and an active inferencer is a
service that stays up and is called on every new reading its rule matches. Both are billed as platform usage.
An inferencer can be left configured but inactive, and a trainer can be created without a retraining schedule;
both are deliberate choices you make when you create them.
Everything in this section is a step of the loop below. The names in bold are the API resources you will meet
on the following pages.
sequenceDiagram
participant U as You
participant TA as Trainers API
participant SC as Scheduler
participant J as Training job
participant IA as Inferencers API
participant RU as Rules engine
U->>TA: POST trainer (plan, data source, schedule)
TA->>SC: schedule image execution or pipeline
SC-->>J: at the scheduled time: export data, run the plan's image
J->>J: train, evaluate, register the model version
J->>J: build the inference image and push it
J->>IA: create inferencer, or add the new version to it
J->>RU: create the rule (first time only)
J-->>SC: callback: OK
U->>IA: activate a version
IA->>RU: deploy the service, activate the rule
RU->>IA: on each matching reading: POST prediction request
IA-->>RU: prediction
RU->>RU: collect datastreams, open or close alarms
1. You create a trainer
A trainer is a request to run a training plan on a data source, optionally on a schedule
(POST /ai/organization/{organizationId}/trainer, see Trainers). You give it:
the plan to run, by its identifier from the catalogue;
the model name — lowercase letters, digits and hyphens. It becomes the name of the model, of the
inferencer, of the rule and of the scheduler entry, so choose it with care: it cannot be changed later and
only one trainer per model name can exist in an organization;
the plan’s configuration — the fields the plan declares, such as the APN to learn;
a data source — a file in your organization’s file space, or a time series to export;
a schedule, if the model has to be retrained periodically; and
an execution timeout for the training job.
The Trainers API checks the plan exists, stores a small Kubernetes secret with your API key and organization so
the job can call the platform back on your behalf, and hands the work to the scheduler.
2. The scheduler runs it
The scheduler is a general-purpose service: it runs REST requests, container images and pipelines
of both on a cron expression or an interval, and keeps a history of every execution. A trainer becomes one of
two things there, both named after the model:
Data source
What is scheduled
Steps
A file (source.path)
An image execution
Run the plan’s container with dataSourcePath=/data/<your path>
A time series (source.timeserie)
A pipeline
1. POST the time series Parquet export, writing <model>-<plan>-<timeseries>.parquet into your file space 2. Run the plan’s container with dataSourcePath pointing at that file
Inside the job your organization’s file space is mounted at /data, which is why every path the plan sees
starts there. The job also receives the plan’s configuration as environment variables, the platform-wide AI
settings from a shared secret, and a callbackUri it must call when it finishes. The training job is a
Kubernetes Job with no retries: it either completes, fails, or is killed when the timeout expires.
Generate the run profile — experiment <organization>-<model>, registered model
<organization>-<model>-<algorithm>, data location from dataSourcePath.
Run the recipe — ingest, split, transform, train, evaluate, register. Each run is tracked in the
platform’s MLflow, which is where model versions come from: the first successful training registers
version 1, a retraining registers version 2, and so on. If the data does not meet the plan’s minimum, the
run fails here and says so.
Publish the inference — download the latest run’s model and metrics, wrap them in the framework’s
FastAPI inference server, build a container image named <organization>-<model>:v<version> and push it to the
platform registry. Then, through the Inferencers API:
if an inferencer named after the model does not exist yet, create it with that image as its only
version — and, unless the trainer was created with createRule: false, first create the plan’s rule in
default_channel and link it to the inferencer;
if it already exists, add the image as a new version.
Whatever happens, the job reports back to the scheduler with OK, ERROR or — if it was killed by the timeout —
TIMEOUT, and a description. That report is what you see as the execution’s history.
4. You activate a version
A freshly created inferencer has one version and nothing deployed. Activation is your call
(PUT .../inferencer/{inferencerId}/activation?image=<version>&active=true), because it is the moment the
platform starts spending resources on your behalf:
the Inferencers API deploys the image as a service reachable inside the platform at
https://<organization>-<model>:8443/api/predict — lowercase, underscores turned into hyphens;
it waits for the container to be running;
it sets the linked rules to active: true.
You can activate a specific version, or latest: then every new version a retraining produces replaces the
running one automatically, and the rule keeps calling the same address. Deactivating (active=false) undeploys
the service and deactivates the rules; the versions stay, ready to be activated again.
5. The rule scores every reading
The rule a plan creates is an ordinary ADVANCED rule: it
triggers on the datastream the plan cares about, builds the request the model expects, calls the inferencer with
http.client, and translates the answer into your data model — typically a boolean datastream saying whether the
reading was anomalous, a score, an explanation, and an alarm that opens when the entity turns anomalous and
closes when it returns to normal. The rule is created inactive and is switched on and off together with the
inferencer, so a deactivated model never leaves a rule calling a service that is not there.
The rule is yours: you can read it, tune its thresholds or change what it collects in the rules editor like any
other. Deleting the inferencer deletes its rules too, unless another inferencer still uses them.
Naming, in one table
Once you know the organization name and the model name, you can predict every other name the feature creates:
Thing
Name
Example for organization acme, model radius-anomalies
Scheduler entry (image execution or pipeline)
<model>
radius-anomalies
Exported time series file
<model>-<plan id>-<time series id>.parquet
radius-anomalies-…-….parquet
MLflow experiment
<organization>-<model>
acme-radius-anomalies
Registered model
<organization>-<model>-<algorithm>
acme-radius-anomalies-isolation-forest
Inference image
<organization>-<model>:v<version>
acme-radius-anomalies:v3
Inferencer
<model>
radius-anomalies
Deployed service
<organization>-<model> (lowercase, _ → -)
acme-radius-anomalies
Inferencer endpoint
https://<service>:8443/api/predict
https://acme-radius-anomalies:8443/api/predict
Rule
<model>, in default_channel
radius-anomalies
Retraining
A trainer with a schedule.expression runs every time the expression fires, and each run adds a new version
to the same inferencer. The scheduler understands standard five-field cron and the extended form with a leading
seconds field and a trailing year field; the web console writes seven-field expressions such as
0 0 0 15 */3 ? * — midnight on the 15th, every third month. If the expression pins a single instant (every field
numeric, year included), the trainer is a one-off and the API reports hasRetraining: false.
A trainer created without a schedule runs once, about a minute after it is created.
An inferencer keeps a bounded number of versions (five by default). When a new one arrives over the limit, the
oldest inactive version is dropped; the active one is never removed by a retraining.
Callbacks and history
Because trainings take minutes to hours, nothing in this loop blocks. The scheduler records every execution in
its history (GET /scheduler/organization/{organizationId}/history), with a state — IN_PROGRESS until the
callback arrives, FINISHED when it does, FINISHED OUT OF TIME if it arrived after the wait expired — and one
entry per step with its result and description. For a time-series trainer that is two steps: the export and the
training. The web console’s See history action is a view of exactly this.
What you need
A user with the root or super_admin_domain profile: the five AI services accept no other.
Authentication is the usual X-ApiKey header, or Authorization: Bearer <JWT>.
The AI services are exposed on the same host as the rest of the OpenGate API, under the prefixes
/ai (training plans, trainers, inferencers), /scheduler and /fileConnector.
Training plans
Limited access
This feature is only available to root and super_admin_domain profiles. Ask your administrator for proper user role profiling.
What a training plan is
A training plan is a packaged answer to one question — is this RADIUS session unusual for its APN?,
is this part defective? — built and validated by the platform team and published in a catalogue. It bundles:
the algorithm and the whole training recipe: how the data is cleaned, split, transformed, trained and
evaluated;
the container image that runs that recipe;
the data it needs: which source types it accepts (a file, a time series, or either) and, for time
series, the columns it expects to find;
the configuration you must supply when you create a trainer — an APN, for example;
the minimum amount of data below which a training is refused rather than producing a meaningless model;
and, implicitly, the inference contract of the model it produces and the rule it creates to call it.
You do not modify a plan. You create a trainer that runs it, and the plan’s own pages below tell
you what to feed it and what comes out.
Listing the catalogue
curl --request GET \
--header "X-ApiKey: <your-api-key>"\
https://api.opengate.es/ai/trainingPlans
The catalogue is platform-wide, not per organization, and read-only through the API. Each entry:
{
"identifier": "6f1c2a4e-…",
"name": "RADIUS anomalies per APN (Isolation Forest)",
"description": "Detects anomalous data sessions of the subscriptions of one APN",
"modelType": "anomaly",
"modelFormat": "isolation-forest",
"source": ["file", "timeserie"],
"configFields": ["apn"],
"columnData": [
{ "name": "APN", "type": "STRING", "description": "Access point name of the session" },
{ "name": "sbytes", "type": "LONG", "description": "Bytes sent by the device" }
],
"minDataToTrain": { "value": 15000, "unit": "ITEMS" },
"image": { "name": "trainingplan-if-radius-anomalies-per-apn", "tag": "1.0.0" }
}
Field
Meaning
How you use it
identifier
The plan’s id
imageExecution.trainingPlan.identifier when creating a trainer
name, description
What the plan does, for people
The console shows them in the plan picker
modelType
The family of problem: anomaly, classification…
Groups plans in the console
modelFormat
The algorithm: isolation-forest, autoencoder, pytorch…
Informative; it also names the registered model
source
The data source types the plan accepts: file, timeserie or both
Decides whether source.path or source.timeserie is allowed in the trainer
configFields
The configuration keys the plan needs
Every one of them must appear in imageExecution.configuration
columnData
The columns the plan expects in its input
For a time-series source, map each of them to a column of your time series
minDataToTrain
The minimum amount of data: a number of ITEMS (rows, images per class) or of DAYS
Below it, the training fails with an explicit message instead of producing a bad model
Learns what a normal data session looks like on one APN and flags the sessions that do not fit: the data it needs, how it trains, the prediction request and answer, and the rule and alarm it creates.
The same RADIUS-per-APN problem solved with a neural network that learns to reconstruct normal sessions and flags the ones it reconstructs badly: data, training, prediction contract and the rule it creates.
Tells defective items from correct ones in photographs and draws a heat map of the defect: the folders of images it trains on, the two models it combines, the prediction request over the organization's file space, and the rule and alarm it creates.
The three plans share the same lifecycle, described in How it works: what differs between
them is the data they take, the request their inferencer answers, and the rule they create.
RADIUS · Isolation Forest
RADIUS · Autoencoder
Image anomaly detection
Source types
file, time series
file, time series
file (a folder)
Input
RADIUS session records of one APN
RADIUS session records of one APN
Photos in correct/ and incorrect/ folders
Configuration
apn
apn
—
Inference request
sbytes, dbytes, spkts, dpkts, dur
sbytes, dbytes, spkts, dpkts, dur
image_route, generate_heat_map
Inference answer
prediction, anomaly_score, explanation
prediction, anomaly_score, explanation
predictions, anomaly_score, heatmap_path
Rule triggers on
GPRS presence turning STOP
GPRS presence turning STOP
A new imagePathToCheck value
Alarm
deviceWithAnomaly
deviceWithAnomaly
imageWithAnomaly
API specification
Subsections of Training plans
RADIUS session anomalies — Isolation Forest
What it detects
Every data session a SIM subscription opens through a mobile operator is recorded by RADIUS accounting: how long
it lasted, how many bytes and packets went each way. On a given APN those sessions have a shape — an IoT fleet
sending small periodic uploads looks nothing like a fleet streaming video. This plan learns that shape and scores
each new session against it, so that a SIM that suddenly uploads gigabytes, or holds a session open for days,
stands out.
The algorithm is an Isolation Forest: an ensemble of random trees where points that are easy to isolate —
few splits away from everything else — are anomalies. It needs no labelled examples of bad sessions, only enough
normal traffic to learn from.
Data it needs
The plan reads RADIUS session records and keeps the sessions of one APN, given as the apn configuration
field. Each record needs these columns; with a time-series source you map them in the trainer, with a file source
they must be present under these names in a Parquet file:
Column
Type
Meaning
APN
string
Access point name of the session
SessionState
string
State of the session record
IP_GGSN, IP_Device
string
Gateway and device IP addresses
sbytes, dbytes
integer
Bytes sent and received by the device
spkts, dpkts
integer
Packets sent and received
dur
integer
Duration of the session
Records with missing values are dropped, and so are TERMINATED records that carry no traffic counters at all.
The plan refuses to train when the APN has fewer sessions than the catalogue’s minDataToTrain (15 000 when the
plan does not say otherwise): the execution fails with Not enough data for APN rather than register a model
nobody should trust.
How it trains
From the five counters the plan derives eight more features — totals, ratios between directions, rates per
second of duration — and scales them robustly to the [0, 1] range. The data is split 75 / 12.5 / 12.5 into
training, validation and test. After fitting, the forest scores the training set and the plan sets the
decision threshold at the 95th percentile of those scores: anything scoring above it at inference time is an
anomaly. Two numbers are recorded with the model version and shown as its metrics:
Metric
Meaning
calculated_threshold
The score above which a session is called anomalous
training_max_score
The highest score seen in training; inference scores are divided by it so anomaly_score reads as a fraction
The prediction request
The inferencer answers POST /api/predict with the five counters of one session:
The isolation score divided by the training maximum. Above roughly 1 means more extreme than anything seen in training
explanation
Only when prediction is 1: the features that pushed the score up, with their contribution, computed with SHAP on the forest. Empty otherwise
The rule it creates
Unless the trainer says createRule: false, the first successful training creates an ADVANCED rule named after
the model in default_channel, inactive until the inferencer is activated. What it does:
Triggers on device.communicationModules[].subscription.mobile.presence.gprs, and acts only when the value is
STOP — the session has just closed — and the subscription’s session record belongs to the configured apn.
Sends that session’s sentBytes, receivedBytes, sentPackets, receivedPackets and duration to the
inferencer.
Collects three datastreams on the entity, dated at the session’s timestamp:
Datastream
Value
withAnomaly
true or false
score
The anomaly_score
explanation
The explanation as text, when the rule parameter shouldShowAnomalyReason is true
Opens the alarm deviceWithAnomaly (severity URGENT, priority MEDIUM) when the entity becomes anomalous
and was not before, carrying the explanation as extra information; closes it when a later session comes back
normal.
The rule’s parameters — inferenceServiceURL, apn, shouldShowAnomalyReason — are editable in the rules
editor, as is the whole script. The datastreams it collects must exist in the entity’s data model.
Choosing between this plan and the Autoencoder
Both plans take the same data and answer the same request, so a rule written for one works for the other. The
Isolation Forest trains in seconds, needs no tuning and explains its decisions feature by feature; it is the
one to start with. The Autoencoder is worth a try when the forest flags too much or too
little and you have plenty of data: it learns a smoother notion of normal at the price of a longer training.
RADIUS session anomalies — Autoencoder
What it detects
The same thing as the Isolation Forest plan: data sessions of the SIM
subscriptions of one APN whose traffic profile does not match the APN’s usual behaviour. What changes is how
usual is learned.
An autoencoder is a neural network trained to compress each session into a few numbers and rebuild it from
them. It only sees normal traffic while training, so it becomes good at rebuilding normal sessions — and bad at
rebuilding anything else. The reconstruction error of a new session is its anomaly score.
Data it needs
Identical to the Isolation Forest plan: RADIUS session records with APN, SessionState, IP_GGSN,
IP_Device, sbytes, dbytes, spkts, dpkts and dur, filtered to the configured apn, with the same
cleaning and the same minDataToTrain check. A time series that feeds one plan feeds the other unchanged.
How it trains
The same thirteen features and scaling as the forest, then a symmetric network of five hidden layers
(60 · 30 · 25 · 30 · 60 neurons) trained with the Adam optimiser on mean squared error, with early stopping and
L2 regularisation. The decision threshold is again the 95th percentile of the training reconstruction
errors, and the same two metrics are recorded:
Metric
Meaning
calculated_threshold
The reconstruction error above which a session is called anomalous
training_max_score
The highest error seen in training, used to normalise anomaly_score
Training a network takes longer than growing a forest. Give the trainer a generous execution timeout.
anomaly_score is the reconstruction error divided by the training maximum. explanation, present only for
anomalies, lists the features whose individual reconstruction error is in the top quarter — the parts of the
session the network could not make sense of.
The rule it creates
The same rule as the Isolation Forest plan: triggered by the GPRS presence turning STOP on a subscription of
the configured APN, collecting withAnomaly, score and explanation, and opening and closing the
deviceWithAnomaly alarm. Because both plans share the request and the answer, an organization can train both on
the same data and compare them side by side, each with its own model name.
Image anomaly detection
What it detects
Given a photograph of an item — a part on a line, a meter, a connector — the model says whether it looks like
the correct examples it was trained on or like the incorrect ones, and when it finds a defect it produces a
heat map: the same image with the suspicious region painted over, saved next to the original.
Data it needs
This plan takes a file source only: a folder in your organization’s file space with
two sub-folders of .jpg, .jpeg or .png images:
<your folder>/
correct/ photographs of items that are fine
incorrect/ photographs of items with the defect
Upload the images — a .zip or .tar.gz is extracted on arrival — and give the trainer the folder as
source.path. Both classes need at least minDataToTrain images each; the training fails with a message naming
the class that falls short. The more varied the correct set, the fewer false alarms.
How it trains
Two models are trained and used together:
A ResNet-18 classifier, pre-trained on ImageNet and fine-tuned on your two folders to output the
probability that an image is defective. Images are resized to 224 × 224 and lightly jittered in brightness and
contrast so the model does not learn the lighting of your photo booth.
A PaDiM anomaly model on the activations of one of the network’s inner layers, which estimates how far each
region of a new image is from the distribution of correct images — this is what the heat map comes from, and it
catches defects the classifier has never seen.
The plan’s metric is the classifier’s F1 score on the test split; it is recorded with the version.
The prediction request
The inferencer answers POST /api/predict with the path of an image relative to the organization’s file
space — the same space the file connector manages, mounted for the inferencer at /data:
Between 0 and 1. The classifier’s probability when it fires; otherwise PaDiM’s distance mapped onto the same range
heatmap_path
When the item is defective and generate_heat_map was not false: the heat map written next to the original as <name>_heatmap.<ext>. null otherwise
An image_route that does not exist returns 422.
The flow is: the classifier decides first; if it sees a defect the answer is its probability and a Grad-CAM heat
map of what it looked at. If it sees nothing, PaDiM gets a second look and can still call the item defective when
its distance exceeds the plan’s minimum, with its own heat map.
The rule it creates
The rule named after the model, in default_channel, inactive until the inferencer is activated:
Triggers on the datastream imagePathToCheck — collect the path of a new photograph into it, and the rule
runs.
Sends that path to the inferencer, with generate_heat_map taken from the rule parameter requestHeatMap.
Collects imageWithAnomaly (true / false) and, when there is one, imageWithHeatMapPath, dated at the
photograph’s timestamp.
Opens the alarm imageWithAnomaly (severity URGENT, priority MEDIUM) naming the image when the entity
becomes anomalous, and closes it when a later image is correct.
So a camera integration only has to do two things: drop the photograph into the organization’s file space and
collect its path into imagePathToCheck. The rest is the loop described in How it works.
Trainers
Limited access
This feature is only available to root and super_admin_domain profiles. Ask your administrator for proper user role profiling.
What a trainer is
A trainer is the instruction run this training plan, on this data, with this configuration, now and maybe
again later. Creating one is the only step a person takes to obtain a model: everything after the 201 — the
export, the training job, the model version, the inference image, the inferencer and its rule — happens on its
own and is described in How it works.
The response is 201 Created with a Location header holding the trainer’s identifier.
Field by field
Field
Required
Meaning
name
yes
The trainer’s name, unique in the organization. Names the Kubernetes secret that carries your credentials to the job
description
no
Free text
imageExecution.model.name
yes
The model name: ^[a-z0-9][a-z0-9-]*$. Only one trainer per model name per organization. It becomes the name of the inferencer, the rule and the scheduler entry — see the naming table
Key–value pairs, one per entry in the plan’s configFields. Handed to the job as environment variables
imageExecution.timeout
yes
Seconds the training job may run before it is killed. The autoencoder and the image plan need far more than the forest
source
yes
Exactly one of path or timeserie, below
schedule
no
When and how often to run. Absent: once, about a minute from now
createRule
no
Whether the first training should create the plan’s rule. Default true
Read-only fields come back on GET: identifier, orgName, hasRetraining and schedule.schedulerId — the
identifier of the entry the scheduler created, which is also the model name.
path is relative to the root of your organization’s file space, where you upload it
beforehand. Inside the job the file space is mounted at /data, so the plan reads /data/radius/sessions-2026-q2.parquet.
A path may also be a folder, which is what the image plan expects.
A file source schedules a single image execution in the scheduler.
The time series to export, from the organization’s time series
filter
Optional. A time series filter restricting the rows, for example to a date range
columns
Which of your columns feed the plan, and under what name. output.name must be one of the names the plan lists in columnData; output.parquet.type fixes the Parquet type when the default is not right
timeout
Seconds to wait for the export. The scheduler waits five seconds more than this for the export’s callback
A time-series source schedules a pipeline: first the platform’s own
Parquet export of that time series, writing
<model>-<plan>-<time series>.parquet into your file space, then the training image with dataSourcePath
pointing at it. Each retraining exports again, so the model always learns from current data.
expression — a cron expression. Standard five fields work; the scheduler also accepts a leading seconds
field and a trailing year field, and ? in the day fields. 0 0 0 15 */3 ? * is 00:00:00 on the 15th
of every third month. Time zone is UTC.
isImmediateExecution — also run now, without waiting for the first tick. The console sets it, so a new
trainer always produces a first version straight away.
No schedule at all means a single execution about one minute after creation, and hasRetraining: false.
An expression that pins one instant — every field numeric, including the year — is treated the same way.
What the platform does with your request
Knowing this helps when something does not appear where you expect it.
Rejects the request if another trainer in the organization has the same name or the same model name, or if
the plan is not in the catalogue.
Creates a Kubernetes secret named <organization>-<trainer name>-env-secret holding your API key and the
organization name. The training job uses it to register the inferencer, create the rule and report back —
everything the job does, it does as you.
Asks the scheduler for an image execution (file source) or a pipeline (time-series source) named after the
model, running the plan’s image with these environment variables: your configuration entries, modelName,
createRule, minDataToTrain from the plan, and dataSourcePath; plus the secret above and the platform’s
shared AI settings. The scheduler waits for the job’s callback for timeout + 5 seconds.
Stores the trainer and answers 201.
The trainer record is a schedule, not a status: to know whether a training ran and how it went, read the
scheduler’s history for schedulerId = model name, or open See history in
the console.
Listing trainers
curl --request GET \
--header "X-ApiKey: <your-api-key>"\
https://api.opengate.es/ai/organization/acme/trainer
Returns every trainer of the organization, with the read-only fields filled in. An organization with no trainers
gets an empty list, not an error.
Removes the schedule from the scheduler, the credentials secret and the trainer record, and answers 204. A
training that is running is not interrupted — cancel it through the scheduler
if you need to. The inferencer, its model versions and its rule are not touched: they are separate
resources, removed through the Inferencers API. Deleting the trainer only means no further
version will be trained.
Errors
Errors follow the platform’s usual shape, a list of code, message and context:
Situation
Status
A trainer with that name, or that model name, already exists in the organization
400
The training plan identifier is not in the catalogue
400
The body fails the specification — a model name with uppercase letters, both path and timeserie, a missing timeout
400
The organization does not exist, or the trainer to delete does not
404
API specification
Inferencers
Limited access
This feature is only available to root and super_admin_domain profiles. Ask your administrator for proper user role profiling.
What an inferencer is
An inferencer is a trained model as a running service. It has a name, a list of images — one per
model version, each a container the platform can deploy — at most one active image, an endpoint where
rules call it, a request schema describing what to send, and the rules that call it.
Trainers create inferencers: the first successful training of a model creates one named after the model, later
trainings add versions to it. You will rarely create one by hand, but you will use this API for what the trainer
does not decide for you — which version runs, and whether it runs at all.
To
Call
List the organization’s inferencers
GET /ai/organization/{organizationId}/inferencer
Read one
GET /ai/organization/{organizationId}/inferencer/{inferencerId}
Create one
POST /ai/organization/{organizationId}/inferencer
Change its rules, request path or request schema
PUT /ai/organization/{organizationId}/inferencer/{inferencerId}
The versions, oldest first. Each has an id, the image url the trainer pushed, when it arrived and the metrics the training recorded — the numbers to compare versions by
active
The image id that is deployed, latest if the inferencer follows its newest version, or absent when nothing is deployed
activeName
With active: latest, the id of the version actually running
endpoint
Where rules call it: https://<organization>-<name>:8443/<resourcePath>. This is an address inside the platform, reachable from the rules engine, not from the internet
requestSchema
The JSON schema of a prediction request, as the training plan declared it
rules
The rules switched on and off with the inferencer
The list accepts two filters: ?name=<inferencer name> and ?image=<image url>.
Activating a version
A new inferencer is not deployed. Nothing runs, and its rules stay inactive, until you activate a version:
curl --request PUT \
--header "X-ApiKey: <your-api-key>"\
"https://api.opengate.es/ai/organization/acme/inferencer/b1c4…/activation?image=latest&active=true"
image
Effect
An image id
Deploy exactly that version. Retrainings add versions but leave this one running
latest
Deploy the newest version, and replace it automatically each time a training adds a newer one. The rule keeps calling the same endpoint throughout
What activation does, in order: deploys the image as a service named <organization>-<name> listening on 8443
with TLS, waits until its container is running — an image that cannot be pulled fails here with 404 — and then
sets every linked rule to active: true. It answers 204.
Only one version can be active. Activating a second one while another is running is refused with 400;
deactivate first:
curl --request PUT \
--header "X-ApiKey: <your-api-key>"\
"https://api.opengate.es/ai/organization/acme/inferencer/b1c4…/activation?active=false"
Deactivation reverses the steps: rules to active: false, then the service is undeployed. The versions remain.
Active means called on every reading
An active inferencer is invoked by its rule for each reading the rule matches. It is a running service that
consumes platform resources for as long as it is active. Leave a model deactivated while you evaluate its
metrics, and activate it when you are ready to act on its answers.
Versions
Trainers add versions; you can also add one yourself:
An image url ending in :latest is refused — a version must be a fixed tag, or active: latest would mean
nothing.
The same url cannot be added twice.
An inferencer keeps a bounded number of versions, five by default. Adding one beyond the limit drops the
oldest inactive version; the active one is never dropped. With a limit of one and the only version active,
the addition is refused.
With active: latest, adding a version redeploys the service on the new image straight away. If the new image
fails to start, it is removed again and the previous version is put back.
A version cannot be removed while it is active, and the last remaining version cannot be removed at all. With
active: latest, removing the newest version redeploys the one before it.
Rules
rules lists the rules that the inferencer switches on and off. A trainer fills it with the rule the plan
creates; you can point it at your own instead:
Every rule is checked to exist; an unknown id is a 400. The same PUT changes resourcePath — which also
rewrites endpoint — and requestSchema. At least one of the three must be present.
http.client.uri=parameterObject['inferenceServiceURL']; // https://acme-radius-orange:8443/api/predict
http.client.trustedAll=true; // the service uses the platform's internal certificate
http.client.headers= { 'content-type':'application/json', 'accept':'application/json' };
http.client.body= {
sbytes:session.sentBytes, dbytes:session.receivedBytes,
spkts:session.sentPackets, dpkts:session.receivedPackets,
dur:session.duration};
varresponse=http.client.post();
if (response.body.prediction===1) {
alarm.open({ alarmName:'deviceWithAnomaly', ruleName:ruleName, severity:'URGENT', priority:'MEDIUM',
description:'Detected anomaly with inferencer service' });
}
Keep the endpoint in a rule parameter rather than in the script, as the generated rules do: the address is
stable for the life of the inferencer, but a parameter is what you would change if you ever pointed the rule at a
different model. Besides /api/predict, every inferencer built by the platform framework also serves
GET /api/metrics, returning the metrics of the running version, and GET /health.
If a version is active it is deactivated first — rules off, service undeployed. Then the inferencer is removed,
and so are its rules, except any rule another inferencer of the organization still lists. The model versions
in MLflow and the images in the registry are not deleted. The trainer that created the inferencer is not
affected: its next scheduled run creates the inferencer again, rule included.
Creating an inferencer by hand
Trainers do this for you. If you need to register a model that was not trained on the platform:
Exactly one image at creation, not tagged latest; rules is optional. The image must be pullable by the
platform and serve HTTPS on the port the platform expects — the framework’s inference server does, which is why
Building training plans is the practical route for a custom model rather than a
bare container.
API specification
Scheduler
Limited access
This feature is only available to root and super_admin_domain profiles. Ask your administrator for proper user role profiling.
What the scheduler does
The scheduler runs things later, and again. Three kinds of things:
Type
What runs
Typical use
REST request
An HTTP call to any URL, with headers and body
Start a time series export every night
Image execution
A container image from the platform registry, as a Kubernetes Job
Run a training plan, an aggregation, a report
Pipeline
Two or more of the above, in sequence
Export data, then train on it — which is exactly what a time-series trainer is
Every schedulation belongs to an organization, has an identifier you choose, a schedule and a history
of executions. Trainers are its main customer today, but the console’s Schedulers screen and the dashboard
scheduler widgets let you use it directly.
To
Call
Create
POST /scheduler/organization/{organizationId}/restRequest · …/imageExecution · …/pipeline
Standard five fields (minute hour day month weekday), optionally with a leading seconds field and a trailing year field. 0 0 2 * * * * is every day at 02:00:00. ? is accepted in the day fields
cron.timeZone
Where the expression is evaluated. Default UTC
interval.minutes
Run every n minutes instead, counted from from or from creation
executeNow
Also run immediately on creation
from
Cron: no execution before this instant. Interval: the first execution
to
No execution after this instant
If an execution is still running when the next one is due, the next one is skipped and logged, not queued.
An invalid time zone or expression is rejected on creation with 400 and the offending field named in the error.
response says how the scheduler knows the request is done:
Form
Behaviour
"sync": { "timeout": 5 }
The request is complete when the HTTP response arrives. timeout is the seconds to wait for it. A 4xx/5xx marks the execution as an error, with the platform error message when the body carries one
"async": { "maxTimeToWaitCallback": 600 }
The scheduler adds a callback header to the outgoing request holding the URL the target must POST to when its work is done, and waits up to this many seconds for it. The platform’s own asynchronous endpoints, such as the time series export, honour that header
Kubernetes secrets and config maps to expose as environment, optionally with a key prefix
timeout
Seconds the job may run before Kubernetes kills it
maxTimeToWaitCallback
Seconds to wait for the container to report completion, normally a little more than timeout
The container runs as a Kubernetes Job with no retries, with the organization’s file space
mounted at /data, and with one extra environment variable the scheduler adds itself: callbackUri, the URL
the container must POST to when it finishes. An image that cannot be pulled, or a container that exits with an
error before reporting, fails the execution with that reason in the history.
A pipeline is a list of at least two steps, each a REST request or an image execution with a step
identifier unique in the pipeline. Steps run in order: a synchronous REST step hands over as soon as its
response arrives; an asynchronous REST step and an image step hand over when their callback arrives at
…/pipeline/{pipelineId}/execution/{executionId}/{stepId}. A step that fails stops the pipeline; the history
records the failing step and its description, and the remaining steps are not run.
The example above is, field for field, what the Trainers API creates for a time-series trainer.
Callbacks
Asynchronous work reports back with a POST to the callback URL — the one in the callback header for a REST
request, in callbackUri for a container — carrying:
result is free text by contract; the platform’s own jobs use OK, ERROR and TIMEOUT. The callback is
authenticated like any other call to the scheduler. It answers 204.
A callback that arrives aftermaxTimeToWaitCallback is not lost: the execution, already marked as finished
without a callback, moves to FINISHED OUT OF TIME and records the late result.
Execution history
curl --request GET \
--header "X-ApiKey: <your-api-key>"\
"https://api.opengate.es/scheduler/organization/acme/history?schedulerType=PIPELINE&schedulerId=radius-orange&limit=20"
The schedulation identifier — for a trainer, the model name
limit
Maximum number of entries
state is IN_PROGRESS while a callback is awaited, FINISHED when the execution completed — look at each
step’s result to know how — and FINISHED OUT OF TIME when the callback arrived after the wait had expired.
An execution stopped by hand shows a step with result CANCELLED.
Deletes the Kubernetes Job behind an image execution — or the image step of a pipeline — waits until it is gone,
and records the step as CANCELLED in the history. The schedulation itself is untouched and fires again at the
next tick; to stop that, DELETE the schedulation.
In the web console
Everything on this page has a dashboard widget: the Image Execution,
Rest Request and
Pipeline scheduler browsers, their wizards, and the
Schedulers History list. The Artificial Intelligence section of the
console has its own, simpler Schedulers screen — see The web console.
API specification
File connector
Limited access
This feature is only available to root and super_admin_domain profiles. Ask your administrator for proper user role profiling.
What it is
Every organization has a file space on the platform: a directory tree of its own that the file connector
manages over HTTP, and that the AI services see as a mounted volume. It is where a trainer’s input file lives,
where the time series export writes its Parquet file, where the image plan reads its photographs and writes its
heat maps. Nothing outside the organization can reach it.
To
Call
Upload a file or an archive
POST /fileConnector/organizations/{organizationId}/upload
List a directory
GET /fileConnector/organizations/{organizationId}/list?path=…
Download a file
GET /fileConnector/organizations/{organizationId}/download?path=…
Delete a file or a directory
POST /fileConnector/organizations/{organizationId}/delete
All paths are relative to the organization’s root. Wildcards are not supported. Authentication is the
X-ApiKey header.
JSON with destinyPath, the directory to write into (created if missing), and overwriteFiles, whether existing files may be replaced. Default true
file
The file itself
Archives are unpacked, not stored. A .zip, .tar, .tar.gz or .tar.bz2 — recognised by its MIME type —
is extracted into destinyPath, which is how the image plan’s correct/ and incorrect/ folders are uploaded in
one request. Any other file is stored as it is.
204 means everything was written. 200 with an error list means a partial upload: overwriteFiles was
false and some files already existed; the list names them.
Listing
curl --request GET \
--header "X-ApiKey: <your-api-key>"\
"https://api.opengate.es/fileConnector/organizations/acme/list?path=radius"
For a directory, the first entry named . is the directory itself, followed by its children. For a file, just
that file. A path that matches nothing is a 400.
With fileName, deletes that file inside destinyPath. With fileName omitted or null, deletes the whole
destinyPath directory. 204 on success, 404 if there was nothing to delete.
How the AI services see it
Service
Sees the file space as
A training job
/data. A trainer’s source.path of radius/sessions.parquet becomes dataSourcePath=/data/radius/sessions.parquet
A time-series trainer
The export writes <model>-<plan>-<time series>.parquet at the root, and the job reads it from /data/
An inferencer
/data. The image plan’s image_route is resolved against it, and the heat map is written beside the image
So the console’s file browser in the trainer wizard, the list endpoint and the paths a rule sends to an
inferencer all name the same files.
API specification
The web console
Limited access
This feature is only available to root and super_admin_domain profiles. Ask your administrator for proper user role profiling.
Where it is
The Artificial Intelligence section of the web console is the front end of everything in this chapter. It
signs its requests with your console session, so you see the organization you are logged into and nothing else,
and every action it offers is one of the API calls documented on the previous pages. Its menu has two screens:
AI capabilities and Schedulers.
AI capabilities
The screen lists the trainers of your organization, one row per model:
Column
Shows
Trainer name
The trainer’s name
Model name
The model it trains — also the name of its inferencer and rule
Status
Whether the model has been trained and whether its inferencer is running
Retraining
Whether the trainer has a schedule, and when it fires next
Inferencer
The inferencer’s state and active version, or that none has been created yet
Each row has three actions:
Configure inferencer — opens the inferencer’s versions. Pick a version from the list to see the metrics
its training recorded, and use the Enabled switch to deploy it or take it down. Saving with a different
version selected deactivates the running one and activates the new one. This is the console’s face of the
activation call. Greyed out until the first training has created the
inferencer.
See history — the executions of this trainer from the scheduler’s history,
one line per step with result, description, start and end. A time-series trainer shows two steps per run: the
export and the training. A failed training says why here — Not enough data for APN, a timeout, an image that
could not be built.
Delete — removes the trainer and its schedule. As with the API, the inferencer and its versions stay;
remove them from Configure inferencer or through the Inferencers API.
Reload data refreshes the table; Create new AI trainer opens the wizard.
Creating a trainer
The wizard has four steps and ends with the POST described in Trainers.
1. Selection of training plan
The catalogue, grouped by type — anomaly holds the two RADIUS plans, classification the image plan. Each plan
shows its description; read Training plans before choosing, because a plan is specific
about the data it wants.
2. Configure training data
The plan’s configuration fields, one input per entry in its configFields — the APN for the RADIUS plans.
The source type: File or Timeserie. Only the types the plan accepts are enabled; the image plan is
file-only.
With File: a browser of your organization’s file space. Navigate folders, upload a
file or an archive into the current one, download or delete files, and select the file — or stay in a
folder to select the folder itself, which is what the image plan needs.
With Timeserie: pick one of the organization’s time series, set the export timeout in seconds (the
default is generous; a large series can take a while to export), and map every column the plan expects onto a
column of the time series. The identifier column of the series is offered first.
3. Trainer configuration
Field
Notes
Model’s name
Lowercase letters, digits and hyphens; no spaces. It cannot be changed afterwards and names the inferencer and the rule
Model description
Free text
Trainer’s name
The trainer is a separate object from the model it produces; this name identifies the training task
Maximum execution time
Seconds before a training run is killed. Default 1800; raise it for the autoencoder and image plans
Automatic re-training
Off, every 30, 60 or 90 days, or a custom cron expression. A period runs at midnight on the day of the month the trainer was created plus three days, every one, two or three months
Whatever you choose, the wizard asks for an immediate first execution, so a first version is trained as soon as
the trainer is created.
4. Summary
Everything you selected, then Create. The trainer appears in the table at once; the first version appears when
the training finishes, and See history follows its progress.
A trainer with too little data is not an error yet
If the time series does not yet hold the minimum the plan requires, the trainer is still created. Its first
execution fails with an explicit message in the history and, if it has a retraining schedule, it tries again at
the next tick — when enough history has accumulated, the model gets trained without anyone touching the trainer.
Schedulers
A compact view of the organization’s schedulations — REST requests, image executions and pipelines together —
with identifier, type, cron pattern, last and next execution, and a Delete action. New scheduler opens a
wizard for a REST request or an image execution. Trainers appear here too, as the pipeline or image execution
named after their model: deleting one from this screen stops the trainer’s retraining as surely as deleting the
trainer, but leaves the trainer record behind — prefer the Delete action on the AI capabilities screen.
For the full-featured scheduler widgets — cloning, per-schedulation history, pipeline editing — use the
dashboard scheduler browsers.
Building training plans
This page is for plan authors
Using the AI features needs nothing on this page. It documents how the platform team writes and packages a new
training plan, and what the existing plans look like inside — useful when reading their metrics, their rules or
their failure messages.
The framework
Every training plan is a Python project built on the training template framework, the platform’s fork of
MLflow Recipes. The framework provides:
the recipe engine — the ingest → split → transform → train → evaluate → register pipeline, with anomaly
detection recipes (anomaly/v1@isolation_forest, anomaly/v1@autoencoder) and a classification recipe
(classification/v1) on top of MLflow’s regression and classification ones;
a generic inference server — a FastAPI application that loads whatever model the plan produced and serves
POST /api/predict, GET /api/metrics and GET /health over TLS;
the training-template CLI that runs the recipe, publishes the inference image and registers the result
with the platform;
the conventions that let the Trainers API, the scheduler and the Inferencers API treat every plan alike.
A plan is therefore mostly declarative: a recipe.yaml, a handful of Python functions, and templates.
Layout of a plan repository
trainingplan-<name>/
├── recipe.yaml # the recipe: algorithm, steps, thresholds, metrics
├── model_schema.txt # JSON schema of a prediction request → inferencer.requestSchema
├── steps/
│ ├── ingest.py # load_file_as_cleaned_dataframe(path): read and clean the data
│ ├── split.py # create_dataset_filter(df): rows to keep after the split
│ ├── transform.py # transformer_fn(): the scikit-learn transformer to fit
│ ├── train.py # estimator_fn(params): the unfitted estimator
│ └── custom_metrics.py # metrics referenced from recipe.yaml
├── configurations/
│ ├── entrypoint.sh # the three CLI commands the container runs
│ ├── config.json # how the inference server loads the model
│ ├── predict_service.py # the prediction service class
│ ├── schemas.py # pydantic RequestBody / ResponseBody
│ ├── mapper.py # map_to_response_body(dict) → ResponseBody
│ ├── requirements.txt # runtime dependencies of the inference image
│ └── cli_config/rule_generator.py # generate_rule_creation_body() → the rule to create
└── cli_templates/
├── inference-docker-template.txt # Dockerfile of the inference image
├── rule_create_body.txt # template the rule generator fills in
└── additional_trainer_dependencies.txt # extra RUN lines for the trainer image
The recipe
recipe: "anomaly/v1@isolation_forest"threshold: 0.95# percentile of training scores that becomes the decision thresholdsteps:
ingest: {{INGEST_CONFIG}} # filled in at run time from dataSourcePathsplit:
split_ratios: [0.75, 0.125, 0.125]
post_split_filter_method: create_dataset_filtertransform:
using: customtransformer_method: transformer_fntrain:
using: customestimator_method: estimator_fnmodel_type: isolation-forestregister:
allow_non_validated_model: True
recipe selects the engine: anomaly/v1@isolation_forest, anomaly/v1@autoencoder or classification/v1.
Each step names the function in steps/ that customises it; estimator_params under train is passed to
estimator_fn. evaluate.validation_criteria and primary_metric decide whether a model is validated;
register.allow_non_validated_model: True registers it regardless, which is what the current plans do. Custom
metrics are declared under custom_metrics and implemented in steps/custom_metrics.py.
The {{INGEST_CONFIG}} placeholder is rendered when the container starts: the framework writes a run profile
pointing the ingest step at steps/ingest.py::load_file_as_cleaned_dataframe with the location in
dataSourcePath. That function is where a plan cleans its data and enforces minDataToTrain, failing the run
with a clear message when there is not enough.
The inference service
After training, the framework copies its FastAPI server, the model artefacts and the plan’s configurations/
into a dist/ folder and builds an image from cli_templates/inference-docker-template.txt. At start-up the server
reads configurations/config.json:
and loads the class from predict_service.py. The framework adds two keys after training — threshold, the
calculated decision threshold, and training_max_score — so the running service knows the numbers its version was
trained with. The class contract:
classAnomalyPredictionService:
def__init__(self, model, threshold, transformer=None, max_score=None): ...@staticmethoddefload_model(model_path: str): ...# joblib, Keras, torch — the plan decidesdefpredict(self, data: dict) -> dict: ...# one request in, one result out
schemas.py declares the request and response as pydantic models — the request is what model_schema.txt
describes in JSON schema, and what the inferencer publishes as requestSchema — and mapper.py turns the
service’s result into the response. Requests that fail the schema get 422.
The rule template
configurations/cli_config/rule_generator.py must expose generate_rule_creation_body() returning the JSON of a
rule creation request. The existing plans render cli_templates/rule_create_body.txt with the model name, the
inferencer’s service name and port, and plan configuration such as the APN. The rule is created inactive, in
default_channel, named after the model, and only when no rule of that name exists there already. Keep the
inferencer endpoint in a rule parameter, as the templates do.
What a trainer job looks like from inside
The container’s entrypoint.sh runs three commands and forwards SIGTERM to whichever is running, so a job
killed by its timeout still reports TIMEOUT:
training-template generate-local-yaml --model-type isolation-forest
training-template run --profile local
training-template publish-inference isolation-forest
Command
Does
generate-local-yaml
Writes profiles/local.yaml: MLflow experiment <organizationId>-<modelName>, registered model <organizationId>-<modelName>-<model type>, tracking URI, artefact location and dataSourcePath
run --profile local
Executes the recipe, logging parameters, metrics and the model to MLflow. A failure sends an ERROR callback and stops
publish-inference
Downloads the latest run’s artefacts into dist/, renders the inference Dockerfile, builds and pushes the image with a Kaniko job as <imageRepoUrl>/<organizationId>-<modelName>:v<model version>, then creates the inferencer — with the rule, if createRule is true and the inferencer is new — or adds the image to the existing one, and sends the OK callback
The environment the job receives:
Variable
From
Meaning
organizationId, inferencersAPICredential
The per-trainer secret
Who the job acts as: the organization and the API key of the user who created the trainer
Where MLflow, the registry, the Inferencers and Rules APIs live; the TLS material the inference server uses; build settings
Packaging a plan
Build the base trainer image — the framework plus the plan’s extra dependencies from
cli_templates/additional_trainer_dependencies.txt (TensorFlow for the autoencoder, PyTorch for the image
plan):
The generated Dockerfile copies steps/, configurations/, recipe.yaml, model_schema.txt and
cli_templates/ and sets configurations/entrypoint.sh as the entry point.
Register the plan in the catalogue with its image.name and image.tag, configFields, columnData,
minDataToTrain, and the source types it supports. The catalogue is the platform’s own collection; the
Training Plans API reads it, it does not write it.
To try a plan without the platform, set the variables of the table above in a shell, run the three entrypoint
commands by hand with a local MLflow, and start the built inference server with training-template run-sbox-inference.
A generate-mock-trainer command produces an image that skips the training and only exercises the callbacks, the
Inferencers API and the rule creation — the way the end-to-end tests check the loop without waiting for a real
training.
The AI platform itself
The services this chapter documents — the Training Plans, Trainers and Inferencers APIs, the AI console, the
MLflow tracking server and the shared AI secret — are versioned and deployed together by the platform team,
alongside the scheduler and the file connector that belong to the core platform. Each API generates its server
from the OpenAPI specification shown at the bottom of its page, so the specification is the contract, not a
description of it.
Security
OpenGate security
This section describes how access to the OpenGate REST APIs is secured. It covers the two supported authentication mechanisms, JWT and API keys, and the user password reset procedure.
The OpenGate REST APIs, and device integration mechanisms are enabled by default on all accounts. You don’t have to do anything to turn on these features. However, JWT (JSON Web Token) and API keys are mandatory and are used to control the access to the resources via the REST APIs and connectors.
The OpenGate REST APIs allow third-party applications or back-office systems to communicate with OpenGate. All users in your organization can use third-party applications to access your entity’s data, such as iPhone apps, Android apps, or network-based communication built onto your server. The OpenGate authentication mechanisms ensure the proper access to the information.
JSON Web Token (JWT) is an open standard RFC 7519 that defines a compact and self-contained way for securely transmitting information between parties as a JSON object. This information can be verified and trusted because it is digitally signed. JWTs can be signed using a secret (with the HMAC algorithm) or a public/private key pair using RSA or ECDSA.
A JWT consists of three strings separated by dots: the header, the payload and the signature as shown in the following text.
The header typically consists of two parts: the type of the token, which is JWT, and the signing algorithm being used, such as HMAC SHA256 or RSA.
Payload
The second part of the token is the payload, which contains the claims. Claims are statements about an entity (typically, the user) and additional data. There are three types of claims: registered, public, and private claims.
Registered claims: These are a set of predefined claims which are not mandatory but recommended, to provide a set of useful, interoperable claims. Some of them are: iss (issuer), exp (expiration time), sub (subject), aud (audience), and others.
Public claims: These can be defined at will by those using JWTs. But to avoid collisions they should be defined in the IANA JSON Web Token Registry or be defined as a URI that contains a collision resistant namespace.
Private claims: These are the custom claims created to share information between parties that agree on using them and are neither registered nor public claims.
Signature
To create the signature part you have to take the encoded header, the encoded payload, a secret, the algorithm specified in the header, and sign that.
Obtain a JWT with OpenGate
To obtain a JWT token with OpenGate platform, you should do login with the resource /provision/users/login in the next link JWT.
The JWT (JSON Web Token) can be sent using as a request header.
POST /north/v80/provision/organizations/{organizationId}Host: [api.opengate.es]Authorization: Bearer YOUR-JWT-HERE
It is sent using the Authorization HTTP header. An example of POST request may look like this:
This option can be disabled through configuration in all interfaces, with the exception of those used for device integration.
The API keys can be sent using one of the following methods:
As a request header
As a parameter in the request URL (with the former preferred for security reasons). This option is only available for device integration
Using an HTTP header
This is the recommended method of sending your API key. While it is not secure if sent over an unencrypted connection, it is less likely to be logged as part of the URL:
API Key in HTTP header example:
POST /south/v80/devices/YOUR-DEVICE-ID/collect/dmmHost: [api.opengate.es]X-ApiKey: YOUR-API-KEY-HERE
The API key is sent using the X-ApiKey HTTP header. An example of POST request may look like this:
POST /south/v80/devices/{device.id}/collect/dmm?X-ApiKey=YOUR-API-KEY-HEREHost: [api.opengate.es]
User password reset
Introduction
This API provides a secure procedure to change a user’s password when it has been lost or forgotten. The process has two steps: first, request a password reset for the user’s email, which sends a recovery email with a reset identifier; then, set the new password using that reset identifier.
Usage examples
Request a password reset for a user (the platform generates a token and sends a password recovery email):
curl --request POST \
https://api.opengate.es/north/v80/provision/users/{userEmail}/reset
Set the new password using the reset identifier received by email:
This section gathers the reference catalogs used across the OpenGate API: the mobile network operators search endpoint, the HTTP response status codes and error messages returned by the API, and the list of supported time zones.
The OpenGate OSS API attempts to return appropriate HTTP status codes for every request.
Time zones
OpenGate supported time zones
ACT
AET
Africa/Abidjan
Africa/Accra
Africa/Addis_Ababa
Africa/Algiers
Africa/Asmara
Africa/Asmera
Africa/Bamako
Africa/Bangui
Africa/Banjul
Africa/Bissau
Africa/Blantyre
Africa/Brazzaville
Africa/Bujumbura
Africa/Cairo
Africa/Casablanca
Africa/Ceuta
Africa/Dar_es_Salaam
Africa/Djibouti
Africa/Douala
Africa/El_Aaiun
Africa/Freetown
Africa/Gaborone
Africa/Harare
Africa/Johannesburg
Africa/Juba
Africa/Kampala
Africa/Khartoum
Africa/Kigali
Africa/Kinshasa
Africa/Lagos
Africa/Libreville
Africa/Lome
Africa/Luanda
Africa/Lubumbashi
Africa/Lusaka
Africa/Malabo
Africa/Maputo
Africa/Maseru
Africa/Mbabane
Africa/Mogadishu
Africa/Monrovia
Africa/Nairobi
Africa/Ndjamena
Africa/Niamey
Africa/Nouakchott
Africa/Ouagadougou
Africa/Porto-Novo
Africa/Sao_Tome
Africa/Timbuktu
Africa/Tripoli
Africa/Tunis
Africa/Windhoek
AGT
America/Adak
America/Anchorage
America/Anguilla
America/Antigua
America/Araguaina
America/Argentina/Buenos_Aires
America/Argentina/Catamarca
America/Argentina/ComodRivadavia
America/Argentina/Cordoba
America/Argentina/Jujuy
America/Argentina/La_Rioja
America/Argentina/Mendoza
America/Argentina/Rio_Gallegos
America/Argentina/Salta
America/Argentina/San_Juan
America/Argentina/San_Luis
America/Argentina/Tucuman
America/Argentina/Ushuaia
America/Aruba
America/Asuncion
America/Atikokan
America/Atka
America/Bahia
America/Bahia_Banderas
America/Barbados
America/Belem
America/Belize
America/Blanc-Sablon
America/Boa_Vista
America/Bogota
America/Boise
America/Buenos_Aires
America/Cambridge_Bay
America/Campo_Grande
America/Cancun
America/Caracas
America/Catamarca
America/Cayenne
America/Cayman
America/Chicago
America/Chihuahua
America/Coral_Harbour
America/Cordoba
America/Costa_Rica
America/Creston
America/Cuiaba
America/Curacao
America/Danmarkshavn
America/Dawson
America/Dawson_Creek
America/Denver
America/Detroit
America/Dominica
America/Edmonton
America/Eirunepe
America/El_Salvador
America/Ensenada
America/Fort_Nelson
America/Fort_Wayne
America/Fortaleza
America/Glace_Bay
America/Godthab
America/Goose_Bay
America/Grand_Turk
America/Grenada
America/Guadeloupe
America/Guatemala
America/Guayaquil
America/Guyana
America/Halifax
America/Havana
America/Hermosillo
America/Indiana/Indianapolis
America/Indiana/Knox
America/Indiana/Marengo
America/Indiana/Petersburg
America/Indiana/Tell_City
America/Indiana/Vevay
America/Indiana/Vincennes
America/Indiana/Winamac
America/Indianapolis
America/Inuvik
America/Iqaluit
America/Jamaica
America/Jujuy
America/Juneau
America/Kentucky/Louisville
America/Kentucky/Monticello
America/Knox_IN
America/Kralendijk
America/La_Paz
America/Lima
America/Los_Angeles
America/Louisville
America/Lower_Princes
America/Maceio
America/Managua
America/Manaus
America/Marigot
America/Martinique
America/Matamoros
America/Mazatlan
America/Mendoza
America/Menominee
America/Merida
America/Metlakatla
America/Mexico_City
America/Miquelon
America/Moncton
America/Monterrey
America/Montevideo
America/Montreal
America/Montserrat
America/Nassau
America/New_York
America/Nipigon
America/Nome
America/Noronha
America/North_Dakota/Beulah
America/North_Dakota/Center
America/North_Dakota/New_Salem
America/Ojinaga
America/Panama
America/Pangnirtung
America/Paramaribo
America/Phoenix
America/Port_of_Spain
America/Port-au-Prince
America/Porto_Acre
America/Porto_Velho
America/Puerto_Rico
America/Rainy_River
America/Rankin_Inlet
America/Recife
America/Regina
America/Resolute
America/Rio_Branco
America/Rosario
America/Santa_Isabel
America/Santarem
America/Santiago
America/Santo_Domingo
America/Sao_Paulo
America/Scoresbysund
America/Shiprock
America/Sitka
America/St_Barthelemy
America/St_Johns
America/St_Kitts
America/St_Lucia
America/St_Thomas
America/St_Vincent
America/Swift_Current
America/Tegucigalpa
America/Thule
America/Thunder_Bay
America/Tijuana
America/Toronto
America/Tortola
America/Vancouver
America/Virgin
America/Whitehorse
America/Winnipeg
America/Yakutat
America/Yellowknife
Antarctica/Casey
Antarctica/Davis
Antarctica/DumontDUrville
Antarctica/Macquarie
Antarctica/Mawson
Antarctica/McMurdo
Antarctica/Palmer
Antarctica/Rothera
Antarctica/South_Pole
Antarctica/Syowa
Antarctica/Troll
Antarctica/Vostok
Arctic/Longyearbyen
ART
Asia/Aden
Asia/Almaty
Asia/Amman
Asia/Anadyr
Asia/Aqtau
Asia/Aqtobe
Asia/Ashgabat
Asia/Ashkhabad
Asia/Baghdad
Asia/Bahrain
Asia/Baku
Asia/Bangkok
Asia/Barnaul
Asia/Beirut
Asia/Bishkek
Asia/Brunei
Asia/Calcutta
Asia/Chita
Asia/Choibalsan
Asia/Chongqing
Asia/Chungking
Asia/Colombo
Asia/Dacca
Asia/Damascus
Asia/Dhaka
Asia/Dili
Asia/Dubai
Asia/Dushanbe
Asia/Gaza
Asia/Harbin
Asia/Hebron
Asia/Ho_Chi_Minh
Asia/Hong_Kong
Asia/Hovd
Asia/Irkutsk
Asia/Istanbul
Asia/Jakarta
Asia/Jayapura
Asia/Jerusalem
Asia/Kabul
Asia/Kamchatka
Asia/Karachi
Asia/Kashgar
Asia/Kathmandu
Asia/Katmandu
Asia/Khandyga
Asia/Kolkata
Asia/Krasnoyarsk
Asia/Kuala_Lumpur
Asia/Kuching
Asia/Kuwait
Asia/Macao
Asia/Macau
Asia/Magadan
Asia/Makassar
Asia/Manila
Asia/Muscat
Asia/Nicosia
Asia/Novokuznetsk
Asia/Novosibirsk
Asia/Omsk
Asia/Oral
Asia/Phnom_Penh
Asia/Pontianak
Asia/Pyongyang
Asia/Qatar
Asia/Qyzylorda
Asia/Rangoon
Asia/Riyadh
Asia/Saigon
Asia/Sakhalin
Asia/Samarkand
Asia/Seoul
Asia/Shanghai
Asia/Singapore
Asia/Srednekolymsk
Asia/Taipei
Asia/Tashkent
Asia/Tbilisi
Asia/Tehran
Asia/Tel_Aviv
Asia/Thimbu
Asia/Thimphu
Asia/Tokyo
Asia/Tomsk
Asia/Ujung_Pandang
Asia/Ulaanbaatar
Asia/Ulan_Bator
Asia/Urumqi
Asia/Ust-Nera
Asia/Vientiane
Asia/Vladivostok
Asia/Yakutsk
Asia/Yekaterinburg
Asia/Yerevan
AST
Atlantic/Azores
Atlantic/Bermuda
Atlantic/Canary
Atlantic/Cape_Verde
Atlantic/Faeroe
Atlantic/Faroe
Atlantic/Jan_Mayen
Atlantic/Madeira
Atlantic/Reykjavik
Atlantic/South_Georgia
Atlantic/St_Helena
Atlantic/Stanley
Australia/ACT
Australia/Adelaide
Australia/Brisbane
Australia/Broken_Hill
Australia/Canberra
Australia/Currie
Australia/Darwin
Australia/Eucla
Australia/Hobart
Australia/LHI
Australia/Lindeman
Australia/Lord_Howe
Australia/Melbourne
Australia/North
Australia/NSW
Australia/Perth
Australia/Queensland
Australia/South
Australia/Sydney
Australia/Tasmania
Australia/Victoria
Australia/West
Australia/Yancowinna
BET
Brazil/Acre
Brazil/DeNoronha
Brazil/East
Brazil/West
BST
Canada/Atlantic
Canada/Central
Canada/East-Saskatchewan
Canada/Eastern
Canada/Mountain
Canada/Newfoundland
Canada/Pacific
Canada/Saskatchewan
Canada/Yukon
CAT
CET
Chile/Continental
Chile/EasterIsland
CNT
CST
CST6CDT
CTT
Cuba
EAT
ECT
EET
Egypt
Eire
EST
EST5EDT
Etc/GMT
Etc/GMT-0
Etc/GMT-1
Etc/GMT-10
Etc/GMT-11
Etc/GMT-12
Etc/GMT-13
Etc/GMT-14
Etc/GMT-2
Etc/GMT-3
Etc/GMT-4
Etc/GMT-5
Etc/GMT-6
Etc/GMT-7
Etc/GMT-8
Etc/GMT-9
Etc/GMT+0
Etc/GMT+1
Etc/GMT+10
Etc/GMT+11
Etc/GMT+12
Etc/GMT+2
Etc/GMT+3
Etc/GMT+4
Etc/GMT+5
Etc/GMT+6
Etc/GMT+7
Etc/GMT+8
Etc/GMT+9
Etc/GMT0
Etc/Greenwich
Etc/UCT
Etc/Universal
Etc/UTC
Etc/Zulu
Europe/Amsterdam
Europe/Andorra
Europe/Astrakhan
Europe/Athens
Europe/Belfast
Europe/Belgrade
Europe/Berlin
Europe/Bratislava
Europe/Brussels
Europe/Bucharest
Europe/Budapest
Europe/Busingen
Europe/Chisinau
Europe/Copenhagen
Europe/Dublin
Europe/Gibraltar
Europe/Guernsey
Europe/Helsinki
Europe/Isle_of_Man
Europe/Istanbul
Europe/Jersey
Europe/Kaliningrad
Europe/Kiev
Europe/Kirov
Europe/Lisbon
Europe/Ljubljana
Europe/London
Europe/Luxembourg
Europe/Madrid
Europe/Malta
Europe/Mariehamn
Europe/Minsk
Europe/Monaco
Europe/Moscow
Europe/Nicosia
Europe/Oslo
Europe/Paris
Europe/Podgorica
Europe/Prague
Europe/Riga
Europe/Rome
Europe/Samara
Europe/San_Marino
Europe/Sarajevo
Europe/Simferopol
Europe/Skopje
Europe/Sofia
Europe/Stockholm
Europe/Tallinn
Europe/Tirane
Europe/Tiraspol
Europe/Ulyanovsk
Europe/Uzhgorod
Europe/Vaduz
Europe/Vatican
Europe/Vienna
Europe/Vilnius
Europe/Volgograd
Europe/Warsaw
Europe/Zagreb
Europe/Zaporozhye
Europe/Zurich
GB
GB-Eire
GMT
GMT0
Greenwich
Hongkong
HST
Iceland
IET
Indian/Antananarivo
Indian/Chagos
Indian/Christmas
Indian/Cocos
Indian/Comoro
Indian/Kerguelen
Indian/Mahe
Indian/Maldives
Indian/Mauritius
Indian/Mayotte
Indian/Reunion
Iran
Israel
IST
Jamaica
Japan
JST
Kwajalein
Libya
MET
Mexico/BajaNorte
Mexico/BajaSur
Mexico/General
MIT
MST
MST7MDT
Navajo
NET
NST
NZ
NZ-CHAT
Pacific/Apia
Pacific/Auckland
Pacific/Bougainville
Pacific/Chatham
Pacific/Chuuk
Pacific/Easter
Pacific/Efate
Pacific/Enderbury
Pacific/Fakaofo
Pacific/Fiji
Pacific/Funafuti
Pacific/Galapagos
Pacific/Gambier
Pacific/Guadalcanal
Pacific/Guam
Pacific/Honolulu
Pacific/Johnston
Pacific/Kiritimati
Pacific/Kosrae
Pacific/Kwajalein
Pacific/Majuro
Pacific/Marquesas
Pacific/Midway
Pacific/Nauru
Pacific/Niue
Pacific/Norfolk
Pacific/Noumea
Pacific/Pago_Pago
Pacific/Palau
Pacific/Pitcairn
Pacific/Pohnpei
Pacific/Ponape
Pacific/Port_Moresby
Pacific/Rarotonga
Pacific/Saipan
Pacific/Samoa
Pacific/Tahiti
Pacific/Tarawa
Pacific/Tongatapu
Pacific/Truk
Pacific/Wake
Pacific/Wallis
Pacific/Yap
PLT
PNT
Poland
Portugal
PRC
PRT
PST
PST8PDT
ROK
Singapore
SST
SystemV/AST4
SystemV/AST4ADT
SystemV/CST6
SystemV/CST6CDT
SystemV/EST5
SystemV/EST5EDT
SystemV/HST10
SystemV/MST7
SystemV/MST7MDT
SystemV/PST8
SystemV/PST8PDT
SystemV/YST9
SystemV/YST9YDT
Turkey
UCT
Universal
US/Alaska
US/Aleutian
US/Arizona
US/Central
US/East-Indiana
US/Eastern
US/Hawaii
US/Indiana-Starke
US/Michigan
US/Mountain
US/Pacific
US/Pacific-New
US/Samoa
UTC
VST
W-SU
WET
Zulu
OpenGate Libraries
Introduction to OpenGate Libraries
The OpenGate Libraries are a set of tools and utilities that provide a wide range of functionality for working with OpenGate data in different programming languages. These libraries are built on top of the OpenGate API and provide a simple and efficient way to access and manipulate data in your applications.
Defines the builder to execute alarm attend operation
constructor
Parámetros
Nombre
Tipo
Opcional
Descripción
ogapi
InternalOpenGateAPI
❌
this is configuration about Opengate North API.
Alarm Close Builder
Defines the builder to execute alarm close operation
constructor
Parámetros
Nombre
Tipo
Opcional
Descripción
ogapi
InternalOpenGateAPI
❌
this is configuration about Opengate North API.
Operation
This is an abstract class; it must be extended by another class that defines the specific request. This class is
responsible for executing operation requests to the OpenGate North API.
constructor
Constructor
Parámetros
Nombre
Tipo
Opcional
Descripción
ogapi
InternalOpenGateAPI
❌
this is ogapi instance
resource
string
❌
this is a base url resource
postObj
object
❌
it will be sent as a data on post action
execute()
This invokes a request to the OpenGate North API and the callback is managed by promises.
This is the base object for everything you can do with a deployment element.
createWithFile(rawFile)
This invokes a request to the OpenGate North API and the callback is managed by promises. This method creates a
deployment element.
Parámetros
Nombre
Tipo
Opcional
Descripción
rawFile
File
❌
this File is the deployment element
Retorna
Tip
Tipo:Promise
deploy()
This invokes a request to the OpenGate North API and the callback is managed by promises. This method creates a
deployment element with the previously assigned file.
Retorna
Tip
Tipo:Promise
update()
This method invalidates the update option
withDownloadUrl(downloadUrl)
Set the downloadUrl attribute
Parámetros
Nombre
Tipo
Opcional
Descripción
downloadUrl
string
❌
Retorna
Tip
Tipo:DeploymentElement
withFile(rawFile)
Sets the file to upload
Parámetros
Nombre
Tipo
Opcional
Descripción
rawFile
object
❌
Retorna
Tip
Tipo:DeploymentElement
withFileName(fileName)
Set the fileName attribute
Parámetros
Nombre
Tipo
Opcional
Descripción
fileName
string
❌
Retorna
Tip
Tipo:DeploymentElement
withName(name)
Set the name attribute
Parámetros
Nombre
Tipo
Opcional
Descripción
name
string
❌
required field
Retorna
Tip
Tipo:DeploymentElement
withOldName(name)
Sets the old name attribute
Parámetros
Nombre
Tipo
Opcional
Descripción
name
string
❌
Retorna
Tip
Tipo:DeploymentElement
withOldPath(path)
Sets the old path attribute
Parámetros
Nombre
Tipo
Opcional
Descripción
path
string
❌
Retorna
Tip
Tipo:DeploymentElement
withOldVersion(version)
Sets the old version attribute
Parámetros
Nombre
Tipo
Opcional
Descripción
version
string
❌
Retorna
Tip
Tipo:DeploymentElement
withOperation(operation)
Set the operation attribute
Parámetros
Nombre
Tipo
Opcional
Descripción
operation
string
❌
required field
Retorna
Tip
Tipo:DeploymentElement
withOption(option)
Set the option attribute
Parámetros
Nombre
Tipo
Opcional
Descripción
option
string
❌
Retorna
Tip
Tipo:DeploymentElement
withOrder(order)
Set the order attribute
Parámetros
Nombre
Tipo
Opcional
Descripción
order
string
❌
required field
Retorna
Tip
Tipo:DeploymentElement
withPath(path)
Set the path attribute
Parámetros
Nombre
Tipo
Opcional
Descripción
path
string
❌
required field
Retorna
Tip
Tipo:DeploymentElement
withTimeout(ms)
The request will have a specific time out if it will be exceeded then the promise throw an exception
This is a base object that contains everything you can do with a connector function catalog entry.
constructor
Constructor
Parámetros
Nombre
Tipo
Opcional
Descripción
ogapi
InternalOpenGateAPI
❌
identifier
String
❌
connectorFunction
Object
❌
addNorthCriteria(northCriteria)
Add northCriteria to parameter northCriterias. Each element is defined by path and value
Parámetros
Nombre
Tipo
Opcional
Descripción
northCriteria
Object
❌
Retorna
Tip
Tipo:ConnectorFunctionsCatalog
addSouthCriteria(southCriteria)
Add southCriteria to parameter southCriterias. Each string can represent an URI, topic, OID…
Parámetros
Nombre
Tipo
Opcional
Descripción
southCriteria
String
❌
Retorna
Tip
Tipo: ``
create()
Create a new connector function catalog
Retorna
Tip
Tipo:Promise
withCloneable(cloneable)
Indicates whether or not the Connector Function is cloneable.
Parámetros
Nombre
Tipo
Opcional
Descripción
cloneable
Boolean
❌
Retorna
Tip
Tipo:ConnectorFunctionsCatalog
withDescription(description)
Description of the connector function. This field is optional.
Parámetros
Nombre
Tipo
Opcional
Descripción
description
String
❌
Retorna
Tip
Tipo:ConnectorFunctionsCatalog
withIdentifier(identifier)
Set the identifier
Parámetros
Nombre
Tipo
Opcional
Descripción
identifier
String
❌
Retorna
Tip
Tipo:ConnectorFunctionsCatalog
withJavascript(javascript)
Connector function javascript code
Parámetros
Nombre
Tipo
Opcional
Descripción
javascript
String
❌
Retorna
Tip
Tipo:ConnectorFunctionsCatalog
withName(name)
Descriptive and unique name
Parámetros
Nombre
Tipo
Opcional
Descripción
name
String
❌
Retorna
Tip
Tipo:ConnectorFunctionsCatalog
withNorthCriterias(northCriterias)
Connector Function selection criteria for operation requests. This field is mandatory if Connector Function type is REQUEST. ⮕ [ each element is defined by path and value ]
Parámetros
Nombre
Tipo
Opcional
Descripción
northCriterias
Array
❌
Retorna
Tip
Tipo:ConnectorFunctionsCatalog
withOperationalStatus(operationalStatus)
Connector Function status
Allowed: DISABLED┃PRODUCTION┃TEST
Parámetros
Nombre
Tipo
Opcional
Descripción
operationalStatus
String
❌
Retorna
Tip
Tipo:ConnectorFunctionsCatalog
withOperationName(operationName)
Used to filter connector functions by operation name. If Connector Function type is REQUEST, this field is mandatory and defined name must be an operation name available for specified Api Key. If the type is COLLECTION or RESPONSE, this field must be null.
Parámetros
Nombre
Tipo
Opcional
Descripción
operationName
String
❌
Retorna
Tip
Tipo:ConnectorFunctionsCatalog
withPayloadType(payloadType)
Enum of allowed types for connector function's payload data. Request Connector Functions only accept JSON.
Allowed: TEXT┃JSON┃BINARY
Parámetros
Nombre
Tipo
Opcional
Descripción
payloadType
String
❌
Retorna
Tip
Tipo:ConnectorFunctionsCatalog
withSouthCriterias(southCriterias)
Connector Function selection criteria for operation responses and data collection. This field is mandatory if Connector Function type is COLLECTION or RESPONSE. ⮕ [ each string can represent an URI, topic, OID… ]. Each string can represent an URI, topic, OID…
Parámetros
Nombre
Tipo
Opcional
Descripción
southCriterias
Array
❌
Retorna
Tip
Tipo:ConnectorFunctionsCatalog
withType(type)
Type of connector function, this is mandatory. Keep in mind that you will be not allowed to modify it.
Allowed: COLLECTION┃REQUEST┃RESPONSE
Parámetros
Nombre
Tipo
Opcional
Descripción
type
String
❌
Retorna
Tip
Tipo:ConnectorFunctionsCatalog
Connector Functions Catalog
This class allows you to make GET requests to the connector functions catalog resource in the OpenGate North
API.
getConnectorFunctionsCatalog()
Get connector functions catalog
Retorna
Tip
Tipo:Promise
Connector Functions Catalog Finder
This class allows you to make GET requests to a connector functions catalog resource in the OpenGate North API.
This is a base object that contains everything you can do with geoclusters.
constructor
Constructor
Parámetros
Nombre
Tipo
Opcional
Descripción
ogapi
InternalOpenGateAPI
❌
Reference to the API object.
withIdentifier(identifier)
Set the identifier attribute
Parámetros
Nombre
Tipo
Opcional
Descripción
identifier
string
❌
required field
Retorna
Tip
Tipo:Geocluster
Geocluster Finder
This class allows making GET requests to the geocluster resource in the OpenGate North API.
constructor
Constructor
Parámetros
Nombre
Tipo
Opcional
Descripción
ogapi
InternalOpenGateAPI
❌
Reference to the API object.
findAll()
Find all available geocluster. This execute a GET http method
Retorna
Tip
Tipo:Promise
findById(id)
Find a specify geocluster by an identifier. This execute a GET http method
Parámetros
Nombre
Tipo
Opcional
Descripción
id
string
❌
Identifier of the geocluster.
Retorna
Tip
Tipo:Promise
findFeatures(id, { zoom, topRight, bottomLeft })
Find features inside the coordinates. This execute a GET http method
Parámetros
Nombre
Tipo
Opcional
Descripción
id
string
❌
Identifier of the geocluster.
coordinates
Object
❌
square defined by the coordinates and the zoom used to find the inside features .
Retorna
Tip
Tipo:Promise
Internal Open Gate API
This is an abstract class. It must be extended by another class that defines the backend, and it is used to make
requests to the OpenGate North API from a browser or a Node.js server.
This is an abstract class; it must be extended by another class that defines the specific request. This class is
responsible for managing execute-operation requests to OpenGate North API.
constructor
Constructor
Parámetros
Nombre
Tipo
Opcional
Descripción
ogapi
InternalOpenGateAPI
❌
this is ogapi instance
resource
string
❌
this is a base url resource
postObj
object
❌
it will be sent as a data on post action
execute()
This invoke a request to OpenGate North API and the callback is managed by promises
Retorna
Tip
Tipo:Promise
updatePeriodicity()
This invoke a request to OpenGate North API and the callback is managed by promises
Defines the builder used to configure the periodicity of an operation. With this builder you can select how the
operation repeats: by days, hours, or minutes.
constructor
Constructor
Parámetros
Nombre
Tipo
Opcional
Descripción
parent
BaseOperationBuilder
❌
this is a operationBaseBuilder.
date
Date
❌
Date when operation will be executed
periodicityName
string
❌
Name associated to periodicity
or
number
❌
Date} end - When periodicity ends. By repetitions or by date
days(days)
Set a difference of days in each repetition
Parámetros
Nombre
Tipo
Opcional
Descripción
days
number
❌
Retorna
Tip
Tipo:BaseOperationBuilder
hours(hours)
Set a difference of hours in each repetition
Parámetros
Nombre
Tipo
Opcional
Descripción
hours
number
❌
Retorna
Tip
Tipo:BaseOperationBuilder
minutes(minutes)
Set a difference of minutes in each repetition
Parámetros
Nombre
Tipo
Opcional
Descripción
minutes
number
❌
Retorna
Tip
Tipo:BaseOperationBuilder
Execute Every Builder
Defines the builder used to configure the periodicity of an operation. With this builder you can select the
period by day, week, month, or year.
constructor
Constructor
Parámetros
Nombre
Tipo
Opcional
Descripción
parent
BaseOperationBuilder
❌
this is a operationBaseBuilder.
date
Date
❌
Date when operation will be executed
periodicityName
string
❌
Name associated to periodicity
day()
Every day at time defined will be the pattern
Retorna
Tip
Tipo:BaseOperationBuilder
month(months)
Each month at time and day defined will be the pattern
This invoke a request to OpenGate North API and the callback is managed by promises
This function pauses (if it was active), updates the callback and passes the operation to the initial state (if activated, activated again)
This invoke a request to OpenGate North API and the callback is managed by promises
This function pauses (if it was active), updates the delay and passes the operation to the initial state (if activated, activated again)
This invoke a request to OpenGate North API and the callback is managed by promises This function pauses the
operation, updates its delay to zero, and activates it so it executes immediately
Download a specific model by its id. This execute a GET http method
Parámetros
Nombre
Tipo
Opcional
Descripción
organization
string
❌
model organization .
manufacturer
string
❌
model manufacturer .
identifier
string
❌
model name .
Retorna
Tip
Tipo:Promise
Models
This is a base object that contains all you can do about Models.
constructor
Constructor
Parámetros
Nombre
Tipo
Opcional
Descripción
ogapi
InternalOpenGateAPI
❌
Reference to the API object.
withDescription(description)
Set the description attribute
Parámetros
Nombre
Tipo
Opcional
Descripción
description
string
❌
required field
Retorna
Tip
Tipo:Models
withIdentifier(id)
Set the identifier attribute
Parámetros
Nombre
Tipo
Opcional
Descripción
id
string
❌
required field
Retorna
Tip
Tipo:Models
withName(name)
Set the name attribute
Parámetros
Nombre
Tipo
Opcional
Descripción
name
string
❌
required field
Retorna
Tip
Tipo:Models
withNotes(notes)
Set the notes attribute
Parámetros
Nombre
Tipo
Opcional
Descripción
notes
string
❌
Retorna
Tip
Tipo:Models
withUrl(url)
Set the url attribute
Parámetros
Nombre
Tipo
Opcional
Descripción
url
string
❌
Retorna
Tip
Tipo:Models
withVersion(version)
Set the version attribute
Parámetros
Nombre
Tipo
Opcional
Descripción
version
string
❌
Retorna
Tip
Tipo:Models
organization_software
This section covers the Software model and the SoftwareFinder class used to create, configure and query hardware software resources associated with an organization.
This class allows making GET requests to the organization device plans resource in the OpenGate North API.
constructor
Parámetros
Nombre
Tipo
Opcional
Descripción
ogapi
InternalOpenGateAPI
❌
Reference to the API object.
administrable()
Marks visibility administrable for organization device plans list retrieval.
ogapi.newDevicePlansFinder().administrable().findByOrganization('organization').then().catch();
Retorna
Tip
Tipo:this
assignable()
Marks visibility assignable for organization device plans list retrieval
ogapi.newDevicePlansFinder().assignable().findByOrganization('organization').then().catch();
Retorna
Tip
Tipo:this
default()
Marks visibility default for organization device plans list list retrieval.
ogapi.newDevicePlansFinder().default().findByOrganization('organization').then().catch();
Retorna
Tip
Tipo:this
findByOrganization(organization)
Retrieves all device plans from a organization
ogapi.newDevicePlansFinder().findByOrganization('organization').then().catch();
Parámetros
Nombre
Tipo
Opcional
Descripción
organization
string
❌
organization name .
Retorna
Tip
Tipo:Promise
findByOrganizationAndId(organization, identifier)
Retrieves a specific device plan from a organization
ogapi.newDevicePlansFinder().findByOrganizationAndId('organization',
'identifier').then().catch();
Parámetros
Nombre
Tipo
Opcional
Descripción
organization
string
❌
organization name .
identifier
string
❌
plan name.
Retorna
Tip
Tipo:Promise
Organization Plans
This is a base object that contains everything you can do with organization plans.
This class allows making GET requests to the organization plans resource in the OpenGate North API.
constructor
Parámetros
Nombre
Tipo
Opcional
Descripción
ogapi
InternalOpenGateAPI
❌
Reference to the API object.
administrable()
Marks visibility administrable for organization plans list retrieval.
ogapi.newOrganizationPlansFinder().administrable().findByOrganization('organization').then().catch();
Retorna
Tip
Tipo:this
assignable()
Marks visibility assignable for organization plans list retrieval
ogapi.newOrganizationPlansFinder().assignable().findByOrganization('organization').then().catch();
Retorna
Tip
Tipo:this
default()
Marks visibility default for plans list list retrieval.
ogapi.newOrganizationPlansFinder().default().findByOrganization('organization').then().catch();
Retorna
Tip
Tipo:this
findByOrganization(organization)
Retrieves all plans from a organization
ogapi.newOrganizationPlansFinder().findByOrganization('organization').then().catch();
Parámetros
Nombre
Tipo
Opcional
Descripción
organization
string
❌
organization name .
Retorna
Tip
Tipo:Promise
findByOrganizationAndId(organization, identifier)
Retrieves a specific plan from a organization
ogapi.newOrganizationPlansFinder().findByOrganizationAndId('organization',
'identifier').then().catch();
This is an abstract class; it must be extended by another class that defines the specific actions of a given
provision. This class is responsible for managing requests to OpenGate North API.
constructor
Constructor
Parámetros
Nombre
Tipo
Opcional
Descripción
ogapi
InternalOpenGateAPI
❌
this is ogapi instance
resource
string
❌
this is a base url resource
timeout
number
✅
timeout on request
requiredParameters
array
❌
serviceBaseURL
string
❌
base of the uri petition
create()
This invoke a request to OpenGate North API and the callback is managed by promises This function creates a
provisioned entity
Retorna
Tip
Tipo:Promise
Ejemplos
ogapi.organizationsBuilder().create()
delete(body)
This invoke a request to OpenGate North API and the callback is managed by promises This function deletes a
provisioned entity
Instead of creating a bulk process, returns the provision process planning for the specified entries. This is a
synchronous process that does not cause changes in the database.
This class allows making GET requests to the countries catalog resource in OpenGate North API.
It needs the _internalCountriesFilter client option, and there is no default. It is built that way on purpose: the catalogue is not an endpoint but an asset entity with
entityType WIRE and an identifier of the form DOMAIN_<domain>, so the caller has to say which
entity to read, the same way it says which api key to use. There is an intention to
replace this with a real catalogue endpoint and drop the option again.
Without it, getCountries() used to die with
Cannot read properties of undefined (reading 'organization'), which said nothing about the
option that was missing.
This class extends SimpleBuilder to allow setting complex values. What is a complex value? It is simply a value
that needs a communications module identifier to be set into the box.
constructor
Constructor
Parámetros
Nombre
Tipo
Opcional
Descripción
ogapi
InternalOpenGateAPI
❌
this is ogapi instance
resource
string
❌
this is the resource url where can be create/delete/update/read the entity
allowedDatastreams
array
✅
Allowed datastreams to add into the new entity
definedSchemas
array
✅
Jsonschema about all OpenGate specific types
jsonSchemaValidator
Validator
✅
Json schema validator tool
withComplex(_id, idCommunicationModules, val)
Set a complex value to entity
Parámetros
Nombre
Tipo
Opcional
Descripción
_id
string
❌
Datastream identifier
idCommunicationModules
string
❌
Communications module identifier
val
object
❌
Value to set.
Csv Bulk Builder
CSV builder. This builder gives you the necessary tools to run a CSV bulk provisioning operation using the
OpenGate REST API.
constructor
Constructor
Parámetros
Nombre
Tipo
Opcional
Descripción
ogapi
InternalOpenGateAPI
❌
required field. This is ogapi instance
organization
string
❌
required field. This is the organization name where entities will be created, updated or deleted
resource
resource
❌
required field. This is the resource used for the bulk provision
timeout
number
✅
timeout in millisecons. The request will have a specific time out if it will be exceeded then the promise throw an exception
async
boolean
✅
forces async execution for the bulk operation
Device Builder
Device builder. This builder gives you the necessary tools to create a device using the OpenGate REST API.
constructor
Constructor
Parámetros
Nombre
Tipo
Opcional
Descripción
ogapi
InternalOpenGateAPI
❌
this is ogapi instance
organization
string
❌
this is the organization name where device will be created
allowedDatastreams
array
✅
Allowed datastreams to add into the new device
definedSchemas
array
✅
Jsonschema about all OpenGate specific types
jsonSchemaValidator
Validator
✅
Json schema validator tool
ms
number
❌
timeout in milliseconds
create()
This invoke a request to OpenGate North API and the callback is managed by promises This function creates a
provisioned entity
Retorna
Tip
Tipo:Promise
Ejemplos
ogapi.organizationsBuilder().create()
update()
This invoke a request to OpenGate North API and the callback is managed by promises This function updates a
provisioned entity and checks whether any subscriber/subscription already exists. If a subscriber/subscription
does not exist, it will be created and then added to the entity box.
Retorna
Tip
Tipo:Promise
Ejemplos
ogapi.entityBuilder.devicesBuilder().update()
Entity Builder
This is a base object that gives you access to everything you can do to provision entities.
constructor
Constructor
Parámetros
Nombre
Tipo
Opcional
Descripción
ogapi
InternalOpenGateAPI
❌
Reference to the API object.
assetsBuilder(organization, timeout)
Get an AssetBuilder to operate with entities of type asset
Get a DeviceBuilder to operate with entities of type device.
It resolves a builder rather than returning one, because the allowed datastreams and their
schemas are read from the platform first. Note that `with()` ignores a datastream the
organization does not allow, warning rather than throwing, so a typo in a datastream name
produces an entity missing that value rather than an error.
A device that the platform will accept needs more than an identifier. This is a create that
works, and every line of it was needed:
The platform rejects an omission one field at a time, so finding this set means a round trip
per missing field:
without `plan`: 400 `0x010E10`, "Device plan is mandatory…"
without `serviceGroup`: 400 `0x010000`, "Required field."
These are not validated here on purpose. The plan message ties the requirement to the
state of the organization, so a client-side rule would refuse calls that other organizations
accept. `provision.device.identifier` is different: it is the entity key, and its absence is
refused locally with `OGAPI_ENTITY_KEY_REQUIRED`.
List the plans an organization actually has with
`ogapi.newDevicePlansFinder().findByOrganization(organization)`.
JSON builder. This builder gives you the necessary tools to run a JSON bulk provisioning operation using the
OpenGate REST API.
constructor
Constructor
Parámetros
Nombre
Tipo
Opcional
Descripción
ogapi
InternalOpenGateAPI
❌
required field. This is ogapi instance
organization
string
❌
required field. This is the organization name where entities will be created, updated or deleted
resource
resource
❌
required field. This is the resource used for the bulk provision
timeout
number
✅
timeout in millisecons. The request will have a specific time out if it will be exceeded then the promise throw an exception
async
boolean
✅
forces async execution for the bulk operation
Json Flattened Bulk Builder
JSON flattened builder. This builder gives you the necessary tools to run a flattened-JSON bulk provisioning
operation using the OpenGate REST API.
constructor
Constructor
Parámetros
Nombre
Tipo
Opcional
Descripción
ogapi
InternalOpenGateAPI
❌
required field. This is ogapi instance
organization
string
❌
required field. This is the organization name where entities will be created, updated or deleted
resource
resource
❌
required field. This is the resource used for the bulk provision
timeout
number
✅
timeout in millisecons. The request will have a specific time out if it will be exceeded then the promise throw an exception
async
boolean
✅
forces async execution for the bulk operation
Simple Builder
This class allows setting simple values.
constructor
Constructor
Parámetros
Nombre
Tipo
Opcional
Descripción
ogapi
InternalOpenGateAPI
❌
this is ogapi instance
resource
string
❌
this is the resource url where can be create/delete/update/read the entity
allowedDatastreams
array
✅
Allowed datastreams to add into the new entity
definedSchemas
array
✅
Jsonschema about all OpenGate specific types
jsonSchemaValidator
Validator
✅
Json schema validator tool
deleteAll()
This invoke a request to OpenGate North API and the callback is managed by promises This function deletes a
provisioned entity
Retorna
Tip
Tipo:Promise
getAllowedDatastreams()
Retorna
Tip
Tipo:array
Allowed Datastream definition array
getEntityKey()
Retorna
Tip
Tipo:string
Entity identifier
patch()
This invoke a request to OpenGate North API and the callback is managed by promises This function patches a
provisioned entity
Retorna
Tip
Tipo:Promise
Ejemplos
ogapi.organizationsBuilder().update()
update()
This invoke a request to OpenGate North API and the callback is managed by promises This function updates a
provisioned entity
Retorna
Tip
Tipo:Promise
Ejemplos
ogapi.organizationsBuilder().update()
with(_id, val)
Set new datastream value
Parámetros
Nombre
Tipo
Opcional
Descripción
_id
string
❌
Datastream identifier
val
objecr
❌
Datastream value. If this value is null then datastream value will be removed.
Subscriber Builder
Subscriber builder. This builder give you the necessary tools to create a subscriber using our OpenGate REST.
constructor
Constructor
Parámetros
Nombre
Tipo
Opcional
Descripción
ogapi
InternalOpenGateAPI
❌
this is ogapi instance
organization
string
❌
this is the organization name where subscriber will be created
allowedDatastreams
array
✅
Allowed datastreams to add into the new subscriber
definedSchemas
array
✅
Jsonschema about all OpenGate specific types
jsonSchemaValidator
Validator
✅
Json schema validator tool
Subscription Builder
Subscription builder. This builder give you the necessary tools to create a subscription using our OpenGate REST.
constructor
Constructor
Parámetros
Nombre
Tipo
Opcional
Descripción
ogapi
InternalOpenGateAPI
❌
this is ogapi instance
organization
string
❌
this is the organization name where subscription will be created
allowedDatastreams
array
✅
Allowed datastreams to add into the new subscription
definedSchemas
array
✅
Jsonschema about all OpenGate specific types
jsonSchemaValidator
Validator
✅
Json schema validator tool
Ticket Builder
Ticket builder. This builder gives you the necessary tools to create a ticket using the OpenGate REST API.
constructor
Constructor
Parámetros
Nombre
Tipo
Opcional
Descripción
ogapi
InternalOpenGateAPI
❌
this is ogapi instance
organization
string
❌
this is the organization name where subscription will be created
allowedDatastreams
array
✅
Allowed datastreams to add into the new subscription
definedSchemas
array
✅
Jsonschema about all OpenGate specific types
jsonSchemaValidator
Validator
✅
Json schema validator tool
Provision Generic Finder
This class allows making GET requests to a resource in the OpenGate North API.
constructor
Constructor
Parámetros
Nombre
Tipo
Opcional
Descripción
ogapi
InternalOpenGateAPI
❌
Reference to the API object.
source
string
❌
Relative url where is located the resource.
reponseJsonData
string
❌
Relative url where is located the resource.
error_not_found
string
❌
String error which will be thrown on not_found error.
provisionProcessors
This section covers the Provision Processors class, for configuring a provision processor’s script and parameters, and the Provision Processors Finder class, for looking up provision processors by organization.
This class extends Search and allows requests to be made to any available resource in the OpenGate North API.
constructor
Constructor
Parámetros
Nombre
Tipo
Opcional
Descripción
ogapi
InternalOpenGateAPI
❌
this is configuration about Opengate North API.
url
string
❌
this define a specific resource to make the search
filter
object
❌
this is the filter
limit
object
❌
this is the pagination about the search
sort
object
❌
this defined parameters to order the result of search
group
object
❌
this defined the group by
execute()
This invokes a request to the OpenGate North API; the response is handled via promises.
Retorna
Tip
Tipo:Promise
Base Search
This is an abstract class that must be extended by another class defining the specific search. This class is
responsible for managing and executing requests to the OpenGate North API.
constructor
Constructor
Parámetros
Nombre
Tipo
Opcional
Descripción
ogapi
InternalOpenGateAPI
❌
this is ogapi instance
resource
string
❌
this is a base url resource
timeout
number
✅
timeout on request
serviceBaseURL
string
❌
base of the uri petition
downloadCsv()
Not implemented yet.
This invoke a request to OpenGate North API and the callback is managed by promises
This invoke a request to OpenGate North API and the callback is managed by promises
Retorna
Tip
Tipo:Promise
execute()
This invokes a request to the OpenGate North API; the response is handled via promises.
Retorna
Tip
Tipo:Promise
executeWithAsyncPaging(resource)
This invokes a request for asynchronous paging to the OpenGate North API; each page is returned via promises and
a notify callback. To cancel the process, return `false` or a string with a custom message from the notify
callback. When the process is canceled, the response will be 403: Forbidden -> {data: 'Cancel
process'|| custom_message, statusCode: 403}
This is an abstract class; it must be extended by another class that defines the specific search. This class is
responsible for managing and executing requests to the OpenGate North API.
constructor
Constructor
Parámetros
Nombre
Tipo
Opcional
Descripción
ogapi
InternalOpenGateAPI
❌
this is ogapi instance
timeout
number
✅
timeout on request
execute()
This invoke a request to OpenGate North API and the callback is managed by promises
This is an abstract class. It is the base class for making all kinds of search requests to the OpenGate North
API.
constructor
Constructor
Parámetros
Nombre
Tipo
Opcional
Descripción
parent
InternalOpenGateAPI
❌
this is ogapi instance
routes
object
❌
this defined the routes. One of those routes must be called on Builder before call build method.
addSortAscendingBy(filterField)
Add ascending param into the sort search object
Parámetros
Nombre
Tipo
Opcional
Descripción
filterField
string
❌
This field must be allowed into the specific resource
Retorna
Tip
Tipo:SearchBuilder
Ejemplos
ogapi.subscriptionsSearchBuilder().addSortAscendingBy('prov.customid') // Order by prov.customid Ascending
addSortBy(filterField, typeSort)
Add ascending/descending param into the sort search object
Parámetros
Nombre
Tipo
Opcional
Descripción
filterField
string
❌
This field must be allowed into the specific resource
typeSort
string
❌
Retorna
Tip
Tipo:SearchBuilder
Ejemplos
ogapi.subscriptionsSearchBuilder().addSortBy('prov.customid','ASCENDING') // Order by prov.customid Ascending
ogapi.devicesSearchBuilder().addSortBy('prov.customid','DESCENDING') // Order by prov.customid Descending
addSortDescendingBy(filterField)
Add descending param into the sort search object
Parámetros
Nombre
Tipo
Opcional
Descripción
filterField
string
❌
This field must be allowed into the specific resource
Retorna
Tip
Tipo:SearchBuilder
Ejemplos
ogapi.devicesSearchBuilder().addSortDescendingBy('prov.customid') // Order by prov.customid Descending
Return a promise which it will contains an array with fields recommended with complete structure
Retorna
Tip
Tipo:Promise
findFieldPath(field)
Return a promise which it will contains an string with the path of a field
Retorna
Tip
Tipo:Promise
findFields(input)
Return a promise which it will contains an array with fields recommended with only identifier
Retorna
Tip
Tipo:Promise
limit(size, start)
Set reponse pagination.
Parámetros
Nombre
Tipo
Opcional
Descripción
size
number
❌
Defined the number of elements on response
start
number
✅
Defined the offset on response
Retorna
Tip
Tipo:SearchBuilder
Ejemplos
ogapi.subscribersSearchBuilder().limit(10) // Without offset
ogapi.subscribersSearchBuilder().limit(25,50) //With offset value 50
removeSortBy(filterField)
Remove sort param from the search object
Parámetros
Nombre
Tipo
Opcional
Descripción
filterField
string
❌
This field must be allowed into the specific resource
Retorna
Tip
Tipo:SearchBuilder
Ejemplos
ogapi.subscriptionsSearchBuilder().removeSortBy('prov.customid') // Remove order by prov.customid
ogapi.subscriptionsSearchBuilder().removeSortBy() // Remove all order by parameters
withTimeout(ms)
The request will have a specific time out if it will be exceeded then the promise throw an exception
This class extends Search and allows requests to be made to any available static resource of the OpenGate North
API.
constructor
Constructor
Parámetros
Nombre
Tipo
Opcional
Descripción
ogapi
InternalOpenGateAPI
❌
this is configuration about Opengate North API.
url
string
❌
this define a specific resource to make the search
filter
object
❌
this is the filter
execute()
This invokes a dummy request to the OpenGate North API; the response is handled via promises.
Retorna
Tip
Tipo:Promise
WP Search
This class extends BaseSearch and allows requests to be made to any available resource in the OpenGate North
API. Use this class when the resource does not have the ‘search’ prefix; otherwise, use the Search class.
constructor
Parámetros
Nombre
Tipo
Opcional
Descripción
ogapi
InternalOpenGateAPI
❌
this is configuration about Opengate North API.
url
string
❌
this define a specific resource to make the search
filter
object
❌
this is the filter
limit
object
❌
this is the pagination about the search
sort
object
❌
this defined parameters to order the result of search
group
object
❌
select
object
❌
timeout
nubmer
❌
security
This section covers the JS API classes for managing certificates (finding, creating, updating) and the base Security provision object.
This class allows making GET requests to the certificate resource in the OpenGate North API.
constructor
Constructor
Parámetros
Nombre
Tipo
Opcional
Descripción
ogapi
InternalOpenGateAPI
❌
Reference to the API object.
findById(id)
Download a specific certificate by id. This execute a GET http method
Parámetros
Nombre
Tipo
Opcional
Descripción
id
string
❌
Id of the certificate.
Retorna
Tip
Tipo:Promise
findByIdAndFormat(id, mimetype)
Download a certificate using id and in a specific format. This execute a GET http method
Parámetros
Nombre
Tipo
Opcional
Descripción
id
string
❌
Id of the certificate.
mimetype
string
❌
Certificate format mimetype.
Retorna
Tip
Tipo:Promise
Certificates
This is a base object that contains everything you can do with Certificates.
constructor
Constructor
Parámetros
Nombre
Tipo
Opcional
Descripción
ogapi
InternalOpenGateAPI
❌
Reference to the API object.
create(rawFile)
This invokes a request to the OpenGate North API, and the callback is managed via promises. This method creates
a certificate element.
Parámetros
Nombre
Tipo
Opcional
Descripción
rawFile
File
❌
this File is the certificate
Retorna
Tip
Tipo:Promise
update()
This invokes a request to the OpenGate North API, and the callback is managed via promises. This method updates
a certificate element.
Retorna
Tip
Tipo:Promise
withAdministrativeState(administrativeState)
Set the administrativeState attribute
Parámetros
Nombre
Tipo
Opcional
Descripción
administrativeState
string
❌
Retorna
Tip
Tipo:Certificates
withDescription(description)
Set the description attribute
Parámetros
Nombre
Tipo
Opcional
Descripción
description
string
❌
optional field
Retorna
Tip
Tipo:Certificates
withDomains(domains)
Set the domains attribute
Parámetros
Nombre
Tipo
Opcional
Descripción
domains
Array
❌
Retorna
Tip
Tipo:Certificates
withId(id)
Set the id attribute
Parámetros
Nombre
Tipo
Opcional
Descripción
id
string
❌
required field on delete
Retorna
Tip
Tipo:Certificates
withName(name)
Set the name attribute
Parámetros
Nombre
Tipo
Opcional
Descripción
name
string
❌
required field
Retorna
Tip
Tipo:Certificates
withParameters(parameters)
Set the parameters attribute
Parámetros
Nombre
Tipo
Opcional
Descripción
parameters
string
❌
optional field
Retorna
Tip
Tipo:Certificates
withTags(tags)
Set the tags attribute
Parámetros
Nombre
Tipo
Opcional
Descripción
tags
Array
❌
Retorna
Tip
Tipo:Certificates
withUsages(usages)
Set the usages attribute
Parámetros
Nombre
Tipo
Opcional
Descripción
usages
Array
❌
Retorna
Tip
Tipo:Certificates
Security
This extends BaseProvision and contains everything you can do with Security.
constructor
Constructor
Parámetros
Nombre
Tipo
Opcional
Descripción
ogapi
InternalOpenGateAPI
❌
this is configuration about Opengate North API.
url
string
❌
this define a specific resource to make the provision
timeseries
This section covers the Timeseries class, for defining and configuring timeseries, and the Timeseries Finder class, for looking up timeseries by organization.
This object represents a timeseries and exposes all the attributes you can configure for it.
constructor
Constructor
Parámetros
Nombre
Tipo
Opcional
Descripción
ogapi
InternalOpenGateAPI
❌
Reference to the API object.
onlyPlan()
Mark timeseries as plan only
Retorna
Tip
Tipo:Timeseries
optimizationPlan()
Request optimization plan
Retorna
Tip
Tipo:Promise
withBucketColumn(bucketColumn)
Name of generated column with bucket date.Required if timeBucket > 0.
Parámetros
Nombre
Tipo
Opcional
Descripción
bucketColumn
string
❌
pattern: ^[a-zA-Z0-9 _-]*$
Retorna
Tip
Tipo:Timeseries
withBucketInitColumn(bucketInitColumn)
Name of generated column with bucket init date.
Parámetros
Nombre
Tipo
Opcional
Descripción
bucketInitColumn
string
❌
pattern: ^[a-zA-Z0-9 _-]*$
Retorna
Tip
Tipo:Timeseries
withColumns(columns)
List of data that is needed for each entity.
Parámetros
Nombre
Tipo
Opcional
Descripción
columns
array
❌
required field
Retorna
Tip
Tipo:Timeseries
withContext(context)
List of data that is needed for each entity.
Parámetros
Nombre
Tipo
Opcional
Descripción
context
array
❌
Retorna
Tip
Tipo:Timeseries
withDescription(description)
Long text to explain timeserie definition
Parámetros
Nombre
Tipo
Opcional
Descripción
description
string
❌
Retorna
Tip
Tipo:Timeseries
withIdentifier(identifier)
Set the identifier attribute
Parámetros
Nombre
Tipo
Opcional
Descripción
identifier
string
❌
required field
Retorna
Tip
Tipo:Timeseries
withIdentifierColumn(identifierColumn)
Set the identifierColumn attribute
Parámetros
Nombre
Tipo
Opcional
Descripción
identifierColumn
string
❌
required field
Retorna
Tip
Tipo:Datasets
withName(name)
Name which will be unique in each organization
Parámetros
Nombre
Tipo
Opcional
Descripción
name
string
❌
required field
Retorna
Tip
Tipo:Timeseries
withOrganization(organization)
Set the organization attribute
Parámetros
Nombre
Tipo
Opcional
Descripción
organization
string
❌
required field
Retorna
Tip
Tipo:Timeseries
withOrigin(origin)
Initial date to first bucket with ISO date time format. Next bucket will be calcullated from this date. Default value is created date with time equals 00:00:00.000Z
Parámetros
Nombre
Tipo
Opcional
Descripción
origin
string
❌
Retorna
Tip
Tipo:Timeseries
withRetention(retention)
Time that a row is stored to be got in searching. Default value is 1 month
Parámetros
Nombre
Tipo
Opcional
Descripción
retention
number
❌
Retorna
Tip
Tipo:Timeseries
withSorts(sorts)
List of sorting fields
Parámetros
Nombre
Tipo
Opcional
Descripción
sorts
array
❌
required field
Retorna
Tip
Tipo:Timeseries
withTimeBucket(timeBucket)
Duration of buckets in seconds.
Parámetros
Nombre
Tipo
Opcional
Descripción
timeBucket
integer
❌
required field
Retorna
Tip
Tipo:Timeseries
Timeseries Finder
This class performs GET requests against the timeseries resource in the OpenGate North API.
Performs a get that returns a definition of timeserie
Parámetros
Nombre
Tipo
Opcional
Descripción
organization
string
❌
organization
timeserieId
string
❌
timeserie identifier
Retorna
Tip
Tipo:Promise
timeseriesFunctionsCatalog
This section covers the JS API classes for the timeseries functions catalog: finding timeseries functions, configuring the TimeseriesFunction object, and the TimeseriesFunctionsHelper utility.
Performs a get that returns a timeseries function metadata
Parámetros
Nombre
Tipo
Opcional
Descripción
organization
string
❌
organization
name
string
❌
Timeseries function Configuration name
script
boolean
❌
If true script content will be downloaded
Retorna
Tip
Tipo:Promise
Timeseries Functions Helper
This class allows making GET requests to the TimeseriesFunctionsHelper resource in the OpenGate North API.
constructor
Constructor
Parámetros
Nombre
Tipo
Opcional
Descripción
ogapi
InternalOpenGateAPI
❌
Reference to the API object.
getDocJavascriptFunctions()
Performs a GET that returns documentation of JavaScript functions from the rules service.
Retorna
Tip
Tipo:Promise
getDocPrivateJavascriptFunctions()
Performs a GET that returns documentation of private JavaScript functions from the rules service.
Retorna
Tip
Tipo:Promise
users
This section covers the User class, for managing account attributes and authentication actions, and the User Finder class, for looking up users by email.
This invoke a request to OpenGate North API and the callback is managed by promises
This function get a JWT for user with Two Factor Authorithation (optional)
This invoke a request to OpenGate North API and the callback is managed by promises
This function request for new password when the user forgets it.
Sends a password recovery email
Cancels the request. Works before `end()` too, in which case it never leaves.
Retorna
Tip
Tipo:RequestSpec
accept(type)
Sets Accept, accepting the same shorthands.
Parámetros
Nombre
Tipo
Opcional
Descripción
type
string
❌
Retorna
Tip
Tipo:RequestSpec
addEventListener(event, callback)
component-emitter's alias for `on`, which is what superagent's browser request carries.
Missed on the first pass because the surface was enumerated from client.js source text, and
component-emitter mixes its methods in at runtime rather than assigning them there. Caught in
review by Chema.
Parámetros
Nombre
Tipo
Opcional
Descripción
event
string
❌
callback
function
❌
Retorna
Tip
Tipo:RequestSpec
addListener(event, callback)
superagent's alias for `on` in Node, where the request is an EventEmitter.
Parámetros
Nombre
Tipo
Opcional
Descripción
event
string
❌
callback
function
❌
Retorna
Tip
Tipo:RequestSpec
agent()
Inert: there is no Node HTTP agent to configure.
attach(name, file, options)
Adds a multipart file. A string is a path, as it was under superagent.
Parámetros
Nombre
Tipo
Opcional
Descripción
name
string
❌
file
*
❌
options
`(string
object)=`
❌
Retorna
Tip
Tipo:RequestSpec
auth(user, pass, options)
Sets an Authorization header. Basic by default, as in a browser; `{ type: 'bearer' }` sends
the first argument as a token.
Parámetros
Nombre
Tipo
Opcional
Descripción
user
string
❌
pass
`(string
object)=`
❌
options
object=
❌
Retorna
Tip
Tipo:RequestSpec
buffer()
Inert: buffering was a Node response concern.
ca()
Inert: TLS material belonged to the Node agent.
cert()
Inert: TLS material belonged to the Node agent.
clearTimeout()
Cancels the timers without cancelling the request.
Retorna
Tip
Tipo:RequestSpec
emit(event)
Parámetros
Nombre
Tipo
Opcional
Descripción
event
string
❌
args
...*
❌
Retorna
Tip
Tipo:boolean
whether anything was listening.
end(callback)
Sends the request.
Parámetros
Nombre
Tipo
Opcional
Descripción
callback
function
❌
`(error, response)`, superagent's signature.
Retorna
Tip
Tipo:RequestSpec
eventNames()
Retorna
Tip
Tipo:Array<string>
the events with at least one listener.
field(name, value)
Adds a plain multipart field.
Parámetros
Nombre
Tipo
Opcional
Descripción
name
string
❌
value
*
❌
Retorna
Tip
Tipo:RequestSpec
get(field)
Reads a header back, case-insensitively.
Parámetros
Nombre
Tipo
Opcional
Descripción
field
string
❌
Retorna
Tip
Tipo:*
getHeader(field)
superagent's alias for `get`.
Parámetros
Nombre
Tipo
Opcional
Descripción
field
string
❌
Retorna
Tip
Tipo:*
getMaxListeners()
Inert, for symmetry with setMaxListeners.
Retorna
Tip
Tipo:number
hasListeners(event)
component-emitter's own predicate.
Parámetros
Nombre
Tipo
Opcional
Descripción
event
string
❌
Retorna
Tip
Tipo:boolean
whether anything is listening.
key()
Inert: TLS material belonged to the Node agent.
listenerCount(event)
Parámetros
Nombre
Tipo
Opcional
Descripción
event
string
❌
Retorna
Tip
Tipo:number
listeners(event)
Parámetros
Nombre
Tipo
Opcional
Descripción
event
string
❌
Retorna
Tip
Tipo:Array<function>
maxResponseSize()
Inert: the response is read whole, as it was in a browser.
off(event, callback)
Removes one listener, or every listener for the event when no function is given – which is
what component-emitter's `off(event)` did.
Parámetros
Nombre
Tipo
Opcional
Descripción
event
string
❌
callback
function=
❌
Retorna
Tip
Tipo:RequestSpec
ok(fn)
Overrides what counts as a successful response.
Parámetros
Nombre
Tipo
Opcional
Descripción
fn
function
❌
receives the response, returns whether to resolve.
Retorna
Tip
Tipo:RequestSpec
on(event, callback)
Parámetros
Nombre
Tipo
Opcional
Descripción
event
string
❌
callback
function
❌
Retorna
Tip
Tipo:RequestSpec
once(event, callback)
Parámetros
Nombre
Tipo
Opcional
Descripción
event
string
❌
callback
function
❌
Retorna
Tip
Tipo:RequestSpec
parse(fn)
Replaces the parser used on the response body.
Parámetros
Nombre
Tipo
Opcional
Descripción
fn
function
❌
receives the response text, returns the body.
Retorna
Tip
Tipo:RequestSpec
pfx()
Inert: TLS material belonged to the Node agent.
prependListener(event, callback)
Parámetros
Nombre
Tipo
Opcional
Descripción
event
string
❌
callback
function
❌
Retorna
Tip
Tipo:RequestSpec
prependOnceListener(event, callback)
Parámetros
Nombre
Tipo
Opcional
Descripción
event
string
❌
callback
function
❌
Retorna
Tip
Tipo:RequestSpec
query(value)
Appends to the query string. Takes an object or an already-encoded string.
Parámetros
Nombre
Tipo
Opcional
Descripción
value
`(string
object)`
❌
Retorna
Tip
Tipo:RequestSpec
rawListeners(event)
superagent's alias for `listeners`.
Parámetros
Nombre
Tipo
Opcional
Descripción
event
string
❌
Retorna
Tip
Tipo:Array<function>
redirects()
Inert: XHR and fetch always follow redirects; superagent could not disable that in a browser.
removeAllListeners(event)
Parámetros
Nombre
Tipo
Opcional
Descripción
event
string=
❌
every event when omitted.
Retorna
Tip
Tipo:RequestSpec
removeEventListener(event, callback)
component-emitter's alias for `off`.
Parámetros
Nombre
Tipo
Opcional
Descripción
event
string
❌
callback
function=
❌
Retorna
Tip
Tipo:RequestSpec
removeListener(event, callback)
superagent's alias for `off`.
Parámetros
Nombre
Tipo
Opcional
Descripción
event
string
❌
callback
function=
❌
Retorna
Tip
Tipo:RequestSpec
responseType(type)
Parámetros
Nombre
Tipo
Opcional
Descripción
type
string
❌
`blob` is the only value the library uses.
Retorna
Tip
Tipo:RequestSpec
retry()
Inert: retrying is not reproduced, because half a retry policy is worse than none.
send(data)
Attaches a body, and picks the Content-Type the way superagent did – at this point, not at
send time, so a `hooks.beforeStart` callback reading `get('Content-Type')` sees what it
always saw. Repeated calls merge.
Parámetros
Nombre
Tipo
Opcional
Descripción
data
*
❌
Retorna
Tip
Tipo:RequestSpec
serialize(fn)
Replaces the serializer used for an object body.
Parámetros
Nombre
Tipo
Opcional
Descripción
fn
function
❌
receives the body, returns a string.
Retorna
Tip
Tipo:RequestSpec
set(field, value)
Sets one header, or every header in an object.
Parámetros
Nombre
Tipo
Opcional
Descripción
field
`(string
object)`
❌
value
*
❌
Retorna
Tip
Tipo:RequestSpec
itself, for chaining.
setMaxListeners()
Inert: there is no listener ceiling to raise.
Retorna
Tip
Tipo:RequestSpec
sortQuery()
Inert: the query string is built by the caller, in order.
timeout(options)
Sets the deadline for the whole request, or `{ deadline, response }` for both that and the
time allowed before a response starts arriving.
Parámetros
Nombre
Tipo
Opcional
Descripción
options
`(number
object)`
❌
Retorna
Tip
Tipo:RequestSpec
toJSON()
Retorna
Tip
Tipo:object
the request as data, as superagent's `toJSON` did.
To initialize the client using a token_jwt with a .env file.
Create a .env file with the following content: TOKEN_JWT="token_jwt"
Load the environment variable and initialize the client:
client = OpenGateClient()
By default, if you use OpenGateClient without parameters, and you set the environment variable TOKEN_JWT, OpenGateClient will be created with this value. If you want to use TOKEN_JWT from environment, you may delete the OPENGATE_API_KEY environment variable.
Basic use with environment variables
The most professional way to initialize the client is by using standard environment variables. If you set these, you can simply call OpenGateClient():
Basic use of token_jwt with an environment variable
To initialize the client using a token_jwt from an environment variable, you can set the token_jwt directly in your environment without relying on a .env:
Create environment variable
On UNIX systems, use:
export TOKEN_JWT="token_jwt"
On Windows, use:
set TOKEN_JWT="token_jwt"
Initialize the client.
client = OpenGateClient()
Similar to the previous example, if you use OpenGateClient without parameters, and you set the environment variable TOKEN_JWT, OpenGateClient will be created with this value. If you want to use TOKEN_JWT from environment, you may delete API_KEY variable environment.
Basic use without url for services K8s
To initialize the OpenGateClient without specifying a URL, you can either omit the url parameter or set it to None.
Similar to the previous examples, you have the option to provide the api_key directly, set it to None, or omit it altogether. If you choose to omit it, the client will automatically retrieve the api_key from the environment variable if it is set. Additionally, you can also authenticate using a username and password by specifying those credentials instead.
Features
The library consists of the following modules:
IA
Models
Pipelines
Transformers
Collection
Collection
Bulk Collection
Pandas Collection
Provision
Asset
Bulk
Devices
Processor
Rules
Rules
Searching
Alarms
Datapoints
Data sets
Entities
Operations
Rules
Timeseries
File Connector
File Connector
Basic Examples of the OpenGate-Data Modules
The unit tests double as usage examples: opengate_data/test/unit/ holds one
directory per module, each showing the configurations and use cases of its
builders.
License
This project is licensed under the Apache License 2.0.
This method allows you to specify the path where the output file will be saved.
It is particularly useful for operations that involve downloading or saving files.
Arguments:
output_file_pathstr - The path where the output file will be saved.
Returns:
AIModelsBuilder - The instance of the AIModelsBuilder class.
Example:
builder.with_output_file_path("rute/prueba.onnx")
create
defcreate() ->"AIModelsBuilder"
Initiates the creation process of a new model.
This method prepares the AIModelsBuilder instance to create a new model by setting up the necessary parameters such as the organization name and the file to be associated with the model.
Returns:
AIModelsBuilder - The instance of the AIModelsBuilder class itself, allowing for method chaining.
This method sets up the AIModelsBuilder instance to make a prediction using a specific model associated with the specified organization and identifier.
Returns:
AIModelsBuilder - The instance of the AIModelsBuilder class itself, allowing for method chaining.
Selects the operation that writes the model identifier into a
configuration file.
It stores the identifier given to with_identifier() under the section
and key named with with_config_file(), so a later run can pick the
model up from the file instead of carrying its identifier in the code.
The key must already exist in the file.
Returns:
AIModelsBuilder - Returns itself to allow for method chaining.
Selects the operation that writes the model identifier into the .env
file.
It stores the identifier given to with_identifier() under the variable
named with with_env(), so a later run can pick the model up from the
environment. The variable must already exist in the .env file.
Returns:
AIModelsBuilder - Returns itself to allow for method chaining.
Raises:
ValueError - If the variable is not in the .env file.
Finalizes the construction of the IoT collection configuration.
This method prepares the builder to execute the collection by ensuring all necessary configurations are set and validates the overall integrity of the build. It should be called before executing the collection to ensure that the configuration is complete and valid.
The build process involves checking that mandatory fields such as the device identifier are set. It also ensures that method calls that are incompatible with each other (like build and build_execute) are not both used.
Returns:
AIModelsBuilder - Returns itself to allow for method chaining, enabling further actions like execute.
Raises:
ValueError - If required configurations are missing or if incompatible methods are used together.
Example:
builder.build()
build_execute
defbuild_execute()
Executes the data sets search immediately after building the configuration.
This method is a shortcut that combines building and executing in a single step.
Returns:
dict - A dictionary containing the execution response which includes the status code and potentially other metadata about the execution.
Raises:
ValueError - If build has already been called on this builder instance.
Example:
builder.build_execute()
execute
defexecute() -> Response
Execute the configured operation and return the response.
This method executes the operation that has been configured using the builder pattern. It ensures that the build method has been called and that it is the last method invoked before execute. Depending on the configured method (e.g., create, find, update, delete), it calls the appropriate internal execution method.
Returns:
requests.Response - The response object from the executed request.
Raises:
Exception - If the build method has not been called or if it is not the last method invoked before execute.
ValueError - If the configured method is unsupported.
This method prepares the builder to execute the collection by ensuring all necessary configurations are set and validates the overall integrity of the build. It should be called before executing the collection to ensure that the configuration is complete and valid.
The build process involves checking that mandatory fields such as the device identifier are set. It also ensures that method calls that are incompatible with each other (like build and build_execute) are not both used.
Returns:
AIPipelinesBuilder - Returns itself to allow for method chaining, enabling further actions like execute.
Raises:
ValueError - If required configurations are missing or if incompatible methods are used together.
Notes:
This method should be used as a final step before execute to prepare the operations search configuration. It does not modify the state but ensures that the builder’s state is ready for execution.
Example:
builder.build()
build_execute
defbuild_execute()
Executes the data sets search immediately after building the configuration.
This method is a shortcut that combines building and executing in a single step.
Returns:
dict - A dictionary containing the execution response which includes the status code and potentially other metadata about the execution.
Raises:
ValueError - If build has already been called on this builder instance.
Example:
builder.build_execute()
create
defcreate() ->"AIPipelinesBuilder"
Creates a new pipeline.
This method prepares the request to create a new pipeline using the specified configuration in the object. It is necessary to define the name (with_name) and actions (add_action) before calling this method.
Returns:
AIPipelinesBuilder - Returns the same object to allow method chaining.
This method prepares the request to find a specific pipeline based on its identifier. The identifier is obtained automatically if not explicitly defined or can be obtained from a configuration file or environment variables.
Returns:
AIPipelinesBuilder - Returns the same object to allow method chaining.
This method prepares the request to update an existing pipeline. It is necessary to define the organization’s name (with_organization_name) and the pipeline’s name (with_name) before calling this method.
Returns:
AIPipelinesBuilder - Returns the same object to allow method chaining.
This method prepares the request to delete an existing pipeline. It is necessary to define the organization’s name (with_organization_name) and the pipeline’s identifier (with_identifier) before calling this method.
Returns:
AIPipelinesBuilder - Returns the same object to allow method chaining.
This method prepares the request to perform a prediction using the model associated with the specified pipeline. It is necessary to define the organization’s name (with_organization_name), the pipeline’s identifier (with_identifier), and provide prediction data (with_prediction) before calling this method.
Returns:
AIPipelinesBuilder - Returns the same object to allow method chaining.
This method sets up the AIPipelinesBuilder instance to save the configuration of a model associated with the specified organization. It configures the URL endpoint for the save operation and sets the operation type to ‘save’.
Returns:
AIPipelinesBuilder - The instance of the AIModelsBuilder class itself, allowing for method chaining.
Selects the operation that writes the pipeline identifier into a
configuration file.
It stores the identifier given to with_identifier() under the section
and key named with with_config_file(), so a later run can pick the
pipeline up from the file instead of carrying its identifier in the code.
The key must already exist in the file.
Returns:
AIPipelinesBuilder - Returns itself to allow for method chaining.
Selects the operation that writes the pipeline identifier into the
.env file.
It stores the identifier given to with_identifier() under the variable
named with with_env(), so a later run can pick the pipeline up from the
environment. The variable must already exist in the .env file.
Returns:
AIPipelinesBuilder - Returns itself to allow for method chaining.
Raises:
ValueError - If the variable is not in the .env file.
Execute the configured operation and return the response.
This method executes the operation that has been configured using the builder pattern. It ensures that the build method has been called and that it is the last method invoked before execute. Depending on the configured method (e.g., create, find, update, delete), it calls the appropriate internal execution method.
Returns:
requests.Response - The response object from the executed request.
Raises:
Exception - If the build method has not been called or if it is not the last method invoked before execute.
ValueError - If the configured method is unsupported.
This method allows specifying one or more files to be included in the transformer resource being created. The content type for each file can be specified if needed.
Arguments:
file_pathstr - Full path to the file to add.
filetypestr, optional - Content type of the file. Defaults to None, meaning the content type will be automatically inferred.
Returns:
AITransformersBuilder - Returns the current instance to allow method chaining.
This method allows you to specify the path where the output file will be saved.
It is particularly useful for operations that involve downloading or saving files.
Arguments:
output_file_pathstr - The path where the output file will be saved.
Returns:
AITransformersBuilder - The instance of the AIModelsBuilder class.
This method allows you to specify the name of the file that will be used in operations such as download or evaluation. It is particularly useful when working with specific files that require unique identifiers or names for processing.
Arguments:
file_namestr - The name of the file to be processed.
Returns:
AITransformersBuilder - Returns self for chaining.
Example:
builder.with_file_name('pkl_encoder.pkl')
create
defcreate() ->"AITransformersBuilder"
Prepares the creation of the transformer resource.
Returns:
AITransformersBuilder - Returns the current instance to allow method chaining.
Searches for a single transformer resource by its identifier.
This method prepares the request to find a specific transformer based on its identifier. The identifier is obtained automatically if not explicitly defined or can be obtained from a configuration file or environment variables.
Returns:
AITransformersBuilder - Returns the current instance to allow method chaining.
This method prepares the URL and HTTP method necessary to send a PUT request to the API to update an existing transformer. It is necessary to configure the relevant attributes of the AITransformersBuilder instance, including the identifier of the transformer to update, before calling this method.
Returns:
AITransformersBuilder - Returns the current instance to allow method chaining.
This method prepares the URL and HTTP method necessary to send a DELETE request to the API to delete an existing transformer. It is necessary to configure the identifier attribute of the AITransformersBuilder instance before calling this method.
Returns:
AITransformersBuilder - Returns the current instance to allow method chaining.
This method sets up the AIModelsBuilder instance to download the file of a specific model associated with the specified organization and identifier. It configures the URL endpoint for the download operation and sets the operation type to ‘download’.
Returns:
AITransformersBuilder - The instance of the AIModelsBuilder class itself, allowing for method chaining.
Prepares the evaluation of the transformer with provided data.
This method sets up the URL and method for evaluating the transformer using the provided data. The evaluation data should be set using the with_evaluate method before calling this method.
Returns:
AITransformersBuilder - Returns the current instance to allow method chaining.
This method prepares the URL and method for saving the transformer configuration. It checks if the identifier is set from the environment or configuration file and then either updates or creates the transformer accordingly.
Returns:
AITransformersBuilder - Returns the current instance to allow method chaining.
Sets the transformer identifier in the configuration file.
This method sets the transformer identifier in the specified configuration file. It reads the configuration file, updates the identifier, and writes the changes back to the file.
Returns:
AITransformersBuilder - Returns the current instance to allow method chaining.
Selects the operation that writes the transformer identifier into the
.env file.
It stores the identifier held by the builder under the variable named
with with_env(), so a later run can pick the transformer up from the
environment. The variable must already exist in the .env file.
Returns:
AITransformersBuilder - Returns itself to allow for method chaining.
Raises:
ValueError - If the variable is not in the .env file.
Finalizes the construction of the IoT collection configuration.
This method prepares the builder to execute the collection by ensuring all necessary configurations are set and validates the overall integrity of the build. It should be called before executing the collection to ensure that the configuration is complete and valid.
The build process involves checking that mandatory fields such as the device identifier are set. It also ensures that method calls that are incompatible with each other (like build and build_execute) are not both used.
Returns:
AITransformersBuilder - Returns itself to allow for method chaining, enabling further actions like execute.
Raises:
ValueError - If required configurations are missing or if incompatible methods are used together.
Example:
builder.build()
build_execute
defbuild_execute()
Executes the data sets search immediately after building the configuration.
This method is a shortcut that combines building and executing in a single step.
Returns:
dict - A dictionary containing the execution response which includes the status code and potentially other metadata about the execution.
Raises:
ValueError - If build has already been called on this builder instance.
Example:
builder.build_execute()
execute
defexecute() -> requests.Response
Sends the selected operation to the platform.
Which request goes out depends on the operation chosen in the chain:
create, find, update, delete, download, evaluate, save, or resolving the
identifier from a configuration file or from the environment.
Returns:
requests.Response | dict | str: Whatever the selected operation
produces — the transformer payload, the contents of a downloaded
file, or a dict carrying status_code and either data or error.
Raises:
ValueError - If no operation was selected in the chain.
Multiple datastreams can be grouped under a single identifier
Arguments:
device_idstr - The identifier of the device the datapoints belong to.
datastream_idstr - The identifier for the datastream to which the datapoints will be added.
datapointslist[tuple[int | float | bool | dict | list, None | datetime | int, None | datetime | int]] - A list of tuples where each tuple
represents a datapoint. Each tuple contains the datapoint value and an optional timestamp (‘at’):
value - Collected value
at - Number with the time in miliseconds from epoch of the measurement. If this field is None, the platform will assign the server current time to the datapoint whe data is received.
feedstr | None - The feed to collect the datapoints under. Optional.
Returns:
IotBulkCollectionBuilder - Returns itself to allow for method chaining.
Multiple datastreams can be grouped under a single identifier
Arguments:
device_idstr - The identifier of the device the datapoints belong to.
datastream_idstr - The identifier for the datastream to which the datapoints will be added.
datapointslist[tuple[int | float | bool | dict, None | datetime | int, None | datetime | int]] - A list of tuples where each tuple
represents a datapoint. Each tuple contains the datapoint value and an optional timestamp (‘at’) (‘from):
value - Collected value
at - Number with the time in miliseconds from epoch of the measurement. If this field is None, the platform will assign the server current time to the datapoint whe data is received.
from - Number with the time in miliseconds from epoch of the start period of measurement. This indicates that value is the same within this time interval (from, at).
feedstr | None - The feed to collect the datapoints under. Optional.
Returns:
IotBulkCollectionBuilder - Returns itself to allow for method chaining.
Processes a DataFrame to extract device, data and datapoints, and adds them to the payload.
Arguments:
dfpd.DataFrame - The DataFrame containing the device data and datapoints. The DataFrame
is expected to have columns that match the expected structure for device
datastreams and datapoints.
Returns:
IotBulkCollectionBuilder - Returns itself to allow for method chaining.
deffrom_spreadsheet(
path: str, sheet_name_index: int | str) ->"IotBulkCollectionBuilder"
Loads data from a spreadsheet, processes it, and adds the resulting device data and datapoints
to the payload. This method is particularly useful for bulk data operations where data is
stored in spreadsheet format.
Arguments:
pathstr - The file path to the spreadsheet to load.
sheet_name_indexint | str - The sheet name or index to load from the spreadsheet.
Returns:
IotBulkCollectionBuilder - Returns itself to allow for method chaining.
Finalizes the construction of the entities search configuration.
This method prepares the builder to execute the collection by ensuring all necessary configurations are set and validates the overall integrity of the build. It should be called before executing the collection to ensure that the configuration is complete and valid.
The build process involves checking that mandatory fields such as the device identifier are set. It also ensures that method calls that are incompatible with each other (like build and build_execute) are not both used.
Returns:
IotBulkCollectionBuilder - Returns itself to allow for method chaining, enabling further actions like execute.
Raises:
ValueError - If required configurations are missing or if incompatible methods are used together.
Example:
builder.build()
build_execute
defbuild_execute(include_payload=False)
This method is a shortcut that combines building and executing in a single step.
Arguments:
include_payloadbool - Whether the response should carry the payload that was sent. Defaults to False.
Returns:
dict - A dictionary containing the execution response which includes the status code and potentially other metadata about the execution.
Raises:
ValueError - If build has already been called on this builder instance.
This method is used to retrieve the entire payload that has been constructed by the builder. The payload
includes all devices, their respective datastreams, and the datapoints that have been added to each datastream.
This is particularly useful for inspecting the current state of the payload after all configurations and
additions have been made, but before any execution actions (like sending data to a server) are taken.
Returns:
dict - A dictionary representing the current state of the payload within the IotBulkCollectionBuilder.
This dictionary includes all devices, datastreams, and datapoints that have been configured.
Raises:
Exception - If the build method was not called before this method.
Example:
builder.to_dict()
execute
defexecute(include_payload=False)
Executes the IoT collection based on the current configuration of the builder.
Arguments:
include_payloadbool - Determine if the payload should be included in the response.
Returns:
dict - A dictionary containing the results of the execution, including success messages for each device ID
if the data was successfully sent, or error messages detailing what went wrong.
Raises:
Exception - If build() has not been called before execute(), or if it was not the last method invoked prior to execute().
Indicates that a validation of the Trusted_boot type is required, it is not necessary to enter the value of the field but if you enter it,
the entire message received by the platform will compare the value of TrustedBoot with the provisioned value, if they are different
the message will not be collected.
Add the trustedboot to the constructor and validates the type.
Arguments:
trustedbootstr - The unique identifier for the device.
Returns:
IotCollectionBuilder - Returns itself to allow for method chaining.
Multiple datastreams can be grouped under a single identifier
Arguments:
datastream_idstr - The identifier for the datastream to which the datapoints will be added.
datapointslist[tuple[int | float | bool | dict | list, None | datetime | int, None | datetime | int]] - A list of tuples where each tuple
represents a datapoint. Each tuple contains the datapoint value and an optional timestamp (‘at’):
value - Collected value
at - Number with the time in miliseconds from epoch of the measurement. If this field is None, the platform will assign the server current time to the datapoint whe data is received.
feedstr | None - The feed to collect the datapoints under. Optional.
Returns:
IotCollectionBuilder - Returns itself to allow for method chaining.
Multiple datastreams can be grouped under a single identifier
Arguments:
datastream_idstr - The identifier for the datastream to which the datapoints will be added.
datapointslist[tuple[int | float | bool | dict, None | datetime | int, None | datetime | int]] - A list of tuples where each tuple
represents a datapoint. Each tuple contains the datapoint value and an optional timestamp (‘at’) (‘from):
value - Collected value
at - Number with the time in miliseconds from epoch of the measurement. If this field is None, the platform will assign the server current time to the datapoint whe data is received.
from - Number with the time in miliseconds from epoch of the start period of measurement. This indicates that value is the same within this time interval (from, at).
feedstr | None - The feed to collect the datapoints under. Optional.
Returns:
IotCollectionBuilder - Returns itself to allow for method chaining.
Constructs the collection configuration from a dictionary input.
This method dynamically applies builder methods based on the keys in the input dictionary. It should be used after the build() method has been called to ensure that the builder is in a proper state to accept configuration from a dictionary.
Arguments:
payloaddict[str, Any] - The dictionary containing the configuration Args.
Returns:
IotCollectionBuilder - Returns itself to allow for method chaining.
Raises:
ValueError - If required keys are missing in the payload or if the ‘datastreams’ field is empty.
Finalizes the construction of the IoT collection configuration.
This method prepares the builder to execute the collection by ensuring all necessary configurations are set and validates the overall integrity of the build. It should be called before executing the collection to ensure that the configuration is complete and valid.
The build process involves checking that mandatory fields such as the device identifier are set. It also ensures that method calls that are incompatible with each other (like build and build_execute) are not both used.
Returns:
IotCollectionBuilder - Returns itself to allow for method chaining, enabling further actions like execute.
Raises:
ValueError - If required configurations are missing or if incompatible methods are used together.
Notes:
This method should be used as a final step before execute to prepare the IoT collection configuration. It does not modify the state but ensures that the builder’s state is ready for execution.
Example:
builder.build()
to_dict
defto_dict() -> dict
This method is used to retrieve the entire payload that has been constructed by the builder. The payload
includes all devices, their respective datastreams, and the datapoints that have been added to each datastream.
This is particularly useful for inspecting the current state of the payload after all configurations and
additions have been made, but before any execution actions (like sending data to a server) are taken.
Returns:
dict - A dictionary representing the current state of the payload within the IotCollectionBuilder.
This dictionary includes all devices, datastreams, and datapoints that have been configured.
Raises:
Exception - If the build() method was not called before this method.
Example:
builder.build().to_dict()
build_execute
defbuild_execute(include_payload: bool =False)
Executes the IoT collection immediately after building the configuration.
This method is a shortcut that combines building and executing in a single step. It should be used when you want to build and execute the configuration without modifying the builder state in between these operations.
It first validates the build configuration and then executes the collection if the validation is successful.
Arguments:
include_payloadbool - Determine if the payload should be included in the response.
Returns:
dict - A dictionary containing the execution response which includes the status code and potentially other metadata about the execution.
Raises:
ValueError - If build has already been called on this builder instance, indicating that build_execute is being incorrectly used after build.
Exception - If there are issues during the execution process, including network or API errors.
Executes the IoT collection based on the current configuration of the builder.
Arguments:
include_payloadbool - Determine if the payload should be included in the response.
Returns:
Dict - A dictionary containing the execution response which includes the status code and,
optionally, the payload. If an error occurs, a string describing the error is returned.
Raises:
Exception - If build() has not been called before execute(), or if it was not the last method invoked prior to execute().
Set the input DataFrame that contains the IoT data to process.
The DataFrame must include a ‘device_id’ and ‘at’ column. Additional columns are considered
as potential datastream values. If ‘at’ is empty or None, a timestamp will be assigned.
Arguments:
dfpd.DataFrame - The DataFrame with ‘device_id’ and ‘at’ columns.
Returns:
PandasIotCollectionBuilder - The current builder instance.
Raises:
Exception - If ‘device_id’ or ‘at’ column is missing in the DataFrame.
Specify the columns from the DataFrame that should be included as datastreams in the IoT payload.
If this method is not called, all available datastream columns (except required/optional ones) are used.
If it is called, only the specified columns will be considered.
Arguments:
columnslist[str] - The list of column names to include as datastreams.
Returns:
PandasIotCollectionBuilder - The current builder instance.
Raises:
Exception - If any specified column does not exist in the DataFrame.
Set the maximum number of bytes per request for IoT collection.
This controls how the payload is batched when sending to the endpoint.
Arguments:
max_bytesint - The maximum request size in bytes.
Returns:
PandasIotCollectionBuilder - The current builder instance.
build
defbuild() ->"PandasIotCollectionBuilder"
Build the request payload after the DataFrame and columns have been configured.
This method processes the DataFrame, converting columns into the appropriate IoT datastream format.
It must be called before execute() if not using build_execute().
Returns:
PandasIotCollectionBuilder - The current builder instance.
Raises:
Exception - If build() and build_execute() are used together.
Execute the request after building it with build() or build_execute().
If include_payload is True, it returns a JSON string with the payload and results.
Otherwise, it returns a pandas DataFrame with a status column summarizing the results.
Arguments:
include_payloadbool - Whether to include the payload in the result. Defaults to False.
Returns:
Union[str, pd.DataFrame]: The result of the IoT collection request.
Raises:
Exception - If the required method invocation order is not respected.
Reads a value from the INI and saves it as a source. ‘prefer’ controls whether the value will be interpreted as identifier, name, or auto (first id, then name).
Arguments:
config_filestr - Path to the INI file to read.
sectionstr - The section of the INI file the value lives in.
config_keystr - The key holding the value.
preferstr - How to read the value: ‘identifier’, ’name’, or ‘auto’ to try the identifier first and fall back to the name. Defaults to ‘auto’.
Searches for a single dataset resource by its identifier.
This method prepares the request to find a specific dataset based on its identifier. The identifier is obtained automatically if not explicitly defined or can be obtained from a configuration file or environment variables.
Returns:
FindDatasetsBuilder - Returns the current instance to allow method chaining.
Finalizes the construction of the IoT collection configuration.
This method prepares the builder to execute the collection by ensuring all necessary configurations are set and validates the overall integrity of the build. It should be called before executing the collection to ensure that the configuration is complete and valid.
The build process involves checking that mandatory fields such as the device identifier are set. It also ensures that method calls that are incompatible with each other (like build and build_execute) are not both used.
Returns:
FindDatasetsBuilder - Returns itself to allow for method chaining, enabling further actions like execute.
Raises:
ValueError - If required configurations are missing or if incompatible methods are used together.
Example:
builder.build()
build_execute
defbuild_execute()
Executes the data sets search immediately after building the configuration.
This method is a shortcut that combines building and executing in a single step.
Returns:
dict - A dictionary containing the execution response which includes the status code and potentially other metadata about the execution.
Raises:
ValueError - If build has already been called on this builder instance.
Example:
builder.build_execute()
execute
defexecute() -> Response
Execute the configured operation and return the response.
This method executes the operation that has been configured using the builder pattern. It ensures that the build method has been called and that it is the last method invoked before execute. Depending on the configured method (e.g., create, find, update, delete), it calls the appropriate internal execution method.
Returns:
requests.Response - The response object from the executed request.
Raises:
Exception - If the build method has not been called or if it is not the last method invoked before execute.
ValueError - If the configured method is unsupported.
The provided list can include one or more filesystem paths. They will be
appended to the same internal collection used by add_local_file, so you
can freely combine both methods:
NOTE: if you mix from_dataframe with setters in download (path/filenames/output_path),
then you must use all THREE setters; if not, use only from_dataframe.
Arguments:
dfpandas.DataFrame - The DataFrame holding the files to upload.
defaultsdict | None - Values to fall back on when a row leaves a
column out: “destiny_path”, “path”, “overwrite” and “output_path”.
upload
defupload() ->"FileConnectorBuilder"
Configures the builder to upload a file to the specified organization.
This method sets the internal state of the builder to prepare for a file upload operation. It does not execute the operation immediately but prepares the necessary configurations for when the execute method is called.
Returns:
FileConnectorBuilder - Returns itself to allow for method chaining.
Example:
builder.upload()
list_all
deflist_all() ->"FileConnectorBuilder"
Configures the builder to list files available in the specified organization.
This method sets the internal state of the builder to prepare for a file listing operation. It does not execute the operation immediately but prepares the necessary configurations for when the execute method is called.
Returns:
FileConnectorBuilder - Returns itself to allow for method chaining.
Example:
builder.list_all()
list_one
deflist_one() ->"FileConnectorBuilder"
Configures the builder to list a single file from the specified organization.
This method sets the internal state of the builder to prepare for a single file listing operation. It does not execute the operation immediately but prepares the necessary configurations for when the execute method is called.
Returns:
FileConnectorBuilder - Returns itself to allow for method chaining.
Example:
builder.list_one()
download
defdownload() ->"FileConnectorBuilder"
Configures the builder to download a file from the specified organization.
This method sets the internal state of the builder to prepare for a file download operation. It does not execute the operation immediately but prepares the necessary configurations for when the execute method is called.
Returns:
FileConnectorBuilder - Returns itself to allow for method chaining.
Example:
builder.download()
delete
defdelete() ->"FileConnectorBuilder"
Selects the operation that deletes files from the file connector.
Requires with_destiny_path(). Name the files to remove with
add_remote_file() or add_remote_multiple_files(); with none named,
the whole path is deleted.
Returns:
FileConnectorBuilder - Returns itself to allow for method chaining.
Sends the selected operation to the file connector.
Which request goes out depends on the operation chosen in the chain:
upload(), list_all(), list_one(), download() or delete(). The
two listing operations default to the “dict” format when
with_format() was not called.
Returns:
requests.Response | dict | str | pandas.DataFrame: The listing in
the requested format, the contents of a download, or a dict carrying
status_code and either data or error.
Raises:
RuntimeError - If build() was not the last call before execute(),
or if neither build() nor build_execute() was called.
ValueError - If no operation was selected in the chain.
This method sets up the ProvisionDeviceBuilder instance to update a specific device associated with the specified organization and identifier.
You can update a device with a flattened format sending a PUT request using the URL above. You must replace {identifier} with the identifier of the device you want to update. Also, it is sent a boolean parameter, flattened, to allow sending a flattened JSON format
Returns:
ProvisionDeviceBuilder - The instance of the ProvisionDeviceBuilder class itself, allowing for method chaining.
Finalizes the construction of the device configuration.
This method prepares the builder to execute the collection by ensuring all necessary configurations are set and validates the overall integrity of the build. It should be called before executing the collection to ensure that the configuration is complete and valid.
The build process involves checking that mandatory fields such as the device identifier are set. It also ensures that method calls that are incompatible with each other (like build and build_execute) are not both used.
Returns:
ProvisionDeviceBuilder - Returns itself to allow for method chaining, enabling further actions like execute.
Raises:
ValueError - If required configurations are missing or if incompatible methods are used together.
Example:
builder.build()
build_execute
defbuild_execute()
Executes the data sets search immediately after building the configuration.
This method is a shortcut that combines building and executing in a single step.
Returns:
dict - A dictionary containing the execution response which includes the status code and potentially other metadata about the execution.
Raises:
ValueError - If build has already been called on this builder instance.
Example:
builder.build_execute()
execute
defexecute() -> str | dict[str, str | int]
Execute the configured device and return the response.
This method executes the operation that has been configured using the builder pattern. It ensures that the build method has been called and that it is the last method invoked before execute. Depending on the configured method (e.g., create, find, update, delete), it calls the appropriate internal execution method.
Returns:
requests.Response - The response object from the executed request.
Raises:
Exception - If the build method has not been called or if it is not the last method invoked before execute.
ValueError - If the configured method is unsupported.
Example:
builder.execute()
opengate_data.provision.devices
opengate_data.provision.bulk.provision_bulk
ProvisionBulkBuilder Objects
classProvisionBulkBuilder()
Provision Bulk Builder
Provisions many entities in a single request, which is the way to go when a
per-entity call would mean thousands of them. The payload can come from a
file — from_json(), from_csv(), from_excel() — or from memory, with
from_dataframe() or from_dict().
with_bulk_action() chooses what to do with the rows — CREATE by default,
UPDATE, PATCH or DELETE — and with_bulk_type() what they are, ENTITIES by
default or TICKETS. Close the chain with build() and execute(), or with
build_execute().
Finalizes the construction of the provision bulk configuration.
This method prepares the builder to execute the request by ensuring all necessary configurations are set and validates the overall integrity of the build. It should be called before executing the request to ensure that the configuration is complete and valid.
The build process involves checking that mandatory fields such as the organization name are set. It also ensures that method calls that are incompatible with each other (like build and build_execute) are not both used.
Returns:
ProvisionBulkBuilder - Returns itself to allow for method chaining, enabling further actions like execute.
Raises:
ValueError - If required configurations are missing or if incompatible methods are used together.
Example:
builder.build()
build_execute
defbuild_execute(include_payload=False)
Executes the provision bulk immediately after building the configuration.
This method is a shortcut that combines building and executing in a single step. It should be used when you want to build and execute the configuration without modifying the builder state in between these operations.
It first validates the build configuration and then executes the request if the validation is successful.
Arguments:
include_payloadbool - Determine if the payload should be included in the response.
Returns:
dict - A dictionary containing the execution response which includes the status code and potentially other metadata about the execution.
Raises:
ValueError - If build has already been called on this builder instance, indicating that build_execute is being incorrectly used after build.
Exception - If there are issues during the execution process, including network or API errors.
Example:
response = builder.build_execute()
execute
defexecute(include_payload=False)
Executes the provision bulk based on the current configuration of the builder.
Arguments:
include_payloadbool - Determine if the payload should be included in the response.
Returns:
Dict - A dictionary containing the execution response which includes the status code and,
optionally, the payload. If an error occurs, a string describing the error is returned.
Raises:
Exception - If build() has not been called before execute(), or if it was not the last method invoked prior to execute().
Finalizes the construction of the IoT collection configuration.
This method prepares the builder to execute the collection by ensuring all necessary configurations are set and validates the overall integrity of the build. It should be called before executing the collection to ensure that the configuration is complete and valid.
The build process involves checking that mandatory fields such as the device identifier are set. It also ensures that method calls that are incompatible with each other (like build and build_execute) are not both used.
Returns:
ProvisionProcessorBuilder - Returns itself to allow for method chaining, enabling further actions like execute.
Raises:
ValueError - If required configurations are missing or if incompatible methods are used together.
Example:
builder.build()
build_execute
defbuild_execute()
Executes the data sets search immediately after building the configuration.
This method is a shortcut that combines building and executing in a single step.
Returns:
dict - A dictionary containing the execution response which includes the status code and potentially other metadata about the execution.
Raises:
ValueError - If build has already been called on this builder instance.
Example:
builder.build_execute()
execute
defexecute() -> requests.Response
Execute the configured operation and return the response.
This method executes the operation that has been configured using the builder pattern. It ensures that the build method has been called and that it is the last method invoked before execute. Depending on the configured method (e.g., create, find, update, delete), it calls the appropriate internal execution method.
Returns:
requests.Response - The response object from the executed request.
Raises:
Exception - If the build method has not been called or if it is not the last method invoked before execute.
ValueError - If the configured method is unsupported.
Example:
builder.build_execute()
opengate_data.provision.asset.provision_asset
ProvisionAssetBuilder Objects
classProvisionAssetBuilder()
Provision Asset Builder
Provisions assets: creates them, reads one, updates and deletes. Describe
the asset with the with_provision_* setters and
add_provision_datastream_value(), or hand over a whole payload with
from_dict() or from_dataframe(). Then pick the operation — create(),
find_one(), update(), delete() — and close the chain with build()
and execute(), or with build_execute().
This method sets up the ProvisionAssetBuilder instance to update a specific asset associated with the specified organization and identifier.
You can update an asset with a flattened format sending a PUT request using the URL above. You must replace {identifier} with the identifier of the asset you want to update. Also, it is sent a boolean parameter, flattened, to allow sending a flattened JSON format
Returns:
ProvisionAssetBuilder - The instance of the ProvisionAssetBuilder class itself, allowing for method chaining.
This method sets up the ProvisionAssetBuilder instance to update a specific asset associated with the specified organization and identifier.
You can update an asset with a flattened format sending a Patch request using the URL above. You must replace {identifier} with the identifier of the asset you want to update. Also, it is sent a boolean parameter, flattened, to allow sending a flattened JSON format
Returns:
ProvisionAssetBuilder - The instance of the ProvisionAssetBuilder class itself, allowing for method chaining.
Finalizes the construction of the asset configuration.
This method prepares the builder to execute the collection by ensuring all necessary configurations are set and validates the overall integrity of the build. It should be called before executing the collection to ensure that the configuration is complete and valid.
The build process involves checking that mandatory fields such as the device identifier are set. It also ensures that method calls that are incompatible with each other (like build and build_execute) are not both used.
Returns:
ProvisionAssetBuilder - Returns itself to allow for method chaining, enabling further actions like execute.
Raises:
ValueError - If required configurations are missing or if incompatible methods are used together.
Example:
builder.build()
build_execute
defbuild_execute()
Executes the data sets search immediately after building the configuration.
This method is a shortcut that combines building and executing in a single step.
Returns:
dict - A dictionary containing the execution response which includes the status code and potentially other metadata about the execution.
Raises:
ValueError - If build has already been called on this builder instance.
Example:
builder.build_execute()
execute
defexecute() -> str | dict[str, str | int]
Execute the configured asset and return the response.
This method executes the operation that has been configured using the builder pattern. It ensures that the build method has been called and that it is the last method invoked before execute. Depending on the configured method (e.g., create, find, update, delete), it calls the appropriate internal execution method.
Returns:
requests.Response - The response object from the executed request.
Raises:
Exception - If the build method has not been called or if it is not the last method invoked before execute.
ValueError - If the configured method is unsupported.
Waiting threshold before actions are executed. Allows cancellation of the execution of actions if another rule exists with a subsequent delay cancellation action.
Specify the condition for the rule.
Mandatory for EASY mode and not applicable for ADVANCED mode.
JSON filter which follows the same filter structure of the Opengate platform.
It can contain rule parameters.
Arguments:
conditiondict - Specify the identifier for the rule.
This method prepares the RulesBuilder instance to create a new model by setting up the necessary parameters such as the organization name and the file to be associated with the model. It also specifies the URL endpoint for creating the model and sets the operation type to ‘create’.
Returns:
RulesBuilder - The instance of the RulesBuilder class itself, allowing for method chaining.
This method sets up the RulesBuilder instance to delete a specific model associated with the specified organization and identifier. It configures the URL endpoint for the delete operation and sets the operation type to ‘delete’.
Returns:
RulesBuilder - The instance of the RulesBuilder class itself, allowing for method chaining.
This function prepares the RulesBuilder instance to retrieve the catalog of rules
Returns:
RulesBuilder - The RulesBuilder instance itself, allowing method chaining.
Example:
builder.catalog()
save
defsave() ->"RulesBuilder"
Selects the create-or-update operation.
It reads the rule identifier from the .env variable set with
with_env(), or from the file set with with_config_file(), and then
decides on its own: if a rule with that identifier already exists it is
updated, and if it does not, it is created and the resulting identifier
written back to the same place. Use it when a script has to be safe to
run more than once.
Returns:
RulesBuilder - Returns itself to allow for method chaining.
Selects the operation that writes the rule identifier into a
configuration file.
It stores the identifier given to with_identifier() under the section
and key named with with_config_file(), so a later run can pick the rule
up from the file instead of carrying its identifier in the code. The key
must already exist in the file.
Returns:
RulesBuilder - Returns itself to allow for method chaining.
Selects the operation that writes the rule identifier into the .env
file.
It stores the identifier given to with_identifier() under the variable
named with with_env(), so a later run can pick the rule up from the
environment. The variable must already exist in the .env file.
Returns:
RulesBuilder - Returns itself to allow for method chaining.
Raises:
ValueError - If there is no identifier to write, or if the variable
is not in the .env file.
Finalizes the construction of the IoT collection configuration.
This method prepares the builder to execute the collection by ensuring all necessary configurations are set and validates the overall integrity of the build. It should be called before executing the collection to ensure that the configuration is complete and valid.
The build process involves checking that mandatory fields such as the device identifier are set. It also ensures that method calls that are incompatible with each other (like build and build_execute) are not both used.
Returns:
RulesBuilder - Returns itself to allow for method chaining, enabling further actions like execute.
Raises:
ValueError - If required configurations are missing or if incompatible methods are used together.
Example:
builder.build()
build_execute
defbuild_execute()
Executes the data sets search immediately after building the configuration.
This method is a shortcut that combines building and executing in a single step.
Returns:
dict - A dictionary containing the execution response which includes the status code and potentially other metadata about the execution.
Raises:
ValueError - If build has already been called on this builder instance.
Example:
builder.build_execute()
execute
defexecute()
Execute the configured operation and return the response.
This method executes the operation that has been configured using the builder pattern. It ensures that the build method has been called and that it is the last method invoked before execute. Depending on the configured method (e.g., create, find, update, delete), it calls the appropriate internal execution method.
Returns:
requests.Response - The response object from the executed request.
Raises:
Exception - If the build method has not been called or if it is not the last method invoked before execute.
ValueError - If the configured method is unsupported.
Example:
builder.execute()
opengate_data.rules
Searching
opengate_data.searching.filter
FilterBuilder Objects
classFilterBuilder(Expressions)
Filter Builder
and_
defand_(*conditions)
Combines conditions using the logical AND operator.
Arguments:
*conditions - The conditions to combine.
Returns:
FilterBuilder - Returns itself to allow for method chaining.
Searches the alarms raised by the platform’s rules, over
/v80/search/entities/alarms. Compose the query with the inherited
with_filter, with_select, with_limit and with_format methods, then
close it with build() and execute(), or with build_execute().
The value must be the identifier of one of the sorts declared in the
dataset definition “sorts” section (the auto-generated reverse sorts are
also valid). When omitted, results are sorted by the identifier column
ascending.
The sort is sent in the payload for every format. NOTE: the platform
currently ignores the sort for ‘csv’ and ‘pandas’ exports (a
server/database limitation, not an SDK decision); it is still sent so
the SDK stays forward-compatible if the backend starts honoring it.
Arguments:
sortstr - The sort identifier declared in the dataset definition.
Returns:
DatasetsSearchBuilder - Returns itself to allow for method chaining.
Deprecated for datasets. The dataset search API no longer accepts the
object-based sort format; sorts are now declared in the dataset
definition and referenced by identifier.
Raises:
NotImplementedError - Always. Use with_sort() instead.
execute
defexecute()
Executes the data set search based on the built configuration.
Returns:
dict, csv or dataframe: The response data in the specified format.
Raises:
Exception - If the build() method was not called before execute().
This function allows the data returned by the search to be transposed, meaning that rows and columns are swapped. This can be useful for certain data analyses where it is preferred to have datastreams as columns and entities as rows.
Notes:
This function can only be used with the ‘pandas’ format.
Returns:
DataPointsSearchBuilder - Returns the builder instance to allow for method chaining.
Enables transposing the data with a specific mapping.
This function allows the data returned by the search
to be transposed and mapped according to a provided mapping dictionary.
The mapping specifies how complex data should be transformed into flat columns.
Arguments:
mappingdict[str, dict[str, str]] - The mapping of complex data to flat
columns. The main key is the column name, and its value another
dictionary defining the mapping of the substructures.
Notes:
This function can only be used with the ‘pandas’ format.
Returns:
DataPointsSearchBuilder - Returns the builder instance to allow for method chaining.
Execute the configured operation and return the response.
This method executes the operation that has been configured using the builder pattern.
It ensures that the build method has been called and that it is the last method invoked before execute.
Depending on the configured method (e.g., create, find, update, delete),
it calls the appropriate internal execution method.
Returns:
requests.Response - The response object from the executed request.
Raises:
Exception:
If the build method has not been called or if it is not the last method invoked before execute.
ValueError - If the configured method is unsupported.
Exports the data of a timeseries to a file — Parquet unless you ask for
another content type — and reports the state of an export already running.
Both operations work over the same endpoint,
/v80/timeseries/provision/organizations/{organization}/{identifier}/export:
export() starts one with a POST, export_status() asks about it with a
GET.
Pick the operation, then close the chain with build() and execute(), or
with build_execute(). Only one export per timeseries can run at a time.
To read rows instead of exporting them, use
client.new_timeseries_search_builder().
Not supported for the Parquet export. The export endpoint decides the
output order internally and cannot be changed, and any ‘sort’ field in
the payload makes the platform reject the request as “Json is malformed”.
To read timeseries data in a given order, use the search builder instead:
client.new_timeseries_search_builder().with_sort(""),
where the identifier is one of the sorts declared in the timeseries
definition (or its automatically exposed reverse). Note that sorting is
also disabled server-side for CSV output.
Raises:
NotImplementedError - Always.
export
defexport() ->"TimeseriesBuilder"
Selects the operation that starts an export of the timeseries data.
Returns:
TimeseriesBuilder - Returns itself to allow for method chaining.
dict[str, Any]: Always carries status_code, plus data on success
or error with the response body on failure. For export(), 202
means the export was accepted and runs in the background, 204 that
the timeseries holds no data, and 409 that another process is
already exporting it. For export_status(), 200 carries the parsed
state of the export; a 406 is retried for up to 20 seconds before
being returned.
Raises:
Exception - If build() or build_execute() was not called first.
Reads a value from the INI and saves it as a source. ‘prefer’ controls whether the value will be interpreted as identifier, name, or auto (first id, then name).
Arguments:
config_filestr - Path to the INI file to read.
sectionstr - The section of the INI file the value lives in.
config_keystr - The key holding the value.
preferstr - How to read the value: ‘identifier’, ’name’, or ‘auto’ to try the identifier first and fall back to the name. Defaults to ‘auto’.
Searches for a single timeseries resource by its identifier.
This method prepares the request to find a specific timeseries based on its identifier. The identifier is obtained automatically if not explicitly defined or can be obtained from a configuration file or environment variables.
Returns:
FindTimeseriesBuilder - Returns the current instance to allow method chaining.
Finalizes the construction of the IoT collection configuration.
This method prepares the builder to execute the collection by ensuring all necessary configurations are set and validates the overall integrity of the build. It should be called before executing the collection to ensure that the configuration is complete and valid.
The build process involves checking that mandatory fields such as the device identifier are set. It also ensures that method calls that are incompatible with each other (like build and build_execute) are not both used.
Returns:
FindTimeseriesBuilder - Returns itself to allow for method chaining, enabling further actions like execute.
Raises:
ValueError - If required configurations are missing or if incompatible methods are used together.
Example:
builder.build()
build_execute
defbuild_execute()
Executes the timeseries search immediately after building the configuration.
This method is a shortcut that combines building and executing in a single step.
Returns:
dict - A dictionary containing the execution response which includes the status code and potentially other metadata about the execution.
Raises:
ValueError - If build has already been called on this builder instance.
Example:
builder.build_execute()
execute
defexecute() -> Response
Execute the configured operation and return the response.
This method executes the operation that has been configured using the builder pattern. It ensures that the build method has been called and that it is the last method invoked before execute. Depending on the configured method (e.g., create, find, update, delete), it calls the appropriate internal execution method.
Returns:
requests.Response - The response object from the executed request.
Raises:
Exception - If the build method has not been called or if it is not the last method invoked before execute.
ValueError - If the configured method is unsupported.
Example:
builder.execute()
opengate_data.timeseries
Utils
opengate_data.utils.expressions
Expressions Objects
classExpressions()
Expressions
The filter conditions a search accepts, as static methods returning plain
dicts: eq, neq, like, gt, lt, gte, lte, in_, nin and
exists. FilterBuilder extends this class, so in practice you reach them
through client.new_filter_builder() and combine them with and_ / or_
before calling build().
Validates that the given variable is of the expected type or types.
This function checks if the variable matches the expected type or any type in a tuple of expected types.
It raises a TypeError if the variable does not match the expected type(s).
Arguments:
variableAny - The variable to be checked.
expected_typeAny - The expected type or a tuple of expected types.
variable_namestr - The name of the variable, used in the error message to identify the variable.
Raises:
TypeError - If the variable is not of the expected type(s).
Returns:
None - This function does not return a value; it raises an exception if the type check fails.
set_method_call
defset_method_call(method)
Decorates a method to ensure it is properly registered and tracked within the builder’s workflow.
This decorator adds the method’s name to a set that tracks method calls
Arguments:
methodfunction - The method to be decorated.
Returns:
function - The wrapped method with added functionality to register its call.
Raises:
None - This decorator does not raise exceptions by itself but ensures the method call is registered.
parse_json
defparse_json(value)
Attempts to convert a string into a Python object by interpreting it as JSON.
Arguments:
valuestr | Any - The value to attempt to convert. If the value is not a string,
it is returned directly without attempting conversion.
Returns:
Any - The Python object resulting from the JSON conversion if value is a valid JSON string.
If the conversion fails due to a formatting error (ValueError), the original value is returned.
If value is not a string, it is returned as is.
This function processes the HTTP response and returns a dictionary containing the status code. If the response indicates an error, it also includes the error message.
Arguments:
responserequests.Response - The response object to process.
Returns:
dict[str, Any]: A dictionary containing the status code and, if applicable, the error message.
Turn a failed HTTP response into the dictionary the builders return.
Nothing is raised: the caller gets the status code and, when the platform
sent one, the body as the error.
Arguments:
responserequests.Response - The response object to process.
Returns:
dict[str, Any]: The status code and, if the response carried a body,
the error.
handle_exception
defhandle_exception(e)
Turn a transport failure into the dictionary the builders return.
A request that never reached the platform has no status code, so the
result names the kind of failure instead: connection, timeout, request or
unexpected.
Arguments:
eException - The exception raised while sending the request.
Returns:
dict[str, str]: The kind of failure and its details.
Check that a chain was closed properly before execute() runs.
Every builder has to be closed with build() or with build_execute(),
and build() has to be the last call before execute() — otherwise a
setter called after it would never be validated.
Arguments:
method_callslist[str] - The methods called on the builder, in order.
Raises:
Exception - If build() was called more than once, if it was not the
last call before execute(), or if neither build() nor
build_execute() was called.
Generic builder validator with messages intended for the end user.
The two alias maps exist so the errors name what the caller wrote, not the
internals: without them a missing with_destiny_path() would be reported
as a missing ‘path’.
Arguments:
methodstr - The operation selected in the chain, which picks its
entry in the spec.
statedict - The current value of each field of the builder, by
internal name.
specdict - The rules per operation: ‘required’ and ‘forbidden’ field
names, ‘choices’ mapping a field to its allowed values, and
‘custom’ holding extra checks called with the state.
used_methodslist[str] | None - The methods called on the builder, in
order. Needed to catch two operations in the same chain.
allowed_method_callsset[str] | None - The method names that select an
operation, of which a chain may use exactly one, once.
field_aliasesdict[str, str] | None - Maps internal fields to public
setter names (e.g., ‘path’ → ‘with_path’).
method_aliasesdict[str, str] | None - Maps logical method names to
public method names (e.g., ’list_one’ → ’list_one()’).
Raises:
RuntimeError - If the chain combines several operations, or repeats one.
ValueError - If no operation was selected, if it is not in the spec, or
if the state misses a required field, carries a forbidden one, or
holds a value outside its choices.
Build request headers starting from client headers (auth preserved)
and optionally overriding Accept / Content-Type.
This function NEVER mutates client headers.
Arguments:
client_headersdict | None - The headers of the client, holding the
authentication. They are copied, never modified.
acceptstr | None - The Accept header to set. Left untouched if None.
content_typestr | None - The Content-Type header to set. Left
untouched if None.
Returns:
dict - A new set of headers.
opengate_data.utils
OpenGate UX
OpenGate UX
Exploring OpenGate UX Web Console
Discover the powerful and user-friendly OpenGate UX Web Console, a critical aspect of the OpenGate IoT Platform developed by amplía))) soluciones. Our UX team designs this web console to offer seamless interaction with the OpenGate API, providing an extensive range of features and tools to enhance your IoT experience. The console covers every aspect of IoT management and analysis from the initial Login to complex Analytics and Device Emulation.
Explore diverse Workspaces with customizable Dashboards featuring a variety of Widgets from advanced BIM/IFC Widgets to insightful Charts and Maps. Delve into detailed Entity Details, manage multiple entities through comprehensive Listings, and harness the power of Wizards for simplified administration and operations. The console also includes a robust Administration section for efficiently managing entities, organizations, and user settings. With the Devices Emulator, simulate real-world scenarios and utilize Analytics for advanced data analysis and predictive modelling. Lastly, ensure optimal system functionality with Operation System Support, keeping track of entities, notices, and incidents.
The OpenGate UX Web Console is your gateway to mastering IoT operations, offering an intuitive and comprehensive environment for managing the full spectrum of IoT tasks and challenges.
From the login window, you have the option to enter the website, for which you will need to provide a username and a password.
Within the login window, you can choose which area of the portal you wish to access, among the following:
Workspaces and Dashboards
OpenGate Web Administration
Operations Support System
Device Simulator
URL Immutability
You can access the web by copying a URL that identifies a dashboard or section of the website.
If you don’t have an active session at that moment, you will be directed to the login screen to start your session.
Once your session is initiated, the web won’t redirect you to the home page; instead, it will take you to the dashboard or website section indicated in the URL.
Two Factor
Should the user have two-factor authentication enabled, a second step will appear where you will need to enter the validation digits.
Lost Password
The website offers two mechanisms for password recovery in case it is forgotten or has expired.
Forgotten/Recovery of Password
By clicking on the Have you forgotten your password? link on the login page, you will be directed to a form where you will be asked to provide an email address to which a password recovery email will be sent.
The received email will contain a link directing you to a page where you can reset your password:
Change Due to Expired Password
If the validity of the password has expired, instead of allowing you to enter the website, the login process will direct you to a form where you can reset the password.
Workspaces
The first thing we encounter when entering the web platform is the workspaces landing page. A workspace is used to group our dashboards.
In the workspaces landing page you will see the sections below:
favourite dashboards groups all dashboards marked as favourite. Only will be displayed if favourites found.
workspaces displays workspaces marked to show in home and others shared with user/organization. Collaborative workspace shows dashboards shared with user/organization.
all dashboards were you can search any dashboard and access to it directly
Workspaces can be displayed in 3 different modes:
grid where the user can organize the dashboards
carousel dashboards will be displayed in a carousel (no user configuration required)
list dashboards will appears in a list showing its metadata on mouse over (no user configuration required)
Creating a Workspace
There are two ways to create a workspace:
Click on the ‘NEW WORKSPACE’ button.
Access the workspaces and dashboards menu, and click on the ‘+ New workspace’ button.
Configuration
You can:
Give it a name and description and choose an identifying icon. Also you can assign a banner image and select if you want to hide workspace in home.
Enable/disable different actions that can be performed within the context of the workspace. This will determine which wizards are accessible from the various workspace menus and their dashboards.
Redirect actions to a specific wizard, as long as more than one wizard can perform that action.
Manage the templates that will be used within the workspace’s context.
Once you have created your workspace, you can start creating your panels with their various widgets.
Actions
+ New Dashboard: Create a new dashboard
Menú actions:
Share: Share the workspace with another user or with the entire organization. From here, you can also stop sharing the workspace if it is already shared with another person or organization
Export workspace: Export the workspace in zip format. It will contain a JSON file with the workspace configurations that you can later import. You can also configure which elements to export from the workspace.
Import dashboard: Import a dashboard into the workspace
Delete dashboards: Delete the selected dashboards
Delete: Delete the workspace.
Information: Information about the workspace
Reload: Reload the workspace
Reorganize: Reorganize the view of dashboards
Edit: Open the workspace editing wizard
From the home view, you can also perform various actions such as exporting and importing workspaces, configuring certain data related to your user and organization, viewing notifications, and accessing various sections of the web: Opengate Web Management, Operations Support System, Devices emulator, and Analytics.
The following details these actions.
Export/Import Workspaces
The web has the capability to export and import workspaces.
Export
From the actions menu of the home, select the Export workspaces option.
A panel will appear that allows you to export the workspaces in zip format. It will contain a JSON file with the workspace configurations that you can later import. You can also configure which elements to export from the workspace.
Import
From the actions menu of the home, select the Import workspaces option.
A panel will appear that allows you to import workspaces. You can also configure which elements to import from the workspaces to import.
Web Preferences
User Data
From the actions menu, clicking on the user’s icon will allow you to access a panel that allows you to modify your user’s data:
Edit: Displays information related to our user
Password: from here, you can modify your password
Actions to Perform on Workspaces in the Home
Organize View
You can organize the order of workspaces:
Quick Access to Workspaces
Notifications
You can view notifications related to operations executed in your organization, as well as the progress of bulk operations and their CSV downloads. You can also view (and copy) requests made against the platform.
These notifications can be activated to notify you as soon as any changes occur in any of the sections.
Operations
You can view operations executed in your organization or only those performed by you.
You can also view information about the executions performed in each of the operations.
Bulk
You can view the progress of the bulk operations executed in your organization.
You can also access the list of bulk operations and download the response of the bulk operation.
CSV
You can view the progress of CSV downloads performed on the web.
Requests
You can view the different requests made to the Opengate platform.
You can also copy these requests in CURL format.
Dashboards are spaces where we group and organize the widgets we need for our work.
Creating a Dashboard
Similar to workspaces, there are two ways to create a dashboard:
In the menu of our workspace, click on the ‘+ New Dashboard’ button.
Access the workspace and dashboard menu, select your workspace, and click on the ‘New Dashboard’ button.
Dashboard Configuration
You can:
Give it a name and description and configure the card that will be displayed in the workspace.
Choose an identifying icon, either from our icon catalog or by uploading one from your computer.
Add an image for better identification in workspaces and/or banner image.
Configure the behavior of your widgets within the dashboard:
Set the refresh interval that will be applied to all widgets. By default, the value is “MANUAL,” and it will only refresh through user interaction with the dashboard.
Set the minimum dimensions for widgets contained in the dashboard.
Once the website is created, it will display a blank dashboard where you can add all the widgets you need.
It also contains a side menu from which you can access the various wizards you added when creating the workspace (under the “ACTIONS” tab) as well as the dashboard’s own actions:
Some of the actions you can perform include:
Add widget: Puts the dashboard in editing mode and opens the widget selection panel.
Actions:
Fullscreen: Displays the dashboard in full-screen mode.
Capture screen: Takes a screenshot of the dashboard.
Delete: Deletes the dashboard.
Reload: Refreshes all widgets contained in the dashboard.
Edit: Edit the dashboard to add widgets.
Configuration: Opens the dashboard editing wizard.
Favourite: Sets de favourite flag in dashboard in order to show in the favourite dashboards section.
The rest of the actions, such as Share, Clone, Move, Information, are explained below.
The “Save as template” action is explained in the “Templates” section.
Export/Import a Dashboard
The website has the capability to export and import dashboards.
Export
In the dashboard’s actions menu, select the “Export dashboard” option.
A panel will appear that allows you to export a dashboard in zip format. It will contain a JSON file with the dashboard’s configuration that you can later import into a workspace.
Import
In the options menu of the workspace where you want to load the dashboard, select the “Import dashboard” option.
A panel will appear that allows you to import a dashboard.
Share a Dashboard
You can share your dashboards with other users within your own organization.
In the dashboard’s actions menu, select the “Share” option.
Choose whom you want to share the dashboard with: a single person within your organization or with your entire organization. From here, you can also stop sharing the dashboard if it is already shared with another person or organization.
Move Dashboard
You can move dashboards between different workspaces.
In the dashboard’s actions menu, select the “Move” option.
Select the workspace to which you want to move the dashboard.
Clone Dashboard
You can clone a dashboard into another workspace.
In the dashboard’s actions menu, select the “Clone” option.
Select the workspace to which you want to move the dashboard.
Information
For quick access to dashboard information.
In the dashboard’s actions menu, select the “Information” option.
The BIM/IFC widget allows you to configure a 3D model under the BIM/IFC standard and add sensors to the desired elements of the model.
How it Works
The widget displays the selected model, covering the widget area. To the left of the widget is a panel with available actions, and to the right are listed the selected and monitored elements.
Actions Panel
With the Actions Panel, you can:
All elements displays a list of all elements in the model, allowing you to search and select an element quickly
Show/Hide list allows you to show/hide the right panel of elements
Highlight elements will select all preconfigured elements from the right panel in the model
Capture an image downloads a snapshot of only the model in its current state
Create clipping plane enables the option to select an element in the model to create a cutting layer that allows you to cut the model and see elements inside
Remove clipping plane removes the selected cutting layer
Enable/disable clipping planes activates/deactivates the cutting layers without needing to remove and add
Clear cache and reload clears the cache and reloads the image to return it to its initial state
Elements Panel
With the Elements Panel, you can select an element to highlight it in the model for more precise location.
States are also represented here as established by the configured code.
Configuration
General
Boxed: widget will be displayed with background in dahsboard.
About: widget description in Markdown format.
Title: widget title. It can be configured to remain fixed in the widget or only be displayed when it receives focus.
Toolbar: configures the behavior of the widget bar on the dashboard, allowing you to hide it, hide it when not in use, or leave it always visible.
Refresh Frequency: allows configuring the data refresh frequency displayed in the list.
Extra actions: allows user to add new specific actions to the widget with your own code.
You can add a new one by pressing the New button.
Once you added a custom action it can be modified later by pressing the name in the list.
In order to remove the custom action click the delete icon button on the right.
In extra actions you can write your own code were you can open other dashboards, entities dashboards or execute wizards.
You can find all available functions and methods in Extra Information
Organization files allows you to select a file to add to our widget
Preview here, you can see the loaded model and preselect those elements you want to highlight/monitor
In the preview panel, the following actions are found:
[…The actions are similar to the Actions Panel section…]
Items Tab
From here, you can alter the values of the elements selected in the model preview:
Express ID allows you to modify the ID of the selected element if it has changed in the model
Alias you can assign an alternative display name
Code Tab
Here, you configure the logic needed for the identification of different values and to display them on the elements of the model.
IMPORTANT NOTE: Whenever code is modified, it must be evaluated to save the changes
Function
Depending of the configuration receives the following parameters:
entityData contains the data of the opened entity
NOTE: only available when the user opens an entity dashboard template
Promise -> allows easy execution of multiple promises
http -> javascript encapsulation of a useFetch (Nuxt 4) instance doc. Returns { data, error, status, refresh, clear } where data and error are reactive Refs.
alert -> alert navigator method
setValueToItem -> Sets a value to the selected item
setValueToItem(itemID, alias, value [,style, datetime, deviceId, datastreamId])
/**
* Logic:
* 1. Queries a sample of maximum 50 entities.
* 2. Calculates the average of the `device.powersupply.battery.charge` values.
* 3. Update "VentanaPrincipal" value with the average.
* 4. If the floor of average is even, changes "VentanaPrincipal" status to Red (#FF0000).
* 5. If the floor of average is odd, changes "VentanaPrincipal" status to Green (#00FF00).
*/// 1. Create the builder to search for entities, limiting to 50
varbuilder=$api.entitiesSearchBuilder()
.limit(50)
.flattened();
// 2. Execute the query
varresponse=awaitbuilder.build().execute();
vartotalCharge=0;
varcount=0;
// 3. Iterate through the results and sum the battery charge
if (response&&response.data&&response.data.entities) {
response.data.entities.forEach(function(entity) {
// Access the battery charge field
// Field: device.powersupply.battery.charge
varbatteryField=entity['device.powersupply.battery.charge'];
if (batteryField&&batteryField._value&&batteryField._value._current&&batteryField._value._current.value) {
varval= parseFloat(batteryField._value._current.value);
if (!isNaN(val)) {
totalCharge+=val;
count++;
}
}
});
}
// 4. Calculate Average
varaverage=count>0?totalCharge/count:0;
// 5. Determine color based on parity of the floor of the average
// Even -> Red "#FF0000"
// Odd -> Green "#00FF00"
varfloorAvg= Math.floor(average);
varisEven=floorAvg%2===0;
varcolor=isEven?"#FF0000":"#00FF00";
// 6. Set the item status and value
// setItemStatus(itemID, [rgbColor(string format)|null])
setItemStatus("VentanaPrincipal", color);
// setValueToItem(itemID, alias, value)
setValueToItem("VentanaPrincipal", "Battery Avg", average.toFixed(2));
// Use return as the function is async
return;
All Entities Average Battery
Code
/**
* Logic:
* 1. Iterates through ALL entities in the platform using `executeWithAsyncPaging` (efficient pagination).
* 2. Calculates the average of the `device.powersupply.battery.charge` values across all entities.
* 3. Update "VentanaPrincipal" value with the global average.
* 4. If the floor of average is even, changes "VentanaPrincipal" status to Red (#FF0000).
* 5. If the floor of average is odd, changes "VentanaPrincipal" status to Green (#00FF00).
*/vartotalCharge=0;
varcount=0;
// 1. Create the builder
varbuilder=$api.entitiesSearchBuilder()
.limit(2000) // Max limit per page
.flattened();
// 2. Execute with async paging
// executeWithAsyncPaging(resourceName) returns a Promise
returnbuilder.build().executeWithAsyncPaging('entities').then(
// Success Callback (called when all pages are processed)
function() {
// 4. Calculate Average
varaverage=count>0?totalCharge/count:0;
// 5. Determine color based on parity of the floor of the average
varfloorAvg= Math.floor(average);
varisEven=floorAvg%2===0;
varcolor=isEven?"#FF0000":"#00FF00";
// 6. Set the item status and value
setItemStatus("VentanaPrincipal", color);
setValueToItem("VentanaPrincipal", "Battery Avg", average.toFixed(2));
},
// Error Callback
function(err) {
console.error("Error in paging:", err);
},
// Notify Callback (called for each page of results)
function(pageData) {
if (pageData&&pageData.length>0) {
pageData.forEach(function(entity) {
// Access the battery charge field
varbatteryField=entity['device.powersupply.battery.charge'];
if (batteryField&&batteryField._value&&batteryField._value._current&&batteryField._value._current.value) {
varval= parseFloat(batteryField._value._current.value);
if (!isNaN(val)) {
totalCharge+=val;
count++;
}
}
});
}
}
);
Custom Action
Custom action widgets allow you to code an action to be performed, which will be triggered by a button or a form.
How it Works
This widget will display a form or button that will execute the user-coded action.
In the case of using a form, the action will receive the form values and any desired logic can be applied to them.
Additionally, this widget can be configured so that the action executes within a dialog box as an independent form.
Once the execution is initiated, a progress box will appear displaying the result of the action.
The execution will be successful as long as no exception is thrown in the source code.
Configuration
General
Boxed: widget will be displayed with background in dahsboard.
About: widget description in Markdown format.
Title: widget title. It can be configured to remain fixed in the widget or only be displayed when it receives focus.
Toolbar: configures the behavior of the widget bar on the dashboard, allowing you to hide it, hide it when not in use, or leave it always visible.
Refresh Frequency: allows configuring the data refresh frequency displayed in the list.
Extra actions: allows user to add new specific actions to the widget with your own code.
You can add a new one by pressing the New button.
Once you added a custom action it can be modified later by pressing the name in the list.
In order to remove the custom action click the delete icon button on the right.
In extra actions you can write your own code were you can open other dashboards, entities dashboards or execute wizards.
You can find all available functions and methods in Extra Information
Description here you will write what action will be executed when the corresponding button is pressed
Icon determines the type of desired visualization: a button with an icon, an image, or a custom form. In the case of a form, it can also be specified if you want to display it as a dialog box.
If it’s a form, you must enter a JSON schema that determines what will be drawn.
Expert
Here you can configure source code that will run before the widget is loaded, allowing for the dynamic construction of the JSON schema of the form to be displayed, thereby facilitating the construction of dynamic forms based on platform data.
Available utils
$api -> use it to create http petitions to OpenGate Api Rest doc
Promise -> allows easy execution of multiple promises
http -> javascript encapsulation of a useFetch (Nuxt 4) instance doc. Returns { data, error, status, refresh, clear } where data and error are reactive Refs.
Function
Depending of the configuration receives the following parameters:
entityData contains the data of the opened entity
NOTE: only available when the user opens an entity dashboard template
// Check if a value is provided
if (!value) {
console.warn("No value provided for search.");
return;
}
// Define the API endpoint (JSONPlaceholder)
// We'll filter todos by userId based on the input value
varapiUrl="https://jsonplaceholder.typicode.com/todos?userId="+value;
console.log("Fetching data from: "+apiUrl);
try {
// Perform the request using the platform's http utility (encapsulation of Nuxt 4 useFetch)
// useFetch typically parses JSON automatically.
// We await the result.
// Note: useFetch in Nuxt returns { data, error, ... }
const { data, error } =awaithttp(apiUrl);
if (error&&error.value) {
thrownew Error("Generic Error: "+error.value);
}
// Access the data (Ref value if it's a ref, or direct if the utility un-refs it)
// Assuming standard Nuxt composition API behavior where top level properties are Refs
constresults=data.value||data;
console.log("--- Search Results (User ID: "+value+") ---");
// Check if we got any results
if (results&&results.length>0) {
console.table(results); // Display as a table for better readability
console.log("Total records found: "+results.length);
} else {
console.log("No records found for User ID: "+value);
}
} catch (err) {
console.error("Fetch error:", err);
}
Custom Action Entity Search Example
Code
// Check if model is provided
if (!model) {
console.warn("No form data (model) provided.");
return;
}
const { name, specificType } =model;
console.log("Searching entities with Name:", name, "and Specific Type:", specificType);
// Create the builder
varbuilder=$api.entitiesSearchBuilder().flattened();
// Define filters based on model values
varfilter= {
and: [
{
eq: {
'resourceType':'entity.device' }
}
]
};
if (name) {
filter.and.push({
like: {
'provision.administration.identifier':name// Assuming 'name' maps to identifier for this example, or use 'provision.device.name' if appropriate
}
});
}
if (specificType) {
filter.and.push({
eq: {
'provision.device.specificType':specificType }
});
}
// Apply filter if any conditions were added
if (filter.and.length>0) {
builder.filter(filter);
}
try {
// Execute the search
// await is supported in this context
constresponse=awaitbuilder.build().execute();
if (response.statusCode===200) {
console.log("--- Entity Search Results ---");
constentities=response.data.entities;
if (entities&&entities.length>0) {
console.table(entities.map(e => ({
id:e['provision.administration.identifier']._value._current.value,
specificType:e['provision.device.specificType'] ?e['provision.device.specificType']._value._current.value:'N/A' })));
console.log("Total entities found:", entities.length);
} else {
console.log("No entities match the criteria.");
}
} else {
console.error("Search failed with status:", response.statusCode);
}
} catch (err) {
console.error("Error executing entity search:", err);
}
Custom Chart
Custom charts allow for the display of data in graphical format based on user-defined logic.
How it Works
Once the logic for data retrieval is entered, the data will be displayed on the widget.
What sets the custom chart apart from others is that the data source can be external, internal, both, or even fabricated. Moreover, multiple charts can be combined within the same widget.
This widget is compatible with eCharts library version 5. Multiple examples can be accessed via the following link: eCharts
Configuration
General
Boxed: widget will be displayed with background in dahsboard.
About: widget description in Markdown format.
Title: widget title. It can be configured to remain fixed in the widget or only be displayed when it receives focus.
Toolbar: configures the behavior of the widget bar on the dashboard, allowing you to hide it, hide it when not in use, or leave it always visible.
Refresh Frequency: allows configuring the data refresh frequency displayed in the list.
Extra actions: allows user to add new specific actions to the widget with your own code.
You can add a new one by pressing the New button.
Once you added a custom action it can be modified later by pressing the name in the list.
In order to remove the custom action click the delete icon button on the right.
In extra actions you can write your own code were you can open other dashboards, entities dashboards or execute wizards.
You can find all available functions and methods in Extra Information
Show widget filters instructs the widget to display its filters. These filters will be passed as an additional parameter to the data retrieval function.
Here, you input the necessary code to obtain the information to be displayed.
Depending on the selected options, the parameters received by the function will be displayed.
The function must always return a JSON object that is compatible with eCharts’ chart configuration.
Every time the code is updated, it must be evaluated where a preview of the result can be seen.
Function
Depending of the configuration receives the following parameters:
entityData contains the data of the opened entity
NOTE: only available when the user opens an entity dashboard template
filters introduced by the user. These filters are:
generic widget generic filter
period widget date period filter
inherit json object with inherited filter if ‘shared filter’ is enabled. This filter is composed by ‘and’ filter that contains standar filter, private/template filter and headers filters from the source widget.
Promise -> allows easy execution of multiple promises
http -> javascript encapsulation of a useFetch (Nuxt 4) instance doc. Returns { data, error, status, refresh, clear } where data and error are reactive Refs.
Custom tables allow you to display data in a list format based on logic encoded by the user.
How it Works
Once the logic for data retrieval is entered, the data will be displayed in the table.
What sets the custom table apart is that the data source can be external, internal, both, or even fabricated. Moreover, custom charts can be mixed in, and additional information can be included in the expandable panel.
Configuration
General
Boxed: widget will be displayed with background in dahsboard.
About: widget description in Markdown format.
Title: widget title. It can be configured to remain fixed in the widget or only be displayed when it receives focus.
Toolbar: configures the behavior of the widget bar on the dashboard, allowing you to hide it, hide it when not in use, or leave it always visible.
Refresh Frequency: allows configuring the data refresh frequency displayed in the list.
Extra actions: allows user to add new specific actions to the widget with your own code.
You can add a new one by pressing the New button.
Once you added a custom action it can be modified later by pressing the name in the list.
In order to remove the custom action click the delete icon button on the right.
In extra actions you can write your own code were you can open other dashboards, entities dashboards or execute wizards.
You can find all available functions and methods in Extra Information
Pagination type allows you to specify the kind of pagination you want. There may be no pagination, pagination handled by the table component (local), or server-side pagination.
If server-side pagination is chosen, the script will receive parameters like the number of elements and the page, allowing the user to decide.
Page elements specifies the number of elements to show per page.
Allow data grouping enables the table to group items by elements in a column.
Show widget filters instructs the widget to display its filters. These filters will be passed as an additional parameter to the data retrieval function.
Compact the size of the table rows will make the table rows more compact to save vertical space.
Expandable rows enables an information button for expanded data on each row. The code must fill this information, or an empty space will be displayed.
Column Configuration
The data that will be displayed in table. In order to finish the configuration for this you must add one column at least and select a primary key.
For every column you can define the next data:
Name to show in headers
JSON field is the field to read in data returned by the function. Primary key use that field
Sortable permits sorting for this column
Groupable allow group by this field in table
Filterable allow filter by this field in table
Data type of the filter (only when filterable)
Divisor draws a separator between this column and the next
Show entity actions enables context menu for the column allowing to perform some actions depending of the item value.
Columns supports drag&drop in order to determine the position in the table.
Code Tab
This is where you input the necessary code to retrieve the data to be displayed.
Depending on the options selected in the general tab, the parameters received by the function will be displayed.
The function must always return an array of JSON objects compatible with the specified configuration for the component to be able to render them.
Each time the code is updated, it must be evaluated where a preview of the result can be seen.
Finally you MUST return an array with a json that matches the columns configuration.
Function
Depending of the configuration receives the following parameters:
entityData contains the data of the opened entity
NOTE: only available when the user opens an entity dashboard template
filters introduced by the user. These filters are:
generic widget generic filter
period widget date period filter
column json object with each column filter
sort an array containing every sorted column with its direction sorted by user preferences
inherit json object with inherited filter if ‘shared filter’ is enabled. This filter is composed by ‘and’ filter that contains standar filter, private/template filter and headers filters from the source widget.
An example:
{
"filters": {
"generic": "filter introduced by the user",
"period": {"from":"2023-03-27T10:59:27+02:00","to":null},
"column": {
[columnvaluefield]:{operator:"eq",
value:"filter introduced by the user in colum" },
[columnvaluefield]:{operator:"gt",
value:"filter introduced by the user in colum" }
},"sort": [
{
column:"column value field",
direction:"asc"or"desc" },
{
column:"column value field",
direction:"asc"or"desc" }
],"inherit": {
"and": [
{ "eq": {"field.identifier._current.value": "value"}},
{ "eq": {"field2.identifier._current.value": "value2"}}
]
}
}}
pageElements and page that determines the current page to display. Only enabled when server pagination enabled in table parameters. Disabling server pagination quits this parameters and function must be evaluated again.
callback function used to send table data only when the api/http petitions are promised
Promise -> allows easy execution of multiple promises
http -> javascript encapsulation of a useFetch (Nuxt 4) instance doc. Returns { data, error, status, refresh, clear } where data and error are reactive Refs.
openDashboard -> (workspaceId, dashboardId, newPage) -> Opens the selected dashboard in selected workspace
openEntityDashboard -> (entityIdentifier[, organization[user if empty], resourceType[’entity.device’ if empty] , newPage]) -> Opens the entity’s temporary dashboard
Data format
Returned data must have one of the following formats (per item):
simple json data
{
"jsonfield": "value to display. It can be HTML."
}
‘complex’ json data
{
"jsonfield": {
"value": "value to display. It can be HTML",
"_style": "cell custom style",
"_chart": "displays an echarts chart. Overrides others in this item",
"_extension": "jsonfield like (value, _style, _chart) plus _table. Only enabled when expandable rows enabled"
}
}
NOTE _extension field can combine _chart and _table elements in the same item
Element _chart
Must have an echarts config json.
Element _table
Displays a table inside the column and overrides others in this item.
This example demonstrates how to fetch data from the USGS Earthquake Hazards Program API.
This service supports server-side date filtering, which aligns perfectly with the widget’s Period Filter.
Function Explanation
Date Filtering: The code checks the filters.period object.
If from and to are present, they are formatted to ISO 8601 strings (YYYY-MM-DD) and sent as starttime and endtime parameters.
If no period is selected, it defaults to the last 24 hours.
Name/Text Filtering: The filters.generic (search text) is used to filter the results client-side (searching within the place field), as the API does not support a direct “text search” parameter for this endpoint.
Code
// Main function executed by the Custom Table widget
// parameters: entityData, filters, page, pageElements, callback
// Base URL for USGS Earthquake API (GeoJSON format)
leturl='https://earthquake.usgs.gov/fdsnws/event/1/query?format=geojson&limit=200';
// 1. Handle Date Filters (Server-Side)
if (filters&&filters.period&&filters.period.from&&filters.period.to) {
// Helper to format date as YYYY-MM-DD
constformatDate= (dateStr) => new Date(dateStr).toISOString().split('T')[0];
conststart=formatDate(filters.period.from);
constend=formatDate(filters.period.to);
url+=`&starttime=${start}&endtime=${end}`;
} else {
// Default to 'now' if no filter (API defaults to last 30 days usually, let's limit to recent)
// Actually, let's explicitely ask for last 2 days to keep data manageable if no filter
// But for simplicity, we rely on the API defaults or a 'limit' param already added above.
}
try {
// 2. Fetch Data
constresponse=awaithttp(url);
letfeatures= [];
if (response&&response.features) {
features=response.features;
} elseif (response&&response.json) {
constjson=awaitresponse.json();
features=json.features|| [];
}
// 3. Handle Name/Text Filter (Client-Side)
// filtering by 'place' property
if (filters&&filters.generic&&filters.generic.length>0) {
constsearch=filters.generic.toLowerCase();
features=features.filter(f =>
f.properties.place&&f.properties.place.toLowerCase().includes(search)
);
}
// 4. Map to Table Columns
// Configured Columns hint: 'place', 'magnitude', 'time', 'status'
consttableData=features.map(f => {
constprops=f.properties;
constdateObj=new Date(props.time);
// Determine color based on magnitude
letmagColor='green';
if (props.mag>=5) magColor='red';
elseif (props.mag>=3) magColor='orange';
return {
place:props.place,
magnitude: {
value:props.mag?props.mag.toFixed(1) :'0.0',
_style:`font-weight:bold; color: ${magColor};` },
time:dateObj.toLocaleString(),
status:`<a href="${props.url}" target="_blank">Ver Detalles</a>` };
});
callback(tableData);
} catch (error) {
console.error("Error fetching earthquake data:", error);
callback([]);
}
Filtered Entity Retrieval
Description
This example shows how to retrieve entities filtering by a parameter and sorting by name.
Code
/**
* Main function to retrieve and display entities
* @param {Object} entityData - Context entity data
* @param {Object} filters - Filters passed from the widget
*/varbuilder=$api.entitiesSearchBuilder().limit(100).flattened();
// 1. Filter by parameter (assuming it comes in filters.generic or a specific field)
// Here we assume filters.generic contains a string to filter by name
if (filters&&filters.generic) {
builder.filter({
like: {
'provision.asset.name':filters.generic// Adjust field as needed (e.g., provision.device.name)
}
});
}
// 2. Sort by name
builder.sort([
{
column:'provision.asset.name',
direction:'asc' }
]);
// 3. Execute query
varresponse=awaitbuilder.build().execute();
// 4. Transform results
varresults= [];
if (response&&response.data&&response.data.entities) {
response.data.entities.forEach(function(entity) {
// Extract identifier (using bracket notation for flattened keys)
varid=entity['provision.administration.identifier'] ?entity['provision.administration.identifier']._value._current.value:"Unknown";
// Extract name (handle if it doesn't exist)
varname="N/A";
if (entity['provision.asset.name']) {
name=entity['provision.asset.name']._value._current.value;
}
results.push({
identifier:id,
name:name });
});
}
returnresults;
Server Pagination Example (Reqres)
Static content
This example demonstrates how to implement server-side pagination using an external API (reqres.in).
When “Server Pagination” is enabled in the widget configuration, the script receives page and pageElements parameters.
Function Explanation
Page Parameters: The page and pageElements arguments act as the current page number and the page size (limit), respectively.
API Request: The code constructs a request to reqres.in passing page and per_page query parameters.
Callback: The function processes the response and sends the array of users to the widget via the callback.
Code
// Main function executed by the Custom Table widget
// parameters: entityData, filters, page, pageElements, callback
// 1. Prepare Pagination Parameters
// Ensure we have defaults if arguments are missing (safeguard)
constcurrentPage=page||1;
constperPage=pageElements||5;
// 2. Construct URL with pagination params
// reqres.in uses 'page' (1-based) and 'per_page'
consturl=`https://reqres.in/api/users?page=${currentPage}&per_page=${perPage}`;
try {
// 3. Fetch Data
constresponse=awaithttp(url);
// 4. Extract Data
// reqres.in returns: { page: 1, per_page: 6, total: 12, total_pages: 2, data: [...] }
letusers= [];
// Check various response wrappers as 'http' might auto-parse JSON
if (response&&response.data&& Array.isArray(response.data)) {
users=response.data;
} elseif (response&&response.json) {
constjson=awaitresponse.json();
users=json.data|| [];
} elseif (response&& Array.isArray(response)) {
users=response;
}
// 5. Format for Table
// Configured Columns hint: 'id', 'avatar', 'first_name', 'last_name'
consttableData=users.map(user => {
return {
id:user.id,
avatar:`<img src="${user.avatar}" style="width: 30px; border-radius: 50%;">`,
first_name:user.first_name,
last_name:user.last_name,
email:user.email };
});
// 6. Return Data
// We return the array of items for the current page.
callback(tableData);
} catch (error) {
console.error("Error fetching paged data:", error);
callback([]);
}
Battery Level Pie Chart
Description
This example shows how to retrieve entities and display their battery level as a Pie Chart within the table row.
Code
varbuilder=$api.entitiesSearchBuilder().limit(100).flattened();
// Handle generic filter if present
if (filters&&filters.generic) {
builder.filter({
like: {
'provision.administration.identifier':filters.generic }
});
}
varresponse=awaitbuilder.build().execute();
varresults= [];
if (response&&response.data&&response.data.entities) {
response.data.entities.forEach(function(entity) {
// Get identifier
varid=entity['provision.administration.identifier'] ?entity['provision.administration.identifier']._value._current.value:"Unknown";
// Get battery charge (default to 0 if not present)
varcharge=0;
if (entity['device.powersupply.battery.charge']) {
charge=entity['device.powersupply.battery.charge']._value._current.value;
}
// Create the chart configuration
varpieOption= {
color: ['#91c7ae', '#c23531'],
series: [
{
type:'pie',
radius: ['50%', '70%'],
avoidLabelOverlap:false,
label: {
show:false,
position:'center' },
emphasis: {
label: {
show:true,
fontSize:'10',
fontWeight:'bold' }
},
labelLine: {
show:false },
data: [
{ value:charge, name:'Charge' },
{ value:100-charge, name:'Empty' }
]
}
]
};
results.push({
identifier:id,
battery: {
"_chart":pieOption,
"_style":"height: 50px; width: 50px;"// Optional styling for the cell
}
});
});
}
returnresults;
Custom Widget
This widget allows to create a full widget by using the van js templating system and echarts
How it Works
Once the code is entered, the coded form will be displayed on the widget.
This widget is compatible with eCharts library version 6. Multiple examples can be accessed via the following link: eCharts
Configuration
General
Boxed: widget will be displayed with background in dahsboard.
About: widget description in Markdown format.
Title: widget title. It can be configured to remain fixed in the widget or only be displayed when it receives focus.
Toolbar: configures the behavior of the widget bar on the dashboard, allowing you to hide it, hide it when not in use, or leave it always visible.
Refresh Frequency: allows configuring the data refresh frequency displayed in the list.
Extra actions: allows user to add new specific actions to the widget with your own code.
You can add a new one by pressing the New button.
Once you added a custom action it can be modified later by pressing the name in the list.
In order to remove the custom action click the delete icon button on the right.
In extra actions you can write your own code were you can open other dashboards, entities dashboards or execute wizards.
You can find all available functions and methods in Extra Information
Here, you input the necessary code to obtain the information to be displayed.
The function must always return a van ui object.
Every time the code is updated, it must be evaluated where a preview of the result can be seen.
Function
Depending of the configuration receives the following parameters:
entityData contains the data of the opened entity
NOTE: only available when the user opens an entity dashboard template
Promise -> allows easy execution of multiple promises
http -> javascript encapsulation of a useFetch (Nuxt 4) instance doc. Returns { data, error, status, refresh, clear } where data and error are reactive Refs.
openWidget -> (widgetId[, entityKey, title, extraConf]) -> Opens the selected widget in a modal panel
openDashboard -> (workspaceId, dashboardId, newPage) -> Opens the selected dashboard in selected workspace
openEntityDashboard -> (entityIdentifier[, organization[user if empty], resourceType[’entity.device’ if empty] , newPage]) -> Opens the entity’s temporary dashboard
openWizard -> (wizardId[, wizardData, isEdit]) -> Opens the selected wizard in a modal panel. A list of available wizards will be available to use directly.
Final code structure build by the application
asyncfunctionmain(entityData,relatedEntities,timeserieData,alarmData,dashboardFilters,callback) {
// YOUR CODE HERE WITH RETURN OR CALLBACK (function is declared automatically)
}
// 1. Importar tags de VanJS
const { div, input, button, ul, li, span, p } =van.tags;
// 2. Extraer el ID por defecto si entityData está presente en el contexto
constdefaultDeviceId=entityData?.['provision.administration.identifier']?._value?._current?.value||"";
// 3. Estados reactivos de VanJS
conststatusText=van.state(defaultDeviceId?"Cargando datos...":"Introduce un ID de dispositivo y pulsa Consultar");
constfieldsList=van.state([]);
constloadedEntity=van.state(null); // Guardará la entidad en modo flattened
constcurrentDeviceId=van.state(defaultDeviceId);
// 4. Estilos en línea
conststyles= {
container:"padding: 14px; font-family: system-ui, -apple-system, sans-serif; color: #1e293b; height: 100%; box-sizing: border-box; overflow-y: auto;",
searchBox:"display: flex; gap: 8px; margin-bottom: 12px;",
input:"flex: 1; padding: 8px 12px; border: 1px solid #cbd5e1; border-radius: 6px; font-size: 0.875rem; outline: none;",
primaryBtn:"padding: 8px 16px; background-color: #2563eb; color: white; border: none; border-radius: 6px; font-size: 0.875rem; font-weight: 500; cursor: pointer;",
actionsBox:"display: flex; gap: 8px; margin-bottom: 14px; flex-wrap: wrap;",
actionBtn:"padding: 6px 12px; background-color: #0f766e; color: white; border: none; border-radius: 6px; font-size: 0.8125rem; font-weight: 500; cursor: pointer; display: flex; align-items: center; gap: 6px;",
secondaryActionBtn:"padding: 6px 12px; background-color: #475569; color: white; border: none; border-radius: 6px; font-size: 0.8125rem; font-weight: 500; cursor: pointer; display: flex; align-items: center; gap: 6px;",
list:"list-style: none; padding: 0; margin: 0; display: flex; flex-direction: column; gap: 8px;",
item:"display: flex; justify-content: space-between; align-items: center; padding: 8px 12px; background: #f8fafc; border-radius: 6px; border: 1px solid #e2e8f0; font-size: 0.875rem;",
key:"color: #64748b; font-weight: 500;",
value:"font-weight: 600; color: #0f172a; word-break: break-all;",
status:"color: #64748b; font-size: 0.875rem; text-align: center; padding: 16px 0; margin: 0;"};
// 5. Función asíncrona para consultar el dispositivo usando $api
asyncfunctionsearchDevice(id) {
consttargetId= (id||"").trim();
if (!targetId) {
statusText.val="⚠️ Por favor, introduce un identificador de dispositivo válido.";
fieldsList.val= [];
loadedEntity.val=null;
return;
}
statusText.val=`Buscando dispositivo "${targetId}"...`;
fieldsList.val= [];
loadedEntity.val=null;
currentDeviceId.val=targetId;
try {
// Consulta en modo .flattened()
constresponse=await$api.entitiesSearchBuilder()
.filter({
eq: {
'provision.administration.identifier':targetId }
})
.flattened()
.limit(1)
.build()
.execute();
constentity=response?.data?.entities?.[0];
if (!entity) {
statusText.val=`❌ No se encontró ningún dispositivo con ID: "${targetId}"`;
return;
}
// Guardar la entidad en modo flattened en el estado
loadedEntity.val=entity;
statusText.val="";
// Mapeo de campos simples a mostrar
fieldsList.val= [
{ label:"Identificador", value:entity['provision.administration.identifier']?._value?._current?.value||targetId },
{ label:"Organización", value:entity['provision.administration.organization']?._value?._current?.value||"N/A" },
{ label:"Canal", value:entity['provision.administration.channel']?._value?._current?.value||"N/A" },
{ label:"Grupo de Servicio", value:entity['provision.administration.serviceGroup']?._value?._current?.value||"N/A" },
{ label:"Tipo Específico", value:entity['provision.device.specificType']?._value?._current?.value||"N/A" },
{ label:"Número de Serie", value:entity['provision.device.serialNumber']?._value?._current?.value||"N/A" },
{ label:"Estado Operacional", value:entity['device.operationalStatus']?._value?._current?.value||"N/A" }
];
} catch (error) {
console.error("Error al consultar el dispositivo:", error);
statusText.val=`❌ Error en la consulta: ${error.message||error}`;
}
}
// 6. Funciones para ejecutar las acciones sobre el dispositivo cargado
functionhandleOpenDeviceDetails() {
if (!currentDeviceId.val) {
return;
}
// Abrir widget deviceInfoDetails con el identificador del dispositivo
openWidget('deviceInfoDetails', currentDeviceId.val, `Detalles: ${currentDeviceId.val}`);
}
functionhandleOpenEntitiesWizard() {
if (!loadedEntity.val) {
return;
}
// Abrir wizard entities pasando el objeto de la entidad en modo flattened
openWizard('entities', loadedEntity.val, true);
}
// 7. Input de texto pre-rellenado
consttextInput=input({
type:"text",
placeholder:"Identificador del dispositivo...",
value:defaultDeviceId,
style:styles.input,
onkeydown: (e) => {
if (e.key==="Enter") {
searchDevice(textInput.value);
}
}
});
// 8. Búsqueda automática inicial si entityData contenía un ID
if (defaultDeviceId) {
searchDevice(defaultDeviceId);
}
// 9. Retorno del componente reactivo VanJS
returndiv({ style:styles.container },
// Barra de búsqueda
div({ style:styles.searchBox },
textInput,
button({
style:styles.primaryBtn,
onclick: () => {
searchDevice(textInput.value);
}
}, "Consultar")
),
// Contenido reactivo: Estado o Botones de Acción + Listado
() => {
if (statusText.val) {
returnp({ style:styles.status }, statusText.val);
}
returndiv(
// Barra de acciones disponibles para el dispositivo cargado
div({ style:styles.actionsBox },
button({
style:styles.actionBtn,
onclick: () => {
handleOpenDeviceDetails();
}
}, "📱 Abrir 'deviceInfoDetails'"),
button({
style:styles.secondaryActionBtn,
onclick: () => {
handleOpenEntitiesWizard();
}
}, "🧙 Abrir Wizard 'entities'")
),
// Listado de datos simples
ul({ style:styles.list },
fieldsList.val.map((field) => {
returnli({ style:styles.item },
span({ style:styles.key }, field.label),
span({ style:styles.value }, String(field.value))
);
})
)
);
}
);
Open HMI/Custom Image
Programmable HMIs allow for the construction and modification of the interface.
How it Works
Once the logic for data retrieval and SVG painting/modification has been entered, it will be displayed on the widget.
What distinguishes this widget from the original HMI is that data sources can be external, and the widget’s content is built/modified through coding.
Configuration
General
Boxed: widget will be displayed with background in dahsboard.
About: widget description in Markdown format.
Title: widget title. It can be configured to remain fixed in the widget or only be displayed when it receives focus.
Toolbar: configures the behavior of the widget bar on the dashboard, allowing you to hide it, hide it when not in use, or leave it always visible.
Refresh Frequency: allows configuring the data refresh frequency displayed in the list.
Extra actions: allows user to add new specific actions to the widget with your own code.
You can add a new one by pressing the New button.
Once you added a custom action it can be modified later by pressing the name in the list.
In order to remove the custom action click the delete icon button on the right.
In extra actions you can write your own code were you can open other dashboards, entities dashboards or execute wizards.
You can find all available functions and methods in Extra Information
SVG Content allows you to input the source code of an SVG as a starting point. The SVG content can be manipulated with the svgDom object of the editor. Content can either be entered directly or by selecting a file.
CSS Content allows you to apply styles to the SVG. Content can be entered directly or by selecting a file.
Preview shows a live preview resulting from the combination of the previously entered values, without running any code.
Code Tab
This is where you enter the code required for SVG manipulation. It is not necessary to enter code, but you must at least return the svgDom object for it to be able to render.
For SVG manipulation, standard HTML manipulation libraries will be used. Interactions can also be added to the SVG itself to integrate it with the platform’s data, linking it to device data and providing access to it.
Every time the code is updated, it must be evaluated, where a preview of the result will be shown. For this preview, the entered code is indeed evaluated, so the outcome will vary based on its execution.
Available utils
$api -> use it to create http petitions to OpenGate Api Rest doc
Promise -> allows easy execution of multiple promises
http -> javascript encapsulation of a useFetch (Nuxt 4) instance doc. Returns { data, error, status, refresh, clear } where data and error are reactive Refs.
alert -> javascript alert function
document -> javascript document object
domParser -> javascript DOMParser object
showPopup -> shows options for the selected entity: showPopup(entityId[,datastreamId])
Function
Depending of the configuration receives the following parameters:
entityData contains the data of the opened entity
NOTE: only available when the user opens an entity dashboard template
The certificate browser allows you to view/manage the different certificates available to my organization.
How it works
From the browser, you can view the certificates provided by Opengate as well as those managed directly by my organization.
Widget Menu
From the action menu of the widget, you can perform the following:
New certificate: launches the certificate configuration wizard as long as you have the necessary permissions.
Capture screen: Takes a screenshot of the widget.
Duplicate widget: Creates a duplicate of the widget on the dashboard.
Copy widget: Copies the widget to another dashboard.
Change widget location: Moves the widget to another dashboard.
Certificate Details
To view the details of a certificate, clicking on the arrow located to the right of each will enable the details panel.
Actions per Certificate
The following are the possible actions to perform for each of the organization’s own certificates.
Download allows you to download the selected certificate
Edit enables the editing of a certificate, including uploading an updated version of it
Delete deletes the selected certificate
Configuration
General
Boxed: widget will be displayed with background in dahsboard.
About: widget description in Markdown format.
Title: widget title. It can be configured to remain fixed in the widget or only be displayed when it receives focus.
Toolbar: configures the behavior of the widget bar on the dashboard, allowing you to hide it, hide it when not in use, or leave it always visible.
Refresh Frequency: allows configuring the data refresh frequency displayed in the list.
Extra actions: allows user to add new specific actions to the widget with your own code.
You can add a new one by pressing the New button.
Once you added a custom action it can be modified later by pressing the name in the list.
In order to remove the custom action click the delete icon button on the right.
In extra actions you can write your own code were you can open other dashboards, entities dashboards or execute wizards.
You can find all available functions and methods in Extra Information
Configured Operations Navigator
The Operation Types browser allows you to view and manage the operations that have been configured for your organization.
How it Works
Each of the configured operations will be displayed in the browser along with some details about them, such as the type of operation and the types of entities to which they apply and the available launchers if any.
Widget Menu
From the action menu of the widget, it will be possible to do the following:
Operations wizard: allows you to run the creation wizard for a new type of operation (provided you have the necessary permissions).
Execute operation: launches the operation execution wizard.
Capture screen: Takes a screenshot of the widget.
Duplicate widget: Creates a duplicate of the widget on the dashboard.
Copy widget: Copies the widget to another dashboard.
Change widget location: Moves the widget to another dashboard.
Actions by Operation Type
The following are the possible actions that can be performed for each of the configured operations:
Edit: Opens the operation configurator to change various parameters.
Remove: Deletes the selected operation.
Operations launchers
For each of the operation type, it will be possible to create launchers that will allow you to run them with different parameters. By creating one, default operation will not be displayed in wizard.
Each launcher can be executed, edited or deleted.
Configuration
General
Boxed: widget will be displayed with background in dahsboard.
About: widget description in Markdown format.
Title: widget title. It can be configured to remain fixed in the widget or only be displayed when it receives focus.
Toolbar: configures the behavior of the widget bar on the dashboard, allowing you to hide it, hide it when not in use, or leave it always visible.
Refresh Frequency: allows configuring the data refresh frequency displayed in the list.
Extra actions: allows user to add new specific actions to the widget with your own code.
You can add a new one by pressing the New button.
Once you added a custom action it can be modified later by pressing the name in the list.
In order to remove the custom action click the delete icon button on the right.
In extra actions you can write your own code were you can open other dashboards, entities dashboards or execute wizards.
You can find all available functions and methods in Extra Information
Connector functions browser
In this widget, you will find the connector functions configured for your organization.
How it works
In the browser, you will find a list of connector functions along with the actions available for each one, depending on the permissions you have.
Next to the name, you can find the type of connector function as well as its operational status.
By pressing expand button you can see criteria selectors for each item.
Widget Menu
From the action menu of the widget, it will be possible to do the following:
New connector function: allows you to run the creation wizard for connector functions (provided you have the necessary permissions).
Capture screen: Takes a screenshot of the widget.
Duplicate widget: Creates a duplicate of the widget on the dashboard.
Copy widget: Copies the widget to another dashboard.
Change widget location: Moves the widget to another dashboard.
Channel Selector
A user can manage connector functions for those channels that are dependent on the user’s organization. To switch between channels, you can use the selector available at the top of the widget.
Actions on Connector Functions
For each connector function, you can perform the following actions:
Logger: opens a new window showing execution logs for the connector function.
Edit: opens the editing wizard to change the parameters of the element.
Clone: opens the creation wizard with a copy of the element’s data.
Delete: removes the element.
Expand: toggle criteria selectors display.
Configuration
General
Boxed: widget will be displayed with background in dahsboard.
About: widget description in Markdown format.
Title: widget title. It can be configured to remain fixed in the widget or only be displayed when it receives focus.
Toolbar: configures the behavior of the widget bar on the dashboard, allowing you to hide it, hide it when not in use, or leave it always visible.
Refresh Frequency: allows configuring the data refresh frequency displayed in the list.
Extra actions: allows user to add new specific actions to the widget with your own code.
You can add a new one by pressing the New button.
Once you added a custom action it can be modified later by pressing the name in the list.
In order to remove the custom action click the delete icon button on the right.
In extra actions you can write your own code were you can open other dashboards, entities dashboards or execute wizards.
You can find all available functions and methods in Extra Information
Data models Browser
From the data models browser, you can view/modify the data models of your organization, allowing for customization of entity data on the platform.
How it Works
Widget Menu
The following actions can be performed directly from the widget:
New Datamodel: Launches the data models configuration wizard, provided the necessary permissions are available.
Editable/All: Toggles between displaying all data models (both inherited from catalog and own) or only the editable ones (those owned by you, which can be deleted).
Capture screen: Takes a screenshot of the widget.
Duplicate widget: Creates a duplicate of the widget on the dashboard.
Copy widget: Copies the widget to another dashboard.
Change widget location: Moves the widget to another dashboard.
Data Model Details
To view the data streams of a data model, click on the arrow located to the right of each one to enable the navigation panel. The first level will display the categories followed by the data streams assigned to each of them.
Actions per Data Model
The following are the possible actions that can be performed for each of the organization’s own data models:
Download: Allows downloading of the selected data model.
Edit: Enables editing of a data model.
Remove: Deletes the selected data model (only those that are not inherited).
Configuration
General
Boxed: widget will be displayed with background in dahsboard.
About: widget description in Markdown format.
Title: widget title. It can be configured to remain fixed in the widget or only be displayed when it receives focus.
Toolbar: configures the behavior of the widget bar on the dashboard, allowing you to hide it, hide it when not in use, or leave it always visible.
Refresh Frequency: allows configuring the data refresh frequency displayed in the list.
Extra actions: allows user to add new specific actions to the widget with your own code.
You can add a new one by pressing the New button.
Once you added a custom action it can be modified later by pressing the name in the list.
In order to remove the custom action click the delete icon button on the right.
In extra actions you can write your own code were you can open other dashboards, entities dashboards or execute wizards.
You can find all available functions and methods in Extra Information
Items Per Page: Indicates the number of data models that will be displayed per page while navigating.
Search by All Organizations: When enabled, the widget will display all data models from all my organizations.
Data sets Browser
In this widget, you will find the data sets configured for your organization.
How it Works
In the browser, you will find a list of data sets along with the available actions for each, based on the permissions you have.
Widget Menu
From the action menu of the widget, you can perform the following:
New Data Set: This allows you to run the data set creation wizard (provided you have the necessary permissions).
Capture screen: Takes a screenshot of the widget.
Duplicate widget: Creates a duplicate of the widget on the dashboard.
Copy widget: Copies the widget to another dashboard.
Change widget location: Moves the widget to another dashboard.
Organization Selector
A user can manage the data sets for those organizations that are dependent on the user’s own organization. To switch between organizations, you must select it from the selector available at the top of the widget.
Actions on Data Set
For each data set, you can perform the following actions:
View Data: This will open a list widget where you can view the data of the selected data set.
Edit: Allows you to initiate a data set update wizard with the configuration data of the current one.
Clone: Allows you to initiate a data set creation wizard with the configuration data of the current one.
Columns: Displays, within the widget itself, the columns configured for the data set.
Delete: Removes the selected data set and all its associated data.
Configuration
General
Boxed: widget will be displayed with background in dahsboard.
About: widget description in Markdown format.
Title: widget title. It can be configured to remain fixed in the widget or only be displayed when it receives focus.
Toolbar: configures the behavior of the widget bar on the dashboard, allowing you to hide it, hide it when not in use, or leave it always visible.
Refresh Frequency: allows configuring the data refresh frequency displayed in the list.
Extra actions: allows user to add new specific actions to the widget with your own code.
You can add a new one by pressing the New button.
Once you added a custom action it can be modified later by pressing the name in the list.
In order to remove the custom action click the delete icon button on the right.
In extra actions you can write your own code were you can open other dashboards, entities dashboards or execute wizards.
You can find all available functions and methods in Extra Information
Device Plans Browser
In this widget, you can navigate through different device plans within your organization. Actions can be performed on each of the identifying elements within each organization.
How it Works
By selecting an organization, the plans belonging to it will be displayed in the browser, showing some details about them.
Widget Menu
From the widget’s action menu, you can perform the following:
New Device Plan: Allows the execution of the wizard for creating a new plan (provided the necessary permissions are available).
Capture screen: Takes a screenshot of the widget.
Duplicate widget: Creates a duplicate of the widget on the dashboard.
Copy widget: Copies the widget to another dashboard.
Change widget location: Moves the widget to another dashboard.
Device Plans Actions
The following are the actions that can be performed on each plan:
Edit: Opens device plans wizard in order to edit the selected plan.
Clone: Opens device plans wizard in order to clone the selected plan.
Remove: Removes the selected plan.
Configuration
General
Boxed: widget will be displayed with background in dahsboard.
About: widget description in Markdown format.
Title: widget title. It can be configured to remain fixed in the widget or only be displayed when it receives focus.
Toolbar: configures the behavior of the widget bar on the dashboard, allowing you to hide it, hide it when not in use, or leave it always visible.
Refresh Frequency: allows configuring the data refresh frequency displayed in the list.
Extra actions: allows user to add new specific actions to the widget with your own code.
You can add a new one by pressing the New button.
Once you added a custom action it can be modified later by pressing the name in the list.
In order to remove the custom action click the delete icon button on the right.
In extra actions you can write your own code were you can open other dashboards, entities dashboards or execute wizards.
You can find all available functions and methods in Extra Information
Entities Software Browser
Here, you can consult and/or manage the software of your organizations.
How it Works
Widget Menu
From the action menu of the widget, it will be possible to do the following:
New software: allows you to run the creation wizard for organization software (provided you have the necessary permissions).
Capture screen: Takes a screenshot of the widget.
Duplicate widget: Creates a duplicate of the widget on the dashboard.
Copy widget: Copies the widget to another dashboard.
Change widget location: Moves the widget to another dashboard.
Actions by Software
The following are the possible actions to be taken for each software:
Edit: Opens the organization software wizard where you can change the software details.
Remove: Deletes the selected software. This action allows you to delete references in devices by selecting “Delete all”. Another confirmation popup will be opened.
Configuration
General
Boxed: widget will be displayed with background in dahsboard.
About: widget description in Markdown format.
Title: widget title. It can be configured to remain fixed in the widget or only be displayed when it receives focus.
Toolbar: configures the behavior of the widget bar on the dashboard, allowing you to hide it, hide it when not in use, or leave it always visible.
Refresh Frequency: allows configuring the data refresh frequency displayed in the list.
Extra actions: allows user to add new specific actions to the widget with your own code.
You can add a new one by pressing the New button.
Once you added a custom action it can be modified later by pressing the name in the list.
In order to remove the custom action click the delete icon button on the right.
In extra actions you can write your own code were you can open other dashboards, entities dashboards or execute wizards.
You can find all available functions and methods in Extra Information
Items per Page: Configures the number of software items to be displayed per page.
Image Execution Scheduler Browser
The Image Execution Scheduler Browser allows you to view/manage the image execution schedulers configured in your organization.
How it Works
Each image execution scheduler will be displayed in the browser, showing some details about them such as the type of image execution scheduler and the configuration mode used.
Widget Menu
From the widget’s action menu, you can perform the following:
Executions history: Shows the executions history for all image execution scheduled.
Image Execution Scheduler wizard: Allows the execution of the wizard for creating a new image execution scheduler (provided the necessary permissions are available).
Capture screen: Takes a screenshot of the widget.
Duplicate widget: Creates a duplicate of the widget on the dashboard.
Copy widget: Copies the widget to another dashboard.
Change widget location: Moves the widget to another dashboard.
Actions per Image Execution Scheduler
The following are the possible actions to be performed for each of the schedulers:
History opens image execution executions history in a modal.
Clone will open the image execution scheduler wizard for creating a new image execution scheduler that will contain the configuration of the selected one.
Remove deletes the selected scheduler.
Configuration
General
Boxed: widget will be displayed with background in dahsboard.
About: widget description in Markdown format.
Title: widget title. It can be configured to remain fixed in the widget or only be displayed when it receives focus.
Toolbar: configures the behavior of the widget bar on the dashboard, allowing you to hide it, hide it when not in use, or leave it always visible.
Refresh Frequency: allows configuring the data refresh frequency displayed in the list.
Extra actions: allows user to add new specific actions to the widget with your own code.
You can add a new one by pressing the New button.
Once you added a custom action it can be modified later by pressing the name in the list.
In order to remove the custom action click the delete icon button on the right.
In extra actions you can write your own code were you can open other dashboards, entities dashboards or execute wizards.
You can find all available functions and methods in Extra Information
Manufacturers and Models Browser
Here, you can consult and/or manage the manufacturers and models on the platform.
How it Works
Widget Menu
From the action menu of the widget, it will be possible to do the following:
New manufacturer: allows you to run the creation wizard for manufacturer (provided you have the necessary permissions).
New model: allows you to run the creation wizard for manufacturer model (provided you have the necessary permissions).
Capture screen: Takes a screenshot of the widget.
Duplicate widget: Creates a duplicate of the widget on the dashboard.
Copy widget: Copies the widget to another dashboard.
Change widget location: Moves the widget to another dashboard.
Any changes made will affect all organizations; therefore, maintenance is restricted to platform administrators.
Actions by Manufacturer
The following are the possible actions to be taken for each manufacturer:
Images: If the manufacturer has attached images, this option will be displayed to view them in full screen.
New Model: Opens the model creation wizard with the selected manufacturer pre-filled.
Edit: Opens the manufacturer wizard where you can change the manufacturer’s details.
Remove: Deletes the selected manufacturer as well as all the models associated with it.
By clicking the expand button, you can see the manufacturer’s details as well as a list of all available models, if any exist.
Actions by Model
The following are the possible actions for each of the available models for the manufacturer:
Change Manufacturer: Allows you to directly move the model to another manufacturer.
Edit: Opens the model configuration wizard to change its parameters.
Remove: Deletes the selected item.
Configuration
General
Boxed: widget will be displayed with background in dahsboard.
About: widget description in Markdown format.
Title: widget title. It can be configured to remain fixed in the widget or only be displayed when it receives focus.
Toolbar: configures the behavior of the widget bar on the dashboard, allowing you to hide it, hide it when not in use, or leave it always visible.
Refresh Frequency: allows configuring the data refresh frequency displayed in the list.
Extra actions: allows user to add new specific actions to the widget with your own code.
You can add a new one by pressing the New button.
Once you added a custom action it can be modified later by pressing the name in the list.
In order to remove the custom action click the delete icon button on the right.
In extra actions you can write your own code were you can open other dashboards, entities dashboards or execute wizards.
You can find all available functions and methods in Extra Information
Items per Page: Configures the number of manufacturers to be displayed per page.
Notebooks scheduler
The notebooks scheduler allows you to execute and manage schedulers for datalab notebooks
How it works
From the browser, you can view the notebooks created in Opengate Data lab
Widget Menu
From the action menu of the widget, it will be possible to do the following:
New notebook scheduler: allows you to run the notebook scheduler wizard
Open Opengate Datalab: allows you to open the Opengate Datalab tool if available
Capture screen: Takes a screenshot of the widget.
Duplicate widget: Creates a duplicate of the widget on the dashboard.
Copy widget: Copies the widget to another dashboard.
Change widget location: Moves the widget to another dashboard.
Notebook actions
The following are the possible actions to perform for each of the organization’s own certificates.
Execute allows you to execute once the selected notebook (same as scheduler but without time settings)
Open in datalab opens notebook in the Opengate Datalab tool
Schedule opens notebook scheduler wizard in order to create a new schedule
Schedulers lists available schedulers for the selected notebook
For each scheduler you can do the following
Scheduler identifier for scheduler
Report shows if execution generates report
Report retention days days to expire report
Parameters list of configured parameters
Last execution date last time scheduler runs
Next execution date date for the next execution
Cron pattern
Configuration
General
Boxed: widget will be displayed with background in dahsboard.
About: widget description in Markdown format.
Title: widget title. It can be configured to remain fixed in the widget or only be displayed when it receives focus.
Toolbar: configures the behavior of the widget bar on the dashboard, allowing you to hide it, hide it when not in use, or leave it always visible.
Refresh Frequency: allows configuring the data refresh frequency displayed in the list.
Extra actions: allows user to add new specific actions to the widget with your own code.
You can add a new one by pressing the New button.
Once you added a custom action it can be modified later by pressing the name in the list.
In order to remove the custom action click the delete icon button on the right.
In extra actions you can write your own code were you can open other dashboards, entities dashboards or execute wizards.
You can find all available functions and methods in Extra Information
Organization Plans Browser
In this widget, you can navigate through different plans within your organization. Actions can be performed on each of the identifying elements within each organization.
How it Works
By selecting an organization, the plans belonging to it will be displayed in the browser, showing some details about them.
Widget Menu
From the widget’s action menu, you can perform the following:
New Organization Plan: Allows the execution of the wizard for creating a new plan (provided the necessary permissions are available).
Capture screen: Takes a screenshot of the widget.
Duplicate widget: Creates a duplicate of the widget on the dashboard.
Copy widget: Copies the widget to another dashboard.
Change widget location: Moves the widget to another dashboard.
Organization Plans Actions
The following are the actions that can be performed on each plan:
Edit: Opens organization plans wizard in order to edit the selected plan.
Clone: Opens organization plans wizard in order to clone the selected plan.
Remove: Removes the selected plan.
Configuration
General
Boxed: widget will be displayed with background in dahsboard.
About: widget description in Markdown format.
Title: widget title. It can be configured to remain fixed in the widget or only be displayed when it receives focus.
Toolbar: configures the behavior of the widget bar on the dashboard, allowing you to hide it, hide it when not in use, or leave it always visible.
Refresh Frequency: allows configuring the data refresh frequency displayed in the list.
Extra actions: allows user to add new specific actions to the widget with your own code.
You can add a new one by pressing the New button.
Once you added a custom action it can be modified later by pressing the name in the list.
In order to remove the custom action click the delete icon button on the right.
In extra actions you can write your own code were you can open other dashboards, entities dashboards or execute wizards.
You can find all available functions and methods in Extra Information
Organizations Browser
In this widget, you can navigate through different organizations within your own. Actions can be performed on each of the identifying elements within each organization.
How it Works
Organization Actions
The following are the actions that can be performed on the selected organization:
Edit: Allows management of the organization data.
New Suborganization: Creates a new organization under the current organization.
New Workgroup: Opens the workgroup wizard filtered by the selected organization.
New Channel: Opens the channels wizard filtered by the selected organization.
Open Users List: Opens a user list widget in a popup, filtered by the selected organization.
Open Entities List: Opens an entities list widget in a popup, filtered by the selected organization.
Remove: Deletes the current organization.
Channels
From the Channels tab, you can see which channels exist for that organization and perform actions on them.
The following are the actions that can be performed:
Edit: Allows management of the channel data.
New Entity: Opens the entity wizard to create a new one in this channel.
New Asset: Opens the asset wizard to create a new one in this channel.
Remove: Deletes the current channel.
Workgroups
From the Workgroups tab, you can see which workgroups exist for that organization and perform actions on them.
The following are the actions that can be performed:
Edit: Allows management of the workgroup data.
Open Users List: Opens a user list widget in a popup, filtered by the selected organization.
New User: Opens the users wizard to create a new one in this workgroup.
Remove: Deletes the current workgroup.
Navigation Between Organizations
You can navigate directly to the desired organization in the organizations tree.
Configuration
General
Boxed: widget will be displayed with background in dahsboard.
About: widget description in Markdown format.
Title: widget title. It can be configured to remain fixed in the widget or only be displayed when it receives focus.
Toolbar: configures the behavior of the widget bar on the dashboard, allowing you to hide it, hide it when not in use, or leave it always visible.
Refresh Frequency: allows configuring the data refresh frequency displayed in the list.
Extra actions: allows user to add new specific actions to the widget with your own code.
You can add a new one by pressing the New button.
Once you added a custom action it can be modified later by pressing the name in the list.
In order to remove the custom action click the delete icon button on the right.
In extra actions you can write your own code were you can open other dashboards, entities dashboards or execute wizards.
You can find all available functions and methods in Extra Information
Periodic Operations Browser
In this widget, you can view/manage the periodic operations configured within the organization.
How it Works
The browser will display the name assigned to the periodic operation as well as its current status and the type of operation it performs.
Widget Menu
From the action menu of the widget, the following activities can be performed:
Download: Allows you to download the list of available periodic operations.
Download Page: Enables you to download the list of periodic operations that are visible at that moment.
Execute Operation: Opens the wizard to execute a new operation, provided the necessary permissions are available.
Toggle Selection: Allows you to toggle the selection of tasks using checkboxes. This enables you to view in other compatible widgets the content filtered by this information.
Capture screen: Takes a screenshot of the widget.
Duplicate widget: Creates a duplicate of the widget on the dashboard.
Copy widget: Copies the widget to another dashboard.
Change widget location: Moves the widget to another dashboard.
At the top of the widget, the following options are available:
Selection Edit: Displays the elements selected by the user and allows for their quick removal.
Show Active (Toggle): Instructs the widget to display only those operations that are currently active, rather than all of them.
Actions on Periodic Operations
For each periodic operation, you can perform the following actions:
Active Switch: Enables you to activate/deactivate the periodic operation (required for changing its parameters).
Summary: Displays a panel containing details of the periodic operation.
Operations List: Opens a widget that lists operations executed by the selected periodic operation.
Cancel: Cancels the periodic operation so that it will not be executed again. This requires it to be deactivated.
Configuration
General
Boxed: widget will be displayed with background in dahsboard.
About: widget description in Markdown format.
Title: widget title. It can be configured to remain fixed in the widget or only be displayed when it receives focus.
Toolbar: configures the behavior of the widget bar on the dashboard, allowing you to hide it, hide it when not in use, or leave it always visible.
Refresh Frequency: allows configuring the data refresh frequency displayed in the list.
Extra actions: allows user to add new specific actions to the widget with your own code.
You can add a new one by pressing the New button.
Once you added a custom action it can be modified later by pressing the name in the list.
In order to remove the custom action click the delete icon button on the right.
In extra actions you can write your own code were you can open other dashboards, entities dashboards or execute wizards.
You can find all available functions and methods in Extra Information
Items per Page: Specifies the number of elements to be displayed per page.
Periodic operations calendar
In this widget, you can view the executions of periodic operations in a calendar format.
How it Works
The calendar for periodic operations will display the operations that correspond to the selected periodicities.
Widget Menu
From the widget’s action menu, it will be possible to perform the following:
Execute Operation: Opens the wizard to execute a new operation, provided the necessary permissions are available.
Capture screen: Takes a screenshot of the widget.
Duplicate widget: Creates a duplicate of the widget on the dashboard.
Copy widget: Copies the widget to another dashboard.
Change widget location: Moves the widget to another dashboard.
In the widget’s toolbar, we find the following options (in order of appearance):
Today (Button): Allows quick navigation to the current day on the calendar.
Previous/Next Arrows (Buttons): Navigate to the previous/next item in the current calendar depending on its type.
Current Month: Displays the month and year of the calendar being viewed.
Selected Tasks List: A list of tasks selected for display on the calendar.
Tasks List: Opens a widget with a list of configured periodic operations. This is used to select what to display on the calendar.
Zoom In/Out (Buttons): Controls the zoom level of the displayed data.
Period Selector: Allows the selection of the period to be displayed.
The different periods to be displayed are:
Day: Displays all planned and executed operations for the selected periodic operations.
Day/Operation: Displays all planned and executed operations for the selected periodic operations, allocating a column for each periodicity.
Week: Displays all operations planned for the selected week.
Month: Displays all operations planned for the selected month.
Actions on Periodic Operations
By clicking on an operation, you can view its configuration data.
The displayed information is categorized as follows:
Execution Details: Here the summary of the selected operation is shown.
Parameters: Displays the operation’s parameters.
Configured Times: Details the times set for the operation.
Scheduled: Displays the periodicity settings for the operation.
If the selected item has already been executed, the following additional data will be displayed:
Execution Details: Here the summary of the executed operation is shown.
Parameters: Displays the operation’s parameters.
Timing: Details the timing of the operation.
Result: Provides a summary of how the operation has transpired.
Configuration
General
Boxed: widget will be displayed with background in dahsboard.
About: widget description in Markdown format.
Title: widget title. It can be configured to remain fixed in the widget or only be displayed when it receives focus.
Toolbar: configures the behavior of the widget bar on the dashboard, allowing you to hide it, hide it when not in use, or leave it always visible.
Refresh Frequency: allows configuring the data refresh frequency displayed in the list.
Extra actions: allows user to add new specific actions to the widget with your own code.
You can add a new one by pressing the New button.
Once you added a custom action it can be modified later by pressing the name in the list.
In order to remove the custom action click the delete icon button on the right.
In extra actions you can write your own code were you can open other dashboards, entities dashboards or execute wizards.
You can find all available functions and methods in Extra Information
Pipeline Scheduler Browser
The Pipeline Scheduler Browser allows you to view/manage the pipeline schedulers configured in your organization.
How it Works
Each pipeline scheduler will be displayed in the browser, showing some details about them such as the type of pipeline scheduler and the configuration mode used.
Widget Menu
From the widget’s action menu, you can perform the following:
Executions history: Shows the executions history for all pipeline scheduled.
Pipeline Scheduler wizard: Allows the execution of the wizard for creating a new pipeline scheduler (provided the necessary permissions are available).
Capture screen: Takes a screenshot of the widget.
Duplicate widget: Creates a duplicate of the widget on the dashboard.
Copy widget: Copies the widget to another dashboard.
Change widget location: Moves the widget to another dashboard.
Actions per Pipeline Scheduler
The following are the possible actions to be performed for each of the schedulers:
History opens pipeline executions history in a modal.
Clone will open the pipeline scheduler wizard for creating a new pipeline scheduler that will contain the configuration of the selected one.
Remove deletes the selected scheduler.
Configuration
General
Boxed: widget will be displayed with background in dahsboard.
About: widget description in Markdown format.
Title: widget title. It can be configured to remain fixed in the widget or only be displayed when it receives focus.
Toolbar: configures the behavior of the widget bar on the dashboard, allowing you to hide it, hide it when not in use, or leave it always visible.
Refresh Frequency: allows configuring the data refresh frequency displayed in the list.
Extra actions: allows user to add new specific actions to the widget with your own code.
You can add a new one by pressing the New button.
Once you added a custom action it can be modified later by pressing the name in the list.
In order to remove the custom action click the delete icon button on the right.
In extra actions you can write your own code were you can open other dashboards, entities dashboards or execute wizards.
You can find all available functions and methods in Extra Information
Provisioning Functions Navigator
In this widget, you will find the provisioning functions configured for your organization.
How it Works
In the browser, you will find a list of provisioning functions along with the available actions for each, depending on the permissions you hold.
Widget Menu
From the widget’s action menu, you can perform the following:
New provision function: Allows the execution of the wizard for creating provisioning functions (provided the necessary permissions are available).
Capture screen: Takes a screenshot of the widget.
Duplicate widget: Creates a duplicate of the widget on the dashboard.
Copy widget: Copies the widget to another dashboard.
Change widget location: Moves the widget to another dashboard.
Organization Selector
A user can manage the provisioning functions for organizations that are dependent on the user’s own organization. To switch between organizations, you must use the selector available at the top of the widget.
Actions on Time Series
For each time series, you can perform the following actions:
Edit: Opens the editing wizard to modify the parameters of the provisioning function.
Summary: Displays information on the configuration of the provisioning function within the widget itself.
Delete: Removes the selected item.
Configuration
General
Boxed: widget will be displayed with background in dahsboard.
About: widget description in Markdown format.
Title: widget title. It can be configured to remain fixed in the widget or only be displayed when it receives focus.
Toolbar: configures the behavior of the widget bar on the dashboard, allowing you to hide it, hide it when not in use, or leave it always visible.
Refresh Frequency: allows configuring the data refresh frequency displayed in the list.
Extra actions: allows user to add new specific actions to the widget with your own code.
You can add a new one by pressing the New button.
Once you added a custom action it can be modified later by pressing the name in the list.
In order to remove the custom action click the delete icon button on the right.
In extra actions you can write your own code were you can open other dashboards, entities dashboards or execute wizards.
You can find all available functions and methods in Extra Information
Rest Request Scheduler Browser
The Rest Request Scheduler Browser allows you to view/manage the rest request schedulers configured in your organization.
How it Works
Each rest request scheduler will be displayed in the browser, showing some details about them such as the type of rest request scheduler and the configuration mode used.
Widget Menu
From the widget’s action menu, you can perform the following:
Executions history: Shows the executions history for all rest request scheduled.
Rest Request Scheduler wizard: Allows the execution of the wizard for creating a new rest request scheduler (provided the necessary permissions are available).
Capture screen: Takes a screenshot of the widget.
Duplicate widget: Creates a duplicate of the widget on the dashboard.
Copy widget: Copies the widget to another dashboard.
Change widget location: Moves the widget to another dashboard.
Actions per RestRequest
The following are the possible actions to be performed for each of the schedulers:
History opens rest request executions history in a modal.
Clone will open the rest request scheduler wizard for creating a new rest request scheduler that will contain the configuration of the selected one.
Remove deletes the selected scheduler.
Configuration
General
Boxed: widget will be displayed with background in dahsboard.
About: widget description in Markdown format.
Title: widget title. It can be configured to remain fixed in the widget or only be displayed when it receives focus.
Toolbar: configures the behavior of the widget bar on the dashboard, allowing you to hide it, hide it when not in use, or leave it always visible.
Refresh Frequency: allows configuring the data refresh frequency displayed in the list.
Extra actions: allows user to add new specific actions to the widget with your own code.
You can add a new one by pressing the New button.
Once you added a custom action it can be modified later by pressing the name in the list.
In order to remove the custom action click the delete icon button on the right.
In extra actions you can write your own code were you can open other dashboards, entities dashboards or execute wizards.
You can find all available functions and methods in Extra Information
Rules Configuration Browser
The Rules Browser allows you to view/manage the rules configured in your organization.
How it Works
Each rule will be displayed in the browser, showing some details about them such as the type of rule and the configuration mode used.
Widget Menu
From the widget’s action menu, you can perform the following:
Rules wizard: Allows the execution of the wizard for creating a new rule (provided the necessary permissions are available).
Capture screen: Takes a screenshot of the widget.
Duplicate widget: Creates a duplicate of the widget on the dashboard.
Copy widget: Copies the widget to another dashboard.
Change widget location: Moves the widget to another dashboard.
Additionally, you can toggle between active and inactive rules to facilitate sampling according to needs.
Channel Selector
A user can manage the connector functions for those channels that depend on the user’s organization. To switch between channels, you must use the selector available at the top of the widget.
Actions per Rule
The following are the possible actions to be performed for each of the rules:
Activation toggle allows the immediate activation and deactivation of the rule.
Edit opens the rules configurator to modify the parameters of the rule.
Clone will open the rules configurator for creating a new rule that will contain the configuration of the selected one.
Remove deletes the selected rule.
Configuration
General
Boxed: widget will be displayed with background in dahsboard.
About: widget description in Markdown format.
Title: widget title. It can be configured to remain fixed in the widget or only be displayed when it receives focus.
Toolbar: configures the behavior of the widget bar on the dashboard, allowing you to hide it, hide it when not in use, or leave it always visible.
Refresh Frequency: allows configuring the data refresh frequency displayed in the list.
Extra actions: allows user to add new specific actions to the widget with your own code.
You can add a new one by pressing the New button.
Once you added a custom action it can be modified later by pressing the name in the list.
In order to remove the custom action click the delete icon button on the right.
In extra actions you can write your own code were you can open other dashboards, entities dashboards or execute wizards.
You can find all available functions and methods in Extra Information
Specific types Browser
In this widget, you will find the Specific types configured for your organization.
How it Works
In the browser, you will find a list of Specific types along with the available actions for each, based on the permissions you have.
Browser allows to view the data in 2 different modes:
Grid: shows the complete list of specific types with the resource types supported in a grid of checkboxes (default view)
List: shows a list with the different resource types and their supported specific types.
Widget Menu
From the action menu of the widget, you can perform the following:
Capture screen: Takes a screenshot of the widget.
Duplicate widget: Creates a duplicate of the widget on the dashboard.
Copy widget: Copies the widget to another dashboard.
Change widget location: Moves the widget to another dashboard.
Edit opens Specific Type manager modal.
Organization Selector
A user can manage the Specific types for those organizations that are dependent on the user’s own organization. To switch between organizations, you must select it from the selector available at the top of the widget.
Actions on Specific types
A user with privileges can add new Specific Types and edit and/or delete existing ones.
Every Specific Type must have one resource type selected and cannot be duplicated.
Configuration
General
Boxed: widget will be displayed with background in dahsboard.
About: widget description in Markdown format.
Title: widget title. It can be configured to remain fixed in the widget or only be displayed when it receives focus.
Toolbar: configures the behavior of the widget bar on the dashboard, allowing you to hide it, hide it when not in use, or leave it always visible.
Refresh Frequency: allows configuring the data refresh frequency displayed in the list.
Extra actions: allows user to add new specific actions to the widget with your own code.
You can add a new one by pressing the New button.
Once you added a custom action it can be modified later by pressing the name in the list.
In order to remove the custom action click the delete icon button on the right.
In extra actions you can write your own code were you can open other dashboards, entities dashboards or execute wizards.
You can find all available functions and methods in Extra Information
Time Series Browser
In this widget, you will find the time series configured for your organization.
How it Works
In the browser, you will find a list of time series along with the available actions for each, depending on the permissions you hold.
Widget Menu
From the widget’s action menu, you can perform the following:
New time series: Allows the execution of the wizard for creating new time series (provided the necessary permissions are available).
Capture screen: Takes a screenshot of the widget.
Duplicate widget: Creates a duplicate of the widget on the dashboard.
Copy widget: Copies the widget to another dashboard.
Change widget location: Moves the widget to another dashboard.
Organization Selector
A user can manage the time series for organizations that are dependent on the user’s own organization. To switch between organizations, you must use the selector available at the top of the widget.
Actions on Time Series
For each time series, you can perform the following actions:
View data: Opens a time series listing widget where you can view the data of the selected time series.
Edit: Initiates a wizard for editing the time series using the configuration data of the current one.
Clone: Initiates a wizard for creating a new time series using the configuration data of the current one.
Columns: Displays within the widget itself information on the time series configuration as well as the configured columns.
Delete: Removes the selected time series and all its data.
Configuration
General
Boxed: widget will be displayed with background in dahsboard.
About: widget description in Markdown format.
Title: widget title. It can be configured to remain fixed in the widget or only be displayed when it receives focus.
Toolbar: configures the behavior of the widget bar on the dashboard, allowing you to hide it, hide it when not in use, or leave it always visible.
Refresh Frequency: allows configuring the data refresh frequency displayed in the list.
Extra actions: allows user to add new specific actions to the widget with your own code.
You can add a new one by pressing the New button.
Once you added a custom action it can be modified later by pressing the name in the list.
In order to remove the custom action click the delete icon button on the right.
In extra actions you can write your own code were you can open other dashboards, entities dashboards or execute wizards.
You can find all available functions and methods in Extra Information
Time series function Browser
In this widget, you will find the time series functions configured for your organization.
How it Works
In the browser, you will find a list of time series functions along with the available actions for each, based on the permissions you have.
You can see this information for each function:
Name: function name
Origin: who provides the function. It can be PLATFORM (product preconfigured) and ORGANIZATION (user created).
Value Types: input value types allowed by the function
Description: the function algorithm description
Widget Menu
From the action menu of the widget, you can perform the following:
New Time Series Function: This allows you to run the time series function creation wizard (provided you have the necessary permissions).
Capture screen: Takes a screenshot of the widget.
Duplicate widget: Creates a duplicate of the widget on the dashboard.
Copy widget: Copies the widget to another dashboard.
Change widget location: Moves the widget to another dashboard.
Organization Selector
A user can manage the time series functions for those organizations that are dependent on the user’s own organization. To switch between organizations, you must select it from the selector available at the top of the widget.
Actions on Time Series Function
For each time series function, you can perform the following actions:
Clone: Allows you to initiate a time series function creation wizard with the configuration data of the current one.
Edit: Allows you to initiate a time series function update wizard with the configuration data of the current one. Only ORGANIZATION functions.
Delete: Removes the selected time series function and all its associated data. Only ORGANIZATION functions.
Configuration
General
Boxed: widget will be displayed with background in dahsboard.
About: widget description in Markdown format.
Title: widget title. It can be configured to remain fixed in the widget or only be displayed when it receives focus.
Toolbar: configures the behavior of the widget bar on the dashboard, allowing you to hide it, hide it when not in use, or leave it always visible.
Refresh Frequency: allows configuring the data refresh frequency displayed in the list.
Extra actions: allows user to add new specific actions to the widget with your own code.
You can add a new one by pressing the New button.
Once you added a custom action it can be modified later by pressing the name in the list.
In order to remove the custom action click the delete icon button on the right.
In extra actions you can write your own code were you can open other dashboards, entities dashboards or execute wizards.
You can find all available functions and methods in Extra Information
Graphical representation of data stream information
How it works
Widget Menu
From here, the following actions can be performed:
Open device information allows for the opening of a temporary dashboard associated with the selected entity
Edit allows the editing of the selected entity
Historical data displays the chart data in a list format (requires selecting a grouping parameter)
Download downloads the data displayed in the chart in CSV format
Visualization toggles between different data visualization options on the chart
Capture screen: Takes a screenshot of the widget.
Duplicate widget: Creates a duplicate of the widget on the dashboard.
Copy widget: Copies the widget to another dashboard.
Change widget location: Moves the widget to another dashboard.
Configuration
General
Boxed: widget will be displayed with background in dahsboard.
About: widget description in Markdown format.
Title: widget title. It can be configured to remain fixed in the widget or only be displayed when it receives focus.
Toolbar: configures the behavior of the widget bar on the dashboard, allowing you to hide it, hide it when not in use, or leave it always visible.
Refresh Frequency: allows configuring the data refresh frequency displayed in the list.
Extra actions: allows user to add new specific actions to the widget with your own code.
You can add a new one by pressing the New button.
Once you added a custom action it can be modified later by pressing the name in the list.
In order to remove the custom action click the delete icon button on the right.
In extra actions you can write your own code were you can open other dashboards, entities dashboards or execute wizards.
You can find all available functions and methods in Extra Information
Resource Type + EntityKey(s) specifies the resource type and identifier of the entities to be queried (not required)
Columns from which to extract data to display on the graph must be configured. A graph will be generated for each column.
For each piece of data, the following can be configured:
Alias a representative name for the column data on the chart
Color to distinguish it on the graph
Intensity allows for the graph to change shades depending on the value
Unit indicates the measurement being displayed on the corresponding axis
Chart Type toggles between different data visualization possibilities. Can also be configured globally for all metrics.
Axis editor enables the configuration of the Y-axis on the chart to assign discrete values to specific values
Formatter tool is a utility that processes each data point, allowing for its modification and/or calculation before it is displayed on the graph. For instance, it can convert discrete data into numerical data for representation.
Reduce tool allows code-based reformulation of series data by grouping and similar operations.
Remove removes the data stream from the chart
Advanced
From here, you can configure the widget’s behavior while plotting the graph as well as when it is opened within a temporary dashboard.
Prevent interpolation allows the avoidance of data interpolation where possible
Statistical data graph displays a panel with basic statistical values
Data Stream template activates the override of the EntityKey in the widget when the dashboard is opened in a device template, taking a data stream from the entity itself at the time of loading
Visualization
From here, you can change some visual aspects of the widget.
Background color allows setting a distinctive color for the widget
Hide details header panel hides the upper information panel of the widget, freeing up that space
Show basic stats in chart displays basic statistics on the chart data as long as only one series is being represented
Data Stream timeline
Graphical representation of the timeline of historical data from a data stream
How it works
This widget facilitates the visualization of value changes in a field over time.
Each timeline will display the name of the data stream along with the represented value, arranged as follows:
field
value
Grouping
By enabling the grouping of timelines, one can view all represented states on a single timeline (without separation).
When data are grouped, the representation of the timeline will change, displaying the value on the same timeline, and each bar will contain the following:
field
Summary
The summary panel allows you to observe the total time each value has been maintained.
Widget Menu
From here, the following actions can be performed:
Open device information opens the corresponding temporary panel with the selected entity
Edit opens the wizard corresponding to the selected entity
Generate QR generates a QR code that will return basic information about the asset
Execute operation opens the pre-configured operation launcher for the selected entity
Capture screen: Takes a screenshot of the widget.
Duplicate widget: Creates a duplicate of the widget on the dashboard.
Copy widget: Copies the widget to another dashboard.
Change widget location: Moves the widget to another dashboard.
Configuration
General
Boxed: widget will be displayed with background in dahsboard.
About: widget description in Markdown format.
Title: widget title. It can be configured to remain fixed in the widget or only be displayed when it receives focus.
Toolbar: configures the behavior of the widget bar on the dashboard, allowing you to hide it, hide it when not in use, or leave it always visible.
Refresh Frequency: allows configuring the data refresh frequency displayed in the list.
Extra actions: allows user to add new specific actions to the widget with your own code.
You can add a new one by pressing the New button.
Once you added a custom action it can be modified later by pressing the name in the list.
In order to remove the custom action click the delete icon button on the right.
In extra actions you can write your own code were you can open other dashboards, entities dashboards or execute wizards.
You can find all available functions and methods in Extra Information
Entity key of the desired entity to obtain the data
Finally, those columns from which to extract data to display on the graph must be configured. A timeline will be generated for each of them.
For each piece of data, the following can be configured:
Alias a representative name for the column data on the graph
Color to distinguish it within the graph
Formatter tool is a tool that will process each piece of data, allowing for its modification and/or any calculation to ultimately display it on the graph. For example, it can convert numerical data into discrete data for representation.
Remove will remove the column from the configuration
Visualization
From here, some visual aspects of the widget can be changed.
Background color allows you to set a distinctive color for the widget
Hide details header panel hides the upper information panel of the widget, freeing up that space
Devices data stream history
Graphical representation of data from a data stream for multiple devices simultaneously
How it works
Widget Menu
From here, the following actions can be executed:
Download allows for downloading the data displayed on the chart in CSV format
Capture screen: Takes a screenshot of the widget.
Duplicate widget: Creates a duplicate of the widget on the dashboard.
Copy widget: Copies the widget to another dashboard.
Change widget location: Moves the widget to another dashboard.
Configuration
General
Boxed: widget will be displayed with background in dahsboard.
About: widget description in Markdown format.
Title: widget title. It can be configured to remain fixed in the widget or only be displayed when it receives focus.
Toolbar: configures the behavior of the widget bar on the dashboard, allowing you to hide it, hide it when not in use, or leave it always visible.
Refresh Frequency: allows configuring the data refresh frequency displayed in the list.
Extra actions: allows user to add new specific actions to the widget with your own code.
You can add a new one by pressing the New button.
Once you added a custom action it can be modified later by pressing the name in the list.
In order to remove the custom action click the delete icon button on the right.
In extra actions you can write your own code were you can open other dashboards, entities dashboards or execute wizards.
You can find all available functions and methods in Extra Information
Data Stream Id is the data stream you wish to represent on the chart for various entities
Axis formatter allows for the representation of discrete values on the Y-axis of the chart
Values formatter enables alteration of the obtained values for the chart. This allows for the representation of discrete values by assigning them a numerical value.
Chart type is the kind of charts to display
EntityKey(s) type of resource and identifier of the entities you wish to consult (not required)
For each entity, the following options are available:
Color an identifying color on the chart
Remove deletes the configuration of the entity from the widget
Advanced
From here, you can configure how the widget behaves when rendering the chart.
Prevent interpolation allows for avoiding data interpolation when possible
Statistical data graph displays a panel with basic statistical values
Visualization
From this point, some visual aspects of the widget can be changed.
Background color allows for setting a distinctive color for the widget
Hide details header panel hides the top information panel of the widget, freeing up that space
Multiple Time Series history
Graphical representation of data from multiple time series.
How it works
Widget Menu
From this section, the following actions can be performed:
Open device information allows opening the temporary dashboard of the selected entity
Edit enables the editing of the selected entity
Historical data displays the graph data in list format
Visualization allows toggling between different data visualization options in the graph.
Capture screen: Takes a screenshot of the widget.
Duplicate widget: Creates a duplicate of the widget on the dashboard.
Copy widget: Copies the widget to another dashboard.
Change widget location: Moves the widget to another dashboard.
Configuration
General
Boxed: widget will be displayed with background in dahsboard.
About: widget description in Markdown format.
Title: widget title. It can be configured to remain fixed in the widget or only be displayed when it receives focus.
Toolbar: configures the behavior of the widget bar on the dashboard, allowing you to hide it, hide it when not in use, or leave it always visible.
Refresh Frequency: allows configuring the data refresh frequency displayed in the list.
Extra actions: allows user to add new specific actions to the widget with your own code.
You can add a new one by pressing the New button.
Once you added a custom action it can be modified later by pressing the name in the list.
In order to remove the custom action click the delete icon button on the right.
In extra actions you can write your own code were you can open other dashboards, entities dashboards or execute wizards.
You can find all available functions and methods in Extra Information
Resource Type + EntityKey(s) specifies the resource type and identifiers for the entities to be queried.
Chart type (outside of time series) forces same chart type to all series
Tooltip type determines how chart tooltip values will be displayed on mouse over
New timeserie allows user the addition of a new time serie configuration with its values.
For each time series you must configure the next:
Preferred organization allows user to configure how the time series organization will be selected
Selected organization selected by the user is the valid
User user organization will be used for the timeserie (important for shared dashboards)
Entity the organization of the opened entity in templates will be used for the timeserie, user’s otherwise
Organization + Time Series provides data of the time series to be queried
Identifier field tells the widget which column to use for data grouping
Date field specifies which column will serve as the temporal indicator for the data.
Lastly, columns must be configured to extract data to display on the graph. For each of these and the identifier, a graph will be generated.
For each piece of data, the following can be configured:
Alias specifies a representative name for the column data on the graph.
Color provides a way to distinguish data within the graph.
Intensity allows the graph to change shades depending on the value.
Unit indicates the measurement being displayed on the corresponding axis.
Chart type switches between different data visualization options. This can also be set globally for all measurements.
Axis editor allows configuring the Y-axis to assign discrete values to specific data points.
Formatter tool is a tool that treats each piece of data individually, allowing modifications and/or calculations to be performed before displaying it on the graph.
Reduce tool permits data reshaping through code, allowing for grouping and similar operations.
Advanced
From this section, the widget’s behavior when rendering the graph as well as when it is opened within a temporary dashboard can be configured.
Prevent interpolation avoids data interpolation when possible.
Statistical data graph displays a panel with basic statistical values.
Datastream template enables the overriding of the EntityKey in the widget when the dashboard is opened in a device template, using a datastream from the entity at the time of loading.
Visualization
From this section, some visual aspects of the widget can be modified.
Background color allows setting a distinctive color for the widget.
Hide details header panel hides the top information panel of the widget, freeing up that space.
Summary Chart
This widget displays graphs of summaries provided by the platform.
How it works
This widget facilitates the graphical visualization of summarized data.
Data can be displayed graphically, in table form, or both simultaneously.
Widget Menu
From this section, the following actions can be performed:
Capture screen: Takes a screenshot of the widget.
Duplicate widget: Creates a duplicate of the widget on the dashboard.
Copy widget: Copies the widget to another dashboard.
Change widget location: Moves the widget to another dashboard.
Widget Filter
With the filter, one can narrow down the number of results and obtain new metrics.
There are three types of filters: basic, advanced, or linked.
Basic allows the entry of any text and will filter by predetermined fields.
Advanced allows configuring a custom filter based on the displayed graph.
Linked ties the filter with that of another compatible widget, inheriting its query and refreshing both simultaneously.
Configuration
General
Boxed: widget will be displayed with background in dahsboard.
About: widget description in Markdown format.
Title: widget title. It can be configured to remain fixed in the widget or only be displayed when it receives focus.
Toolbar: configures the behavior of the widget bar on the dashboard, allowing you to hide it, hide it when not in use, or leave it always visible.
Refresh Frequency: allows configuring the data refresh frequency displayed in the list.
Extra actions: allows user to add new specific actions to the widget with your own code.
You can add a new one by pressing the New button.
Once you added a custom action it can be modified later by pressing the name in the list.
In order to remove the custom action click the delete icon button on the right.
In extra actions you can write your own code were you can open other dashboards, entities dashboards or execute wizards.
You can find all available functions and methods in Extra Information
Summary type allows selection among different types of summaries.
Summary format specifies the type of representation: graphical, table, or mixed (both simultaneously).
Table position allows specifying the table’s position in mixed mode.
Legend enables or disables the display of graph legends and their position.
Columns number tells the widget into how many columns the graphs should be distributed.
Style pie chart instructs the widget whether to display pie charts in donut format or regular (no format).
Finally, one must configure the data streams to summarize. The following must be indicated for each:
Column 1 specifies the type of graph to represent for the selected data stream.
Column 2, field allows choosing a field within a complex data stream.
Column 3, alias allows specifying the name of the data stream on the graph.
Formatter tool is a tool that allows formatting and altering the information returned by the platform to meet specific needs.
Remove will remove the column from the configuration.
When the summary type is “Entities Values,” additional configuration parameters will be activated. This is because this option calculates graph data based on a sample of the overall entities.
The global chart type field will be activated, and a new panel appears where the following will be configured:
Generated summary title is the name to display on the generated graph.
Statistics: count strategy specifies the operation to perform on the read data: total, median, mean, maximum, minimum, variance, and standard deviation.
Statistics: max samples specifies the number of samples to take for generating the graph.
The list of data streams will indicate on which data the indicated count strategy will act.
Advanced
From here, internal filters that would always apply regardless of user actions can be configured.
Private filter will always execute unless there is a template filter.
Template filter allows configuring a filter that will overwrite the private one when the dashboard opens in a temporary template.
Share filter tells the widget to share the private/template filter when this widget is selected in another widget via linked filter.
Time Series data timeline
Graphical representation of a time series data timeline.
How it works
This widget facilitates the visualization of value changes in a field over time within a time series.
Each timeline will display the group, the field, and the represented value, arranged as follows:
Group
Field
Value
Grouping
By enabling the grouping of timelines, you can view all represented states on a single timeline (without separation).
When the data is grouped, the representation of the timeline changes, displaying the value on the same timeline, and each bar will contain the following:
Group
Field
Resume
With the summary panel, you can observe the total time each value has been maintained.
Widget Menu
From here, the following actions can be performed:
Capture screen: Takes a screenshot of the widget.
Duplicate widget: Creates a duplicate of the widget on the dashboard.
Copy widget: Copies the widget to another dashboard.
Change widget location: Moves the widget to another dashboard.
Configuration
General
Boxed: widget will be displayed with background in dahsboard.
About: widget description in Markdown format.
Title: widget title. It can be configured to remain fixed in the widget or only be displayed when it receives focus.
Toolbar: configures the behavior of the widget bar on the dashboard, allowing you to hide it, hide it when not in use, or leave it always visible.
Refresh Frequency: allows configuring the data refresh frequency displayed in the list.
Extra actions: allows user to add new specific actions to the widget with your own code.
You can add a new one by pressing the New button.
Once you added a custom action it can be modified later by pressing the name in the list.
In order to remove the custom action click the delete icon button on the right.
In extra actions you can write your own code were you can open other dashboards, entities dashboards or execute wizards.
You can find all available functions and methods in Extra Information
Organization + Time Series provides data of the time series to be queried.
Start date field specifies which date-type column should be used to indicate the beginning of the period (*).
End date field specifies which date-type column should be used to indicate the end of the period (*).
Identifier field tells the widget which column to use for data grouping.
(*) If both dates use the same field, the start of the next state will be used to calculate the period.
Lastly, columns must be configured to extract data to display on the graph. For each of these and the group/identifier, a graph will be generated.
For each piece of data, the following can be configured:
Alias specifies a representative name for the column data on the graph.
Color provides a way to distinguish data within the graph.
Formatter tool is a tool that treats each piece of data individually, allowing for modifications and/or calculations before displaying it on the graph. For example, you can convert numerical data into discrete data for representation.
Remove will remove the column from the configuration.
Advanced
In this section, various filters that will be applied to queries will be configured, regardless of what the user may wish to filter subsequently.
Visualization
From here, some visual aspects of the widget can be modified.
Background color allows setting a distinctive color for the widget.
Hide details header panel hides the top information panel of the widget, freeing up that space.
Time Series history
Graphical representation of data from a time series.
How it works
Widget Menu
From this section, the following actions can be performed:
Open device information allows opening the temporary dashboard associated with the selected entity (only available when entities have been preselected).
Edit enables the editing of the selected entity (only available when entities have been preselected).
Historical data displays the graph data in list format (requires selecting a grouping field).
Visualization allows toggling between different data visualization options in the graph.
Capture screen: Takes a screenshot of the widget.
Duplicate widget: Creates a duplicate of the widget on the dashboard.
Copy widget: Copies the widget to another dashboard.
Change widget location: Moves the widget to another dashboard.
Configuration
General
Boxed: widget will be displayed with background in dahsboard.
About: widget description in Markdown format.
Title: widget title. It can be configured to remain fixed in the widget or only be displayed when it receives focus.
Toolbar: configures the behavior of the widget bar on the dashboard, allowing you to hide it, hide it when not in use, or leave it always visible.
Refresh Frequency: allows configuring the data refresh frequency displayed in the list.
Extra actions: allows user to add new specific actions to the widget with your own code.
You can add a new one by pressing the New button.
Once you added a custom action it can be modified later by pressing the name in the list.
In order to remove the custom action click the delete icon button on the right.
In extra actions you can write your own code were you can open other dashboards, entities dashboards or execute wizards.
You can find all available functions and methods in Extra Information
Chart type (outside of series) forces same chart type to all series
Tooltip type determines how chart tooltip values will be displayed on mouse over
Preferred organization allows user to configure how the time series organization will be selected
Selected organization selected by the user is the valid
User user organization will be used for the timeserie (important for shared dashboards)
Entity the organization of the opened entity in templates will be used for the timeserie, user’s otherwise
Organization + Time Series provides data of the time series to be queried.
Resource Type + EntityKey(s) specifies the resource type and identifiers for the entities to be queried (not required).
Grouping/Identifier field tells the widget which column to use for data grouping. If none is selected, all data will be grouped as one.
Date field specifies which column will serve as the temporal indicator for the data.
Lastly, columns must be configured to extract data to display on the graph. For each of these and the grouping/identifier, a graph will be generated.
For each piece of data, the following can be configured:
Alias specifies a representative name for the column data on the graph.
Color provides a way to distinguish data within the graph.
Intensity allows the graph to change shades depending on the value.
Unit indicates the measurement being displayed on the corresponding axis.
Chart type switches between different data visualization options. This can also be set globally for all measurements.
Axis editor allows configuring the Y-axis to assign discrete values to specific data points.
Formatter tool is a tool that treats each piece of data individually, allowing modifications and/or calculations to be performed before displaying it on the graph.
Reduce tool permits data reshaping through code, allowing for grouping and similar operations.
Advanced
From this section, the widget’s behavior when rendering the graph as well as when it is opened within a temporary dashboard can be configured.
Prevent interpolation avoids data interpolation when possible.
Statistical data graph displays a panel with basic statistical values.
Datastream template enables the overriding of the EntityKey in the widget when the dashboard is opened in a device template, using a datastream from the entity at the time of loading.
Visualization
From this section, some visual aspects of the widget can be modified.
Background color allows setting a distinctive color for the widget.
Hide details header panel hides the top information panel of the widget, freeing up that space.
Show basic stats in chart displays basic statistics on the graph itself when only one series is represented.
Entity Details
Widgets that display detailed information about a single entity or ticket.
In this widget, you will be able to see the devices related to an asset.
How it works
Widget Menu
The following actions can be performed:
Open entity information: Opens a temporary dashboard with information about the asset.
Edit: Opens the asset wizard.
Generate QR: Generates a QR code that will provide basic information about the asset.
Capture screen: Takes a screenshot of the widget.
Duplicate widget: Creates a duplicate of the widget on the dashboard.
Copy widget: Copies the widget to another dashboard.
Change widget location: Moves the widget to another dashboard.
Configuration
General
Boxed: widget will be displayed with background in dahsboard.
About: widget description in Markdown format.
Title: widget title. It can be configured to remain fixed in the widget or only be displayed when it receives focus.
Toolbar: configures the behavior of the widget bar on the dashboard, allowing you to hide it, hide it when not in use, or leave it always visible.
Refresh Frequency: allows configuring the data refresh frequency displayed in the list.
Extra actions: allows user to add new specific actions to the widget with your own code.
You can add a new one by pressing the New button.
Once you added a custom action it can be modified later by pressing the name in the list.
In order to remove the custom action click the delete icon button on the right.
In extra actions you can write your own code were you can open other dashboards, entities dashboards or execute wizards.
You can find all available functions and methods in Extra Information
Selection of the asset to display.
Visualization
Settings that can be configured:
Background color: Sets the background color of the widget.
Hide details header panel: Hides the title with the asset identifier.
Data stream Last Value
Widget that displays the last value obtained for a data stream.
How it works
The information can be displayed in various formats: graphically, symbolically, and textually.
We can also check its history and statistics: trend, maximum and minimum, percentile, mean, and median.
Widget Menu
The following actions can be performed:
Open device information: opens a temporary dashboard with device information
Edit: opens the device wizard
Open device details: opens the device information wizard
Generate QR: generates a QR code that will return basic information about the device
Historical data: “Data Points” widget in table format, showing the data stream’s history
View Chart: “Data Stream history” widget that displays the evolution of the data stream
Execute operation: opens the operation execution wizard to perform an operation on the device
Capture screen: Takes a screenshot of the widget.
Duplicate widget: Creates a duplicate of the widget on the dashboard.
Copy widget: Copies the widget to another dashboard.
Change widget location: Moves the widget to another dashboard.
Configuration
General
Boxed: widget will be displayed with background in dahsboard.
About: widget description in Markdown format.
Title: widget title. It can be configured to remain fixed in the widget or only be displayed when it receives focus.
Toolbar: configures the behavior of the widget bar on the dashboard, allowing you to hide it, hide it when not in use, or leave it always visible.
Refresh Frequency: allows configuring the data refresh frequency displayed in the list.
Extra actions: allows user to add new specific actions to the widget with your own code.
You can add a new one by pressing the New button.
Once you added a custom action it can be modified later by pressing the name in the list.
In order to remove the custom action click the delete icon button on the right.
In extra actions you can write your own code were you can open other dashboards, entities dashboards or execute wizards.
You can find all available functions and methods in Extra Information
Entity key: Device to display
DatastreamId: Data stream whose last value (and its statistics) will be displayed
Name: Alias for the selected field to display
Test Value: If this data is filled in, a preview of how the widget will look with the value given to the datastream will be displayed in the configuration.
Symbol: Unit for the value
View mode: Type of data visualization
Value: Value in text format (default mode).
Icon: Display an icon (Symbol field) along with the value in text mode.
Battery (Percent): Display the value within a battery. Reference values will be configured in the “Chart colors” panel.
Bar (Percent/Range): Display the value in a bar. Reference values will be configured in the “Chart colors” panel.
Gauge (Percent/Range): Display the value in a gauge-type graph. Reference values will be configured in the “Chart colors” panel.
Choose an icon: Icon to display (for Icon mode).
Choose color: Icon color.
Alignment: Alignment of the value (Value and Icon modes) in the widget.
Size: Value size.
Extra information: Extra information to display in the widget along with the value.
FORMATTER: Opens a panel where you can format the value.
dataFormatter: Value format
tooltip: Tooltip value format that appears when hovering over the value
In this case, the barBeginCircle option should always be set to false. If it is necessary to modify this option, it is recommended to use the thermometer chart type.
Historical data graph: Display a graph showing the value’s evolution over time
Statistical data graph: Display statistical data
Choose a period: Time frame for sampling the statistical data and its visualization in the value evolution graph
Trend: Assign a color based on the value’s trend
Visualization
We can configure certain elements of the graphs displayed in the widget:
Background color
Hide details header panel: Removes the menu allowing for the modification of the type of visualization as well as the type of value to display.
Device Hierarchy Graph
In this widget, you will be able to graphically view the hierarchy of a device within the organization.
How it works
You will be able to view its communication modules, related assets, and its topology.
You can choose between displaying:
provisioned values
collected values
both types of values
Communications Module
In this view, you will be able to see the communication modules available on the device.
By clicking on the device card, you can:
view pre-configured information in the widget
perform actions on the device
Related
In this view, you can see the assets related to the device.
By clicking on either the device card or the asset cards, you can:
view pre-configured information in the widget
perform actions on the device or asset
Topology
In this view, you can see the topology of the device.
A panel will be available to indicate the relationships between different entities.
Widget Menu
The following actions can be performed:
Open device information: Opens a temporary dashboard with the device information
Edit: Opens the device wizard
Generate QR: Generates a QR code that will provide basic information about the device
Execute operation: Opens an operation execution wizard to perform an operation on the device
Capture screen: Takes a screenshot of the widget.
Duplicate widget: Creates a duplicate of the widget on the dashboard.
Copy widget: Copies the widget to another dashboard.
Change widget location: Moves the widget to another dashboard.
Configuration
General
Boxed: widget will be displayed with background in dahsboard.
About: widget description in Markdown format.
Title: widget title. It can be configured to remain fixed in the widget or only be displayed when it receives focus.
Toolbar: configures the behavior of the widget bar on the dashboard, allowing you to hide it, hide it when not in use, or leave it always visible.
Refresh Frequency: allows configuring the data refresh frequency displayed in the list.
Extra actions: allows user to add new specific actions to the widget with your own code.
You can add a new one by pressing the New button.
Once you added a custom action it can be modified later by pressing the name in the list.
In order to remove the custom action click the delete icon button on the right.
In extra actions you can write your own code were you can open other dashboards, entities dashboards or execute wizards.
You can find all available functions and methods in Extra Information
Entity key: Device to display
View: Default view to display
Relations type: Type of values to display: collected, provisioned, or both
Popup
You can configure the information to display in the popup that appears when clicking on the cards displayed in the widget, selecting values from the available data streams.
Visualization
You can configure certain elements of the graphs displayed in the widget:
Background color
Hide details header panel: Removes the menu that allows changing the type of visualization as well as the type of value to display.
Provision elements color
Collection elements color
Entity Information Details
A widget that displays information about each of the data streams that make up the entity in a card format.
How it works
On each card, you will be able to see:
the current value
the date when the value was taken
the source of the information
the type of provisioning (for provisioned data)
identifying icon
Target menu
From each of the cards, you can open various widgets (varying depending on the type of data stream value):
Stream status: “Last Value” widget displaying datastream information, such as the last value and trends.
Historical data: “Data Points” widget in table format, showing the data stream’s historical data.
View Chart: “Data Stream history” widget displaying the data stream’s evolution in chart form.
View tracking data: “Tracking” widget showing the entity’s location on a map (only applicable if it’s a location-type data stream).
Change value (provision datastreams only): Allows the user to change the value of the datastream without having to open the corresponding wizard.
Grouping
Choice of type of grouping.
Depending on its configuration, it can be by:
data model
categories of a data model
tags
whether the value is provisioned or collected
Performance
Graph showing the performance of the data stream.
Widget Menu
The following actions can be performed:
Open device information: Opens a temporary dashboard with device information
Edit: Opens the device wizard
Execute operation: Opens an operation execution wizard to perform an operation on the device
Capture screen: Takes a screenshot of the widget.
Duplicate widget: Creates a duplicate of the widget on the dashboard.
Copy widget: Copies the widget to another dashboard.
Change widget location: Moves the widget to another dashboard.
Configuration
General
Boxed: widget will be displayed with background in dahsboard.
About: widget description in Markdown format.
Title: widget title. It can be configured to remain fixed in the widget or only be displayed when it receives focus.
Toolbar: configures the behavior of the widget bar on the dashboard, allowing you to hide it, hide it when not in use, or leave it always visible.
Refresh Frequency: allows configuring the data refresh frequency displayed in the list.
Extra actions: allows user to add new specific actions to the widget with your own code.
You can add a new one by pressing the New button.
Once you added a custom action it can be modified later by pressing the name in the list.
In order to remove the custom action click the delete icon button on the right.
In extra actions you can write your own code were you can open other dashboards, entities dashboards or execute wizards.
You can find all available functions and methods in Extra Information
Entity key: Device to display
Extra information: Choice of data to display within the card
Grouping: Choice of type of grouping:
data model
categories of a data model
tags
whether the value is provisioned or collected
DatastreamId: Choice and format of the displayed data streams
Choose whether to only view the selected data streams
Format the selected data streams
Alias
Category: a new category can be created for grouping the data streams
Position: position of the value on the card
Icon: representative icon that will be displayed on the card
Format: format the value of the displayed data stream
Advanced
Visualization
Certain elements of the graphs displayed in the widget can be configured:
Background color
Hide details header panel: Removes the menu that allows modifying the type of visualization and the type of value to display.
Default alignment: position of the value on the cards
Image Widget
The widget allows you to upload and configure an image with data icons overlaid on it.
How it works
Once the widget is configured, an image will be displayed with the configured data.
Icon Menu
Data can be viewed as icons positioned over the image, which we can interact with to view information about them:
Stream status: “Last Value” widget displaying datastream information, such as the last value and trends.
Historical data: “Data Points” widget in table format, showing the data stream’s historical data.
View Chart: “Data Stream history” widget displaying the data stream’s evolution in chart form.
View tracking data: “Tracking” widget showing the entity’s location on a map (only applicable if it’s a location-type data stream).
Change value (provision datastreams only): Allows the user to change the value of the datastream without having to open the corresponding wizard.
Widget Menu
The following actions can be performed:
Capture screen: Takes a screenshot of the widget.
Duplicate widget: Creates a duplicate of the widget on the dashboard.
Copy widget: Copies the widget to another dashboard.
Change widget location: Moves the widget to another dashboard.
Configuration
Image Upload
From here, we can upload the image to display and its format.
Icon Configuration
Using the + button, we can add icons to the image.
Existing icons can also be edited by clicking on them.
We can configure:
General:
Entity key: Device from which we will obtain the data
DatastreamId: Data stream whose value will be displayed on the icon
View:
Name: Alias for the selected field to display
Test Value: If this data is filled in, a preview of how the widget will look with the value given to the datastream will be displayed in the configuration.
Symbol: Unit for the value
View mode: Type of data visualization
Value: Value in text format (default mode).
Icon: Display an icon (Symbol field) along with the value in text mode.
Battery (Percent): Display the value within a battery. Reference values will be configured in the “Chart colors” panel.
Bar (Percent/Range): Display the value in a bar. Reference values will be configured in the “Chart colors” panel.
Gauge (Percent/Range): Display the value in a gauge-type graph. Reference values will be configured in the “Chart colors” panel.
Choose an icon: Icon to display (for Icon mode).
Choose color: Icon color.
Alignment: Alignment of the value (Value and Icon modes) in the widget.
Size: Value size.
Extra information: Extra information to display in the widget along with the value.
FORMATTER: Opens a panel where you can format the value.
dataFormatter: Value format
tooltip: Tooltip value format that appears when hovering over the value
In this case, the barBeginCircle option should always be set to false. If it is necessary to modify this option, it is recommended to use the thermometer chart type.
Widget that displays the last value obtained for a data stream.
How it works
The information can be displayed in various ways: graphical, symbolic, and text-based.
We can also review its history and statistics: trend, maximum and minimum, percentile, mean, and median.
Widget Menu
The following actions can be performed:
Open ticket information: opens a temporary dashboard with information on the ticket.
Edit: opens the ticket wizard.
Capture screen: Takes a screenshot of the widget.
Duplicate widget: Creates a duplicate of the widget on the dashboard.
Copy widget: Copies the widget to another dashboard.
Change widget location: Moves the widget to another dashboard.
Configuration
General
Boxed: widget will be displayed with background in dahsboard.
About: widget description in Markdown format.
Title: widget title. It can be configured to remain fixed in the widget or only be displayed when it receives focus.
Toolbar: configures the behavior of the widget bar on the dashboard, allowing you to hide it, hide it when not in use, or leave it always visible.
Refresh Frequency: allows configuring the data refresh frequency displayed in the list.
Extra actions: allows user to add new specific actions to the widget with your own code.
You can add a new one by pressing the New button.
Once you added a custom action it can be modified later by pressing the name in the list.
In order to remove the custom action click the delete icon button on the right.
In extra actions you can write your own code were you can open other dashboards, entities dashboards or execute wizards.
You can find all available functions and methods in Extra Information
Ticket: The ticket to display.
DatastreamId: Data stream whose last value (and its statistics) will be displayed.
Name: Alias for the selected field to display
Test Value: If this data is filled in, a preview of how the widget will look with the value given to the datastream will be displayed in the configuration.
Symbol: Unit for the value
View mode: Type of data visualization
Value: Value in text format (default mode).
Icon: Display an icon (Symbol field) along with the value in text mode.
Battery (Percent): Display the value within a battery. Reference values will be configured in the “Chart colors” panel.
Bar (Percent/Range): Display the value in a bar. Reference values will be configured in the “Chart colors” panel.
Gauge (Percent/Range): Display the value in a gauge-type graph. Reference values will be configured in the “Chart colors” panel.
Choose an icon: Icon to display (for Icon mode).
Choose color: Icon color.
Alignment: Alignment of the value (Value and Icon modes) in the widget.
Size: Value size.
Extra information: Extra information to display in the widget along with the value.
FORMATTER: Opens a panel where you can format the value.
dataFormatter: Value format
tooltip: Tooltip value format that appears when hovering over the value
In this case, the barBeginCircle option should always be set to false. If it is necessary to modify this option, it is recommended to use the thermometer chart type.
Historical data graph: Display a graph showing the value’s evolution over time.
Statistical data graph: Display statistical data.
Visualization
We can configure certain elements of the graphs displayed in the widget:
Background color
Hide details header panel: Removes the menu allowing for the modification of the type of visualization as well as the type of value to display.
Ticket Information Details
Widget that displays the information for each of the data streams that make up the ticket in card format.
How it works
On each card, we can see:
the current value
the date the value was taken
the source of the information
the type of provision (for provisioned data)
identifying icon
Target Menu
From each card, we can open various widgets (varying depending on the type of value of the data stream):
Stream status: “Last Value” widget displaying datastream information, such as the last value and trends.
Historical data: “Data Points” widget in table format, showing the data stream’s historical data.
View Chart: “Data Stream history” widget displaying the data stream’s evolution in chart form.
View tracking data: “Tracking” widget showing the entity’s location on a map (only applicable if it’s a location-type data stream).
Change value (provision datastreams only): Allows the user to change the value of the datastream without having to open the corresponding wizard.
Grouping
Selection of the type of grouping.
Depending on its configuration, it could be by:
data model
categories of a data model
tags
whether the value is provisioned or collected
Widget Menu
The following actions can be performed:
Open ticket information: opens a temporary dashboard with ticket information
Edit: opens the ticket wizard
Capture screen: Takes a screenshot of the widget.
Duplicate widget: Creates a duplicate of the widget on the dashboard.
Copy widget: Copies the widget to another dashboard.
Change widget location: Moves the widget to another dashboard.
Configuration
General
Boxed: widget will be displayed with background in dahsboard.
About: widget description in Markdown format.
Title: widget title. It can be configured to remain fixed in the widget or only be displayed when it receives focus.
Toolbar: configures the behavior of the widget bar on the dashboard, allowing you to hide it, hide it when not in use, or leave it always visible.
Refresh Frequency: allows configuring the data refresh frequency displayed in the list.
Extra actions: allows user to add new specific actions to the widget with your own code.
You can add a new one by pressing the New button.
Once you added a custom action it can be modified later by pressing the name in the list.
In order to remove the custom action click the delete icon button on the right.
In extra actions you can write your own code were you can open other dashboards, entities dashboards or execute wizards.
You can find all available functions and methods in Extra Information
Ticket: Ticket to display
Extra Information: Selection of data to be displayed within the card
Grouping: Selection of the type of grouping:
data model
categories of a data model
tags
whether the value is provisioned or collected
DatastreamId: Selection and format of displayed data streams
Choose whether to view only the selected data streams
Format the selected data streams
Alias
Category: a new category can be created to group the data streams
Position: placement of the value on the card
Icon: representative icon to be displayed on the card
Format: formatting the value of the data stream to be displayed
Advanced
Visualization
We can configure certain elements of the graphs displayed in the widget:
Background color
Hide details header panel: Removes the menu allowing the modification of the type of visualization as well as the type of value to display.
Default alignment: placement of the value on the cards
Time series last value
Widget that displays the last value obtained in a time series.
How it works
The information can be displayed in various formats: graphically, symbolically, and textually.
We can also check its history and statistics: trend, maximum and minimum, percentile, mean, and median.
Widget Menu
The following actions can be performed:
Open device information: opens a temporary dashboard with device information
Edit: opens the device wizard
Open device details: opens the device information wizard
Generate QR: generates a QR code that will return basic information about the device
Historical data: “Time Series data list” widget in table format, showing the time series’ history
View Chart: “Time Series history” widget that displays the evolution of the time series
Execute operation: opens the operation execution wizard to perform an operation on the device
Capture screen: Takes a screenshot of the widget.
Duplicate widget: Creates a duplicate of the widget on the dashboard.
Copy widget: Copies the widget to another dashboard.
Change widget location: Moves the widget to another dashboard.
Configuration
General
Boxed: widget will be displayed with background in dahsboard.
About: widget description in Markdown format.
Title: widget title. It can be configured to remain fixed in the widget or only be displayed when it receives focus.
Toolbar: configures the behavior of the widget bar on the dashboard, allowing you to hide it, hide it when not in use, or leave it always visible.
Refresh Frequency: allows configuring the data refresh frequency displayed in the list.
Extra actions: allows user to add new specific actions to the widget with your own code.
You can add a new one by pressing the New button.
Once you added a custom action it can be modified later by pressing the name in the list.
In order to remove the custom action click the delete icon button on the right.
In extra actions you can write your own code were you can open other dashboards, entities dashboards or execute wizards.
You can find all available functions and methods in Extra Information
Organization: Organization of the desired time series
Time Series: Time Series source
Value column: Column to read the value
Date column: Column to read the date of the value and for stats
Entity key: Device to display
DatastreamId: Data stream whose last value (and its statistics) will be displayed
Name: Alias for the selected field to display
Test Value: If this data is filled in, a preview of how the widget will look with the value given to the datastream will be displayed in the configuration.
Symbol: Unit for the value
View mode: Type of data visualization
Value: Value in text format (default mode).
Icon: Display an icon (Symbol field) along with the value in text mode.
Battery (Percent): Display the value within a battery. Reference values will be configured in the “Chart colors” panel.
Bar (Percent/Range): Display the value in a bar. Reference values will be configured in the “Chart colors” panel.
Gauge (Percent/Range): Display the value in a gauge-type graph. Reference values will be configured in the “Chart colors” panel.
Choose an icon: Icon to display (for Icon mode).
Choose color: Icon color.
Alignment: Alignment of the value (Value and Icon modes) in the widget.
Size: Value size.
Extra information: Extra information to display in the widget along with the value.
FORMATTER: Opens a panel where you can format the value.
dataFormatter: Value format
tooltip: Tooltip value format that appears when hovering over the value
In this case, the barBeginCircle option should always be set to false. If it is necessary to modify this option, it is recommended to use the thermometer chart type.
Historical data graph: Display a graph showing the value’s evolution over time
Statistical data graph: Display statistical data
Choose a period: Time frame for sampling the statistical data and its visualization in the value evolution graph
Trend: Assign a color based on the value’s trend
Visualization
We can configure certain elements of the graphs displayed in the widget:
Background color background color for the widget
Hide details header panel: Removes the menu allowing for the modification of the type of visualization as well as the type of value to display.
Listings
The website features listings, widgets that will display information in a table format.
Columns to display and the format of the data can be configured. One can filter by content, dates, and perform various actions such as executing operations on the displayed entities.
The listing of areas allows you to view/manage the areas within the organization.
How it works
Below are the actions that can be performed both within the widget and on the displayed data.
Filter by Columns
Basic Filter
Perform a basic search by entering text that will filter by predefined fields.
Advanced Filter
Perform a search by selecting the fields to filter by and how to filter by them.
Save and Restore Filters
Basic and Advanced filters can be saved in order to preconfigure a list of filters and restore them at any time. This feature is only available in own dashboards but can be shared with other users.
You can save a filter by fullfilling the filter name in the field at the bottom of the filter panel and clicking on the save button. When a filter is saved, it is stored in the widget’s filter list and can be restored at any time by selecting it from the saved filters list located at the top of the filter panel.
Filters can be saved only when a new filter is created.
This can be useful when you want to save a list of filters that you use frequently and restore them at any time.
Widget Menu
The following actions can be performed:
New area: Opens the area creation wizard
Capture screen: Takes a screenshot of the widget.
Duplicate widget: Creates a duplicate of the widget on the dashboard.
Copy widget: Copies the widget to another dashboard.
Change widget location: Moves the widget to another dashboard.
Temporarily Sort and Hide Column
Actions Per Entity
The following actions can be performed:
Edit: Opens the area editing wizard
Delete: Deletes the user
Configuration
General
Boxed: widget will be displayed with background in dahsboard.
About: widget description in Markdown format.
Title: widget title. It can be configured to remain fixed in the widget or only be displayed when it receives focus.
Toolbar: configures the behavior of the widget bar on the dashboard, allowing you to hide it, hide it when not in use, or leave it always visible.
Refresh Frequency: allows configuring the data refresh frequency displayed in the list.
Extra actions: allows user to add new specific actions to the widget with your own code.
You can add a new one by pressing the New button.
Once you added a custom action it can be modified later by pressing the name in the list.
In order to remove the custom action click the delete icon button on the right.
In extra actions you can write your own code were you can open other dashboards, entities dashboards or execute wizards.
You can find all available functions and methods in Extra Information
Cell Configuration
Alias: Modify the column name. If nothing is added, it will use the default configured name.
Show entity actions: Allow displaying the actions menu when selecting its value in the cell. If the column is an identifier, this field will be enabled.
Hidden column: Enabling this option will hide the column from the user. This is useful when you need the data for formatting purposes, as only the data required in the list will be available.
Options:
Modify the cell’s width and horizontal alignment of its content.
Format the cell’s value.
Pagination: Configure the number of rows to display per page.
Virtual columns
Also you can add virtual columns to lists.
These columns do not have their own values and must be configured in the column formatter once added.
Please note that the contents of this column will never be output to CSV, as it is calculated on the fly and does not rely on any native platform resources.
Button columns
Also you can add button columns to lists in order to execute some custom action related with the row data.
Button label can be setted in normal or virtual columns. Label will be the value.
Button action code receives the complete rowData and you can open other dashboards, entities dashboards or execute wizards.
You can find all available functions and methods in Extra Information
Advanced
In this section, you will configure various filters that will be applied to queries regardless of the user’s specific filtering preferences.
Widget Filters Configuration
Here you can define how widget filters should behave when sharing the dashboard with other users/organizations. This means that when sharing, a user opens these dashboards and won’t see the filters applied to the original dashboard in the specified widgets, preventing the information displayed from changing after a dashboard refresh.
The three possible options are:
Don’t share the widget’s general filter
Don’t share header filters in lists
Don’t share sorting in lists
Bulk List
The listing of bulks allows you to view the executed bulks within the organization and their outcomes.
How it works
Below are the actions that can be performed both within the widget and on the displayed data.
Widget Menu
The following actions can be undertaken:
Upload Bulk File: Opens the bulk upload wizard
Capture screen: Takes a screenshot of the widget.
Duplicate widget: Creates a duplicate of the widget on the dashboard.
Copy widget: Copies the widget to another dashboard.
Change widget location: Moves the widget to another dashboard.
Download Result
From here, you can download the result of the bulk operation.
Configuration
General
Boxed: widget will be displayed with background in dahsboard.
About: widget description in Markdown format.
Title: widget title. It can be configured to remain fixed in the widget or only be displayed when it receives focus.
Toolbar: configures the behavior of the widget bar on the dashboard, allowing you to hide it, hide it when not in use, or leave it always visible.
Refresh Frequency: allows configuring the data refresh frequency displayed in the list.
Extra actions: allows user to add new specific actions to the widget with your own code.
You can add a new one by pressing the New button.
Once you added a custom action it can be modified later by pressing the name in the list.
In order to remove the custom action click the delete icon button on the right.
In extra actions you can write your own code were you can open other dashboards, entities dashboards or execute wizards.
You can find all available functions and methods in Extra Information
Cell Configuration
Alias: Modify the column name. If nothing is added, it will use the default configured name.
Show entity actions: Allow displaying the actions menu when selecting its value in the cell. If the column is an identifier, this field will be enabled.
Hidden column: Enabling this option will hide the column from the user. This is useful when you need the data for formatting purposes, as only the data required in the list will be available.
Options:
Modify the cell’s width and horizontal alignment of its content.
Format the cell’s value.
Pagination: Configure the number of rows to display per page.
Virtual columns
Also you can add virtual columns to lists.
These columns do not have their own values and must be configured in the column formatter once added.
Please note that the contents of this column will never be output to CSV, as it is calculated on the fly and does not rely on any native platform resources.
Button columns
Also you can add button columns to lists in order to execute some custom action related with the row data.
Button label can be setted in normal or virtual columns. Label will be the value.
Button action code receives the complete rowData and you can open other dashboards, entities dashboards or execute wizards.
You can find all available functions and methods in Extra Information
Advanced
In this section, you will configure various filters that will be applied to queries regardless of the user’s specific filtering preferences.
Widget Filters Configuration
Here you can define how widget filters should behave when sharing the dashboard with other users/organizations. This means that when sharing, a user opens these dashboards and won’t see the filters applied to the original dashboard in the specified widgets, preventing the information displayed from changing after a dashboard refresh.
The three possible options are:
Don’t share the widget’s general filter
Don’t share header filters in lists
Don’t share sorting in lists
Bulk List (Advanced)
The listing of advanced bulks allows you to view executed bulks, using provisioning features, within the organization and their outcomes.
How it works
Below are the actions that can be performed both within the widget and on the displayed data.
Duplicate widget: Creates a duplicate of the widget on the dashboard.
Copy widget: Copies the widget to another dashboard.
Change widget location: Moves the widget to another dashboard.
Download Result
From here, you can download the result of the bulk operation.
Configuration
General
Boxed: widget will be displayed with background in dahsboard.
About: widget description in Markdown format.
Title: widget title. It can be configured to remain fixed in the widget or only be displayed when it receives focus.
Toolbar: configures the behavior of the widget bar on the dashboard, allowing you to hide it, hide it when not in use, or leave it always visible.
Refresh Frequency: allows configuring the data refresh frequency displayed in the list.
Extra actions: allows user to add new specific actions to the widget with your own code.
You can add a new one by pressing the New button.
Once you added a custom action it can be modified later by pressing the name in the list.
In order to remove the custom action click the delete icon button on the right.
In extra actions you can write your own code were you can open other dashboards, entities dashboards or execute wizards.
You can find all available functions and methods in Extra Information
Cell Configuration
Alias: Modify the column name. If nothing is added, it will use the default configured name.
Show entity actions: Allow displaying the actions menu when selecting its value in the cell. If the column is an identifier, this field will be enabled.
Hidden column: Enabling this option will hide the column from the user. This is useful when you need the data for formatting purposes, as only the data required in the list will be available.
Options:
Modify the cell’s width and horizontal alignment of its content.
Format the cell’s value.
Pagination: Configure the number of rows to display per page.
Virtual columns
Also you can add virtual columns to lists.
These columns do not have their own values and must be configured in the column formatter once added.
Please note that the contents of this column will never be output to CSV, as it is calculated on the fly and does not rely on any native platform resources.
Button columns
Also you can add button columns to lists in order to execute some custom action related with the row data.
Button label can be setted in normal or virtual columns. Label will be the value.
Button action code receives the complete rowData and you can open other dashboards, entities dashboards or execute wizards.
You can find all available functions and methods in Extra Information
Advanced
In this section, you will configure various filters that will be applied to queries regardless of the user’s specific filtering preferences.
Widget Filters Configuration
Here you can define how widget filters should behave when sharing the dashboard with other users/organizations. This means that when sharing, a user opens these dashboards and won’t see the filters applied to the original dashboard in the specified widgets, preventing the information displayed from changing after a dashboard refresh.
The three possible options are:
Don’t share the widget’s general filter
Don’t share header filters in lists
Don’t share sorting in lists
Bundles List
The listing of bundles allows you to view/manage the bundles within an organization.
How it works
Below are the actions that can be performed both within the widget and on the displayed data.
Filter by Columns
Basic Filter
Perform a basic search by entering text that will filter by predefined fields.
Advanced Filter
Perform a search by selecting the fields to filter by and how to filter by them.
Save and Restore Filters
Basic and Advanced filters can be saved in order to preconfigure a list of filters and restore them at any time. This feature is only available in own dashboards but can be shared with other users.
You can save a filter by fullfilling the filter name in the field at the bottom of the filter panel and clicking on the save button. When a filter is saved, it is stored in the widget’s filter list and can be restored at any time by selecting it from the saved filters list located at the top of the filter panel.
Filters can be saved only when a new filter is created.
This can be useful when you want to save a list of filters that you use frequently and restore them at any time.
Widget Menu
The following actions can be performed:
New bundle: Opens the bundle creation wizard.
Capture screen: Takes a screenshot of the widget.
Duplicate widget: Creates a duplicate of the widget on the dashboard.
Copy widget: Copies the widget to another dashboard.
Change widget location: Moves the widget to another dashboard.
Sort and Temporarily Hide Columns
Entity Actions
The following actions can be performed:
Edit: Opens the bundle editing wizard. Only if the bundle is deactivated.
Activate/Deactivate: Activates or deactivates the bundle.
Delete: Deletes the bundle.
Configuration
General
Boxed: widget will be displayed with background in dahsboard.
About: widget description in Markdown format.
Title: widget title. It can be configured to remain fixed in the widget or only be displayed when it receives focus.
Toolbar: configures the behavior of the widget bar on the dashboard, allowing you to hide it, hide it when not in use, or leave it always visible.
Refresh Frequency: allows configuring the data refresh frequency displayed in the list.
Extra actions: allows user to add new specific actions to the widget with your own code.
You can add a new one by pressing the New button.
Once you added a custom action it can be modified later by pressing the name in the list.
In order to remove the custom action click the delete icon button on the right.
In extra actions you can write your own code were you can open other dashboards, entities dashboards or execute wizards.
You can find all available functions and methods in Extra Information
Cell Configuration
Alias: Modify the column name. If nothing is added, it will use the default configured name.
Show entity actions: Allow displaying the actions menu when selecting its value in the cell. If the column is an identifier, this field will be enabled.
Hidden column: Enabling this option will hide the column from the user. This is useful when you need the data for formatting purposes, as only the data required in the list will be available.
Options:
Modify the cell’s width and horizontal alignment of its content.
Format the cell’s value.
Pagination: Configure the number of rows to display per page.
Virtual columns
Also you can add virtual columns to lists.
These columns do not have their own values and must be configured in the column formatter once added.
Please note that the contents of this column will never be output to CSV, as it is calculated on the fly and does not rely on any native platform resources.
Button columns
Also you can add button columns to lists in order to execute some custom action related with the row data.
Button label can be setted in normal or virtual columns. Label will be the value.
Button action code receives the complete rowData and you can open other dashboards, entities dashboards or execute wizards.
You can find all available functions and methods in Extra Information
Advanced
In this section, you will configure various filters that will be applied to queries regardless of the user’s specific filtering preferences.
Widget Filters Configuration
Here you can define how widget filters should behave when sharing the dashboard with other users/organizations. This means that when sharing, a user opens these dashboards and won’t see the filters applied to the original dashboard in the specified widgets, preventing the information displayed from changing after a dashboard refresh.
The three possible options are:
Don’t share the widget’s general filter
Don’t share header filters in lists
Don’t share sorting in lists
Data Points List
The listing of data points allows you to view the data of various entities within an organization.
How it works
Below are the actions that can be performed both within the widget and on the displayed data.
Filter by Columns
Basic Filter
Perform a basic search by entering text that will filter by predefined fields.
Advanced Filter
Perform a search by selecting the fields to filter by and how to filter by them.
Save and Restore Filters
Basic and Advanced filters can be saved in order to preconfigure a list of filters and restore them at any time. This feature is only available in own dashboards but can be shared with other users.
You can save a filter by fullfilling the filter name in the field at the bottom of the filter panel and clicking on the save button. When a filter is saved, it is stored in the widget’s filter list and can be restored at any time by selecting it from the saved filters list located at the top of the filter panel.
Filters can be saved only when a new filter is created.
This can be useful when you want to save a list of filters that you use frequently and restore them at any time.
Widget Menu
The following actions can be performed:
Download: Download data in CSV format.
Capture screen: Takes a screenshot of the widget.
Duplicate widget: Creates a duplicate of the widget on the dashboard.
Copy widget: Copies the widget to another dashboard.
Change widget location: Moves the widget to another dashboard.
Sort and Temporarily Hide Columns
Configuration
General
Boxed: widget will be displayed with background in dahsboard.
About: widget description in Markdown format.
Title: widget title. It can be configured to remain fixed in the widget or only be displayed when it receives focus.
Toolbar: configures the behavior of the widget bar on the dashboard, allowing you to hide it, hide it when not in use, or leave it always visible.
Refresh Frequency: allows configuring the data refresh frequency displayed in the list.
Extra actions: allows user to add new specific actions to the widget with your own code.
You can add a new one by pressing the New button.
Once you added a custom action it can be modified later by pressing the name in the list.
In order to remove the custom action click the delete icon button on the right.
In extra actions you can write your own code were you can open other dashboards, entities dashboards or execute wizards.
You can find all available functions and methods in Extra Information
Cell Configuration
Alias: Modify the column name. If nothing is added, it will use the default configured name.
Show entity actions: Allow displaying the actions menu when selecting its value in the cell. If the column is an identifier, this field will be enabled.
Hidden column: Enabling this option will hide the column from the user. This is useful when you need the data for formatting purposes, as only the data required in the list will be available.
Options:
Modify the cell’s width and horizontal alignment of its content.
Format the cell’s value.
Pagination: Configure the number of rows to display per page.
Virtual columns
Also you can add virtual columns to lists.
These columns do not have their own values and must be configured in the column formatter once added.
Please note that the contents of this column will never be output to CSV, as it is calculated on the fly and does not rely on any native platform resources.
Button columns
Also you can add button columns to lists in order to execute some custom action related with the row data.
Button label can be setted in normal or virtual columns. Label will be the value.
Button action code receives the complete rowData and you can open other dashboards, entities dashboards or execute wizards.
You can find all available functions and methods in Extra Information
Advanced
In this section, you will configure various filters that will be applied to queries regardless of the user’s specific filtering preferences.
Widget Filters Configuration
Here you can define how widget filters should behave when sharing the dashboard with other users/organizations. This means that when sharing, a user opens these dashboards and won’t see the filters applied to the original dashboard in the specified widgets, preventing the information displayed from changing after a dashboard refresh.
The three possible options are:
Don’t share the widget’s general filter
Don’t share header filters in lists
Don’t share sorting in lists
Data Set data List
The listing allows us to view the values provided by a data set and manage the entities related to it.
How it works
Below are the actions that can be performed both within the widget and on the displayed data.
Filter by Columns
Advanced Filter
Perform a search by selecting the fields to filter by and how to filter by them.
Save and Restore Filters
Basic and Advanced filters can be saved in order to preconfigure a list of filters and restore them at any time. This feature is only available in own dashboards but can be shared with other users.
You can save a filter by fullfilling the filter name in the field at the bottom of the filter panel and clicking on the save button. When a filter is saved, it is stored in the widget’s filter list and can be restored at any time by selecting it from the saved filters list located at the top of the filter panel.
Filters can be saved only when a new filter is created.
This can be useful when you want to save a list of filters that you use frequently and restore them at any time.
Widget Menu
The following actions can be performed:
Download: Download data in CSV format
Capture screen: Takes a screenshot of the widget.
Duplicate widget: Creates a duplicate of the widget on the dashboard.
Copy widget: Copies the widget to another dashboard.
Change widget location: Moves the widget to another dashboard.
Sort
If data set has sorting columns configured, the sort menu will display the configured sorting columns.
You can apply the sorting configuration by clicking on the sorting configuration desired and remove with the clean button.
Entity Actions
The actions to be performed will depend on the type of entity configured as the identifying column:
Edit: Edit the entity by opening the corresponding wizard for that entity type
Execute operation: Perform an operation on the displayed entity
Collect: Simulate data collection on an entity (if the entity type supports this action)
Open device/asset/subscriber/subscription information: Opens a temporary dashboard that will display information related to the entity
Open device/asset/subscriber/subscription details: Opens the information widget of an entity with the data of the entity
View hierarchy of the entity: Opens the hierarchy widget to display the hierarchy of the entity (if the entity type supports this action)
Delete: Delete the entity
Configuration
General
Boxed: widget will be displayed with background in dahsboard.
About: widget description in Markdown format.
Title: widget title. It can be configured to remain fixed in the widget or only be displayed when it receives focus.
Toolbar: configures the behavior of the widget bar on the dashboard, allowing you to hide it, hide it when not in use, or leave it always visible.
Refresh Frequency: allows configuring the data refresh frequency displayed in the list.
Extra actions: allows user to add new specific actions to the widget with your own code.
You can add a new one by pressing the New button.
Once you added a custom action it can be modified later by pressing the name in the list.
In order to remove the custom action click the delete icon button on the right.
In extra actions you can write your own code were you can open other dashboards, entities dashboards or execute wizards.
You can find all available functions and methods in Extra Information
Data Set and Column Selection
Organization: Select the organization to which the data set belongs
Data set: Select the data set
Columns: Select columns configured in the data set
Column Identifier Selection
Selection of the identifying column.
Based on the value of this column, the table will display different actions to perform on each of its rows.
Cell Configuration
Alias: Modify the column name. If nothing is added, it will use the default configured name.
Show entity actions: Allow displaying the actions menu when selecting its value in the cell. If the column is an identifier, this field will be enabled.
Hidden column: Enabling this option will hide the column from the user. This is useful when you need the data for formatting purposes, as only the data required in the list will be available.
Options:
Modify the cell’s width and horizontal alignment of its content.
Format the cell’s value.
Pagination: Configure the number of rows to display per page.
Virtual columns
Also you can add virtual columns to lists.
These columns do not have their own values and must be configured in the column formatter once added.
Please note that the contents of this column will never be output to CSV, as it is calculated on the fly and does not rely on any native platform resources.
Button columns
Also you can add button columns to lists in order to execute some custom action related with the row data.
Button label can be setted in normal or virtual columns. Label will be the value.
Button action code receives the complete rowData and you can open other dashboards, entities dashboards or execute wizards.
You can find all available functions and methods in Extra Information
Advanced
In this section, you will configure various filters that will be applied to queries regardless of the user’s specific filtering preferences.
Widget Filters Configuration
Here you can define how widget filters should behave when sharing the dashboard with other users/organizations. This means that when sharing, a user opens these dashboards and won’t see the filters applied to the original dashboard in the specified widgets, preventing the information displayed from changing after a dashboard refresh.
The three possible options are:
Don’t share the widget’s general filter
Don’t share header filters in lists
Don’t share sorting in lists
Entities Alarms List
The alarm list allows you to view/manage alarms generated by the system in your organization.
How it works
Below are the actions that can be performed both within the widget and on the displayed data.
Filter by Columns
Basic Filter
Perform a basic search by entering text that will filter by predefined fields.
Advanced Filter
Perform a search by selecting the fields to filter by and how to filter by them.
Save and Restore Filters
Basic and Advanced filters can be saved in order to preconfigure a list of filters and restore them at any time. This feature is only available in own dashboards but can be shared with other users.
You can save a filter by fullfilling the filter name in the field at the bottom of the filter panel and clicking on the save button. When a filter is saved, it is stored in the widget’s filter list and can be restored at any time by selecting it from the saved filters list located at the top of the filter panel.
Filters can be saved only when a new filter is created.
This can be useful when you want to save a list of filters that you use frequently and restore them at any time.
Widget Menu
The following actions can be performed:
Download: Data download in CSV format
Capture screen: Takes a screenshot of the widget.
Duplicate widget: Creates a duplicate of the widget on the dashboard.
Copy widget: Copies the widget to another dashboard.
Change widget location: Moves the widget to another dashboard.
Selection and Operations on Entities
The following actions can be performed on the selected alarm entities:
Filter: Data will be displayed after filtering on the selected alarm entities
Execute Operations: Perform an operation on the selected alarm entities
Temporarily Sort and Hide Column
Actions Per Entity
The following actions can be performed:
Alarm detail: Opens the information widget for an alarm
Execute operation: Perform an operation on the selected alarm entity
Close: Opens the alarm wizard to close the selected alarm
Attend: Opens the alarm wizard to address the selected alarm
Open alarm information: Opens a temporary dashboard that will display information related to the alarm
Open device details: Opens the information widget for an entity with the entity’s data
Edit entity: Edits the entity by opening the corresponding wizard for the type of alarm entity selected
Open device information: Opens a temporary dashboard that will display information related to the alarm entity
Configuration
General
Boxed: widget will be displayed with background in dahsboard.
About: widget description in Markdown format.
Title: widget title. It can be configured to remain fixed in the widget or only be displayed when it receives focus.
Toolbar: configures the behavior of the widget bar on the dashboard, allowing you to hide it, hide it when not in use, or leave it always visible.
Refresh Frequency: allows configuring the data refresh frequency displayed in the list.
Extra actions: allows user to add new specific actions to the widget with your own code.
You can add a new one by pressing the New button.
Once you added a custom action it can be modified later by pressing the name in the list.
In order to remove the custom action click the delete icon button on the right.
In extra actions you can write your own code were you can open other dashboards, entities dashboards or execute wizards.
You can find all available functions and methods in Extra Information
Cell Configuration
Alias: Modify the column name. If nothing is added, it will use the default configured name.
Show entity actions: Allow displaying the actions menu when selecting its value in the cell. If the column is an identifier, this field will be enabled.
Hidden column: Enabling this option will hide the column from the user. This is useful when you need the data for formatting purposes, as only the data required in the list will be available.
Options:
Modify the cell’s width and horizontal alignment of its content.
Format the cell’s value.
Pagination: Configure the number of rows to display per page.
Virtual columns
Also you can add virtual columns to lists.
These columns do not have their own values and must be configured in the column formatter once added.
Please note that the contents of this column will never be output to CSV, as it is calculated on the fly and does not rely on any native platform resources.
Button columns
Also you can add button columns to lists in order to execute some custom action related with the row data.
Button label can be setted in normal or virtual columns. Label will be the value.
Button action code receives the complete rowData and you can open other dashboards, entities dashboards or execute wizards.
You can find all available functions and methods in Extra Information
Advanced
In this section, you will configure various filters that will be applied to queries regardless of the user’s specific filtering preferences.
Widget Filters Configuration
Here you can define how widget filters should behave when sharing the dashboard with other users/organizations. This means that when sharing, a user opens these dashboards and won’t see the filters applied to the original dashboard in the specified widgets, preventing the information displayed from changing after a dashboard refresh.
The three possible options are:
Don’t share the widget’s general filter
Don’t share header filters in lists
Don’t share sorting in lists
Entities List
The list of entities allows you to view and manage various types of entities: asset, device, subscriber, subscription; created within your organization.
How it works
Below are the actions that can be performed both within the widget and on the displayed data.
Filter by Columns
Basic Filter
Perform a basic search by entering text that will filter by predefined fields.
Advanced Filter
Perform a search by selecting the fields to filter by and how to filter by them.
Save and Restore Filters
Basic and Advanced filters can be saved in order to preconfigure a list of filters and restore them at any time. This feature is only available in own dashboards but can be shared with other users.
You can save a filter by fullfilling the filter name in the field at the bottom of the filter panel and clicking on the save button. When a filter is saved, it is stored in the widget’s filter list and can be restored at any time by selecting it from the saved filters list located at the top of the filter panel.
Filters can be saved only when a new filter is created.
This can be useful when you want to save a list of filters that you use frequently and restore them at any time.
Widget Menu
The following actions can be performed:
Download: Download data in CSV format
Create Device: Opens the device creation wizard
Create Asset: Opens the asset creation wizard
Create Subscription: Opens the subscription creation wizard
Create Subscriber: Opens the subscriber creation wizard
View in map: Opens the Maps widget, displaying the location of the entities shown in the table
Capture screen: Takes a screenshot of the widget.
Duplicate widget: Creates a duplicate of the widget on the dashboard.
Copy widget: Copies the widget to another dashboard.
Change widget location: Moves the widget to another dashboard.
Selection and Operations on Entities
The following actions can be performed on the selected entities:
Filter: Will display data filtered based on the selected entities
Execute operations: Execute an operation on the selected entities
Delete: Delete all selected entities and entities related to them
Sort and Temporarily Hide Columns
Actions per Entity
The following actions can be performed:
Edit: Edit the entity by opening the corresponding wizard for the type of entity
Execute operation: Execute an operation on the displayed entity
Collect: Simulate data collection on an entity
Open device information: Opens a temporary dashboard displaying information related to the entity
Open device details: Opens the information widget of an entity with the entity’s data
View hierarchy of the entity: Opens the hierarchy widget to display the hierarchy of the entity
Delete: Deletes the entity
Configuration
General
Boxed: widget will be displayed with background in dahsboard.
About: widget description in Markdown format.
Title: widget title. It can be configured to remain fixed in the widget or only be displayed when it receives focus.
Toolbar: configures the behavior of the widget bar on the dashboard, allowing you to hide it, hide it when not in use, or leave it always visible.
Refresh Frequency: allows configuring the data refresh frequency displayed in the list.
Extra actions: allows user to add new specific actions to the widget with your own code.
You can add a new one by pressing the New button.
Once you added a custom action it can be modified later by pressing the name in the list.
In order to remove the custom action click the delete icon button on the right.
In extra actions you can write your own code were you can open other dashboards, entities dashboards or execute wizards.
You can find all available functions and methods in Extra Information
Column Selection
Steps to select and configure the value of a datastream in a column:
Select one or more data streams.
Choose which values from these data streams to display; these will become different columns.
Once selected, click the + button.
Cell Configuration
Alias: Modify the column name. If nothing is added, it will use the default configured name.
Show entity actions: Allow displaying the actions menu when selecting its value in the cell. If the column is an identifier, this field will be enabled.
Hidden column: Enabling this option will hide the column from the user. This is useful when you need the data for formatting purposes, as only the data required in the list will be available.
Options:
Modify the cell’s width and horizontal alignment of its content.
Format the cell’s value.
Pagination: Configure the number of rows to display per page.
Virtual columns
Also you can add virtual columns to lists.
These columns do not have their own values and must be configured in the column formatter once added.
Please note that the contents of this column will never be output to CSV, as it is calculated on the fly and does not rely on any native platform resources.
Button columns
Also you can add button columns to lists in order to execute some custom action related with the row data.
Button label can be setted in normal or virtual columns. Label will be the value.
Button action code receives the complete rowData and you can open other dashboards, entities dashboards or execute wizards.
You can find all available functions and methods in Extra Information
Advanced
In this section, you will configure various filters that will be applied to queries regardless of the user’s specific filtering preferences.
Widget Filters Configuration
Here you can define how widget filters should behave when sharing the dashboard with other users/organizations. This means that when sharing, a user opens these dashboards and won’t see the filters applied to the original dashboard in the specified widgets, preventing the information displayed from changing after a dashboard refresh.
The three possible options are:
Don’t share the widget’s general filter
Don’t share header filters in lists
Don’t share sorting in lists
Executions List
The list of operation executions allows you to view and manage the operation executions performed on various types of OpenGate entities: devices, subscribers, and subscriptions.
How it works
Below are the actions that can be performed both within the widget and on the displayed data.
Filter by Columns
Basic Filter
Perform a basic search by entering text that will filter by predefined fields.
Advanced Filter
Perform a search by selecting the fields to filter by and how to filter by them.
Save and Restore Filters
Basic and Advanced filters can be saved in order to preconfigure a list of filters and restore them at any time. This feature is only available in own dashboards but can be shared with other users.
You can save a filter by fullfilling the filter name in the field at the bottom of the filter panel and clicking on the save button. When a filter is saved, it is stored in the widget’s filter list and can be restored at any time by selecting it from the saved filters list located at the top of the filter panel.
Filters can be saved only when a new filter is created.
This can be useful when you want to save a list of filters that you use frequently and restore them at any time.
Widget Menu
The following actions can be performed:
Download: Download data in CSV format
Execute operation: Opens the operation execution wizard
Show history operation: A switch that allows viewing either in-progress or completed executions.
Capture screen: Takes a screenshot of the widget.
Duplicate widget: Creates a duplicate of the widget on the dashboard.
Copy widget: Copies the widget to another dashboard.
Change widget location: Moves the widget to another dashboard.
Selection and Operations on Entities
The following actions can be performed on the selected entities of the executions:
Filter: Data will be displayed filtered based on the selected entities
Execute operations: Execute an operation on the entities
Sort and Temporarily Hide Columns
Actions per Entity
The following actions can be performed:
Execute operation: Execute an operation on the execution’s entity
Open device information: Opens a temporary dashboard displaying information related to the execution’s entity
Open device details: Opens the information widget of an entity with the execution entity’s data
Execution details: Opens the execution information widget
Edit entity: Edit the entity by opening the corresponding wizard for the type of the execution’s entity
Configuration
General
Boxed: widget will be displayed with background in dahsboard.
About: widget description in Markdown format.
Title: widget title. It can be configured to remain fixed in the widget or only be displayed when it receives focus.
Toolbar: configures the behavior of the widget bar on the dashboard, allowing you to hide it, hide it when not in use, or leave it always visible.
Refresh Frequency: allows configuring the data refresh frequency displayed in the list.
Extra actions: allows user to add new specific actions to the widget with your own code.
You can add a new one by pressing the New button.
Once you added a custom action it can be modified later by pressing the name in the list.
In order to remove the custom action click the delete icon button on the right.
In extra actions you can write your own code were you can open other dashboards, entities dashboards or execute wizards.
You can find all available functions and methods in Extra Information
Cell Configuration
Alias: Modify the column name. If nothing is added, it will use the default configured name.
Show entity actions: Allow displaying the actions menu when selecting its value in the cell. If the column is an identifier, this field will be enabled.
Hidden column: Enabling this option will hide the column from the user. This is useful when you need the data for formatting purposes, as only the data required in the list will be available.
Options:
Modify the cell’s width and horizontal alignment of its content.
Format the cell’s value.
Pagination: Configure the number of rows to display per page.
Virtual columns
Also you can add virtual columns to lists.
These columns do not have their own values and must be configured in the column formatter once added.
Please note that the contents of this column will never be output to CSV, as it is calculated on the fly and does not rely on any native platform resources.
Button columns
Also you can add button columns to lists in order to execute some custom action related with the row data.
Button label can be setted in normal or virtual columns. Label will be the value.
Button action code receives the complete rowData and you can open other dashboards, entities dashboards or execute wizards.
You can find all available functions and methods in Extra Information
Resource Configuration
Execution listings will be displayed for only one type of entity.
By default, entities of the type Device will be displayed.
Advanced
In this section, you will configure various filters that will be applied to queries regardless of the user’s specific filtering preferences.
Widget Filters Configuration
Here you can define how widget filters should behave when sharing the dashboard with other users/organizations. This means that when sharing, a user opens these dashboards and won’t see the filters applied to the original dashboard in the specified widgets, preventing the information displayed from changing after a dashboard refresh.
The three possible options are:
Don’t share the widget’s general filter
Don’t share header filters in lists
Don’t share sorting in lists
Operations List
The list of operations allows you to view/manage operations performed on various types of entities: device, subscriber, and subscription.
How it works
Below are the actions that can be performed both within the widget and on the displayed data.
Filter by Columns
Basic Filter
Perform a basic search by entering text that will filter by predefined fields.
Advanced Filter
Perform a search by selecting the fields to filter by and how to filter by them.
Save and Restore Filters
Basic and Advanced filters can be saved in order to preconfigure a list of filters and restore them at any time. This feature is only available in own dashboards but can be shared with other users.
You can save a filter by fullfilling the filter name in the field at the bottom of the filter panel and clicking on the save button. When a filter is saved, it is stored in the widget’s filter list and can be restored at any time by selecting it from the saved filters list located at the top of the filter panel.
Filters can be saved only when a new filter is created.
This can be useful when you want to save a list of filters that you use frequently and restore them at any time.
Widget Menu
The following actions can be performed:
Download: Download data in CSV format
Execute operation: Opens the operation execution wizard
Toggle selection: Allows toggling the selection of operations via check. This enables viewing in other compatible widgets the content filtered by this information.
Capture screen: Takes a screenshot of the widget.
Duplicate widget: Creates a duplicate of the widget on the dashboard.
Copy widget: Copies the widget to another dashboard.
Change widget location: Moves the widget to another dashboard.
Sort and Temporarily Hide Columns
Actions per Entity
The following actions can be performed:
Device execution list: Opens the execution listing widget, filtering by the operation and selecting the entity type ‘device’
Subscription execution list: Opens the execution listing widget, filtering by the operation and selecting the entity type ‘subscription’
Subscriber execution list: Opens the execution listing widget, filtering by the operation and selecting the entity type ‘subscriber’
Configuration
General
Boxed: widget will be displayed with background in dahsboard.
About: widget description in Markdown format.
Title: widget title. It can be configured to remain fixed in the widget or only be displayed when it receives focus.
Toolbar: configures the behavior of the widget bar on the dashboard, allowing you to hide it, hide it when not in use, or leave it always visible.
Refresh Frequency: allows configuring the data refresh frequency displayed in the list.
Extra actions: allows user to add new specific actions to the widget with your own code.
You can add a new one by pressing the New button.
Once you added a custom action it can be modified later by pressing the name in the list.
In order to remove the custom action click the delete icon button on the right.
In extra actions you can write your own code were you can open other dashboards, entities dashboards or execute wizards.
You can find all available functions and methods in Extra Information
Cell Configuration
Alias: Modify the column name. If nothing is added, it will use the default configured name.
Show entity actions: Allow displaying the actions menu when selecting its value in the cell. If the column is an identifier, this field will be enabled.
Hidden column: Enabling this option will hide the column from the user. This is useful when you need the data for formatting purposes, as only the data required in the list will be available.
Options:
Modify the cell’s width and horizontal alignment of its content.
Format the cell’s value.
Pagination: Configure the number of rows to display per page.
Virtual columns
Also you can add virtual columns to lists.
These columns do not have their own values and must be configured in the column formatter once added.
Please note that the contents of this column will never be output to CSV, as it is calculated on the fly and does not rely on any native platform resources.
Button columns
Also you can add button columns to lists in order to execute some custom action related with the row data.
Button label can be setted in normal or virtual columns. Label will be the value.
Button action code receives the complete rowData and you can open other dashboards, entities dashboards or execute wizards.
You can find all available functions and methods in Extra Information
Advanced
In this section, you will configure various filters that will be applied to queries regardless of the user’s specific filtering preferences.
Widget Filters Configuration
Here you can define how widget filters should behave when sharing the dashboard with other users/organizations. This means that when sharing, a user opens these dashboards and won’t see the filters applied to the original dashboard in the specified widgets, preventing the information displayed from changing after a dashboard refresh.
The three possible options are:
Don’t share the widget’s general filter
Don’t share header filters in lists
Don’t share sorting in lists
Organization Files List
From here, you can manage the files uploaded to the private storage of the organization.
These are the same files managed in Organization Files, in the administration section of the organization.
How it Works
The file listing displays information for each of the stored files.
Files are grouped into 6 categories, which help the user identify the type of files and where they can be used. These categories are as follows:
BIM/IFC files in this category contain 3D models compatible with the BIM/IFC standard and are ready to be used in the corresponding widget (will be converted into fragments files when uploaded).
FRAG fragments files for the Advanced BIM widget to create an own BIM model with no need of external sources.
SVG vector files that can be used in image widgets or any configuration that allows image import.
Image image files that can be used in image widgets or in any configuration that allows image import.
Documents any type of documentation files can be placed here, especially to be used in iframe widgets and to be displayed.
JSON plain JSON files. These files are not processed by the platform in any way.
The following information is shown in the listing:
Unique Identifier the unique identifier of the file.
Name the name of the file.
Owner the organization where this file is located.
Category indicates the category where the file is placed.
Size (KB) the size of the file in kilobytes.
Updated date and time of the last file update.
Shared displays the number of users and organizations the file is shared with.
Uploading a file
First, it is necessary to click on the “Upload File” button in the navigation bar. This will open the file selection dialog.
Here you must select the category for the file to upload. Once selected, you can enter a callback URL to be invoked once the file is uploaded. Finally, you must click on the “Click or drop file here” button to select the file to upload.
The callback URL is invoked with a POST request carrying the following body:
For each item in the listing, the following actions can be performed:
Download opens the file for downloading.
Copy to Clipboard copies the unique URL of the file for use on the platform.
Share allows viewing and sharing the script for other users to use.
Choose File to Upload allows updating the uploaded file with another. This does not affect the generated link, so the change will be reflected wherever it was being used.
Delete removes the selected file.
Filters
Filters allow applying a filter on the listing.
You can use these filters:
Name filters by file name (like search).
Identifier filters by file identifier (like search).
Category filters by file category (list of predefined options).
List can be sorted by clicking on the column headers. This configuration will be saved if dashboard settings are saved. Default sort is by last updated date, descending.
Configuration
The widget can be configured with a predefined filter. In that case the inline filters are replaced by the configuration options, so the user browses the prefiltered listing without being able to change it.
Schedulers History List
The schedulers history list allows you to view the execution history of the schedulers configured in your organization.
How it works
Below are the actions that can be performed both within the widget and on the displayed data.
Filter by Columns
Basic Filter
Perform a basic search by entering text that will filter by predefined fields.
Widget Menu
The following actions can be performed:
Capture screen: Takes a screenshot of the widget.
Duplicate widget: Creates a duplicate of the widget on the dashboard.
Copy widget: Copies the widget to another dashboard.
Change widget location: Moves the widget to another dashboard.
Configuration
General
Boxed: widget will be displayed with background in dahsboard.
About: widget description in Markdown format.
Title: widget title. It can be configured to remain fixed in the widget or only be displayed when it receives focus.
Toolbar: configures the behavior of the widget bar on the dashboard, allowing you to hide it, hide it when not in use, or leave it always visible.
Refresh Frequency: allows configuring the data refresh frequency displayed in the list.
Extra actions: allows user to add new specific actions to the widget with your own code.
You can add a new one by pressing the New button.
Once you added a custom action it can be modified later by pressing the name in the list.
In order to remove the custom action click the delete icon button on the right.
In extra actions you can write your own code were you can open other dashboards, entities dashboards or execute wizards.
You can find all available functions and methods in Extra Information
Cell Configuration
Alias: Modify the column name. If nothing is added, it will use the default configured name.
Show entity actions: Allow displaying the actions menu when selecting its value in the cell. If the column is an identifier, this field will be enabled.
Hidden column: Enabling this option will hide the column from the user. This is useful when you need the data for formatting purposes, as only the data required in the list will be available.
Options:
Modify the cell’s width and horizontal alignment of its content.
Format the cell’s value.
Pagination: Configure the number of rows to display per page.
Virtual columns
Also you can add virtual columns to lists.
These columns do not have their own values and must be configured in the column formatter once added.
Please note that the contents of this column will never be output to CSV, as it is calculated on the fly and does not rely on any native platform resources.
Button columns
Also you can add button columns to lists in order to execute some custom action related with the row data.
Button label can be setted in normal or virtual columns. Label will be the value.
Button action code receives the complete rowData and you can open other dashboards, entities dashboards or execute wizards.
You can find all available functions and methods in Extra Information
Advanced
In this section, you will configure various filters that will be applied to queries regardless of the user’s specific filtering preferences.
Widget Filters Configuration
Here you can define how widget filters should behave when sharing the dashboard with other users/organizations. This means that when sharing, a user opens these dashboards and won’t see the filters applied to the original dashboard in the specified widgets, preventing the information displayed from changing after a dashboard refresh.
The three possible options are:
Don’t share the widget’s general filter
Don’t share header filters in lists
Don’t share sorting in lists
Tickets List
The list of tickets allows you to view/manage the tickets created within your organization.
How it works
Below are the actions that can be performed both within the widget and on the displayed data.
Filter by Columns
Basic Filter
Perform a basic search by entering text that will filter by predefined fields.
Advanced Filter
Perform a search by selecting the fields to filter by and how to filter by them.
Save and Restore Filters
Basic and Advanced filters can be saved in order to preconfigure a list of filters and restore them at any time. This feature is only available in own dashboards but can be shared with other users.
You can save a filter by fullfilling the filter name in the field at the bottom of the filter panel and clicking on the save button. When a filter is saved, it is stored in the widget’s filter list and can be restored at any time by selecting it from the saved filters list located at the top of the filter panel.
Filters can be saved only when a new filter is created.
This can be useful when you want to save a list of filters that you use frequently and restore them at any time.
Widget Menu
The following actions can be performed:
Download: Download data in CSV format
Create Ticket: Opens the ticket creation wizard
View in map: Opens the Maps widget, displaying the locations of the entities shown in the table
Capture screen: Takes a screenshot of the widget.
Duplicate widget: Creates a duplicate of the widget on the dashboard.
Copy widget: Copies the widget to another dashboard.
Change widget location: Moves the widget to another dashboard.
Sort and Temporarily Hide Columns
Actions per Entity
The following actions can be performed:
Open ticket information: Opens a temporary dashboard displaying information related to the ticket
Open ticket details: Opens the widget with ticket information and details
Edit ticket: Opens the ticket wizard to edit the ticket
Open device information: Opens a temporary dashboard displaying information related to the device associated with the ticket
Open device details: Opens the widget with information about the entity and details of the device associated with the ticket
Edit device: Opens the device wizard to edit the device associated with the entity
Execute operation: Executes an operation on the device associated with the ticket
Delete: Deletes the ticket
Configuration
General
Boxed: widget will be displayed with background in dahsboard.
About: widget description in Markdown format.
Title: widget title. It can be configured to remain fixed in the widget or only be displayed when it receives focus.
Toolbar: configures the behavior of the widget bar on the dashboard, allowing you to hide it, hide it when not in use, or leave it always visible.
Refresh Frequency: allows configuring the data refresh frequency displayed in the list.
Extra actions: allows user to add new specific actions to the widget with your own code.
You can add a new one by pressing the New button.
Once you added a custom action it can be modified later by pressing the name in the list.
In order to remove the custom action click the delete icon button on the right.
In extra actions you can write your own code were you can open other dashboards, entities dashboards or execute wizards.
You can find all available functions and methods in Extra Information
Column Selection
Steps to select and configure the value of a datastream in a column:
Select one or more data streams.
Choose which values from these data streams to display; these will become different columns.
Once selected, click the + button.
Cell Configuration
Alias: Modify the column name. If nothing is added, it will use the default configured name.
Show entity actions: Allow displaying the actions menu when selecting its value in the cell. If the column is an identifier, this field will be enabled.
Hidden column: Enabling this option will hide the column from the user. This is useful when you need the data for formatting purposes, as only the data required in the list will be available.
Options:
Modify the cell’s width and horizontal alignment of its content.
Format the cell’s value.
Pagination: Configure the number of rows to display per page.
Virtual columns
Also you can add virtual columns to lists.
These columns do not have their own values and must be configured in the column formatter once added.
Please note that the contents of this column will never be output to CSV, as it is calculated on the fly and does not rely on any native platform resources.
Button columns
Also you can add button columns to lists in order to execute some custom action related with the row data.
Button label can be setted in normal or virtual columns. Label will be the value.
Button action code receives the complete rowData and you can open other dashboards, entities dashboards or execute wizards.
You can find all available functions and methods in Extra Information
Advanced
In this section, you will configure various filters that will be applied to queries regardless of the user’s specific filtering preferences.
Widget Filters Configuration
Here you can define how widget filters should behave when sharing the dashboard with other users/organizations. This means that when sharing, a user opens these dashboards and won’t see the filters applied to the original dashboard in the specified widgets, preventing the information displayed from changing after a dashboard refresh.
The three possible options are:
Don’t share the widget’s general filter
Don’t share header filters in lists
Don’t share sorting in lists
Time Series data List
The listing allows us to see the values provided by a time series and manage the entities related to it.
How it works
Below are the actions that can be performed both within the widget and on the displayed data.
Filter by Columns
Advanced Filter
Perform a search by selecting the fields to filter by and how to filter by them.
Save and Restore Filters
Basic and Advanced filters can be saved in order to preconfigure a list of filters and restore them at any time. This feature is only available in own dashboards but can be shared with other users.
You can save a filter by fullfilling the filter name in the field at the bottom of the filter panel and clicking on the save button. When a filter is saved, it is stored in the widget’s filter list and can be restored at any time by selecting it from the saved filters list located at the top of the filter panel.
Filters can be saved only when a new filter is created.
This can be useful when you want to save a list of filters that you use frequently and restore them at any time.
Widget Menu
The following actions can be performed:
Download: Data download in CSV format
Capture screen: Takes a screenshot of the widget.
Duplicate widget: Creates a duplicate of the widget on the dashboard.
Copy widget: Copies the widget to another dashboard.
Change widget location: Moves the widget to another dashboard.
Sorting
If time series has sorting columns configured, the sort menu will display the configured sorting columns.
You can apply the sorting configuration by clicking on the sorting configuration desired and remove with the clean button.
Actions by Entity
The actions to be performed will depend on the type of entity that is set as the identifying column:
Edit: Edit the entity by opening the corresponding wizard for that entity type
Execute operation: Perform an operation on the displayed entity
Collect: Simulate data collection on an entity (if the entity type supports this action)
Open device/asset/subscriber/subscription information: Open a temporary dashboard that will display information related to the entity
Open device/asset/subscriber/subscription details: Open the information widget for an entity with the entity’s details
View hierarchy of the entity: Open the hierarchy widget to display the hierarchy of the entity (if the entity type supports this action)
Delete: Delete the entity
Configuration
General
Boxed: widget will be displayed with background in dahsboard.
About: widget description in Markdown format.
Title: widget title. It can be configured to remain fixed in the widget or only be displayed when it receives focus.
Toolbar: configures the behavior of the widget bar on the dashboard, allowing you to hide it, hide it when not in use, or leave it always visible.
Refresh Frequency: allows configuring the data refresh frequency displayed in the list.
Extra actions: allows user to add new specific actions to the widget with your own code.
You can add a new one by pressing the New button.
Once you added a custom action it can be modified later by pressing the name in the list.
In order to remove the custom action click the delete icon button on the right.
In extra actions you can write your own code were you can open other dashboards, entities dashboards or execute wizards.
You can find all available functions and methods in Extra Information
Dataset and Column Selection
Organization: Select the organization to which the dataset belongs
Data set: Select the dataset
Columns: Select the configured columns in the dataset
Column Identifier Selection
Select the identifying column.
Based on the value of this column, the table will display different actions to be performed on each of its rows.
Cell Configuration
Alias: Modify the column name. If nothing is added, it will use the default configured name.
Show entity actions: Allow displaying the actions menu when selecting its value in the cell. If the column is an identifier, this field will be enabled.
Hidden column: Enabling this option will hide the column from the user. This is useful when you need the data for formatting purposes, as only the data required in the list will be available.
Options:
Modify the cell’s width and horizontal alignment of its content.
Format the cell’s value.
Pagination: Configure the number of rows to display per page.
Virtual columns
Also you can add virtual columns to lists.
These columns do not have their own values and must be configured in the column formatter once added.
Please note that the contents of this column will never be output to CSV, as it is calculated on the fly and does not rely on any native platform resources.
Button columns
Also you can add button columns to lists in order to execute some custom action related with the row data.
Button label can be setted in normal or virtual columns. Label will be the value.
Button action code receives the complete rowData and you can open other dashboards, entities dashboards or execute wizards.
You can find all available functions and methods in Extra Information
Advanced
In this section, you will configure various filters that will be applied to queries regardless of the user’s specific filtering preferences.
Widget Filters Configuration
Here you can define how widget filters should behave when sharing the dashboard with other users/organizations. This means that when sharing, a user opens these dashboards and won’t see the filters applied to the original dashboard in the specified widgets, preventing the information displayed from changing after a dashboard refresh.
The three possible options are:
Don’t share the widget’s general filter
Don’t share header filters in lists
Don’t share sorting in lists
Users List
The user listing allows for viewing/managing the users of the organization.
How it works
Below are the actions that can be performed both within the widget and on the displayed data.
Filter by Columns
Basic Filter
Perform a basic search by entering text that will filter by predefined fields.
Advanced Filter
Perform a search by selecting the fields to filter by and how to filter by them.
Save and Restore Filters
Basic and Advanced filters can be saved in order to preconfigure a list of filters and restore them at any time. This feature is only available in own dashboards but can be shared with other users.
You can save a filter by fullfilling the filter name in the field at the bottom of the filter panel and clicking on the save button. When a filter is saved, it is stored in the widget’s filter list and can be restored at any time by selecting it from the saved filters list located at the top of the filter panel.
Filters can be saved only when a new filter is created.
This can be useful when you want to save a list of filters that you use frequently and restore them at any time.
Widget Menu
The following actions can be performed:
New user: Opens the user creation wizard
Capture screen: Takes a screenshot of the widget.
Duplicate widget: Creates a duplicate of the widget on the dashboard.
Copy widget: Copies the widget to another dashboard.
Change widget location: Moves the widget to another dashboard.
Sort and Temporarily Hide Columns
Actions by Entity
The following actions can be performed:
Edit: Opens the user editing wizard
Delete: Deletes the user
Configuration
General
Boxed: widget will be displayed with background in dahsboard.
About: widget description in Markdown format.
Title: widget title. It can be configured to remain fixed in the widget or only be displayed when it receives focus.
Toolbar: configures the behavior of the widget bar on the dashboard, allowing you to hide it, hide it when not in use, or leave it always visible.
Refresh Frequency: allows configuring the data refresh frequency displayed in the list.
Extra actions: allows user to add new specific actions to the widget with your own code.
You can add a new one by pressing the New button.
Once you added a custom action it can be modified later by pressing the name in the list.
In order to remove the custom action click the delete icon button on the right.
In extra actions you can write your own code were you can open other dashboards, entities dashboards or execute wizards.
You can find all available functions and methods in Extra Information
Cell Configuration
Alias: Modify the column name. If nothing is added, it will use the default configured name.
Show entity actions: Allow displaying the actions menu when selecting its value in the cell. If the column is an identifier, this field will be enabled.
Hidden column: Enabling this option will hide the column from the user. This is useful when you need the data for formatting purposes, as only the data required in the list will be available.
Options:
Modify the cell’s width and horizontal alignment of its content.
Format the cell’s value.
Pagination: Configure the number of rows to display per page.
Virtual columns
Also you can add virtual columns to lists.
These columns do not have their own values and must be configured in the column formatter once added.
Please note that the contents of this column will never be output to CSV, as it is calculated on the fly and does not rely on any native platform resources.
Button columns
Also you can add button columns to lists in order to execute some custom action related with the row data.
Button label can be setted in normal or virtual columns. Label will be the value.
Button action code receives the complete rowData and you can open other dashboards, entities dashboards or execute wizards.
You can find all available functions and methods in Extra Information
Advanced
In this section, you will configure various filters that will be applied to queries regardless of the user’s specific filtering preferences.
Widget Filters Configuration
Here you can define how widget filters should behave when sharing the dashboard with other users/organizations. This means that when sharing, a user opens these dashboards and won’t see the filters applied to the original dashboard in the specified widgets, preventing the information displayed from changing after a dashboard refresh.
Widget that displays the areas provisioned for an organization.
How it works
Popup
The popup will display relevant information about the area as well as certain actions:
edit area
delete area
Basic Filter
Perform a basic search by entering text that will filter by predefined fields.
Advanced Filter
Perform a search by selecting the fields to filter by and how to filter by them.
Save and Restore Filters
Basic and Advanced filters can be saved in order to preconfigure a list of filters and restore them at any time. This feature is only available in own dashboards but can be shared with other users.
You can save a filter by fullfilling the filter name in the field at the bottom of the filter panel and clicking on the save button. When a filter is saved, it is stored in the widget’s filter list and can be restored at any time by selecting it from the saved filters list located at the top of the filter panel.
Filters can be saved only when a new filter is created.
This can be useful when you want to save a list of filters that you use frequently and restore them at any time.
Widget Menu
The following actions can be performed:
New area: will open the area wizard to create a new area
Capture screen: Takes a screenshot of the widget.
Duplicate widget: Creates a duplicate of the widget on the dashboard.
Copy widget: Copies the widget to another dashboard.
Change widget location: Moves the widget to another dashboard.
Configuration
General
Boxed: widget will be displayed with background in dahsboard.
About: widget description in Markdown format.
Title: widget title. It can be configured to remain fixed in the widget or only be displayed when it receives focus.
Toolbar: configures the behavior of the widget bar on the dashboard, allowing you to hide it, hide it when not in use, or leave it always visible.
Refresh Frequency: allows configuring the data refresh frequency displayed in the list.
Extra actions: allows user to add new specific actions to the widget with your own code.
You can add a new one by pressing the New button.
Once you added a custom action it can be modified later by pressing the name in the list.
In order to remove the custom action click the delete icon button on the right.
In extra actions you can write your own code were you can open other dashboards, entities dashboards or execute wizards.
You can find all available functions and methods in Extra Information
Maps
Widget that displays entities with location, both provisioned and collected.
How it works
Basic Filter
Perform a basic search by entering text that will filter by predefined fields.
Advanced Filter
Perform a search by selecting the fields to filter by and how to filter by them.
Save and Restore Filters
Basic and Advanced filters can be saved in order to preconfigure a list of filters and restore them at any time. This feature is only available in own dashboards but can be shared with other users.
You can save a filter by fullfilling the filter name in the field at the bottom of the filter panel and clicking on the save button. When a filter is saved, it is stored in the widget’s filter list and can be restored at any time by selecting it from the saved filters list located at the top of the filter panel.
Filters can be saved only when a new filter is created.
This can be useful when you want to save a list of filters that you use frequently and restore them at any time.
Popup
The popup will display relevant information about the device as well as certain actions:
edit entity
view entity details
open a temporary dashboard with information about the entity
Widget Menu
The following actions can be performed:
Capture screen: Takes a screenshot of the widget.
Duplicate widget: Creates a duplicate of the widget on the dashboard.
Copy widget: Copies the widget to another dashboard.
Change widget location: Moves the widget to another dashboard.
Configuration
General
Boxed: widget will be displayed with background in dahsboard.
About: widget description in Markdown format.
Title: widget title. It can be configured to remain fixed in the widget or only be displayed when it receives focus.
Toolbar: configures the behavior of the widget bar on the dashboard, allowing you to hide it, hide it when not in use, or leave it always visible.
Refresh Frequency: allows configuring the data refresh frequency displayed in the list.
Extra actions: allows user to add new specific actions to the widget with your own code.
You can add a new one by pressing the New button.
Once you added a custom action it can be modified later by pressing the name in the list.
In order to remove the custom action click the delete icon button on the right.
In extra actions you can write your own code were you can open other dashboards, entities dashboards or execute wizards.
You can find all available functions and methods in Extra Information
View Devices
Show Heat Map
Override colors with qRating performance
Override colors with entity alarms
Trackers: each of the points to display can be configured based on the data streams from which the location is retrieved. It is selected from the Datastream Id combo
- alias: modification of the popup title for the pin - icon: pin icon - color: pin color - formatter: pin formatter
Areas
Configuration of area display and management.
Popup configuration
Configuration of the data to be displayed in the popup.
External resources
Advanced
Editing of clusters and configuring various filters that will be applied to queries regardless of what the user may wish to filter later on.
Tracking
Widget for tracking an entity on the map.
How it works
Trackers
Allows us to select a tracker from the list of configured trackers.
Basic Filter
Searches can be conducted by date.
Widget Menu
The following actions can be performed:
Open device information: opens the temporary panel corresponding to the selected entity
Edit: opens the wizard corresponding to the selected entity
Execute operation: opens the pre-configured operation launcher for the selected entity
Capture screen: Takes a screenshot of the widget.
Duplicate widget: Creates a duplicate of the widget on the dashboard.
Copy widget: Copies the widget to another dashboard.
Change widget location: Moves the widget to another dashboard.
Configuration
General
Boxed: widget will be displayed with background in dahsboard.
About: widget description in Markdown format.
Title: widget title. It can be configured to remain fixed in the widget or only be displayed when it receives focus.
Toolbar: configures the behavior of the widget bar on the dashboard, allowing you to hide it, hide it when not in use, or leave it always visible.
Refresh Frequency: allows configuring the data refresh frequency displayed in the list.
Extra actions: allows user to add new specific actions to the widget with your own code.
You can add a new one by pressing the New button.
Once you added a custom action it can be modified later by pressing the name in the list.
In order to remove the custom action click the delete icon button on the right.
In extra actions you can write your own code were you can open other dashboards, entities dashboards or execute wizards.
You can find all available functions and methods in Extra Information
Entity key: entity to be displayed on the map
Trackers: configuration of each of the data streams from which we retrieve the collected and/or provisioned location information
- alias: modification of the title of the pin’s popup - color: color of the tracker - route simulation: route simulation
Allows the creation of hardware manufacturers, used for associating entities and for being able to attach files to models, such as images or logos.
Steps
Manufacturer Wizard
Essential data for the registration and identification of a manufacturer on the platform.
NOTE: There is the possibility to configure the manufacturer by organization by selecting the equivalent wizard
Create manufacturer model
Allows for the creation of hardware models and the ability to associate files with these models, such as images or logos.
Steps
Creating a Model
Essential data for the registration and identification of a model on the platform.
Create new Area
This wizard allows us to create areas.
Steps
Administration Info
Information for the registration and identification for the creation of a new area.
Area Design
In this step, you can build or import the area itself.
Allowed actions:
Import GeoJSON file - Imports a file from the computer
Paste GeoJSON file - Opens the paste tool where you can paste the content of a GeoJSON file from your favorite editor.
In the map, you can see the following tools:
Polyline tool: You can draw a line on the map without an area
Polygon tool: Allows you to create a free form that contains an area on the map
Rectangle tool: Allows you to create a rectangle that contains an area on the map
Circle tool: This tool draws circles that contain an area on the map
Import/Export Configuration
Allows you to import and export the wizard’s configuration via JSON.
When accessing the import and export functionality, it displays a window with various actions. Additionally, it presents the configuration of the wizard in JSON format.
The available actions are as follows:
Upload Json: Uploads a JSON file and replaces the previous JSON configuration.
Paste from clipboard: Pastes JSON data from the clipboard and replaces the previous JSON configuration.
Download Json: Downloads the JSON configuration as a file with the wizard’s name.
Copy to clipboard: Copies the JSON configuration to the clipboard.
Create new Channel
This wizard allows us to create channels to group devices within the same organization.
Steps
Channel Creation
Essential data for the registration and identification of a channel on the platform.
Import/Export Configuration
Allows you to import and export the wizard’s configuration via JSON.
When accessing the import and export functionality, it displays a window with various actions. Additionally, it presents the configuration of the wizard in JSON format.
The available actions are as follows:
Upload Json: Uploads a JSON file and replaces the previous JSON configuration.
Paste from clipboard: Pastes JSON data from the clipboard and replaces the previous JSON configuration.
Download Json: Downloads the JSON configuration as a file with the wizard’s name.
Copy to clipboard: Copies the JSON configuration to the clipboard.
Create new Data Model
This wizard allows us to create data models for customizing data within the platform’s entities.
Steps
Data Model
Data for registration and identification for creating a data model on the platform.
Category
Data for the data model. We will add a category by clicking the + button. We will enter an identifier and optionally a name. Then we click the add button.
General
Boxed: widget will be displayed with background in dahsboard.
About: widget description in Markdown format.
Title: widget title. It can be configured to remain fixed in the widget or only be displayed when it receives focus.
Toolbar: configures the behavior of the widget bar on the dashboard, allowing you to hide it, hide it when not in use, or leave it always visible.
Refresh Frequency: allows configuring the data refresh frequency displayed in the list.
Extra actions: allows user to add new specific actions to the widget with your own code.
You can add a new one by pressing the New button.
Once you added a custom action it can be modified later by pressing the name in the list.
In order to remove the custom action click the delete icon button on the right.
In extra actions you can write your own code were you can open other dashboards, entities dashboards or execute wizards.
You can find all available functions and methods in Extra Information
We can add a data stream, and the data stream creation wizard will open.
We will select the type of data stream we are going to create, either collection or provision.
Qrating
If a version number is entered, a series of fields for filling out the Qrating will appear.
Storage
By default, the storage period will appear in DAYS, but it can be changed to SECONDS, MINUTES, or NEVER.
Import/Export Configuration
Allows you to import and export the wizard’s configuration via JSON.
When accessing the import and export functionality, it displays a window with various actions. Additionally, it presents the configuration of the wizard in JSON format.
The available actions are as follows:
Upload Json: Uploads a JSON file and replaces the previous JSON configuration.
Paste from clipboard: Pastes JSON data from the clipboard and replaces the previous JSON configuration.
Download Json: Downloads the JSON configuration as a file with the wizard’s name.
Copy to clipboard: Copies the JSON configuration to the clipboard.
Create new Device Plan
This wizard allows us to manage device plans.
Steps
Device Plan Creation
Essential data for the registration and identification of a device plan on the platform.
Import/Export Configuration
Allows you to import and export the wizard’s configuration via JSON.
When accessing the import and export functionality, it displays a window with various actions. Additionally, it presents the configuration of the wizard in JSON format.
The available actions are as follows:
Upload Json: Uploads a JSON file and replaces the previous JSON configuration.
Paste from clipboard: Pastes JSON data from the clipboard and replaces the previous JSON configuration.
Download Json: Downloads the JSON configuration as a file with the wizard’s name.
Copy to clipboard: Copies the JSON configuration to the clipboard.
Create new notebook scheduler
This wizard allows us to create schedulers for the previously created Opengate data lab notebooks
Steps
Configuration
Essential data for the scheduler
You need the next in order to schedule the execution of a notebook:
Notebook: notebook to be executed periodically
Report: enables saving for report generated by the notebook execution
Report retention days: days to be stored report in Opengate data lab
Cron pattern: pattern to configure when the notebook will be executed
Params: list of a pair of names and values to be passed to the notebook execution
Create new Organization
Allows for the creation of organizations.
Steps
Administrative Data
Data for registration and identification for data collection on the platform.
Location
Information about the organization’s location.
Security
Configuration of passwords, policies, and authentication through external servers.
It allows the following configurations:
Default Authentication Method: Default authentication.
LDAP: Authentication via LDAP.
Advanced
Enables the copying of data models, channels, actions, views, data sets, and time series from the parent organization if they have been created previously.
Import/Export Configuration
Allows you to import and export the wizard’s configuration via JSON.
When accessing the import and export functionality, it displays a window with various actions. Additionally, it presents the configuration of the wizard in JSON format.
The available actions are as follows:
Upload Json: Uploads a JSON file and replaces the previous JSON configuration.
Paste from clipboard: Pastes JSON data from the clipboard and replaces the previous JSON configuration.
Download Json: Downloads the JSON configuration as a file with the wizard’s name.
Copy to clipboard: Copies the JSON configuration to the clipboard.
Create new Organization Plan
This wizard allows us to manage organization plans.
Steps
Organization Plan Creation
Essential data for the registration and identification of an organization plan on the platform.
Import/Export Configuration
Allows you to import and export the wizard’s configuration via JSON.
When accessing the import and export functionality, it displays a window with various actions. Additionally, it presents the configuration of the wizard in JSON format.
The available actions are as follows:
Upload Json: Uploads a JSON file and replaces the previous JSON configuration.
Paste from clipboard: Pastes JSON data from the clipboard and replaces the previous JSON configuration.
Download Json: Downloads the JSON configuration as a file with the wizard’s name.
Copy to clipboard: Copies the JSON configuration to the clipboard.
Create new pipeline processor
This wizard allows us to create pipeline processors.
Steps
Administrative Data
Essential data for registration and identification of a pipeline in the platform.
Transformer and AI Model Configuration
Select transformers or models to execute.
Create new Provision Function
A Provision function will have JavaScript code that takes inbound data and calculates the actions to be performed for correct provisioning of entities (Assets, Devices, Subscriptions, and Subscribers).
Steps
Administrative Data
Essential data for the registration and identification of a provisioning function in the platform.
Definition
Processor configuration parameters and JavaScript processor specification.
Additionally, the definition of provisioning functions has a menu on the left side that allows for different actions:
- FullScreen - Add Function - Validate Code
FullScreen
Expands to occupy the entire screen, making it easier for visualization.
Add Function
Provides the option to add different functions.
Let’s add the “New entity” function.
Validate Code
Checks the JavaScript code; if it’s correct, it enables the Next button.
Summary
Summary of the data entered previously.
Create new WorkGroup
Allows the creation of work groups to group different channels and grant administration permissions to different user roles.
Steps
Data
Essential data for the registration and identification of a work group on the platform.
Import/Export Configuration
Allows you to import and export the wizard’s configuration via JSON.
When accessing the import and export functionality, it displays a window with various actions. Additionally, it presents the configuration of the wizard in JSON format.
The available actions are as follows:
Upload Json: Uploads a JSON file and replaces the previous JSON configuration.
Paste from clipboard: Pastes JSON data from the clipboard and replaces the previous JSON configuration.
Download Json: Downloads the JSON configuration as a file with the wizard’s name.
Copy to clipboard: Copies the JSON configuration to the clipboard.
Dataset creation wizard
Allows for the creation of data sets.
Steps
Configuration
Data for the registration and identification for the creation of a new data set on the platform.
Definition Columns
You need to select one or more data streams for the configuration of columns. Identifier Column is the name of the identification column. Once the data stream is selected, we will press the add button.
The following data will then appear:
Path: if the data stream value field is selected and its type is not a basic type, then a data path must be selected until you reach a field with a basic type.
Alias: Alias of the dataset.
Apply Filter:
Always: Will always have to be filtered.
Yes: It can be filtered or not.
No: It will not be possible to filter.
Additionally, we can delete or close the dataset to improve visualization.
Here you can see a dataset in collapse format, with options for editing and deleting the dataset.
Finally, we have a summary of the data set, where the following data will appear:
Name: name of the organization
Organization: name of the organization
Columns: columns with configured settings
Sorting Columns
In this step you can define the columns that will be used to sort the time series. You can have multiple sorting configurations, each one with multiple columns.
Alias: Identifier for the sorting configuration.
Description: Description of the sorting configuration.
Columns: List of columns to be used for sorting.
Column: Column from the time series to be used for sorting.
Order: Order to be used for sorting.
Ascending: Ascending order.
Descending: Descending order.
Clone Data Set Configuration
In addition to creating a new data set, we can also clone an existing one and configure it.
Clone Data Set Definition Columns
Having cloned the data set from a previously existing one, the previously configured columns will appear by default.
Import/Export Configuration
Allows you to import and export the wizard’s configuration via JSON.
When accessing the import and export functionality, it displays a window with various actions. Additionally, it presents the configuration of the wizard in JSON format.
The available actions are as follows:
Upload Json: Uploads a JSON file and replaces the previous JSON configuration.
Paste from clipboard: Pastes JSON data from the clipboard and replaces the previous JSON configuration.
Download Json: Downloads the JSON configuration as a file with the wizard’s name.
Copy to clipboard: Copies the JSON configuration to the clipboard.
Entities software wizard
Allows the management of the entities software, used for associating entities and for being able to configure in them.
Steps
Entitites Software Wizard
Essential data for the registration and identification of a software in your organization.
Here you can configure the following:
Organization: Organization were the software will be configured
Name: Visible name for the software
Version: Version of software
Type: The purpose of this piece of software. This can be SOFTWARE or FIRMWARE
Model: Models where this software can be selectable
Update related entities: by checking this allows the user to update related entities with the new information introduced (only available in edit mode)
Operations Management
Allows for the creation of new or cloned operations on the platform.
Steps
Administration
Essential data for the registration and identification of an operation on the platform.
Operations can either be new or cloned. However, existing operations will predominantly be used for cloning and subsequent modification.
New Operation
Creates a customized operation, and in this case, there is the option to import and export JSON. In a cloned operation, the JSON option will not be available.
Clone Operation
In this case, we will clone an operation to change the state of administration.
Configuration
Parameters that define the operation’s configuration. By default, for a cloned operation, the JSON Schema field is already filled. You can view the field’s configuration.
In the Preview section, the result of the JSON Schema configuration will be displayed.
Import/Export Configuration
Allows you to import and export the wizard’s configuration via JSON. Clone operations do not allow the use of json import and export.
When accessing the import and export functionality, it displays a window with various actions. Additionally, it presents the configuration of the wizard in JSON format.
The available actions are as follows:
Upload Json: Uploads a JSON file and replaces the previous JSON configuration.
Paste from clipboard: Pastes JSON data from the clipboard and replaces the previous JSON configuration.
Download Json: Downloads the JSON configuration as a file with the wizard’s name.
Copy to clipboard: Copies the JSON configuration to the clipboard.
Provision Wizards
This wizard allows us to create provision wizards.
Steps
Provision Wizard
Allows you to view and edit a created wizard view. From this wizard, you can create a new one, which will open the Wizard: New window.
Administrative Data
Essential data for the registration and identification of a provision wizard in the platform.
Set Your Fields
Add the customized steps that the wizard will have.
In this case, select the steps admin and security.
For example, for the Admin step, select administrative state and operational status.
And for the Security step, select certificates.
Set Your Default Values
See how the wizard would look graphically with the new steps added, and select default values if needed.
Previous Validations
Create validations that will be executed before the main action.
Post Actions
Create validations that will be executed after the main action.
Import/Export Configuration
Allows you to import and export the wizard’s configuration via JSON.
When accessing the import and export functionality, it displays a window with various actions. Additionally, it presents the configuration of the wizard in JSON format.
The available actions are as follows:
Upload Json: Uploads a JSON file and replaces the previous JSON configuration.
Paste from clipboard: Pastes JSON data from the clipboard and replaces the previous JSON configuration.
Download Json: Downloads the JSON configuration as a file with the wizard’s name.
Copy to clipboard: Copies the JSON configuration to the clipboard.
Rules
This wizard allows us to create rules.
Steps
Administration
Essential data for registration and identification for creating a rule in the platform.
Rules consist of Easy rules and Advanced rules, which are created differently in the second step.
We can configure a rule with the following options:
New rules: Create a new rule from scratch.
From catalog: Create a rule from the catalog.
Clone existing rule: Create a rule from a previously created one.
Easy rule
Build a rule using basic concepts for evaluation.
You must select the rule type depending on whether you want a data stream collection, the operation result, or an event. When selecting Data Stream collection, the Data Stream button above will be enabled.
Clicking the Data Stream button will open a menu where you can search for and add the data stream, along with adding an alias.
However, if you select Operation result or Event as the rule type, the Data Stream button will not be visible.
For all three rule types, you need to select a parameter, which consists of an identifier, type, and value.
Within the parameter menu, you will enter an identifier, type (string, integer, number, or boolean), and value.
Rule Definition (Easy)
Build a rule using basic concepts for evaluation.
Rule Conditions
This will trigger the rule when the rule meets the filter conditions.
Select a data stream to compose the filter.
You can also add a group to add another condition to the filter.
Perform the following actions
Actions will be executed when the configured conditions are met.
There are different options within the New Action menu:
You can delay the action by a specified number of milliseconds, creating a wait threshold before executing the actions. In this case, creating a new alarm has been selected.
Advanced rule
Build a rule using basic concepts for evaluation.
Just like easy rules, the same options exist. You need to select the rule type depending on whether you want a data stream collection, the operation result, or an event. When selecting Data Stream collection, the Data Stream button above will be enabled.
Rule Definition (Advanced)
Allows you to write the JavaScript code of the rule for evaluation. It also allows you to delay the execution of actions with a wait threshold.
Time Series
Allows you to create time series for collecting data from a device. It stores rows with columns and maintains aggregated values by column, grouped by configurable time periods.
Steps
Configuration
Essential data for registration and identification of a time series in the platform.
Time Bucket
In time series, the data is grouped by time buckets (time intervals), and all received data columns in each bucket are updated using the selected aggregated function. To understand which bucket each row represents, you will have an additional column to view the end/init date of the selected bucket.
Retention: Column to view the end date of the selected bucket.
Time Bucket: Time interval taken as a reference for data grouping.
Bucket Column: Column to view the end date of the selected bucket (disabled if the time bucket is 0).
Bucket Init Column: Column to view the init date of the selected bucket (disabled if the time bucket is 0).
Origin: Date from which the time series starts.
Data Columns
You need to select one or more data streams for the configuration of columns.
Identifier Column: Name for the column representing provision.administration.identifier._current.value path with filter=YES.
Columns: These can be expanded or collapsed depending on the desired view.
Alias: Alias for the selected column.
Aggregation Field: Aggregation function applied to the current column.
Apply Filter: The dataset filter:
Always: Will always have to be filtered.
Yes: It can be filtered or not.
No: It will not be possible to filter.
Context Columns
You can add some columns as context information, and these columns will be added to the time series to be used in searching resources.
Columns:
Input Name: Name of the dataset.
Apply Filter: The dataset filter:
Always: Will always have to be filtered.
Yes: It can be filtered or not.
No: It will not be possible to filter.
Path: If a data stream value field is selected and its type is not a basic type, then the data path must be selected until you reach a field with a basic type.
Sorting Columns
In this step you can define the columns that will be used to sort the time series. You can have multiple sorting configurations, each one with multiple columns.
Alias: Identifier for the sorting configuration.
Description: Description of the sorting configuration.
Columns: List of columns to be used for sorting.
Column: Column from the time series to be used for sorting.
Order: Order to be used for sorting.
Ascending: Ascending order.
Descending: Descending order.
Summary
This step contains the summary of the time series to be created:
New Time series Data: Configuration data.
Bucket Info: Bucket configuration data.
Columns: Configured columns.
Context: Configured context columns.
Clone
In addition to creating a new dataset, you can clone a dataset from an existing one that has default data.
Import/Export Configuration
Allows you to import and export the wizard’s configuration using JSON.
When accessing import and export, it shows a window with different actions. It also displays the wizard’s configuration in JSON format.
The available actions are as follows:
Upload JSON: Uploads a JSON file and replaces the previous JSON.
Paste from clipboard: Pastes JSON from the clipboard and replaces the previous JSON.
Download JSON: Downloads the JSON in a file with the name of the wizard.
Copy to clipboard: Copies the JSON to the clipboard.
Time series functions wizard
Allows for the creation of time series functions.
Steps
Administration
Data for the registration and identification of the time series function on the platform.
Here you can select the organization, name, description and value types allowed by the function.
Definition
This is the code of the time series function.
Here you can modify the code and test it simulating the input data using the receivedValues, extra and currentValue simulated params.
Summary
Finally you can review changes (except the code) in order to proceed.
Once you finish you may be able to select the function in a time series column.
Upload new data transformer
Allows you to upload files for the execution of a transformer.
Steps
Administration data
In this step, you must enter the administrative information for the transformer.
The form contains the following fields:
Organization - organizational location (required)
Files
Here, you can upload the necessary Python files for the execution of the transformation.
The first file will be the main execution file.
Additional files can be Python library files necessary for the correct execution.
Upload new predictive model
Allows you to upload files for the execution of a model.
Steps
Administration data
In this step, you must enter the administrative information for the predictive model.
The form contains the following fields:
Organization - organizational location (required)
Files
Here, you can upload the necessary Python files for the execution of the transformation.
It’s necessary to use files with extensions PMML or ONNX.
User
Allows the creation of users on the platform.
Steps
User Data
Essential information for the registration and identification of a user on the platform.
All fields are mandatory.
Email: The email address must be valid.
Password: The “Password” and “Password Repeat” fields must match.
Profile: User profile to be assigned to the user.
Organization: Administrative organization associated with the user.
Workgroup: Workgroup indicating the management scope assigned to this user. This means the list of entities that the user can manage through the web and API interfaces.
Import/Export Configuration
Allows you to import and export the wizard’s configuration via JSON.
When accessing the import and export functionality, it displays a window with various actions. Additionally, it presents the configuration of the wizard in JSON format.
The available actions are as follows:
Upload Json: Uploads a JSON file and replaces the previous JSON configuration.
Paste from clipboard: Pastes JSON data from the clipboard and replaces the previous JSON configuration.
Download Json: Downloads the JSON configuration as a file with the wizard’s name.
Copy to clipboard: Copies the JSON configuration to the clipboard.
Filter: The operation will run on entities resulting from applying the current filter of the web (quick/advanced filter). This one requires an extra confirmation by the user before execution.
The helper option allows you to add previously created packages and datastreams, in addition to enabling or disabling the Loading entity/operation information.
Scheduled
Set when the operation will be executed.
The following sections show the different options available.
Now
The operation will be executed immediately.
Later
Set the time to pass (in minutes) before executing the operation.
Each option:
Set the frequency with which the operation will be executed.
Fields:
Number of minutes: Set the number of minutes to pass until the next execution.
For example: I want to run the operation every 3 minutes.
Periodically
Configure the periodic execution.
Fields:
Name of periodicity: Give a name to the execution.
Date when the operation will be executed: Set the date on which the execution will start.
Date when the operation will be executed:
Date: Set the date on which the execution will start.
Hour: Set the time at which each execution will start.
By repetitions: Set the number of repetitions of execution. If left empty, the execution will be repeated indefinitely.
Advanced Options
Here you can manage advanced features for execution like timers, scattering, and others.
Timers
In this step, you can set different timers for the operation.
You could already finish setting up the operation.
Execution timeout: In seconds. Timeout for the execution of the operation on a single entity configured in step “Select target”. If the timeout is exceeded, the operation will be canceled for that entity.
Timeout in minutes: Timeout for the execution of the operation on the set of all entities set in step “Select target”. If the timeout is exceeded, the operation will be canceled for the entire group of entities.
Retries: Number of retries before canceling the operation of a single entity when it has expired the timeout operation.
Retries delay in seconds: Waiting time between retries.
Ack timeout in seconds: Timeout for a single entity to accept the execution of the operation. If the operation has not been accepted by the entity at the end of the timeout, it will be canceled.
Other options
In this step, you can set other options of the operation.
Response types: Response types that will trigger a retry of the operation.
Callback: URI format defined in RFC 3986. Only HTTP transport supported. Allows enabling Notifications to be sent to an application. The platform will add to this URI the name of the specific callback.
User notes: Space to write anything about the operation.
Max spread: represents a percentage of the timeout job, will be a value between 0 and 90, where 0 is the minimum time, i.e., operations run as fast as possible and 90 is the maximum time i.e., operations will spread throughout the time available to run the job, the job time out, the default value is 0.
NOTE: This option is only available when a operation is executed using a filter.
Summary
Here you can review the configuration of the execution before the launch.
Import/Export Configuration
Allows you to import and export the wizard’s configuration via JSON.
When accessing the import and export functionality, it displays a window with various actions. Additionally, it presents the configuration of the wizard in JSON format.
The available actions are as follows:
Upload Json: Uploads a JSON file and replaces the previous JSON configuration.
Paste from clipboard: Pastes JSON data from the clipboard and replaces the previous JSON configuration.
Download Json: Downloads the JSON configuration as a file with the wizard’s name.
Copy to clipboard: Copies the JSON configuration to the clipboard.
Data collection
Allows collecting data from data points.
Steps
Collection Form
Essential data for registering and identifying data collection in the platform.
In the Unique identifier field, you can select an entity.device. In addition, it opens a menu when you click on the three dots.
The menu allows you to perform the following actions:
Exact search: Enables an exact search for the identifier.
Case sensitive: The search is case-sensitive.
New: Opens the device wizard and allows its creation.
Execute operation: Opens the wizard for creating a new operation. You need to have selected a unique identifier for this to be available.
You can fill out the wizard with the following fields, which are not mandatory:
Feed: Used to label a data point.
Data Stream id: Select one or more data streams for data collection. Depending on the selected data stream, different fields will appear for filling out and collecting data.
Image Execution Scheduler
Allows scheduling the execution of an image.
Steps
Image Execution Form
Essential data for registering and identifying an image execution in the platform.
Not all fields are mandatory.
Identifier: The email address must be valid.
Name: The name of the image.
Tag: The tag of the image.
Max time for execution: The maximum time to wait for the execution to complete.
Max wait for callback: The maximum time to wait for the callback to complete. This value must be greater than the max time for execution.
Environment variables: Environment variables to be used for the execution.
Planification
There is two options for planification:
Cron Expression
Cron expression: The cron expression to be followed.
Timezone: The timezone to be used for the cron expression.
Interval
Interval (minutes): The interval in minutes to be followed.
Both options are mutually exclusive. Also you can define a start and end date for the schedule.
From Date: The date when the schedule should start.
To Date: The date when the schedule should end.
Finally you can mark the Execute now checkbox to execute the request immediately after creation apart from the schedule.
Import/Export Configuration
Allows you to import and export the wizard’s configuration via JSON.
When accessing the import and export functionality, it displays a window with various actions. Additionally, it presents the configuration of the wizard in JSON format.
The available actions are as follows:
Upload Json: Uploads a JSON file and replaces the previous JSON configuration.
Paste from clipboard: Pastes JSON data from the clipboard and replaces the previous JSON configuration.
Download Json: Downloads the JSON configuration as a file with the wizard’s name.
Copy to clipboard: Copies the JSON configuration to the clipboard.
Pipeline Processor Scheduler
Allows scheduling a Pipeline Processor. With a pipeline processor you can execute multiple pipelines and rest requests in a scheduled way.
Steps
Pipeline Processor Form
Essential data for registering and identifying a pipeline processor in the platform.
Identifier: The identifier of the pipeline processor.
Image Executions: The images to be executed.
Rest Requests: The rest requests to be executed.
Each one will be executed in sequence. You can reorder the sequence by dragging and dropping the items. It requires at least 2 items in pipeline.
Planification
There is two options for planification:
Cron Expression
Cron expression: The cron expression to be followed.
Timezone: The timezone to be used for the cron expression.
Interval
Interval (minutes): The interval in minutes to be followed.
Both options are mutually exclusive. Also you can define a start and end date for the schedule.
From Date: The date when the schedule should start.
To Date: The date when the schedule should end.
Finally you can mark the Execute now checkbox to execute the request immediately after creation apart from the schedule.
Import/Export Configuration
Allows you to import and export the wizard’s configuration via JSON.
When accessing the import and export functionality, it displays a window with various actions. Additionally, it presents the configuration of the wizard in JSON format.
The available actions are as follows:
Upload Json: Uploads a JSON file and replaces the previous JSON configuration.
Paste from clipboard: Pastes JSON data from the clipboard and replaces the previous JSON configuration.
Download Json: Downloads the JSON configuration as a file with the wizard’s name.
Copy to clipboard: Copies the JSON configuration to the clipboard.
Rest Request Scheduler
Allows scheduling a Rest Request.
Steps
Rest Request Form
Essential data for registering and identifying a rest request in the platform.
Not all fields are mandatory.
Identifier: The email address must be valid.
Url: The url to be called.
Method: The method to be called.
Max wait for request: The maximum time to wait for the request to complete (excludes the time to wait for the callback).
Max wait for callback: The maximum time to wait for the callback to complete (excludes the time to wait for the request).
Headers: Headers to be sent with the request.
Body: Body to be sent with the request.
Planification
There is two options for planification:
Cron Expression
Cron expression: The cron expression to be followed.
Timezone: The timezone to be used for the cron expression.
Interval
Interval (minutes): The interval in minutes to be followed.
Both options are mutually exclusive. Also you can define a start and end date for the schedule.
From Date: The date when the schedule should start.
To Date: The date when the schedule should end.
Finally you can mark the Execute now checkbox to execute the request immediately after creation apart from the schedule.
Import/Export Configuration
Allows you to import and export the wizard’s configuration via JSON.
When accessing the import and export functionality, it displays a window with various actions. Additionally, it presents the configuration of the wizard in JSON format.
The available actions are as follows:
Upload Json: Uploads a JSON file and replaces the previous JSON configuration.
Paste from clipboard: Pastes JSON data from the clipboard and replaces the previous JSON configuration.
Download Json: Downloads the JSON configuration as a file with the wizard’s name.
Copy to clipboard: Copies the JSON configuration to the clipboard.
This wizard allows us to create connector functions.
Steps
Administration
Essential data for registration and identification of a connector function in the platform.
Criteria
Criteria selector
Definition
Allows you to write the connector function code using JavaScript to be evaluated.
In Payload type, there are the following options:
TEXT
JSON
BINARY
The action menu provides different options:
Maximize: Full screen for better viewing of the step.
Basic functions: Default basic functions.
Validate Code: Validates the function code.
Summary
Summary of the complete connector function information.
It allows the options of Disabled, Test, and Production.
Import/Export configuration
Allows you to import and export the wizard’s configuration using JSON.
When you access import and export, it displays a window with different actions. It also displays the wizard’s configuration in JSON format.
The available actions are as follows:
Upload JSON: Uploads a JSON file and replaces the previous JSON.
Paste from clipboard: Pastes JSON from the clipboard and replaces the previous JSON.
Download JSON: Downloads the JSON in a file with the wizard’s name.
Copy to clipboard: Copies the JSON to the clipboard.
Create new Asset
This wizard allows us to create entities of type entity.asset. All the data entered will be provisioning data.
Steps
Administration
Essential data for the registration and identification of the asset in the platform.
Location
Initial location of the device.
Customization
Custom data based on the data models created for the user’s organization. Data from the default platform data models are not included.
Import/Export Configuration
Allows you to import and export the wizard’s configuration via JSON.
When accessing the import and export functionality, it displays a window with various actions. Additionally, it presents the configuration of the wizard in JSON format.
The available actions are as follows:
Upload Json: Uploads a JSON file and replaces the previous JSON configuration.
Paste from clipboard: Pastes JSON data from the clipboard and replaces the previous JSON configuration.
Download Json: Downloads the JSON configuration as a file with the wizard’s name.
Copy to clipboard: Copies the JSON configuration to the clipboard.
Create new Bundle
This wizard allows us to create bundles, which can update software, firmware, or configuration files on your remote devices.
Steps
Pre-actions
You can choose to include pre-actions or not to perform before executing the bundle operation.
Configuration
Data for bundle configuration.
Deployment Elements
If needed, you can add a deployment element to attach to the bundle.
If you add the deployment element, a modal window will appear with different types of operations:
INSTALL
UNINSTALL
UPGRADE
This allows you to install, uninstall, or upgrade an implementation on a device.
There are two options:
MANDATORY
OPTIONAL
A bundle can contain four types of files, as seen in the type selector:
SOFTWARE
CONFIGURATION
PARAMETERS
FIRMWARE
Additionally, you can add validators if desired:
After adding deployment elements, you will return to the previous “Deployment Elements” step, where you can see the deployment element you just added. You will also notice that the “Active Bundle” checkbox is now enabled, allowing you to activate or deactivate the bundle.
Post-actions
In the final step, you can choose to include post-actions or not to perform after the bundle operation has executed.
Create new Certificate
This wizard allows you to create certificates for your organization.
Steps
Configuration
Essential data for registration and identification.
Previously to create new certificates it is neccesary to know the next tips:
An user can upload in the platform a certificate in her organization and in the organizations with low hierarchy managed by the user
A certificate can only be signed by a certificate uploaded in the platform with usage CERT_SIGN and this certificate must be in the same organization or in a organization with visible upper hierarchy
You can upload the same certificate to the platform a lot of times but always with different identificator
If you change the organization of a certificate, the trust chain will be updated keeping in this, only those certificates belonging to visible organizations for the new organization.
Fields
Name : Certificate Name.
Description : This field contain the certificate description
Administrative State : This field will contain the Name Administrative State, valid values are [ NOT_ACTIVE, ACTIVE, REVOKED, EXPIRED].
Usages : This field will contain the usages, valid values are [FILE_VALIDATION, DEVICE_COMMUNICATIONS, DEVICE_ACCESS, CERT_SIGN].
Tags : This field will contain the tags.
Organizations : This field will contain the organizations, Organizations inside list must exist.
Upload
Upload the certification file.
Only administrative information can be updated. If you need to change the certificate file, you have to delete the existing and add a new one.
Import/Export Configuration
Allows you to import and export the wizard’s configuration via JSON.
When accessing the import and export functionality, it displays a window with various actions. Additionally, it presents the configuration of the wizard in JSON format.
The available actions are as follows:
Upload Json: Uploads a JSON file and replaces the previous JSON configuration.
Paste from clipboard: Pastes JSON data from the clipboard and replaces the previous JSON configuration.
Download Json: Downloads the JSON configuration as a file with the wizard’s name.
Copy to clipboard: Copies the JSON configuration to the clipboard.
Create new Entity
This wizard allows us to create entities of type entity.device.
All the data entered will be provisioning data.
Essential data for the registration and identification of the device on the platform.
You could already finish setting up the device.
Fields
Unique identifier of entity Each entity have a unique identifier all over the platform.
Organization The entity will associate with one of the organizations selected from the list of organizations that have access.
Channel The entity will associate with one of the channels selected from the list of channels that have access. This list depends on the selected organization.
Default feed The entity will store data related to this when no other supplied on collection
Plan Defines the usage limits for the entity (More info)
Service group Determines how OpenGate behaves when managing the entity (More info)
Administrative state
Requested - Entity requested to the supplier
Ready - Entity ready for installation
Repair - Entity under repair
Testing - Entity in tests
Active - Field deployed entity
Suspended - Suspended its operation
Deleted - Entity removed from available stock
Retired - Field entity withdrawal
Banned - Entity banned, It means that received information of this entity is not going to be collected
Operational status
Unknown - Not known
Normal- Normal Operation
Alarm - The device has active alarms
Down - The device is not operative. Could be running but it is not performing its operation
Safe mode - The device is in Safe Mode (Sleeping, etc.)
Tamper - The device was tampered
Test - The device is working in test mode
Related entity Datastreams collected by this device will be copied to the related entity
Inventory
Data with inventory information.
Fields
You could already finish setting up the device.
Name of entity Each M2M entity have a unique identifier all over the platform.
Description of entity Using the name attribute and the description attribute, you can set up an alias for your favourite entity and you can write down any detail you want about an entity or its state.
Serial number An identification number of device.
Hardware Choose, from the list of hardware allowed by the platform, the hardware of the device.
Software Choose, from the list of software allowed by the platform, the software of the device.
Location
Initial location of the device.
You could already finish setting up the device.
Fields
Latitude, longitude To set latitude and longitude of the device, click show map to open map and drag the point to the desired position.
Address, Postal code, Province, Region and Town extra information for the location.
Security
From here, you can associate a certificate with the device.
You could already finish setting up the device.
Fields
Trusted boot Secure boot configuration
When you create a device with a trusted boot field, this action has consequence in the collection actions, that is, when collect an event from device with the “trusted boot” field, if the event has secure boot the platform will compare the collected value with the provisioned value and can define an alarm rule for automatically change the administrative status to banned if both values are different.
Certificate Used for secure communication between device and platform. Can select multiple certificates from the list.
Interfaces
Creation of different types of communication interfaces associated with the device.
From here, you can configure several types of communication interfaces:
Customization
Custom data based on the data models created for the user’s organization. Default platform data model is not included.
Import/Export Configuration
Allows you to import and export the wizard’s configuration via JSON.
When accessing the import and export functionality, it displays a window with various actions. Additionally, it presents the configuration of the wizard in JSON format.
The available actions are as follows:
Upload Json: Uploads a JSON file and replaces the previous JSON configuration.
Paste from clipboard: Pastes JSON data from the clipboard and replaces the previous JSON configuration.
Download Json: Downloads the JSON configuration as a file with the wizard’s name.
Copy to clipboard: Copies the JSON configuration to the clipboard.
Create new Subscriber
This wizard allows us to create subscribers.
Steps
Type
Select the type of subscriber to manage.
Admin
Data for registration and identification for creating a subscriber on the platform.
Inventory
Define inventory information.
Custom
Allows the selection of a custom data model.
Import/Export Configuration
Allows you to import and export the wizard’s configuration via JSON.
When accessing the import and export functionality, it displays a window with various actions. Additionally, it presents the configuration of the wizard in JSON format.
The available actions are as follows:
Upload Json: Uploads a JSON file and replaces the previous JSON configuration.
Paste from clipboard: Pastes JSON data from the clipboard and replaces the previous JSON configuration.
Download Json: Downloads the JSON configuration as a file with the wizard’s name.
Copy to clipboard: Copies the JSON configuration to the clipboard.
Create new Subscription
This wizard allows us to create subscriptions.
Steps
Type
Select the type of subscription to manage.
Admin
Data for registration and identification for creating a subscription on the platform.
Inventory
Define inventory information.
Custom
Allows the selection of a custom data model.
Import/Export Configuration
Allows you to import and export the wizard’s configuration via JSON.
When accessing the import and export functionality, it displays a window with various actions. Additionally, it presents the configuration of the wizard in JSON format.
The available actions are as follows:
Upload Json: Uploads a JSON file and replaces the previous JSON configuration.
Paste from clipboard: Pastes JSON data from the clipboard and replaces the previous JSON configuration.
Download Json: Downloads the JSON configuration as a file with the wizard’s name.
Copy to clipboard: Copies the JSON configuration to the clipboard.
Create new Ticket
Here you can initiate a new ticket on the platform.
Steps
Administration
Essential data for the registration and identification of the ticket on the platform.
Inventory
Location
Information about the ticket’s location.
Custom
Custom data based on data models created for the user’s organization. Default platform data model information is not included.
Import/Export Configuration
Allows you to import and export the wizard’s configuration via JSON.
When accessing the import and export functionality, it displays a window with various actions. Additionally, it presents the configuration of the wizard in JSON format.
The available actions are as follows:
Upload Json: Uploads a JSON file and replaces the previous JSON configuration.
Paste from clipboard: Pastes JSON data from the clipboard and replaces the previous JSON configuration.
Download Json: Downloads the JSON configuration as a file with the wizard’s name.
Copy to clipboard: Copies the JSON configuration to the clipboard.
Upload Bulk File
You can attach a file to create new entities.
Here, the user can create, update, and delete entities. To do this, the user must choose the type of action to execute and the type of file to upload.
Steps
Bulk Wizard
Available actions:
Create
Delete: This option allows deleting the device. If the device subscriptions or subscribers exist, this entity will not be deleted.
Delete All: This option allows deleting the complete device with subscriptions and subscribers.
Update
Resource: We will have the options of Entities or Tickets.
Type of file:
It allows the selection of a file with the following types:
Csv
Json
Flattened: A data file format that simplifies the structure, presenting information in a flat list, which can be beneficial in some data analysis and processing situations.
CSV
In the CSV section, we will add the different options: Escape Char, Line separator, Null Value, and Quote Char.
Once this is done, we will add the CSV file, and the simulation button will be enabled. This button is only available for the CSV file type.
When you press the simulation button, a window will open where you can see the attached CSV file.
JSON
Attach a JSON file.
JSON Flattened
Attach a JSON Flattened file.
Import/Export Configuration
Allows you to import and export the wizard’s configuration via JSON.
When accessing the import and export functionality, it displays a window with various actions. Additionally, it presents the configuration of the wizard in JSON format.
The available actions are as follows:
Upload Json: Uploads a JSON file and replaces the previous JSON configuration.
Paste from clipboard: Pastes JSON data from the clipboard and replaces the previous JSON configuration.
Download Json: Downloads the JSON configuration as a file with the wizard’s name.
Copy to clipboard: Copies the JSON configuration to the clipboard.
Upload bulk file (Advanced)
This wizard allows us to create, delete, or update entities in bulk using an Excel file and a provisioning function previously created in the provisioning function wizard.
Steps
Provision functions
Provision Function: Name of the provisioning function. A provisioning function will have JavaScript code that takes inbound data and calculates the actions to be performed for correct provisioning of entities (Assets, Devices, Subscriptions, and Subscribers).
Sheet Name: Name of the selected sheet when creating the provisioning function.
Header row: The row where the header is located in the file.
Column result name: The column where it will return the results obtained when executing this wizard.
Select and upload file
Bulk files allow you to upload and transform their content data through provisioning functions. Only xlsx and xls files are allowed. It is necessary that the file contains the name of the sheet to be able to visualize it. The preview will only be made of the first 5 rows.
Preview
Result of the execution of the selected provisioning function with the uploaded file. This preview takes the first 5 rows.
Clicking on “view details” will open a modal window showing all the details along with their values.
Summary and Execute
Displays a brief summary of:
Selected file: The file selected in the first step.
Provision function: The data of the provisioning function selected in the first step.
Summary of results: Result of the selected rows, executed rows, and rows that will be skipped.
Since this is a potentially irreversible operation, it is necessary to check the checkbox in order to execute the bulk wizard advanced.
Templates
Templates are preconfigured dashboards designed to display relevant information about an entity: device, asset, subscriber, subscription, and tickets.
Creating a Template
In the dashboard actions menu, select the “Save as template” option.
You’ll be presented with a wizard to configure your template:
Dashboard: Choose the dashboard for the template.
Workspace: Choose the workspace or workspaces where the template will be saved.
Name: Choose the name for the template.
Priority: Choose the priority for displaying different templates if you configure more than one for the same conditions.
Conditions
Allowed resource type: Choose the type of resource it will open.
Specific type: Choose the specific type or specific types of resource.
You can manage templates within a workspace from the Workspaces wizard:
Also you can manage it in the Templates configuration section:
You can delete and modify the templates configured for a workspace.
Open Templates
From most widgets displaying information about an entity, you can access these templates to view the information of that device on a dashboard referred to as a “temporary” dashboard.
Once you click on the link, you’ll be shown the “temporary/template” dashboard with the information from the entity you opened it from. There, you can choose which template you want to use to view the information for that entity:
These dashboards can’t be managed, and any changes to filters won’t be saved. They can only be cloned within a workspace. A cloned dashboard will then function like any other dashboard.
Administration
The Administration website contains pre-configured panels with which you can perform provisioning tasks on the platform elements.
The home screen will display the most commonly used panels, making it easier to access the various configurations.
The menu can be collapsed to gain screen space by clicking on the bottom navigation menu.
Panels
Each panel has one or more widgets already available in dashboards, so you can configure and use them in a unified way.
You can access the equivalent documentation from each page that will take you to the corresponding widgets.
Sections
Within the configurations, you can distinguish three main sections:
Entities here, you can browse the different types of entities.
Organizations contains those items that you can can provision related to your organizations.
Workspaces & Dashboards allows you to manage everything related to the use of the web tool.
In this section you can customize labels for your organization. This labels can be used for table headers, datastreams, custom sections and as title for widgets, dashboards and workspaces.
Section
Below you can see the list of the configured labels.
Configuration
You can add a new custom label by clicking in the + New button:
Custom labels have 3 fields and all of them are required:
Key is the unique identifier for your label
Spanish is the desired translation for this language
English is the desired translation for this language
If you type an existing internal label during the creation Spanish and English fields will be fulfilled with the internal translations. This changes only applies to your organization until you remove the custom label.
Labels actions
Edit You can update translation for your custom labels and changes will be applied immediately
Delete Also you can remove your custom labels but a browser restart is required. A warning is shown in order to remind you to restart.
Operations Launcher Wizards
This wizard allows us to manage custom operation launchers for the existing operation types.
Steps
Administrative Data
Principal and administrative data for the Custom Operation View. Title and icon will be the visible parts in menus.
Set Your Default Values
Here you can configure default values for the operation that will be executed within this custom view.
Set Your Fields
Here you can configure visible steps and fields for the operation execution wizard.
Configuring parameters Step
If your operation has parameters you can personalize Parameters Step using your own javascript sniplet with vanjs. Here you can define how the parameters step is displayed and how the data is introduced.
The code is encapsulated in a function that receives as parameters: operationData,parametersData,callback
operationData contains the data of the operation that is being executed in json format.
parametersData is an object that contains the parameters of the operation.
callback is a function that must be called in order to paint the vanjs form created.
Example:
asyncfunction (operationData,parametersData,callback) {
// YOUR CODE HERE
}
Available utils
$api -> use it to create http petitions to OpenGate Api Rest doc
Promise -> allows easy execution of multiple promises
http -> javascript encapsulation of a useFetch (Nuxt 4) instance doc. Returns { data, error, status, refresh, clear } where data and error are reactive Refs.
isFormValid(boolean, parametersValues): use it to (in)validate the form and send the final parameters object
Create validations that will be executed before the execution of the operation.
Callback must be called in order to validate the introduced data:
callback(boolean result, array messages)
result must be true or false in order to determine if continue the execution
messages contains strings to be shown to the execution log
Widgets Defaults
In this configuration section you can configure widgets behaviour when opened from others.
Section
Below you can see the list of the available configurable widgets. List can be filtered by category and/or widget name
You can add, edit and remove the configuration for every available widget in this list.
These configurations will be available for the user organization.
Widget defaults actions
Every listed widget has actions shown below:
New action is shown while no previous configuration saved and allows to configure new defaults for the selected widget
When widget is configured an actions menu will be available with these options:
Edit that allows change previously configured defaults
Delete quits the current configurations once you confirm the operation
Preview and configuration
A preview window will be opened were you can see how is opened the selected widget.
From this you can configure as you consider using own widget configuration panel.
Workspaces templates
Templates are preconfigured dashboards designed to display relevant information about an entity: device, asset, subscriber, subscription, and tickets.
Here you can find all the preconfigured templates for your account in every workspaces.
Creating a Template
By clicking in the Actions Menu -> Create new template template wizard will be opened to configure your template:
Dashboard: Choose the dashboard for the template.
Workspace: Choose the workspace or workspaces where the template will be saved.
Name: Choose the name for the template.
Priority: Choose the priority for displaying different templates if you configure more than one for the same conditions.
Conditions
Allowed resource type: Choose the type of resource it will open.
Specific type: Choose the specific type or specific types of resource.
You can filter, delete and modify the templates configured for a workspace.
Custom Wizards
Here you can configure custom wizards for creating and provisioning new resources. The list of custom wizards allows you to have an overview of what has been created.
How it works
The custom wizard listing displays the created wizards along with the following information:
Wizard type: The type of the wizard and grouper in the wizard list.
Icon: Icon used to represent the wizard in the wizard list.
Identifier: The identifier of the wizard. Useful for APIs to reference the wizard.
Title: The title of the wizard.
Specific Type: The specific type of the wizard.
Actions on the wizard
For each item in the listing, you can perform the following actions:
Edit opens the wizard’s configuration for modification.
Delete removes the selected wizard.
Execute allows you to execute the wizard and see the results (real execution, not a test).
Wizard types
Currently there are 3 types of wizards:
Provision wizard: Wizard for creating and provisioning new resources as Devices, Assets, Tickets and so on.
Advanced wizard: With this wizard you can create a full customized wizard using VanJS code and you have full control over the wizard interface and logic. This kind of wizard is an option in the Provision Wizard by selecting “Advanced” in “Type” field.
Collection wizard: Here you can create collection wizards for devices using their specific type.
Here you can edit/configure collection wizards for your organization’s website.
Collection Wizard
When editing an item from the listing, you will see the collection wizard with its previously entered data.
Provision Wizard
Here you can view/configure provision wizards for your organization’s website.
Provision Wizard
When editing an item from the listing, you will see the wizard with its previously entered data.
Administrative data step
Here you must define administrative data for the provision wizard. This data will be used to identify the wizard in the system and the kind of resource that will be provisioned with this wizard.
Identifier: Identifies the wizard in the system. Useful when you need to invoke the wizard programmatically.
Title: Title of the wizard. This will be the visible part of the wizard in the system.
Icon: Icon of the wizard. This will be the visible part of the wizard in the system.
Wizard Type: Type of the wizard. This will be the visible part of the wizard in the system.
Specific Type: Specific type of the wizard. This will be the visible part of the wizard in the system.
Fields (tabs) step
Here you can define tabs and fields for the provision wizard. Each tab will be a tab in the wizard and each field will be a field in the tab.
You will find the following type of tabs/steps:
Default tabs: Tabs with predefined fields for the selected resource type (Only when not an Advanced Wizard)
Custom tabs: Tabs with custom fields/form for the selected resource type.
Custom tabs have their own fields:
Name: Name of the tab
Description: Description of the tab
Below you have to select how to configure the layout of the fields within this tab. You have 3 options:
Fields selection: a combo field will be displayed in final wizard with a list of all fields of this specific type. Select the fields you want to display.
Preselected fields: You can preselect some fields with default values. These fields will be displayed in final wizard with the preselected values.
Custom form: A fully customized form using vanjs will be displayed in final wizard. See Custom Form Tab for more information.
Default values step
Here you can define default values for the operation that will be executed within this custom view (Only when not an Advanced Wizard)
Previous validations step
In this step you can write a script to validate the data introduced in the previous steps before the final action is executed.
Note that in Advanced Wizards you have to perform the final action here because there is no default provision action as in other provision wizards.
The code is encapsulated in a function that receives as parameters: entityData, callback
entityData contains the data of the entity in json format. This can contain a fully flattened entity object or a simple key-value object depending on the type of wizard (provisioning or advanced).
callback is a function that must be called in order to validate the introduced data.
Callback must be called in order to validate the introduced data and has these params:
result: (boolean) determines if the execution can continue. If false, the execution will stop and the messages will be shown to the user.
messages: (array) messages to be shown in the execution log.
Example:
asyncfunction (entityData,callback) {
// YOUR CODE HERE WITHOUT FUNCTION DECLARATION
// Example of validation:
letvalidationResult=true;
letmessages= [];
if (entityData["name"] ==="") {
validationResult=false;
messages.push("Name is required");
}
callback(validationResult, messages);
}
Available utils
$api -> use it to create http petitions to OpenGate Api Rest doc
Promise -> allows easy execution of multiple promises
http -> javascript encapsulation of a useFetch (Nuxt 4) instance doc. Returns { data, error, status, refresh, clear } where data and error are reactive Refs.
Post execution step
In this step you can write a script to perform the final action of the wizard after the completion of the previous actions. If previous validations returned false this step would have never been executed.
The code is encapsulated in a function that receives as parameters: entityData, callback
entityData contains the data of the entity in json format.
callback is a function that must be called to indicate the end of the execution.
Callback must be called in order to validate the introduced data and has these params:
result: (boolean) indicates the result of the execution. If false, the execution will be marked as failed and the messages will be shown to the user.
messages: (array) messages to be shown in the execution log.
Example:
asyncfunction (entityData,callback) {
// YOUR CODE HERE WITHOUT FUNCTION DECLARATION
// Example:
letexecutionResult=true;
letmessages= [];
if (entityData["name"] ==="") {
executionResult=false;
messages.push("Name is required");
}
callback(executionResult, messages);
}
Available utils
$api -> use it to create http petitions to OpenGate Api Rest doc
Promise -> allows easy execution of multiple promises
http -> javascript encapsulation of a useFetch (Nuxt 4) instance doc. Returns { data, error, status, refresh, clear } where data and error are reactive Refs.
The code is encapsulated in a function that receives as parameters: entityData, callback
entityData contains the data of the entity in json format.
This can contain a fully flattened entity object or a simple key-value object depending on the type of wizard (provisioning or advanced).
callback is a function that must be called in order to paint the vanjs form created (useful when using promises or async code).
Function must return a vanjs element or a function that returns a vanjs element if no callback is provided.
Example:
asyncfunction (entityData, callback) {
// YOUR CODE HERE WITHOUT FUNCTION DECLARATION
const { div } =van.tags;
returndiv("Hello Form");
}
Available utils
$api -> use it to create http petitions to OpenGate Api Rest doc
Promise -> allows easy execution of multiple promises
http -> javascript encapsulation of a useFetch (Nuxt 4) instance doc. Returns { data, error, status, refresh, clear } where data and error are reactive Refs.
Functions and Variables
onDataUpdate(callback): callback to be called when data is updated from other steps. Callback receives all the data introduced in other steps as parameter.
onStepEnter(callback): callback to be called when entering the step. Use it to control when the step is entered.
setModelData(boolean[, data]): Use it to (in)validate the form and send the data to other tabs.
openWidget -> (widgetId[, entityKey, title, extraConf]) -> Opens the selected widget in a modal panel
openDashboard -> (workspaceId, dashboardId, newPage) -> Opens the selected dashboard in selected workspace
openEntityDashboard -> (entityIdentifier[, organization[user if empty], resourceType[’entity.device’ if empty] , newPage]) -> Opens the entity’s temporary dashboard
openWizard -> (wizardId[, wizardData, isEdit]) -> Opens the selected wizard in a modal panel. A list of available wizards will be available to use directly.
This example demonstrates the basics of a Custom Form Tab with VanJS:
Renders a single required field, a Sampling period selector.
Validates the selection on every change and shows an inline error message while the value is not valid.
Reports the step validity and its data to the wizard with setModelData(isValid, data), so the wizard only lets the user continue once the field is filled in.
Code
// 1. Import only the VanJS tags used below
const { div, span, strong, label, select, option, p } =van.tags;
// 2. Form state
constsamplingPeriod=van.state(0);
consterrorMessage=van.state("The sampling period cannot be 0.");
// 3. Validate the current value and report validity and data to the wizard
functionupdateValidity() {
constvalue= Number(samplingPeriod.val);
if (value===0) {
errorMessage.val="The sampling period cannot be 0.";
setModelData(false);
return;
}
errorMessage.val="";
setModelData(true, { samplingPeriod:value });
}
// 4. Invalidate the step until a valid value is selected
updateValidity();
// 5. Render the component
returndiv({ class:"pa-4 subtitle-2" },
div({ style:"margin-bottom: 2em" },
"Select how often the device must report its measurements. ",
div({ style:"margin-top: 0.5em" },
"Fields marked with ", span({ style:"color: red" }, "*"), " are mandatory." )
),
van.tags.form({ },
div({ style:"margin-bottom: 1em;" },
label({ for:"samplingPeriod", style:"display: block; font-weight: bold; margin-bottom: 0.5em;" },
"Sampling period (minutes) ", span({ style:"color: red" }, "*")
),
select({
id:"samplingPeriod",
value:samplingPeriod,
onchange: (e) => {
samplingPeriod.val=e.target.value;
updateValidity();
},
style:"padding: 0.5em; width: 100%; max-width: 200px; display: block;" },
option({ value:0 }, "0 (not set)"),
option({ value:5 }, "5"),
option({ value:15 }, "15"),
option({ value:60 }, "60")
),
p({ style:"font-size: 0.9em; margin-top: 0.5em; color: #555;" },
strong("NOTE"), ": the shorter the period, the faster the device drains its battery." )
),
() => errorMessage.val?p({ style:"color: red; font-weight: bold;" }, errorMessage.val) :null )
);
Example 2
Description
This example demonstrates how to build a Custom Form Tab with VanJS that:
Fetch data from an external API (randomuser.me) using the platform’s http utility (Nuxt 4 useFetch instance).
Automatically refresh users whenever the tab is entered or refreshed by utilizing the onStepEnter hook, without requiring a manual reload button.
Correctly build and populate the <select> dropdown elements using VanJS (...userOptions), avoiding invalid array returns from reactive binding functions.
Paint the VanJS form exclusively when refreshing/loading users by calling callback(formElement) within the refresh routine and never before.
Pass the selected user’s full name to subsequent wizard tabs using setModelData(true, { userName: ... }).
Invalidate the step (setModelData(false)) until a user is explicitly selected.
Code
// 1. Import only the VanJS tags used below
const { div, span, label, select, option, img, p } =van.tags;
// 2. Reusable inline styles
conststyles= {
container:"padding: 1rem; font-family: system-ui, -apple-system, sans-serif; color: #1e293b; max-width: 580px;",
header:"margin-bottom: 1.25rem;",
title:"font-size: 1.1rem; font-weight: 600; margin: 0 0 0.25rem 0; color: #0f172a;",
subtitle:"color: #64748b; font-size: 0.85rem; margin: 0;",
select:"width: 100%; padding: 0.5rem 0.75rem; border: 1px solid #cbd5e1; border-radius: 6px; font-size: 0.875rem; background-color: white; color: #1e293b; box-sizing: border-box;",
userCard:"margin-top: 1rem; padding: 1rem; border: 1px solid #e2e8f0; border-radius: 8px; background-color: #f8fafc; display: flex; gap: 1rem; align-items: center;",
avatar:"width: 56px; height: 56px; border-radius: 50%; border: 2px solid #3b82f6; object-fit: cover;",
userInfo:"flex: 1; min-width: 0;",
userName:"font-weight: 600; font-size: 0.95rem; color: #0f172a; margin: 0 0 0.2rem 0;",
userDetail:"font-size: 0.8rem; color: #64748b; margin: 0;",
successBadge:"display: inline-block; margin-top: 0.35rem; padding: 0.2rem 0.5rem; background-color: #dcfce7; color: #166534; font-size: 0.75rem; font-weight: 600; border-radius: 4px;",
errorText:"color: #dc2626; font-size: 0.85rem; margin-top: 0.5rem;"};
// 3. VanJS reactive state
constusersList=van.state([]);
constselectedUserId=van.state("");
constselectedUser=van.state(null);
letisFetching=false;
// 4. Invalidate the step until a user is selected
setModelData(false);
// 5. User selection handler
functiononUserSelected(uuid) {
selectedUserId.val=uuid;
constuser=usersList.val.find((u) => {
returnu.login.uuid===uuid;
});
if (user) {
selectedUser.val=user;
constfullName=`${user.name.first}${user.name.last}`;
// Store the selected name and data for the other tabs
setModelData(true, {
userName:fullName,
userEmail:user.email,
userCity:user.location?.city,
userAvatar:user.picture?.medium });
} else {
selectedUser.val=null;
setModelData(false);
}
}
// 6. Build the VanJS component with the select options already resolved
functionbuildForm() {
constuserOptions=usersList.val.map((u) => {
returnoption(
{ value:u.login.uuid },
`${u.name.first}${u.name.last} (${u.email})` );
});
returndiv({ style:styles.container },
// Header
div({ style:styles.header },
p({ style:styles.title }, "Responsible User Selection"),
p({ style:styles.subtitle },
"Fetches users from an external service to pass the selected name as a parameter to the following steps." )
),
// User selector
div(
label({ style:"display: block; font-weight: 600; font-size: 0.85rem; margin-bottom: 0.35rem; color: #334155;" },
"User ",
span({ style:"color: #dc2626;" }, "*")
),
select({
style:styles.select,
value:selectedUserId,
onchange: (e) => {
onUserSelected(e.target.value);
}
},
option({ value:"" }, "-- Select a user --"),
...userOptions )
),
// Preview card for the selected user
() => {
if (!selectedUser.val) {
returnnull;
}
constu=selectedUser.val;
constfullName=`${u.name.first}${u.name.last}`;
returndiv({ style:styles.userCard },
img({
src:u.picture?.medium||u.picture?.thumbnail,
alt:fullName,
style:styles.avatar }),
div({ style:styles.userInfo },
p({ style:styles.userName }, fullName),
p({ style:styles.userDetail }, `✉ ${u.email}`),
p({ style:styles.userDetail }, `📍 ${u.location?.city}, ${u.location?.country}`),
span({ style:styles.successBadge }, "✓ Parameter 'userName' stored for the other tabs")
)
);
}
);
}
// 7. Fetch the users and paint the component through the callback
asyncfunctionrefreshUsers() {
if (isFetching) {
return;
}
isFetching=true;
selectedUserId.val="";
selectedUser.val=null;
setModelData(false);
try {
// Request through the 'http' utility (a Nuxt 4 useFetch instance)
const { data, error } =awaithttp("https://randomuser.me/api/?results=8");
if (error&&error.value) {
thrownew Error(error.value.message||"Could not fetch the users");
}
constpayload=data&&data.value?data.value:data;
if (payload&& Array.isArray(payload.results)) {
usersList.val=payload.results;
} else {
usersList.val= [];
}
// Call the callback only once the user refresh has completed
callback(buildForm());
} catch (err) {
console.error("Error refreshing the users:", err);
consterrorView=div({ style:styles.container },
p({ style:styles.errorText }, `The users could not be loaded: ${err.message||err}`)
);
callback(errorView);
} finally {
isFetching=false;
}
}
// 8. Refresh the users automatically when the wizard tab is entered or refreshed
onStepEnter(() => {
refreshUsers();
});
Example 4
Description
This example demonstrates how to:
Fetch data from an external API (randomuser.me) using the platform’s http utility (Nuxt 4 useFetch instance).
Render an interactive data <table> with VanJS displaying user details (photo, name, email, location) with clickable, highlightable rows.
Automatically refresh users whenever the tab is entered or refreshed using the onStepEnter hook.
Paint the VanJS form exclusively when refreshing/loading users by calling callback(formElement) within the refresh routine and never before.
Pass the selected user’s full name to subsequent wizard tabs using setModelData(true, { userName: ... }).
Invalidate the step (setModelData(false)) until a user is explicitly selected.
Code
// 1. Import only the VanJS tags used below
const { div, span, table, thead, tbody, tr, th, td, img, p } =van.tags;
// 2. Reusable inline styles
conststyles= {
container:"padding: 1rem; font-family: system-ui, -apple-system, sans-serif; color: #1e293b; max-width: 680px;",
header:"margin-bottom: 1rem;",
title:"font-size: 1.1rem; font-weight: 600; margin: 0 0 0.25rem 0; color: #0f172a;",
subtitle:"color: #64748b; font-size: 0.85rem; margin: 0;",
table:"width: 100%; border-collapse: collapse; font-size: 0.85rem; margin-top: 0.75rem; border: 1px solid #e2e8f0; border-radius: 6px; overflow: hidden;",
th:"background-color: #f1f5f9; color: #475569; font-weight: 600; text-align: left; padding: 0.6rem 0.75rem; border-bottom: 1px solid #cbd5e1;",
row:"cursor: pointer; transition: background-color 0.15s ease; border-bottom: 1px solid #f1f5f9; background-color: white;",
selectedRow:"cursor: pointer; transition: background-color 0.15s ease; border-bottom: 1px solid #93c5fd; background-color: #eff6ff;",
td:"padding: 0.5rem 0.75rem; vertical-align: middle;",
tableAvatar:"width: 32px; height: 32px; border-radius: 50%; object-fit: cover; display: block;",
userCard:"margin-top: 1.25rem; padding: 1rem; border: 1px solid #bfdbfe; border-radius: 8px; background-color: #f0f9ff; display: flex; gap: 1rem; align-items: center;",
cardAvatar:"width: 52px; height: 52px; border-radius: 50%; border: 2px solid #3b82f6; object-fit: cover;",
userInfo:"flex: 1; min-width: 0;",
userName:"font-weight: 600; font-size: 0.95rem; color: #0f172a; margin: 0 0 0.2rem 0;",
userDetail:"font-size: 0.8rem; color: #64748b; margin: 0;",
successBadge:"display: inline-block; margin-top: 0.35rem; padding: 0.2rem 0.5rem; background-color: #dcfce7; color: #166534; font-size: 0.75rem; font-weight: 600; border-radius: 4px;",
errorText:"color: #dc2626; font-size: 0.85rem; margin-top: 0.5rem;"};
// 3. VanJS reactive state
constusersList=van.state([]);
constselectedUserId=van.state("");
constselectedUser=van.state(null);
letisFetching=false;
// 4. Invalidate the step until a user is selected
setModelData(false);
// 5. User selection handler, triggered by clicking a row
functiononUserSelected(uuid) {
selectedUserId.val=uuid;
constuser=usersList.val.find((u) => {
returnu.login.uuid===uuid;
});
if (user) {
selectedUser.val=user;
constfullName=`${user.name.first}${user.name.last}`;
// Store the selected name and data for the other tabs
setModelData(true, {
userName:fullName,
userEmail:user.email,
userCity:user.location?.city,
userAvatar:user.picture?.medium });
} else {
selectedUser.val=null;
setModelData(false);
}
}
// 6. Build the component with an interactive table
functionbuildForm() {
constrows=usersList.val.map((u) => {
constfullName=`${u.name.first}${u.name.last}`;
returntr({
style: () => {
if (selectedUserId.val===u.login.uuid) {
returnstyles.selectedRow;
}
returnstyles.row;
},
onclick: () => {
onUserSelected(u.login.uuid);
}
},
td({ style:styles.td },
img({
src:u.picture?.thumbnail,
alt:fullName,
style:styles.tableAvatar })
),
td({ style:styles.td }, fullName),
td({ style:styles.td }, u.email),
td({ style:styles.td }, `${u.location?.city}, ${u.location?.country}`)
);
});
returndiv({ style:styles.container },
// Header
div({ style:styles.header },
p({ style:styles.title }, "Responsible User Selection"),
p({ style:styles.subtitle },
"Click a table row to select the responsible user. Fields marked with ",
span({ style:"color: #dc2626;" }, "*"),
" are mandatory." )
),
// Users table
table({ style:styles.table },
thead(
tr(
th({ style:styles.th }, "Photo"),
th({ style:styles.th }, "Name"),
th({ style:styles.th }, "Email"),
th({ style:styles.th }, "Location")
)
),
tbody(...rows)
),
// Confirmation card for the selected user
() => {
if (!selectedUser.val) {
returnnull;
}
constu=selectedUser.val;
constfullName=`${u.name.first}${u.name.last}`;
returndiv({ style:styles.userCard },
img({
src:u.picture?.medium||u.picture?.thumbnail,
alt:fullName,
style:styles.cardAvatar }),
div({ style:styles.userInfo },
p({ style:styles.userName }, fullName),
p({ style:styles.userDetail }, `✉ ${u.email}`),
p({ style:styles.userDetail }, `📍 ${u.location?.city}, ${u.location?.country}`),
span({ style:styles.successBadge }, "✓ Parameter 'userName' stored for the other tabs")
)
);
}
);
}
// 7. Fetch the users and paint the component through the callback
asyncfunctionrefreshUsers() {
if (isFetching) {
return;
}
isFetching=true;
selectedUserId.val="";
selectedUser.val=null;
setModelData(false);
try {
// Request through the 'http' utility (a Nuxt 4 useFetch instance)
const { data, error } =awaithttp("https://randomuser.me/api/?results=8");
if (error&&error.value) {
thrownew Error(error.value.message||"Could not fetch the users");
}
constpayload=data&&data.value?data.value:data;
if (payload&& Array.isArray(payload.results)) {
usersList.val=payload.results;
} else {
usersList.val= [];
}
// Call the callback only once the user refresh has completed
callback(buildForm());
} catch (err) {
console.error("Error refreshing the users:", err);
consterrorView=div({ style:styles.container },
p({ style:styles.errorText }, `The users could not be loaded: ${err.message||err}`)
);
callback(errorView);
} finally {
isFetching=false;
}
}
// 8. Refresh the users automatically when the wizard tab is entered or refreshed
onStepEnter(() => {
refreshUsers();
});
Example 5
Description
This example demonstrates how to build a summary or review step that:
Tracks data updates across the wizard using onDataUpdate.
Avoids granular reactivity issues by repainting the entire form on demand when selecting/entering the tab via onStepEnter and callback(buildForm(currentData)).
Recursively parses objects, arrays, and primitive values into a collapsible VanJS tree structure using native <details> and <summary> elements.
Highlights different data types (strings, numbers, booleans, objects, arrays, and null/undefined) with distinct typography and colors.
Keeps the step valid using setModelData(true).
Code
// 1. Import only the VanJS tags used below
const { div, span, strong, p, details, summary, ul, li } =van.tags;
// 2. Reusable inline styles
conststyles= {
container:"padding: 1rem; font-family: system-ui, -apple-system, sans-serif; color: #1e293b; max-width: 720px;",
header:"margin-bottom: 1.25rem;",
title:"font-size: 1.1rem; font-weight: 600; margin: 0 0 0.25rem 0; color: #0f172a;",
subtitle:"color: #64748b; font-size: 0.85rem; margin: 0;",
treeBox:"background-color: #f8fafc; border: 1px solid #e2e8f0; border-radius: 8px; padding: 1rem; font-family: ui-monospace, SFMono-Regular, Menlo, Monaco, Consolas, monospace; font-size: 0.85rem; overflow-x: auto;",
details:"margin-left: 0.5rem; margin-top: 0.25rem;",
summary:"cursor: pointer; user-select: none; font-weight: 600; color: #2563eb; padding: 0.15rem 0;",
badge:"font-size: 0.75rem; color: #64748b; font-weight: normal; margin-left: 0.35rem;",
list:"list-style: none; margin: 0.2rem 0 0.2rem 0.5rem; padding-left: 0.75rem; border-left: 1px dashed #cbd5e1;",
item:"margin: 0.25rem 0;",
key:"color: #0f172a; font-weight: 600;",
strVal:"color: #166534;",
numVal:"color: #2563eb;",
boolVal:"color: #7c3aed;",
nullVal:"color: #94a3b8; font-style: italic;",
emptyText:"color: #94a3b8; font-style: italic; margin: 0;"};
// 3. Latest data accumulated by the wizard
letcurrentData=entityData|| {};
// 4. Mark the step as valid, since this is a read-only summary view
setModelData(true);
// 5. Listen for and store the updates coming from the other wizard steps
onDataUpdate((updatedData) => {
currentData=updatedData|| {};
});
// 6. Helpers to format primitive values
functionrenderPrimitive(val) {
if (val===null) {
returnspan({ style:styles.nullVal }, "null");
}
if (val===undefined) {
returnspan({ style:styles.nullVal }, "undefined");
}
if (typeofval==="string") {
returnspan({ style:styles.strVal }, `"${val}"`);
}
if (typeofval==="number") {
returnspan({ style:styles.numVal }, String(val));
}
if (typeofval==="boolean") {
returnspan({ style:styles.boolVal }, String(val));
}
returnspan(String(val));
}
// 7. Static recursive rendering as a tree
functionrenderTree(data) {
if (!data||typeofdata!=="object"|| Object.keys(data).length===0) {
returnp({ style:styles.emptyText }, "No data has been entered yet.");
}
constkeys= Object.keys(data);
constchildItems=keys.map((k) => {
constitemVal=data[k];
if (itemVal!==null&&typeofitemVal==="object") {
constisArray= Array.isArray(itemVal);
constcount= Object.keys(itemVal).length;
constbadgeLabel=isArray?`[${count} items]`:`{${count} fields}`;
returnli({ style:styles.item },
details({ style:styles.details, open:true },
summary({ style:styles.summary },
span({ style:styles.key }, k),
span({ style:styles.badge }, badgeLabel)
),
renderTree(itemVal)
)
);
}
returnli({ style:styles.item },
span({ style:styles.key }, `${k}: `),
renderPrimitive(itemVal)
);
});
returnul({ style:styles.list }, ...childItems);
}
// 8. Build the component with the current data
functionbuildForm(data) {
returndiv({ style:styles.container },
div({ style:styles.header },
p({ style:styles.title },
strong("Wizard Data Tree")
),
p({ style:styles.subtitle },
"Hierarchical structure of every parameter entered in the wizard so far." )
),
div({ style:styles.treeBox },
renderTree(data)
)
);
}
// 9. Repaint the form only when the tab is entered or selected
onStepEnter(() => {
setModelData(true);
callback(buildForm(currentData));
});
// 10. Initial paint
callback(buildForm(currentData));
Organization Files
From here, you can manage the files uploaded to the private storage of the organization.
The file listing displays information for each of the stored files.
Files are grouped into 6 categories, which help the user identify the type of files and where they can be used. These categories are as follows:
BIM/IFC files in this category contain 3D models compatible with the BIM/IFC standard and are ready to be used in the corresponding widget (will be converted into fragments files when uploaded).
FRAG fragments files for the Advanced BIM widget to create an own BIM model with no need of external sources.
SVG vector files that can be used in image widgets or any configuration that allows image import.
Image image files that can be used in image widgets or in any configuration that allows image import.
Documents any type of documentation files can be placed here, especially to be used in iframe widgets and to be displayed.
JSON plain JSON files. These files are not processed by the platform in any way.
The following information is shown in the listing:
Unique Identifier the unique identifier of the file.
Name the name of the file.
Owner the organization where this file is located.
Category indicates the category where the file is placed.
Size (KB) the size of the file in kilobytes.
Updated date and time of the last file update.
Shared displays the number of users and organizations the file is shared with.
Uploading a file
First, it is necessary to click on the “Upload File” button in the navigation bar. This will open the file selection dialog.
Here you must select the category for the file to upload. Once selected, you can enter a callback URL to be invoked once the file is uploaded. Finally, you must click on the “Click or drop file here” button to select the file to upload.
The callback URL is invoked with a POST request carrying the following body:
For each item in the listing, the following actions can be performed:
Download opens the file for downloading.
Copy to Clipboard copies the unique URL of the file for use on the platform.
Share allows viewing and sharing the script for other users to use.
Choose File to Upload allows updating the uploaded file with another. This does not affect the generated link, so the change will be reflected wherever it was being used.
Delete removes the selected file.
Navigation Bar and Filters
In the navigation bar, the following actions can be performed:
Upload File opens the file selection dialog.
Filters allows applying a filter on the listing.
You can use these filters:
Name filters by file name (like search).
Identifier filters by file identifier (like search).
Category filters by file category (list of predefined options).
List can be sorted by clicking on the column headers. Default sort is by last updated date, descending.
Scripts Formatters
From here, you can manage the formatting scripts saved by the widgets.
How it Works
The list of scripts displays the necessary information to locate where it is used and for what purpose. The following information is detailed:
Name identifier of the script
Version a number identifying the versioning
Description descriptive text of what the script does
Widget type of widget compatible with this script
Expanding the row reveals in which dashboards, and by which users, the said script is being used.
Actions on Scripts
For each item on the list, the following actions can be performed:
Share allows viewing and sharing the script for use by other users on their dashboards
Edit opens the script’s editing form for modification
Delete removes the selected script
Navigation Bar
In the navigation bar, the following actions can be performed:
Search allows applying a filter to the list
Refresh refreshes the content of the list
Web Areas & Sections
From here, you can add new areas and sections to your left panel sections menu for the organization.
How it Works
Web Sections list displays information of custom configured areas in domain.
The following information is shown in the list:
Icon representative icon for the area in menu.
Name the name displayed in menu.
Description the description for the area.
Priority the display priority for the area when displayed in menu.
Categories show total categories availables area.
Web Section Actions
For each item in the list, the following actions can be performed:
Edit opens the Areas & Sections wizard in order to manage selected option.
Delete removes the selected area and all its contents.
Navigation Bar
In the navigation bar, the following actions can be performed:
Filter allows filtering of areas by name.
Create new area opens Areas & Sections wizard in order to create a new one.
Configuring a section
When you opened the section wizard you can see the area information step.
Area Information Step
Here you can configure the next information about the area:
Identifier unique identifier for the area (autogenerated but modifiable).
Title the name displayed in menu.
Description the description for the area.
Priority the display priority for the area when displayed in menu.
Web profile manages who can view this area in menu. If no one is seleted everyone can see it.
Icon representative icon for the area in menu.
Image background image for the area in the its home page.
Categories and Sections Step
Once you complete the required fields in previous step you can continue to this step.
Here you can see current provisioned categories and sections for the area and manage categories order.
Also you can add new categories by pressing New Category or new sections for each category by pressing the conventient New section button.
Categories can be created, edited or deleted. Also you can manage sections from this panel.
Category modal
A category is the sections grouper in left menu once you opened Area menu. Every category has their own sections.
You can configure the next in a category:
Identifier unique identifier for the category (autogenerated but modifiable).
Name the name displayed in menu.
If sections available in category you can manage the display order by dragging then.
Section modal
Section represents the final menu leaf and the opened window.
You can configure the next in a section:
Identifier unique identifier for the section (autogenerated but modifiable).
Name the name displayed in menu.
Icon the icon that identify the section.
Show in home makes the sections appear at area’s home.
Web profile manages who can view this section in menu. If no one is seleted everyone can see it.
Widget is the preconfigured widget to be shown in section.
Web Permissions
Here you can view/configure new roles for your organization’s web based on OpenGate’s original profiles.
How it Works
The list of roles shows the name of the role and the OpenGate profile on which it is based.
This means that a user will have the OpenGate profile as a base, but some functionalities will be limited on the web.
Actions on Roles
For each item on the list, the following actions can be performed:
Clone allows creating a new role based on the current one
Edit opens the role’s configuration for modification
Delete removes the selected role
Navigation Bar
In the navigation bar, the following actions can be performed:
Search allows applying a filter to the list
Refresh refreshes the content of the list
New opens the form for creating a new role
New Role Form
The form for the creation/modification of roles contains the following information:
Name unique identifying value of the role
Original Profile indicates which OpenGate profile is taken as a base for this role
Lastly, there are various layers of role customization. There are 4 groups:
Visibility allows hiding/showing common elements of the menu, widgets, workspaces, and dashboards
Management groups everything related to wizards and action forms for elements on the platform
Sections from here you can manage which web sections you want to enable for the role
Views allows selecting which provisioning/collection wizards should be displayed/hidden for the role. This option will only be visible if any of these elements are configured
IMPORTANT NOTE: To make use of this new role, it will be necessary to log out and log back into the platform.
Common Elements
At the top of the form, we can find the following elements:
Search With this, you can filter the permissions to be selected, facilitating their identification
Import/Export Configuration Allows importing and exporting the wizard configuration via JSON.
Import/Export Configuration
When accessing the import and export functionality, it displays a window with various actions. Additionally, it presents the configuration of the wizard in JSON format.
The available actions are as follows:
Upload Json: Uploads a JSON file and replaces the previous JSON configuration.
Paste from clipboard: Pastes JSON data from the clipboard and replaces the previous JSON configuration.
Download Json: Downloads the JSON configuration as a file with the wizard’s name.
Copy to clipboard: Copies the JSON configuration to the clipboard.
Web Preferences
Here you can configure everything related to the web for your organization.
How it Works
Within the configuration, we can distinguish three parts:
Organization Logo where an identifying image can be uploaded that will always be displayed on the navigation bar of the website.
Themes allows the selection of the color and overall appearance of the website.
Other Configs here, specific parameters can be configured that will affect the content displayed across the website. Their use is detailed below:
Google Key enables the use of Google’s localization tools. For example, in the tracking widget, it enables route calculations for device location points.
Weather Key allows activation of weather layers in the map widget. A free key can be created at OpenWeatherMaps.
Date Formatting this allows setting the desired format for the dates displayed across the website (to the extent possible). This relies on Moment.js.
Storage Limit indicates the maximum storage available for uploading files to the organization. With sufficient permissions, this can be modified.
Navigation Bar
In the navigation bar, the following actions can be performed:
Refresh refreshes the content of the listing.
Cancel cancel changes.
Save saves the current changes so they are not lost.
Devices Emulator
The Devices Emulator website emulates data on devices that can be used with platform elements. It is necessary to create a device from the Devices Wizard beforehand. Once created, we will select the device in the Entity Key combo.
In the actions menu, the following actions can be performed:
Exact search
Case sensitive
New: Opens the device wizard
Execute operation: Opens the new operation wizard. To make this available, it is necessary to have previously selected an Entity key.
Finally, you can view the logs of the different actions performed from the icon.
The Operation tab allows you to simulate the response that the device would send to the OpenGate platform when receiving an operation, by selecting a previously created operation.
The help opens a modal window that provides information on the data structure for input and output operation variables
If you click on the copy template button, it will copy the response template.
Inside the function, you can create an input and output operation. Using the delete or save buttons, you can delete or save the emulation of that operation.
Sensors
In the Sensors tab, you can choose the device datastreams that you want to send to the OpenGate Platform, simulating the transmission that the device would perform. This message will go through the entire workflow in OpenGate.
You can delete the previously data.
System
The System tab allows you to send values from the product datastreams of the selected device to the OpenGate Platform, simulating the transmission that the device would perform. This message will go through the entire workflow in OpenGate.
You can fill in the various fields to emulate device data. If you have filled in data, you can send it using the SEND DATA button.
Analytics
On the analytics web page, you have access to the Artificial Intelligence settings of the platform along with complementary tools.
The home screen will display panels that are most commonly used, facilitating access to various settings.
The menu can be collapsed to save screen space by clicking on the bottom part of the navigation menu.
Panels
Each panel contains an embedded widget similar to those used in Workspaces & Dashboards, making the configuration and usage unified.
From each of them, you will have access to the corresponding widget’s documentation.
Sections
Within the settings, three major sections can be distinguished:
Configurations Here, we find panels related to the artificial intelligence aspect.
Others provides access to settings that may be useful and helpful.
In the navigation bar, the following actions can be performed:
Refresh refreshes the content of the list
Actions Menu displays all available actions (the same as those of the widget)
Section Configuration
From the Action Menu, you can access the configuration of the widget corresponding to the section.
Configuration opens the widget’s configuration.
Default allows resetting the configuration to its initial state.
Operation System Support
The OSS (Operation System Support) website contains pre-configured panels that can be used for operational tasks on the platform’s entities, as well as for identifying issues within them.
On the home screen, commonly used panels will be displayed, facilitating access to various configurations. Additionally, there will be two charts summarizing alarms and operations in the last 24 hours.
The menu can be collapsed to maximize screen space by clicking on the bottom part of the navigation menu.
Panels
Each panel embeds one or more widgets that are also used in Workspaces & Dashboards, thus ensuring a unified configuration and user experience.
Each page provides access to corresponding documentation, which will direct the user to the relevant widgets.
Sections
Within the configurations, three major sections can be distinguished:
Operations: This section contains information related to operations executed and planned on the platform.
Alerts and Incidents: This section holds information about platform alarms and tickets.
Entities: In this section, one can navigate through various types of entities.
Both panels are linked, so if we select an operation in the upper list, the results in the executions list will be filtered for the selected operations.
Operations Navigation Bar
In the navigation bar are the actions that can be performed:
Filter allows you to apply a filter to the list.
Refresh refreshes the content of the list.
Action Menu displays all available actions (the same as those in the widget).
Executions Navigation Bar
In the navigation bar are the actions that can be performed:
In Progress/History indicates whether to list ongoing operations or those that have been completed.
Resource Type in the case of displaying ongoing executions, you must specify whether you want them for devices, subscribers, or subscriptions.
Filter allows you to apply a filter to the list.
Refresh refreshes the content of the list.
Action Menu displays all available actions (the same as those in the widget).
Section Configuration
From the Action Menu, you can access the configuration of the widget corresponding to the section.
Configuration opens the widget’s configuration.
Default allows resetting the configuration to its initial state.
Operations Summary
From this interface, you can view a summary of the operations on devices.
IMPORTANT NOTE: To view the calendar data, at least one periodic operation must be selected from the list.
Periodic Operations Navigation Bar
In the navigation bar, you can find the actions that can be performed:
Filter allows you to apply a filter to the list.
Refresh updates the content of the list.
Action Menu displays all available actions (the same as those in the widget).
Summary Navigation Bar
In the navigation bar, you can find the actions that can be performed:
Refresh updates the content.
Action Menu displays all available actions (the same as those in the widget).
Section Configuration
From the Action Menu, you can access the configuration of the widget corresponding to the section.
Configuration opens the widget’s configuration.
Default allows resetting the configuration to its initial state.
Edge Products
Edge Products
Not every problem can be solved from the cloud. A substation in a valley with no coverage, a factory
floor whose OT segment must never route to the internet, a remote pumping station on a metered
link — all of them still need metrics, alarms and security visibility. Edge Products are the part
of the OpenGate family that runs where the assets are, does the work locally, and synchronises with
the platform only when it makes sense to.
They share three design commitments:
Offline-first. Local persistence and local decision-making. Connectivity is an optimisation,
never a prerequisite. A device that loses its uplink keeps ingesting, keeps evaluating rules and
keeps raising alarms; it reconciles when the link returns.
Self-contained deployment. Installation bundles carry their own dependencies, so a target host
can be provisioned without reaching a package mirror.
Optional platform integration. Each product is useful standalone, and becomes more useful when
registered against OpenGate — telemetry flows up, operations flow down.
Available products
Axiom Border is a lightweight network and asset monitoring probe. It ingests
metrics, raises alarms, runs security and vulnerability assessments — including OT/ICS industrial
protocols — resolves SNMP OIDs against a bundled MIB catalogue, and exposes everything through a
JWT-protected REST API and an embedded web UI. It runs fully disconnected and can optionally report
to OpenGate over HTTP or MQTT.
Axiom Border is a network and asset monitoring probe you install at the edge, close to the equipment
it watches. It is not an agent that reports to a cloud: it observes, decides and acts on its own, on
the machine, and centralising into OpenGate is something you switch on afterwards if a fleet-wide view is
useful to you.
It works fully disconnected, and it does four jobs that normally take four separate tools:
flowchart TB
A["Your network<br>servers · devices · PLCs"]:::ext --> P["<b>Axiom Border</b>"]
P --> M["Metrics<br>and alarms"]
P --> S["Security<br>assessment"]
P --> C["Web console"]
M --> OG["OpenGate<br><i>optional</i>"]:::ext
S --> OG
classDef ext fill:#e9edfa,stroke:#486ac9,color:#101010
Monitors the hosts and devices around it, collecting metrics and keeping the history locally.
Raises alarms on its own, from rules you define, with no need to reach a server first.
Assesses security — discovers assets, scans ports and services, detects vulnerabilities, queries
SNMP and observes traffic without emitting a packet. It carries its own suite of 57 industrial
protocol checks and recognises sixteen OT protocols as it listens, four of them carried directly
over Ethernet with no IP address involved. That is what sets it apart from a general-purpose scanner.
Integrates with OpenGate when you want a fleet-wide view — and keeps working exactly the same when
the link is down.
Start here
Presenting Axiom Border explains the product in seven short readings: what it is, the
loop it runs, its four probes, how passive and active analysis hand over to each other, how an event
becomes an actionable alarm, the models that run on the probe, and the security posture it deploys with.
Read that first. The rest of this section is how to operate what it describes.
What it needs to run
Axiom Border installs from a single self-contained package that carries everything it depends on, so
the target machine needs no internet access and no manual preparation.
Requirement
Operating system
Ubuntu 22.04 or 24.04, Debian 12 or 13 — 64-bit
Machine
2 CPU cores and 2 GB RAM minimum; 4 cores and 4 GB recommended
Disk
4 GB free minimum, 20 GB recommended for history
Network
Access to the network you want to monitor
Internet
Not required
It installs in one of two roles — central, the complete node, or monitoring, a remote node that
reports into a central one. Only the central role carries the metrics database and the components behind
the optional anomaly-detection feature.
Axiom Border can perform checks that write to industrial devices. This is switched off by default and
needs two separate confirmations to enable — but the responsibility for authorising it is yours. Read
OT/ICS vulnerability scanning before enabling anything against a live
plant.
The rest of this section explains how to operate the probe. This part explains what it is and
why it behaves the way it does — the seven ideas that, once you have them, make every screen in the
console read the way it was meant to.
Read it in order the first time. Each page assumes the one before it.
What the two installation paths deploy, and where each kind of data lives
Documented version
The text describes Axiom Border v1.3.1. The console captures were taken on v1.2.0, so a few
details have moved on since — most visibly the vulnerabilities table, which v1.3.1 renamed and gave a
potential-surface summary. Where a capture and the text disagree, the text describes the current
console.
Most edge monitoring works one way: a collector gathers data, ships it somewhere, and a platform decides
what it means. Take the link away and the collector is a data recorder at best.
Axiom Border is built on the opposite premise. It is not an agent that reports to a cloud. It is an
autonomous node that observes the network around it, decides what matters against rules it holds locally,
and acts on that decision — on the machine, with no server in the loop. Centralising into OpenGate is
something you switch on afterwards if a fleet-wide view is useful to you. It is never what makes the
probe work.
That single decision is why the product looks the way it does:
The decision engine is on the probe. Alarms are raised where the data is, not where the platform is.
Everything it needs travels with it. The vulnerability database, the vendor registry, the MIB
catalogue, the scan templates, the metrics store, the container runtime and the web console are all
installed with the product. A probe in an isolated network is useful the moment it starts.
Nothing is fetched at run time. There is no feed to update before a scan means anything, and no
service to call before a finding can be interpreted. What exactly it carries, where each data set comes
from and how to refresh it in the field is set out in
Catalogs: vulnerabilities, OIDs, MIBs and more.
Why this matters in an industrial network
Isolated OT segments are isolated on purpose. A tool that needs to reach the internet to stay useful is
a tool that is either useless there or a hole in the isolation. Axiom Border needs neither.
The specification, in one table
Deployment roles
central — the full node: probe, metrics store and the container runtime for the AI capability. monitoring — a remote node that reports into a central one
Installation path
A single supported path, the Keystone deployment agent, and it is 100 % offline. Roughly 5–8 minutes for a central node, 1–2 for a monitoring one
Footprint
About 141 MB for a central core package and 89 MB for a monitoring one, plus the bundled data packs, which are published once and reused across versions
Management surface
The embedded web console and a REST API, both served by the probe itself, both over HTTPS unconditionally — localhost included
Internet access
Not required, at install time or afterwards
HTTPS is not optional
There is no plaintext listener to fall back to. A probe reached over http:// refuses the connection, and
that applies to localhost as much as to anything else. On first boot the probe issues its own
certificate from a local authority, so it works with no PKI and no internet — see
Security posture for replacing it with your own.
The two roles
A single probe covers a site on its own. The roles exist for when one site is not the whole picture.
flowchart LR
M1["monitoring<br><i>remote node</i>"] --> C
M2["monitoring<br><i>remote node</i>"] --> C["<b>central</b><br>probe · metrics store<br>console · AI"]
C -.->|optional| OG["OpenGate"]:::ext
classDef ext fill:#e9edfa,stroke:#486ac9,color:#101010
A central node is a complete Axiom Border: it watches its own network, holds the history, serves the
console, and can additionally receive from monitoring nodes. A monitoring node is the light end of
the fleet — it watches the machine it runs on and reports into the central one.
The dotted arrow is the point. OpenGate sits outside the boundary, it is optional, and it starts
switched off.
How you work with it
Through the console. The probe serves its own web interface; point a browser at its address and log
in. Everything on the pages that follow is described from that interface, because that is how the probe
is meant to be operated.
A REST API exists underneath for integrating the probe with your own systems, and OpenGate drives the
probe over it. It is not the operator’s path.
The console has six views, in the order the sidebar lists them:
View
What it is for
Where it is documented
Network status
Everything discovered on the network: assets, ports, vulnerabilities, and the passive inventory behind them
Network status is the landing view, which tells you where the product thinks the centre of gravity
is: what is out there, and is it exposed.
Next:The full loop — the four stages a single observation travels through.
The Full Loop
Ingest, observe, decide, act
Everything Axiom Border does fits into four stages. They run in parallel and on their own clocks —
the numbering follows a single observation through the product, not an order of execution. What binds
them together is that all four write to the same local state, and all four can raise an alarm.
flowchart LR
I["<b>1 · INGEST</b><br>from the machines"] --> O["<b>2 · OBSERVE</b><br>from the network"]
O --> D["<b>3 · DECIDE</b><br>local rules"]
D --> A["<b>4 · ACT</b><br>alarm and notice"]
A -.->|optional| C["OpenGate"]:::ext
classDef ext fill:#e9edfa,stroke:#486ac9,color:#101010
1 · Ingest — what the machines report about themselves
Every monitored machine runs a lightweight agent that watches it from the inside and sends what it
sees. Four monitors, each answering one question:
Monitor
What it watches
SSH-Guard
Interactive sessions and login attempts against the machine
USB-Guard
Devices attached to and removed from its ports
IFACES-Guard
The state of its physical network interfaces
METRIC-Guard
The machine’s own health, and the heartbeat that proves it is still reporting
You see this stage in two views. Supervisions lists the agents reporting in, one card per monitor,
with the last event each delivered. Hosts Status turns the same data around and shows one block per
machine, with the alarms currently open against it.
2 · Observe — what the probe works out for itself
Four probes on the network, one listening and three asking, each with its own scheduler. This is the
stage that needs no cooperation from the equipment it watches, and it is covered in full on the next
page: The four probes.
Everything they find lands in Network status.
3 · Decide — rules that run on the probe
Two mechanisms, both evaluated locally against data the probe already holds:
Rules on each event, as it arrives. One rule set per probe, so a rule can react to a new host, a
newly opened port or a changed value the moment it is observed.
Periodic checks against the history. Counting occurrences over a window, and detecting the absence
of them — a node that stopped reporting is a condition you can only see by looking for silence.
Both are edited from Alerts → Rules configuration. Neither needs the uplink, which is the whole
point: a probe whose link is down still decides.
4 · Act — the alarm, and who hears about it
A raised condition becomes a coalesced alarm — one alarm with a count, not one alarm per occurrence —
which lands on the operator’s Alerts view and in the probe’s live feed, so the console’s counter moves
immediately. From event to alarm covers how that works and why it is built that way.
And then, only if you asked for it, the same alarm goes out to OpenGate.
Nothing leaves the machine by default
This is the commercially important half of the loop, so it is worth stating plainly:
The OpenGate integration is optional and starts inert. It has to be configured and enabled before a
single byte goes anywhere.
The message broker the console listens on lives on loopback. It is not exposed to the network.
All four probes write to local storage before any decision to publish exists.
A probe you install and never configure for the cloud is a probe that never talks to one. What travels
when you do enable it is the complete inventory of your network, which is exactly why the probe refuses
to start that integration over an insecure address — see Security posture.
Axiom Border looks at the network with four probes. The split that matters is not what they scan but
whether they speak: one of them observes without emitting a single packet, and three of them ask
questions and read the answers.
Probe
How it works
What it produces
When it runs
Passive analysis
Listens to the traffic reaching its capture interface. Emits nothing
Assets indexed by MAC address, which address belongs to which device, LLDP neighbours, the services actually in use, sixteen industrial protocols in play — four of which never touch IP, traffic volume per host, what kind of point the probe is plugged into, and vulnerabilities inferred from device identity
Continuously, persisting what it has learned on a configurable interval
Network discovery
Port scanning over TCP, and UDP if you ask for it
The real state of a port — open or closed — the service behind it, and an operating-system guess
On a schedule, or on demand
Vulnerability scanning
A template engine that sends the probes a check needs
Findings with their severity, the check that fired, and what it matched. Includes a purpose-built industrial suite for Modbus, IEC-104, DNP3, BACnet and OPC UA
On a schedule. The layer that writes to devices needs two separate locks released
SNMP
Queries v1, v2c or v3, using stored credential profiles
Values by symbolic name or numeric OID, and full sweeps, resolved against the bundled vendor catalogue
On a schedule, or on demand
All four feed the same Network status view, and their launch controls sit in its header:
Passive analysis opens what the listening probe has worked out, on its own terms.
Scan network launches a discovery run now.
Automatic scans opens the schedules for all of them, in the Configuration view.
Turning off the passive probe does not stop discovery
The four are independent. Switching continuous passive analysis off leaves discovery, vulnerability
scanning and SNMP populating the inventory as before — and the reverse holds too. What you lose is the
half of the picture that nothing else can produce, which the next page is
entirely about.
The contract the three active probes share
Launching a scan does not block. The three asking probes behave identically here, and knowing the
contract is what lets you tell “still working” from “gave up”:
The request is accepted immediately and comes back with an identifier for that run.
The run reports one of three states: in progress, failed, or finished successfully.
Only one discovery run happens at a time. Asking for a second one while the first is going is
refused, unless you explicitly force it — which cancels the running one and marks it as failed rather
than pretending it finished.
The Network status header shows the state of the most recent run, so the view always says whether what
you are looking at is current or still being assembled.
A scan interrupted by a restart does not hang forever
If the probe restarts while a scan is running — a reboot, a service restart, a power cut — that run can
never finish, because the process that owned it is gone. On start-up, every execution still marked as
in progress is moved to failed.
The practical consequence: a run that shows as in progress is genuinely in progress. It is not a ghost
left over from last week, and you do not have to guess which it is.
What each probe is for, in practice
Reach for network discovery to answer what is listening here, right now. It is the only one that
can confirm a port is genuinely open, because it is the only one that knocks.
Reach for vulnerability scanning once discovery has given it a baseline to work from. Its
industrial suite is what separates this from a general-purpose scanner, and its write-capable checks
are switched off behind two locks — read
OT/ICS vulnerability scanning before enabling anything against
a live plant.
Reach for SNMP when you want the device’s own account of itself. Symbolic names work without
internet access because the vendor catalogue ships with the product.
Passive analysis you do not reach for. It is always running, and it is the one that works when the
other three cannot.
Next:Passive and active — why these are two kinds of claim, not two views of
the same data.
Passive and Active
Two kinds of claim, not two views
This is the piece that gets misread most often, so it is worth saying whole. Passive and active analysis
are not two windows onto the same inventory. They produce different kinds of statement about the
network, and the product is built so that neither one can quietly erase the other.
The console says so on the face of it. In the vulnerabilities table on Network status, every finding
carries an Origin:
Origin
What it means
probe
The request was sent and the target answered. Demonstrated.
inferred
Derived from the device’s identity, with no traffic emitted. It is not proof — verify before acting.
An inferred finding also carries how complete the identity behind it was, and that completeness decides
what the probe is allowed to claim: the exact version licenses a plain affected; vendor and
product with no version is potentially affected, verify; and the vendor alone pins no CVE to the
host at all, so it is reported as a potential surface to go and confirm. The probe never hands you a
conclusion without telling you what it rests on.
Five things worth knowing
1. The passive probe decides whether an active scan means anything
The correct way to install a probe in an industrial network is on a mirror port or a TAP: it receives
everything and cannot be answered. On such a port an active scan returns nothing — and that nothing means
“nobody can reply to me from here”, not “there is nothing here”.
So classifying the connection point is the first thing the passive probe does, and the console leads with
the verdict. Open Notices on Network status:
The probe listens on a mirror port, so it receives traffic addressed to other devices. Bear that in mind
when reading an active scan: a host that does not answer may simply be unable to answer from here,
rather than absent.
Without that line, half a day goes into working out why the discovery scan cannot find a network that is
plainly there.
2. They discover along different axes
The passive probe indexes by MAC address. The active probes index by IP address. That is not a
detail of bookkeeping — it changes what each one is capable of seeing at all.
Passive analysis sees equipment with no IP address of its own: a fieldbus device, an unmanaged
switch, a protection relay publishing multicast. None of these will ever produce a row in an active
scan, however long you run it.
Active scanning sees ports nobody happens to be using right now. A service that is listening but
idle emits nothing to listen to, so passive analysis cannot know it is there.
Neither set contains the other. In the capture below the passive inventory holds 16 devices where the
address-indexed table on the same probe holds 12, and the coverage note explains the gap in the probe’s
own words:
Note the closing caveat there, which is the honest limit of the technique: passive analysis only sees
what talks — a silent device is not in this figure.
3. The passive probe feeds the active ones
The relationship is not merely parallel. What listening establishes is used to make the asking sharper:
An SNMP target that is not yet in the inventory gets a quick discovery pass first, so the query goes to
something known to be there.
A vulnerability scan that comes back with nothing gets a discovery pass too, for one specific reason:
to tell “unreachable” apart from “nothing wrong with it”. Those look identical in an empty
report and mean completely different things.
4. Neither origin overwrites the other
Both write into the same identity record, and neither is allowed to win by arriving last. Each leaves its
claim, its confidence and the evidence behind it, and the value you see is derived from all of them.
You can read this directly in the console. A manufacturer is shown with a confidence score and the source
that produced it — the vendor registry installed on the probe, the device’s own declaration over its
maker’s discovery protocol, or an active scan’s own table — each with its caveat attached. A registry
entry names the network card; a device declaring itself names the device. Those are not the same
claim, and the console does not pretend they are.
So when the active scan says Schneider Electric where the registry said Moxa, that disagreement is
kept as data rather than resolved in silence. Nearly always it is telling you something true and
useful: a network card from one vendor inside another vendor’s cabinet.
“Undecided” is a result, not a gap
A device the passive probe analysed without any rule matching is labelled undecided, and one written
before passive analysis was available is labelled not analysed. They are shown differently on purpose:
the first is a conclusion, the second is an absence of one. Neither is a failure, and neither is
presented as an unknown you should chase.
5. An active scan does not close a passive inference
The one to hold on to.
A passive inference is not the outcome of a test. It is a statement about what a device is, drawn from
how it behaves on the wire. An active scan failing to reproduce it does not refute it — the scan may not
have looked for it, may not have been able to reach it, or may have been reading a mirror port where
nothing can answer in the first place.
“I did not find it” is not “it is gone.” So a scan that comes back quiet leaves existing passive
findings standing, and the console keeps showing them with their origin and their confidence. If you want
one retracted, retract it deliberately — do not let an empty scan do it for you.
What it understands on the wire
Listening is only worth as much as what the probe can make sense of. It reads industrial traffic at two
levels, and the second is the one a general-purpose scanner does not have at all.
Over IP — thirteen industrial protocols
Recognised from the conversation itself, which means the probe also records which side is serving and
which is asking. That distinction is half the value: a station polling a controller and the controller
answering are very different things to find on a segment.
Protocol
Port
Protocol
Port
Modbus/TCP
502
BACnet/IP
47808/udp
S7comm
102
EtherNet/IP
44818 · 2222/udp
OPC UA
4840
PTP
319–320/udp
DNP3
20000
HART-IP
5094/udp
IEC 60870-5-104
2404
KNXnet/IP
3671/udp
CODESYS
1200
FINS
9600/udp
MELSEC
5007
Four of those — CODESYS, MELSEC, KNXnet/IP and FINS — sit on ports their vendors use by convention
rather than by registration, which someone else is entitled to use for something unrelated. They are
still reported, because leaving a controller untyped merely because its maker never registered a port is
the more expensive mistake. They are simply published at a lower confidence, visible to you in the
console, so weaker evidence never passes for strong evidence.
Directly over Ethernet — where there is no IP to work with
The traffic that matters most in a substation or on a production line often has no IP layer at all.
Nothing that keys off addresses and ports can describe it. Axiom Border reads it natively:
Protocol
What it establishes
IEC 61850 GOOSE
The protection and control messaging between relays
IEC 61850 Sampled Values
The measurement stream feeding those relays
PTP / IEEE 1588
Who the network’s grandmaster clock is — the time source the protection equipment trusts, where an unexpected one is a finding in itself
PROFINET DCP
Devices announcing and being addressed on a PROFINET segment
PTP appears in both lists because it is genuinely spoken both ways, so the two tiers together come to
sixteen distinct protocols, not seventeen.
Without these, a probe on such a segment could report a busy cable and nothing more. Traffic carried
inside stacked VLAN tags is followed through the tags rather than measured from a fixed offset, so a
QinQ segment reads correctly instead of producing confidently wrong values.
What it will not guess
The probe names a device’s role only where the evidence supports it — a Modbus server, a DNP3
outstation, an IEC-104 controlling station, a GOOSE publisher, a PTP node. It deliberately stops short of
labelling something a PLC, an RTU or an HMI from traffic alone, because that is a claim about
the device’s function that the wire does not actually establish. An honest protocol role beats a
plausible-sounding guess.
Side by side
Active scanning
Passive analysis
Footprint on the network
Emits. Against a PLC, an aggressive scan is a genuine operational risk
Zero packets. Nothing a control device could misread
Identity is based on
The IP address
The MAC address, which survives a change of addressing
Equipment with no IP
Invisible
Inventoried
On a mirror port or TAP
No reply means no results
Works normally — and says why the active scan came back empty
Topology
Does not see it
Neighbours with their chassis and port, gateway verdict, address conflicts
Services
The real state of the port, confirmed
The services actually in use, and which side is serving
Traffic volume
—
Counters per host, and the breakdown behind them
Industrial protocols
The five the OT suite tests against
Thirteen over IP, plus four that never touch IP at all
Industrial posture
What the templates test for
What the equipment declares about itself as it operates
They are complementary, and the product treats them that way. Use the active probes to confirm; use the
passive one to know what is worth confirming, and to see the part of the network the active ones cannot
reach.
Three different things can raise an alarm on an Axiom Border probe:
A periodic check counting occurrences of an event over a window and finding too many.
A dead-machine check finding a node that has gone silent — alarming on absence, which is the only
way to catch a node that stopped reporting rather than one reporting something bad.
A rule deciding, in code, that what it just saw is worth an alarm.
All three arrive at the same gate, and what that gate does is the single most operationally significant
thing in this part of the product.
Coalescing by identity
Two alarms that say the same thing about the same device are the same alarm. When a condition trips
repeatedly, the probe does not create a new alarm each time. It recognises the identity of the alarm —
which agent, which device, which name and type, which severity, which underlying description — and folds
the repeat into the alarm that is already open. What changes are its fields:
Field
Meaning
First seen
When the condition first held
Last seen
The most recent time it fired
Count
How many times it has fired
This pays twice over, and the two payoffs are worth separating because they matter to different people.
For the operator. A brute-force attempt that trips a threshold every five minutes for an hour is
one thing happening, and it should read as one row with a count of twelve. Twelve identical rows are
not twelve times the information — they are the same information, twelve times, pushing everything else
off the screen. An alert repeated a thousand times is an alert, not a thousand alerts.
For the probe. Every distinct alarm is a distinct series in the history. Minting a fresh identity per
occurrence makes that history grow without bound and slows every query made against it. Coalescing keeps
the history of a busy probe queryable months later.
One row with a count is the signal, not a summary
When you see a count of 40 on an alarm, the probe is not telling you it collapsed 40 alarms to save room.
It is telling you the condition has held 40 times since it first fired, and it is still open. The count
is the severity information.
Acknowledging is not silencing
ACK on the Alerts view marks an alarm as seen, which closes the coalescing window on it.
The consequence is deliberate: the next occurrence after an acknowledgement opens a fresh alarm. It
does not silently add one to a count on something you already dealt with. If the condition comes back, you
get told again.
Two tabs sit above the table. Recent reads the probe’s live feed — the alarms it already holds in
memory, answered instantly. Range queries a window of history instead, which is what you want when
reconstructing an incident after the fact.
Open alarms survive a restart
The state of what is currently open is kept on the probe itself, not held in memory and lost on the next
service restart. A probe that reboots comes back knowing which alarms were open and which had been
acknowledged — and a quiet week does not make it forget either.
Rules that already know what changed
Rules are edited from Alerts → Rules configuration, where the declarative alarm rules sit in the upper
table and the scripted Expert System sits below with its own enable switch:
There is one rule set per probe — one for discovery, one for vulnerability scanning, one for SNMP and
one for passive analysis — and each receives that probe’s findings already enriched with what changed
since the last time the probe saw the same thing:
whether this is new,
whether the value changed,
and what the previous value was.
That is why a rule can say “this port is new” or “this value moved” without querying any history to
find out. The comparison has already been made by the time the rule runs.
Each probe reports at its own granularity — one finding per vulnerability, one per host and one per port
for discovery, one per value for SNMP, one per traffic flow and per port for passive analysis.
Rules are per probe, not across probes
A rule sees one probe’s findings. Correlating across probes — this port opened and that vulnerability
appeared — is outside what the rules engine does; each evaluation belongs to a single probe. Build that
correlation where you have the whole picture, in OpenGate.
The live feed
Every alarm is also pushed onto a small in-memory feed of the most recent events, oldest dropping off the
end. It is what the console reads to paint its counter and its Recent tab, which is why those respond
instantly however much history the probe has accumulated.
Full operating detail — creating checks, writing rules, the fields available to them — is in
Alarms and rules.
Next:AI on the probe — when the rule needs a model to decide.
AI on the Probe
Inference happens on the node
Axiom Border can detect anomalies with machine-learning models, and the important word is where: the
models run on the probe, in containers on the same machine. There is no call to an external service,
no data sent away to be scored, and no dependency on a link being up.
That follows from the same premise as everything else here. A probe that had to reach a hosted model to
decide would be a probe that stops deciding the moment the link drops — and would mean the traffic
patterns of an isolated industrial network leaving it in order to be analysed.
The images the models run from are installed with the product, so an air-gapped probe can train and infer
with nothing fetched from anywhere.
The circuit, end to end
flowchart LR
D["Agent data<br>on the probe"] --> T["Trainer<br>container"]
T --> M["Model<br>on the probe"]
R["Rule"] -->|asks| M
M -->|anomaly| R
R --> A["Alarm"]
Training. The probe exports the data it holds for one agent and hands it to that agent’s trainer
container. Retraining is scheduled rather than manual, can be cancelled while it runs, and its state is
kept — so you can tell a model that is training from one that failed to.
Inference. The rule for an agent asks the model to score what it just received. If the answer comes
back as an anomaly, the same rule raises the alarm.
And that alarm is an alarm like any other. It goes through the same coalescing gate described in
From event to alarm — same identity rules, same count, same acknowledgement behaviour. An
anomaly detected by a model is not a second class of signal with its own inbox; it lands on Alerts
beside everything else, and an operator does not need to know which mechanism produced it to act on it.
Health. A rule can also read the model’s own metrics, and the probe polls the models’ health
endpoints. This matters more than it sounds: a model that has stopped answering is then an observable
fact rather than a silence that looks exactly like “no anomalies today”.
Where you manage it
AI capabilities in the console lists the models and trainers configured on the probe:
Adding one walks a wizard: upload the trainer package, or pick one already on the probe, and choose the
agent it applies to.
Deploying, restarting, deleting and importing images are all driven from here. The rule that calls the
model is enabled in step with the capability itself, so a model you deploy is a model that gets asked.
Linux, and the central role only
The container runtime the models need is Linux-only, and only the central role installs it. A
monitoring node does not run models, and neither does a probe running natively on Windows — which is a
development scenario, not a supported production one. On such a host the AI capability simply does not
start, and the deployment controls have nothing behind them.
If you intend to use anomaly detection, deploy the probe as central on Linux.
Full operating detail — image formats, the training cycle, calling inference from a rule — is in
AI capabilities.
Next:Security posture — the probe’s own attack surface, and where each kind
of data lives.
Security Posture
The posture is deployed, not offered
Axiom Border sits inside the network it watches, which makes its own surface part of the product. What
follows is not a list of hardening options to consider. It is what the installation puts in place, on
both roles, with no decisions required from you.
Front
What is deployed
Console and API
HTTPS unconditionally, localhost included. There is no plaintext listener to fall back to
Certificate
Issued by a local authority on the probe at first boot — no external PKI, no internet. Replaceable with your own, and reloaded without dropping connections
Sessions
Token-based, signed with a key generated for that installation. Repeated failed logins from one address are throttled, and every login is written to the audit trail
Message bus
The embedded broker listens on loopback only, and its WebSocket listener is off. The console reaches it through a bridge inside the API’s own encrypted connection, using a single-use ticket that expires in seconds
Metrics ingestion
Not open to the network. The authentication step is waived only for callers inside a configured range, which defaults to loopback
Configuration
Reading the configuration back returns it with every secret redacted. Comments and formatting survive untouched
Cloud egress
Optional, and inert until configured. An insecure address stops the integration from starting at all
Why the certificate is self-issued
An air-gapped probe cannot reach a certificate authority, and requiring one before the console works
would mean either no encryption or no probe. So the probe issues its own on first boot and is usable
immediately over HTTPS.
Your browser will not recognise that authority, which is expected on first contact. If your organisation
runs its own PKI, install its certificate on the probe instead — see
Configuration.
The same applies to anything else that talks to the probe. Command-line examples throughout this
documentation pass curl -sk, where -k is what accepts the probe’s own certificate; once you have
installed a certificate your systems already trust, drop it.
Why an insecure cloud address is an error, not a warning
If you point the OpenGate integration at a plaintext address, the integration refuses to start. That
is deliberate and it is not adjustable.
What travels over that link is the complete inventory of your network — every asset, every open port,
every vulnerability found — together with the credential that authorises it. Sending that unencrypted is
not a configuration preference with a trade-off. It is a mistake, and the probe treats it as one.
Secrets are never shown back to you
The Configuration view reads and writes the probe’s settings from the browser, and it says plainly
what it does with credentials:
Each stored credential reads as redacted rather than as its value: leave it untouched to keep it, or type
a new value over it to change it. Saving rewrites the file while preserving its comments — and a save
that would quietly turn a protection off is rejected rather than accepted in silence.
Configuration is read at start-up
The banner at the top of that view is worth reading before you save: settings are read when the service
starts, so nothing saved here takes effect until the probe restarts. The console offers to do it for you
where the deployment allows.
Where each kind of data lives
Three stores, each chosen for what is asked of it:
Store
What it holds
The probe’s local state
Everything that must be exactly right and must survive a restart: alarm rules and scripts, device aliases, scan executions, SNMP credential profiles, the host and port inventory, findings, the provenance behind every identity claim, and the alarms currently open
The metrics database
Everything that is a series over time: agent metrics, the audit trail, network traffic, availability, scan metrics and alarm history
The in-memory feed
The most recent events per stream, so the console’s live counters answer instantly. Kept across restarts so a fresh probe comes back warm, and reconciled with the history in the background
The practical consequence for an operator: the console’s Recent tabs read the third one and are
instant; the Range tabs read the second and are as fast as the window you ask for. Neither is more
correct than the other — they are the same events, reached two ways.
What backing up means here
Because the three stores hold different things, a backup that covers only the metrics database keeps your
history and loses your rules, profiles and inventory. Operation and maintenance
covers what to back up and how to restore it.
That closes the tour. From here, Configuration is where you adapt a running probe
to your environment.
Configuration
Configuration
Axiom Border reads a single file, configuration.yaml, from the directory given by the
AXIOM_CONFIG_DIR environment variable (default: config). An example file,
configuration_example.yaml, is supplied alongside it — copy it rather than editing it in place, so you
always keep an untouched reference.
You will rarely edit the file by hand: the console’s Configuration view and the REST API write
this same file — see Changing the configuration below.
No hot reload — restarts are mandatory
Every field in this file requires a service restart to take effect. There are no exceptions. The
file is read once, when the service starts. If you change a value and nothing happens, you have not
restarted the service. Saving from the console on a managed deployment restarts the service for you;
everywhere else the restart is yours to run:
sudo systemctl restart axiom-border
An invalid file stops the service
If configuration.yaml is missing or is not valid YAML, Axiom Border refuses to start rather than
running with defaults. This is intentional — a monitoring probe silently running on the wrong
configuration is worse than one that will not come up. Check the log if the service does not start.
Changing the configuration
Three paths write the same file. The web console is the recommended one: it edits the settings a
running deployment actually tunes, validates them before writing, and on a managed deployment restarts
the service for you. The REST API covers automation and driving a probe without shell access. Editing
the file over a shell always works — it is just the least guarded of the three.
Open Configuration in the side menu. The view edits configuration.yaml itself, one group of
settings per tab:
Each field is labelled in plain language rather than by its YAML key — nmap: period for schedule,
vulnScan: depth for level — and the reference further down this page maps them to the keys they
write. The two notices at the top are permanent, not the result of saving: they are there to tell you
before you edit that nothing applies until the service restarts, and that the file holds credentials
which are preserved for you.
Tab
What it edits
Automatic scans
The securityProbes switches and intervals: enable and schedule for nmap, vulnScan and snmp; the vulnerability scan’s level, severity and OT switches; the sniffing block, including where the probe reads its catalogues from
OpenGate
The whole opengate block — connection, collect and provision
MQTT
The whole mqtt block — the embedded broker with its WebSocket and TLS listeners, the internal publisher and the operations client
Everything else — logger, login, influxdb, apiPort, pagination and the per-probe details not
listed above, scan targets included — is changed through the API or the file.
Network status has a shortcut straight here: its Automatic scans action opens this view on the
first tab, which is where you land when a scheduled scan looks stale or too frequent.
The forms are a window onto the file, not a copy of it. Saving rewrites the whole file but preserves
everything the forms do not manage: comments, credentials, and every key outside the three tabs.
Leaving a field blank removes its key from the file, returning that setting to its unset behaviour.
Durations, ports and cron expressions are checked as you edit, and Save stays disabled while any
field holds an invalid value — an invalid document never reaches the probe.
What happens after Save depends on the deployment:
On a managed deployment, the console asks the deployment manager (Keystone) to restart
the service and waits until it reports healthy again — when the green confirmation appears, the
change is already live. The console is unresponsive for the few seconds the restart takes.
On a plain systemd installation, the file is written and an amber banner stays on screen until
you restart the service yourself: sudo systemctl restart axiom-border.
If the automatic restart fails, the write has still succeeded. Restart by hand —
keystonectl restart axiom-border, or sudo systemctl restart axiom-border — and the saved
configuration applies.
Changing apiPort or the login credential raises an explicit lockout warning: the file is written
anyway, so before restarting make sure you can reach the new port or know the new password.
GET /config returns the current YAML and PUT /config replaces it. This exists so a probe can be
configured for a customer environment without shell access to the host.
# 1. Authenticatecurl -X POST http://localhost:8083/auth/login \
-H "Content-Type: application/json"\
-d '{"username":"<user>","password":"<your-password>"}'# 2. Download the current file as a starting template (authenticated — it contains secrets)curl -H "Authorization: Bearer <jwt-token>"\
http://localhost:8083/config -o configuration.yaml
# 3. Edit it, then upload the COMPLETE filecurl -X PUT http://localhost:8083/config \
-H "Authorization: Bearer <jwt-token>"\
-H "Content-Type: application/x-yaml"\
--data-binary @configuration.yaml
# 4. Applysudo systemctl restart axiom-border
The PUT response reports what happened:
{
"restartRequired": true,
"message": "configuration written; restart axiom-border to apply",
"backup": "/opt/axiom-border/config/configuration.yaml.bak",
"warnings": ["apiPort changes 8083 -> 9083 (may affect API access after restart)"]
}
Field
Meaning
restartRequired
Always true — configuration only takes effect at startup
message
Confirmation text
backup
Path of the previous file’s backup. Omitted when there was no previous file
warnings
Present only when non-empty. Raised when apiPort or the login credentials change, because either can lock you out
Console and API end in the same validated write, with three guarantees:
Validation before writing. The document is validated exactly as at startup and checked for the
six mandatory fields. Invalid YAML or a missing field returns HTTP 400 and
nothing is written.
Atomic replacement. The file is written to a temporary file in the same directory and renamed.
Backup of the previous file, forced to 0600 because it contains secrets.
The write is a full replacement, and the backup is a single level
PUT /config expects the complete file, not a patch — fetch, edit, send back whole. The console
handles this for you and sends the full document with your edits applied.
The backup is always the same filename, configuration.yaml.bak, and it is overwritten on every
write. There is only one level of history. If you need more, copy it aside yourself before saving.
To recover from a lockout, restore that file and restart.
Where the file lives
Deployment
Path
Installed with install.sh (systemd)
/opt/axiom-border/config/configuration.yaml
Managed deployment
/var/lib/axiom-border/config/configuration.yaml — a stable path outside the per-version working directory
Overriding any field with an environment variable
Every key can be overridden from the environment by upper-casing it and replacing dots with
underscores. A .env file in the working directory is also loaded.
Configuration key
Environment variable
logger.logLevel
LOGGER_LOGLEVEL
influxdb.token
INFLUXDB_TOKEN
login.pass
LOGIN_PASS
This is the recommended way to handle secrets: keep the tokens and passwords out of the YAML file
entirely and inject them through the environment or your secret manager.
Required fields
Only six fields are validated as mandatory. If any is missing, the configuration is rejected:
Everything else is optional and has a documented default.
logger
Backend logging, to console and to size-rotated files.
Field
Type
Default
Description
directory
string
./logs
Destination directory for rotated log files
inFile
bool
true
Write to file
inConsole
bool
true
Echo to stdout
colorInConsole
bool
true
ANSI colour codes on stdout. Disable when piping to a file or to journald
logLevel
string
DEBUG
DEBUG | INFO | WARN | ERROR
processId
string
""
Process label added to every line; empty means no label
fileName
string
egprobe.log
Base log filename; rotation appends suffixes
maxSize
int (MB)
20
File size before rotation
maxBackups
int
20
Number of rotated files kept
compress
bool
true
gzip rotated backups
Tip
DEBUG is the shipped default and it is verbose enough to flood a journal on a busy probe. For
production, INFO is the sane choice.
login
The single credential that protects the whole API except /auth/login.
Field
Type
Required
Description
user
string
Yes
API username
pass
string
Yes
SHA256 hex digest of the password, not the password itself
Generate the digest before writing it:
echo -n "yourPassword" | sha256sum
At login, the probe hashes the submitted password and compares it against this value.
Change the shipped credential
The example file carries a placeholder digest so that a fresh installation can log in. It must be
replaced before the probe is reachable by anything. Treat a deployment still carrying the example
digest as unauthenticated.
influxdb
Connection to the metrics database (InfluxDB 2.x) that stores metrics, audit records, scan results and
alarms.
Field
Type
Default
Required
Description
url
string
http://127.0.0.1:8086
Yes
Metrics database endpoint
org
string
axiom
Yes
Organisation
token
string
—
Yes
Token with read/write permission on the organisation. Prefer injecting via INFLUXDB_TOKEN
buckets
[]string
see below
No
Buckets created at startup if they do not already exist
Default bucket set: network_bucket, ssh_bucket, metrics_bucket, usb_bucket, eg_alarms,
audit_logs, networktraffic, availability, scanmetrics. The four per-channel event buckets are
populated by the oda-lite collector, the rest by the probe itself — see
Metrics ingestion.
The probe starts even when the metrics database is unreachable, and every feature that depends on it
is inoperative until it recovers. This is deliberate for edge deployments where the database may be a
separate node that boots later.
alerts and audit
Block
Field
Type
Default
Description
alerts
offset
duration
10s
Tolerance window applied to the alarm evaluation query range
alerts
bucket
string
eg_alarms
Bucket where alarms are written and read
audit
bucket
string
audit_logs
Bucket for audit events: logins, configuration changes, executions
Top-level keys
Field
Type
Default
Required
Description
apiPort
string
8083
Yes
HTTP service port. Binds on 0.0.0.0
outputParquetPath
string
./
No
Destination directory for on-demand Parquet exports
dbPath
string
""
No
Local state database file. Empty resolves to ./db.dat, relative to the working directory
gojascriptsDir
string
""
No
Directory holding rule scripts. Empty resolves to resources/gojascripts
gojaTimeout
duration
8s
No, but set it
Maximum execution time for a rule script per event
Two settings worth pinning down
Always set dbPath to an absolute path in production (for example
/var/lib/axiom-border/db.dat). Deployments that use per-version working directories will otherwise
create a fresh, empty database on every upgrade and appear to have lost all state.
Always set gojaTimeout explicitly. Without a time limit, rule scripts do not run at all.
pagination
Controls the two read modes over the metrics database. Every field has a default, so the block can be
omitted entirely.
Field
Type
Default
Description
maxRecentEvents
int
1000
Number of most recent events kept per stream, which is also the cap of the /recent/* feed
rangePageSize
int
100
Default page size for range queries
rangeMaxPageSize
int
500
Maximum accepted pageSize
rangeMaterializeMaxRows
int
40000
Row threshold. Below it, the whole range is cached, which allows jumping to any page and reporting an exact total. Above it, results are delivered sequentially, page after page
rangeCacheTTL
duration
60s
Lifetime of a cached range entry
rangeCacheMaxEntries
int
8
Maximum ranges cached at the same time. Beyond it, the least recently used range is discarded
rangeExportMaxRows
int
500000
Row cap for the streaming CSV export. A range exceeding it returns HTTP 400 asking you to narrow the window
trainerDetails
HTTP client settings for the AI container. Only relevant on Linux with a container engine available —
see AI capabilities.
Field
Type
Default
Description
serviceTlsCert
string
""
Client TLS certificate towards the AI container
serviceTlsKey
string
""
Matching private key
trainerContainerName
string
trainer
Base container name. The effective name is <trainerContainerName>-<agent>
Three sub-blocks — metrics, healthCheck and predict — share the same four fields. The {port}
literal in each URL is substituted at runtime with the port of the corresponding AI agent.
Sub-block
url
timeout
retries
timeBetweenRetries
Purpose
metrics
https://127.0.0.1:{port}/api/metrics
2s
1
2s
Collect metrics from the AI container
healthCheck
https://127.0.0.1:{port}/health
2s
20
5s
Wait for container startup — 20 attempts at 5 s gives roughly 100 s of margin
predict
https://127.0.0.1:{port}/api/predict
10s
1
2s
Inference, invoked from rule scripts
Note
Use whole seconds for timeBetweenRetries; fractions of a second are not honoured.
securityProbes
Security probes run two ways: automatically on an interval (schedule), and manually from the API or
UI. Results are stored in local state and in the metrics database — scanmetrics for aggregates,
availability for up/down.
Probes ship disabled, and the first scan runs at startup
nmap, vulnScan and snmp all default to enabled: false. Enable them only after confirming their
dependencies are present on the target host, because the first scan of an enabled probe runs as soon
as the service starts, not after the schedule interval has elapsed. A probe enabled without its
dependencies — the nmap binary on PATH, a readable templates directory, a valid capture interface —
will log errors on every boot.
securityProbes.nmap
Host discovery, port scanning and optional fingerprinting. Requires the nmap binary on PATH.
Field
Type
Default
Description
enabled
bool
false
Enable the scheduled probe
schedule
duration
2h
Interval between sweeps. Zero or negative falls back to 2h
targets
[]string
["192.168.1.0/24"]
Hosts and CIDR ranges to scan
portFilter
string
""
Port list such as "22,80,443". Empty means nmap’s top 1000
udp
bool
false
Add a UDP scan. Slow
udpPorts
string
common UDP ports
UDP ports probed when udp: true
timing
string
""
T1–T5. T2 is cautious, T4 is reasonable on healthy networks
scanPorts
bool
true
When false, ping scan only (-sn)
service
bool
false
Service and version detection (-sV)
os
bool
false
OS fingerprinting (-O). Implies a SYN scan, which needs raw sockets and therefore root
timeout
duration
5m
Abort if nmap does not finish
securityProbes.vulnScan
Template-based vulnerability scanning, including the embedded OT/ICS suite. The scan engine ships
inside the product — there is no scanner binary to install.
Field
Type
Default
Description
enabled
bool
false
Enable the scheduled probe
schedule
duration
2h
Sweep interval. Also re-triggered by event, with debounce, when new hosts are recorded
severity
string (CSV)
info,low,medium,high,critical
Severity filter, given as one comma-separated string
level
string
profundo
Depth, translated to template tags — see below
templatesDir
string
""
Templates directory override for the scheduled probe
defaultTemplatesDir
string
./vulnscan-templates
Deployment-wide fallback
timeout
duration
5m
Scan cut-off. A request may override it
allowTemplateUpdates
bool
true
Whether the probe may refresh templates from the network
allowTemplateBundleUpload
bool
true
Whether an authenticated operator may upload a template set. Separate key on purpose — see below
allowIntrusive
bool
false
Master lock for OT/ICS intrusive mode
enableOT
bool
false
Add read-only OT templates to the scheduled sweep
userAgent
string
""
HTTP User-Agent for the web checks. Empty keeps a neutral, randomised browser value per request; set it only when a deployment needs a deterministic one
A level value not in the table above applies no tag filter at all, so the scan walks the entire
template tree with only the severity filter. This is rarely what anyone intends and is dramatically
slower. Check for typos.
Templates directory resolution order: the templatesDir field of the scan request, then
securityProbes.vulnScan.templatesDir, then defaultTemplatesDir, then a vulnscan-templates
directory next to the product binary. Relative paths resolve against the working directory.
allowTemplateUpdates behaviour:
true (default, including when the key is absent): best-effort refresh to the latest template
release. Being offline or having GitHub blocked does not abort the scan — local templates are
kept. An empty directory triggers a full download.
false: strict offline kill-switch. The network is never touched, even when the directory is empty.
If nothing is on disk the scan fails with a clear error.
allowTemplateBundleUpload is a different question, which is why it is a different key.allowTemplateUpdates asks may this process reach the network; this one asks may an authenticated
operator replace the template set. The deployed recipe sets the first to false — correctly, an OT
segment has no route out — so reusing it for uploads would have left the offline update path disabled
on every real deployment, which is the one scenario the product exists for. Set this to false to
freeze the templates at whatever the deployment installed; that is a posture, not the same decision as
closing egress. See Offline maintenance.
The OT suite never depends on this
The OT/ICS templates ship inside the product and the bundled set is restored after every template
update, so they survive a wipe-and-replace by the template manager and work with
allowTemplateUpdates: false on an air-gapped network. See
OT/ICS vulnerability scanning.
allowIntrusive governs the write/control layer of the OT suite over both REST and MQTT. A
request asking for intrusive mode while this is false is rejected, and the execution ends as
failed with an explicit message. The scheduled probe is never intrusive regardless of this flag.
enableOT adds the read-only ot tag to the scheduled sweep even when level would not include
it. It never enables the intrusive layer. Some older PLCs are fragile in the face of unexpected
connections; enable it only if the OT network tolerates periodic probing.
Recommended steady state for a probe on an industrial segment:
securityProbes:
vulnScan:
enabled: truelevel: "medio"enableOT: true# continuous read-only OT visibilityallowIntrusive: false# write layer bolted shutallowTemplateUpdates: false# air-gapped: never reach for the networkdefaultTemplatesDir: "/opt/axiom-border/vulnscan-templates"
securityProbes.snmp
Field
Type
Default
Description
enabled
bool
false
Enable the scheduled probe
schedule
duration
2h
Interval. Zero or negative falls back to 2h
targets
[]string
["192.168.1.0/24"]
Hosts and CIDR ranges to interrogate
mibDir
string
MIBS/JSON-FORMAT
MIB catalogue in JSON format
mib
string
synology
Default MIB when no device match is found
port
int
161
SNMP destination port
timeout
duration
2m
SNMP operation cut-off
oids
[]string
sysDescr, sysName, sysObjectID
OIDs fetched by GET
walkRoot
string
""
Root OID for the walk. Empty means sysDescr
workers
int
32
Walk parallelism. Zero or negative becomes 1
Host pre-discovery has a fixed 30 s limit
This probe uses nmap for host pre-discovery, with a fixed 30 second limit. A /24 range at T2 timing
will exhaust it. Narrow the range or raise the main nmap timing value.
With neither oids nor walkRoot set there is nothing for the probe to do.
securityProbes.sniffing
Continuous traffic capture with periodic persistence to the networktraffic bucket.
Field
Type
Default
Description
interfaces
[]string
[]
Interfaces to capture. An empty list disables sniffing — there is no separate enabled switch for this block
bpf
string
""
BPF filter. Empty captures all IPv4
promiscuous
bool
true
Put the NIC in promiscuous mode
backend
string
pcap
Capture mode. pcap is the supported value
duration
duration
10m
Default window for a manual capture
flushInterval
duration
5m
Persistence interval for continuous capture. Zero or negative becomes 1 minute
passiveVuln
bool
true in the deployed recipe
Infer vulnerabilities from the passive identity (CPE→CVE) after each window, emitting no traffic
passiveVulnDelay
duration
5s
Grace period after a flush, so the inventory settles before the inference reads it
passiveVulnRowLimit
int
30
How many CVEs a device whose product is known but version is not may list one by one. Above the cap that device shows a summary with the count and severity breakdown instead. Version-confirmed findings are never summarised. A negative value removes the cap
cveFeedDir
string
""
Directory the local CVE database is seeded from at startup, offline. Empty disables seeding
ouiFile
string
""
IEEE OUI registry (oui.csv, verbatim) laid on top of the manufacturer table compiled into the binary. Its assignments win for the prefixes it carries; everything else keeps resolving from the built-in table, so empty, absent or unreadable is the pre-existing behaviour and cannot degrade anything. Refreshed in place with POST /security/oui-overlay
This table is not exhaustive
The sniffing block has grown several fields that are not listed here yet (enabled, filterTargets,
interestNetworks, maxHostsPerFlush, snaplen). config/configuration_example.yaml is complete and
is the reference until this page catches up.
Interface naming is platform-specific and is the most common source of a probe that captures nothing:
Platform
Format
Example
Linux
Simple name
eth0, enp3s0, wlan0
macOS
BSD name
en0
Windows
Npcap NPF device path
\\Device\\NPF_{GUID}
On Windows, the friendly name (Ethernet, Wi-Fi) does not work. Discover the NPF path with
nmap --iflist and read the WINDEVICE column.
opengate
Optional cloud integration: inventory reporting (collect) and provisioning (provision). The whole
section is inert when enabled: false.
Field
Type
Default
Description
enabled
bool
false
Master switch
apiKey
string
""
Secret. Sent as the X-ApiKey header over HTTP, and used as the default MQTT password when collect.mqtt.password is empty
cron
string
*/30 * * * *
Five-field cron expression for provision and collect. Descriptors such as @hourly are accepted. Empty or invalid means the integration does not run
minPeriod
duration
30m
Throttle. If the cron interval is shorter than this, the cron is ignored and a plain ticker at minPeriod is used instead
macDiscoveryTimeout
duration
10s
Limit for resolving the local host MAC
opengate.collect
Field
Type
Default
Description
enabled
bool
false
Enable collected-data reporting
mode
string
mqtt
http or mqtt
urlTemplate
string
OpenGate south collect endpoint
URL template; {{deviceID}} is substituted
deviceId
string
""
Force a fixed device ID. Empty derives one per host from IP and MAC
sendByParts
bool
false
Split the payload into components: ports, SNMP, vulnerabilities
partSize.ports
int
100
Port rows per chunk
partSize.snmp
int
100
SNMP entries per chunk
partSize.vulnerabilities
int
100
Vulnerabilities per chunk
retryCount
int
3
Retries for the collect publish or POST
retrySleep
duration
5s
Wait between retries
mqtt.broker
string
""
OpenGate broker URL. Required for mode: mqtt; empty skips sending
mqtt.username
string
""
MQTT username
mqtt.password
string
""
Secret. Empty falls back to opengate.apiKey
mqtt.topic
string
""
Publish topic, accepts {{deviceID}}. Required for mode: mqtt
Template with {organizationName} and {provisionProcessorId} placeholders
searchUrl
string
OpenGate north bulk search endpoint
Endpoint for querying bulk status
organizationName
string
""
Target OpenGate organisation. Needed when enabled
provisionProcessorId
string
""
Provision processor ID. Needed when enabled
retryCount
int
3
Retries for the bulk file upload
retrySleep
duration
5s
Wait between retries
pollMaxAttempts
int
10
Maximum bulk result polls
pollSleep
duration
5s
Wait between polls
mqtt
Three independent blocks: broker is the MQTT broker embedded in the product, client is the internal
publisher of executions and alarms, and ops is the client that listens for OpenGate operations and
answers them.
mqtt.broker
Field
Type
Default
Description
enabled
bool
true
Start the embedded broker
host
string
0.0.0.0
TCP listener interface
port
int
1883
MQTT TCP port
username
string
""
Broker authentication. Empty username and password together allow anonymous access
password
string
""
Secret
ws.enabled
bool
true
Secondary WebSocket listener, used by the web UI
ws.host
string
0.0.0.0
Not configurable — the WebSocket listener always binds on all interfaces
ws.port
int
1888
WebSocket port
ws.path
string
/ws
WebSocket endpoint path. A leading slash is added if missing
CA used to validate clients. Needed when verify is on
tls.certFile
string
""
Server certificate. Needed when TLS is enabled
tls.keyFile
string
""
Server private key. Needed when TLS is enabled
Anonymous by default
With username and password both empty the embedded broker accepts anonymous connections. On any
network you do not fully control, set credentials and enable TLS. If you do enable TLS, supply a
complete and valid certificate set: an incomplete TLS block prevents the broker from starting at all.
mqtt.client
Field
Type
Default
Description
enabled
bool
true
Start the internal publisher
broker
string
tcp://127.0.0.1:1883
Broker URL, by default the embedded one. Empty disables the client with a warning
Auto-reconnect is always on, retrying every 5 seconds, with a 10 second initial connection timeout.
Neither is configurable.
mqtt.ops
Field
Type
Default
Description
enabled
bool
true
Start the operations listener
broker
string
tcp://127.0.0.1:1883
Broker to subscribe against
username
string
""
MQTT username
password
string
""
Secret
topicSubscribe
string
odm/operation
Incoming OpenGate operations topic
topicPublish
string
odm/response/{device-id}
Response topic; {device-id} is substituted at runtime
qos
int
1
QoS for both subscribe and publish
retain
bool
false
Retain flag on responses
If broker, topicSubscribe or topicPublish is empty, the operations module does not start.
Metrics Ingestion and Audit
Metrics ingestion and audit
Axiom Border’s data comes from two origins. The first one the probe captures by itself: the
traffic it sniffs and the scheduled scans it runs against the network around it, with no cooperation
from the equipment it watches. The second one is reported to it: every monitored machine runs an
oda-lite agent that watches the machine from the inside and sends what it sees.
flowchart TB
NET["The network around<br>the probe"]:::ext
MACH["The monitored machines<br><i>an oda-lite agent on each</i>"]:::ext
NET -->|"sniffing and<br>scheduled scans"| P["<b>Axiom Border</b>"]
MACH -->|"SSH · USB · interface<br>· health events"| P
P --> ST[("Metrics store<br><i>history and exports</i>")]
P --> LP["Live pipeline<br><i>rules · alarms · audit</i>"]
classDef ext fill:#e9edfa,stroke:#486ac9,color:#101010
Whatever the origin, the data ends in the same two places: the metrics store, which keeps the
history behind queries and exports, and the live pipeline, where rules are evaluated, alarms are
raised and the audit trail is written. This page follows that flow — the two origins first, then the
pipeline, then how to read everything back.
What the probe captures by itself
The network-facing half needs nothing installed on the monitored equipment:
Traffic capture — continuous sniffing of the configured interfaces, persisted periodically to
the networktraffic bucket. Configured under
securityProbes.sniffing.
Scheduled assessments — the discovery, vulnerability and SNMP probes run on their configured
intervals, keep the asset inventory current, and record per-scan aggregates (scanmetrics) and host
up/down state (availability).
Both are documented in Security assessment. What matters on this page is that
their results are data like any other: they land in the store, their executions are audited, and the
audit log’s agent filter accepts the probe names (network, vulns, snmp, sniff) alongside the
agent channels.
What the agents report
The host-facing half is delivered by oda-lite, a lightweight monitoring agent that ships alongside
Axiom Border as a separate component with its own release cycle — the version you have is the one your
package includes. It is the whole of the monitoring deployment role: a machine with that role runs
only the agent, reporting to a central probe. The probe’s own machine runs one too, so the central host
is watched exactly like every other node.
An agent watches four things, and each maps to a channel — the “Guards” of the console views:
Channel
In the console
What arrives
ssh
SSH-Guard
SSH activity: connections, successful and failed logins, logouts, per-session byte counters — tagged with user, ip and port
iface
IFACE-Guard
Network interfaces appearing, disappearing or changing state, with the interface name, type and MAC address
usb
USB-Guard
USB devices connected and disconnected, with device names, ID and manufacturer
metrics
METRIC-Guard
The node’s reporting-health heartbeat: ram_usage, prepared_vars and sent_vars. Its silence is what a node stopped reporting alarm keys on
Those four names are what the API calls {agentType}: they appear in the read paths
(/recent/{agentType}), in the audit log’s agent filter, and as the group routing tag on every
event.
flowchart TB
AG["oda-lite agents<br>on each machine"]:::ext
OTH["Other reporters<br><i>optional</i>"]:::ext
AG -->|":9090/agents<br>line protocol"| COL["oda-lite on the probe host<br><i>central profile</i>"]
OTH -->|":9091/metrics<br>JSON"| COL
COL -->|"one bucket<br>per channel"| ST[("Metrics store")]
COL -->|"POST /telegraf"| LP["Live pipeline<br>rules · alarms · audit"]
classDef ext fill:#e9edfa,stroke:#486ac9,color:#101010
On the probe host, oda-lite runs in its central profile: besides watching its own host, it listens
for everyone else on two ports —
Listener
Format
Who posts there
:9090/agents
InfluxDB line protocol
The oda-lite agents on the monitored machines
:9091/metrics
JSON
Other reporting processes. A metric arriving without a channel tag that carries the reporting-health fields is routed to the metrics channel automatically
Everything it receives — its own guards’ events included — goes two ways at once: each channel is
written to its bucket in the metrics store, and every event is forwarded to the probe’s live
pipeline, so rules, alarms, audit and the recent feeds see it immediately.
Two operational handles worth knowing:
The agent is a systemd service on every node: systemctl status oda-lite. Its configuration is
generated by the installer at /etc/oda-lite/oda-lite.conf — this is also where the listener ports
move if 9090 or 9091 collide with something else.
Agents buffer briefly and flush every few seconds, so an event appears in the console with at most a
few seconds of delay — instantly is the wrong expectation, but a minute is a problem.
SSH events need verbose sshd logging
The SSH monitor reads authentication logs, which means sshd must log at LogLevel VERBOSE and
rsyslog must be populating /var/log/auth.log. The installer configures both for the roles that need
them. On a host where SSH events never appear, check those two things first.
Seeing what is reporting in
Supervisions in the console lists the channels the probe is receiving data from. Each card is one
channel, with a status dot, the last event it delivered, and the nodes it is monitoring.
This is the first place to look when data is not arriving: a channel with no recent event means the
agent has either stopped, or never reached the probe. In the capture above METRIC-Guard is in
exactly that state — there is no data to display. All events opens the full history for that
channel.
The same data, turned around — Hosts Status
Supervisions answers which channels are reporting. Hosts Status answers how is each machine
doing, which is the same data indexed the other way: one block per node, a status dot per monitor, the
last event each one delivered, and the alarms currently open against that node.
The value of this view is that a problem is visible two ways at once. In the capture above the
METRIC-Guard dot is red on all three nodes, and the alarm table beside it reads Node stopped
reporting — the missing telemetry and the alarm it raised, side by side. That is the same silence the
Supervisions view shows as an empty channel, seen from the node’s point of view instead of the
channel’s.
Use Supervisions when you are asking whether a monitor is working, and Hosts Status when you
are asking whether a machine is healthy.
The live pipeline: rules, alarms and audit
Events reach the probe itself through a single door, POST /telegraf — the same endpoint the collector
forwards into.
The ingestion door is not open to the network
Reporting processes are unattended, so they cannot carry a session the way an operator does. Rather than
leaving the endpoint public, the probe waives the token only for callers inside a configured range,
which defaults to loopback. Everything else must authenticate like any other request.
Widen that range only as far as the machines that genuinely report in. Anyone who can post here can
inject measurements — and therefore trigger rules and raise alarms.
Payload format
The body is {"metrics": [...]} and every metric requires all four fields:
Field
Type
Meaning
name
string
Becomes the measurement in the store. In practice the machine ID of the reporting node
timestamp
int64
Epoch in seconds, not milliseconds
tags
map of string
Must include group, which routes the metric to a channel
fields
map
The event’s values, numeric or string
The group tag is the routing key:
group value
Channel
History bucket
SSH
ssh
ssh_bucket
USBS
usb
usb_bucket
IFACES
iface
network_bucket
METRICS
metrics
metrics_bucket
SECSCAN
Routed by the additional probe tag
scanmetrics
Beyond group, the conventional tags are eventType, ip, port and user — these are what rules
and queries filter on.
The response is 200 with an empty body, or 400 if the JSON does not parse.
A 200 does not mean the rules ran
The recent feeds are updated immediately, so a /recent/* query straight after ingestion will show the
event. Rule evaluation, auditing and alarm generation are asynchronous, so the 200 confirms acceptance,
not evaluation. If you are testing a rule, allow a moment and check the alarms feed rather than inferring
from the ingestion response.
This endpoint feeds the pipeline, not the history
POST /telegraf drives the recent feeds, the rules engine and the audit trail — it does not write
the event itself to the metrics store. History is written by the collector. An event posted directly
here can raise alarms and will show in the recent feeds, but it leaves no history and will not appear
in range queries or exports. To feed your own data in fully, post to the collector’s listeners —
:9090/agents in line protocol or :9091/metrics in JSON — and let it fan out to both places.
Reading data back
Everything up to here is visible in the console. What follows is not: pushing data in and pulling data
out are the two jobs the console does not cover, because they exist to feed something else — a
dashboard, an export, an integration. This is the part of the product where the API is the right tool
rather than a shortcut.
There are three ways to read, and choosing the right one is the difference between a responsive UI and a
slow one.
Recent feeds — for live views
These answer in microseconds, serving the most recent events the probe already holds without running a
historical query. Feed depth is capped by pagination.maxRecentEvents, default 1000.
Optional request fields: limit, uuids to filter by node, and orderBy for presentation order. Note
that orderBy only affects how the returned page is sorted — the feed always yields the most recent
events, so asc does not page backwards through history.
The warming flag is true while the feed is still being seeded after a restart. Surface it in a UI as a
loading state rather than presenting a partial feed as complete.
Three feeds exist: /recent/{agentType} for events, /recent/alarms for alarms, and /recent/auditlog
for audit entries. The audit variant takes timeOrder instead of orderBy and adds eventsId and
agent filters — the latter also accepting the probe names network, vulns, snmp and sniff.
There is no total or pages in the response. The client paginates locally over what it received.
To continue a sequential read, send only the cursor field — no from, no to, no page.
Read randomAccess before drawing a pager
When randomAccess is false, page numbers are meaningless and total is an upper bound, not a count.
A UI that renders “page 12 of 340” from that metadata will be wrong. Read meta.randomAccess on every
response and switch between a numbered pager and a “load more” control accordingly.
Pagination limits are configurable — see Configuration.
The range is mandatory here, and a range exceeding pagination.rangeExportMaxRows (default
500 000) is rejected with 400 asking you to narrow it. That guard is deliberate.
This endpoint returns 200 with an empty body — it does not return the file. It writes to a fixed
path, <outputParquetPath>/influxquery.parquet, so every call overwrites the previous one. Unlike
the CSV export, the range is optional and no row-count limit applies, so a broad query can produce a very
large export. Always pass a range on a populated bucket, and collect the file from the server before the
next call.
Other read helpers
Endpoint
Purpose
GET /lastevent/{agentType}
Latest event per device as semicolon-separated CSV. Sets X-Recent-Warming: true while the feed is still seeding
GET /uuids/{agentType}
Node UUIDs present in one channel’s bucket
GET /uuids
Map of UUID to the channels it appears in
Aliases — making UUIDs readable
Nodes are identified by machine ID, which is unreadable. An alias maps one to a name, and every read
endpoint accepts ?alias=true to perform the translation. The console displays aliases wherever it
lists nodes, but creating them is an API operation:
With ?alias=true, the uuids filter in a request body also accepts alias names, so a client can work
entirely in readable names. Note that DELETE /alias takes the alias name, as {"name": "..."}, not
the UUID.
Audit
Every significant action is audited to the audit_logs bucket. Two ways to read it:
The agent filter accepts the four channel names and the four probe names. Filtering by vulns is how you
answer “what was scanned, when, and by whom” — including the warning entry that every intrusive OT scan
generates.
Auditing follows the rule script
An agent’s or probe’s activity is audited when its rule script is enabled. Disabling a script therefore
costs you the audit records for that agent or probe as well as its rules — the events are still ingested
and stored, but they leave no audit trail.
If you need an audit trail for a particular agent, check the enabled state with GET /scripts and make
sure its script exists and is enabled, even if the script itself does nothing. See
Alarms and the rules engine.
Storage layout
Where each kind of data ends up. The four channel buckets are written by the collector; everything
else is written by the probe itself:
Buckets are created on first start if absent. Note that no retention policy is applied by default —
configure retention in InfluxDB according to your disk budget, or the metrics buckets will grow without
bound. An Influx bucket with no retention is a common cause of a probe slowly filling its disk.
Alarms and the Rules Engine
Alarms and the rules engine
Axiom Border decides locally. A probe that only forwards data is useless the moment the uplink drops,
so alarm evaluation runs on the device, against data it already holds, with no dependency on the
platform.
There are two ways to express what should raise an alarm:
Mechanism
Use it for
Defined via
Checks — declarative rules
Thresholds, event matches, dead-machine detection
/checks API
Scripts — rules written in JavaScript
Anything with logic: correlation, state, arithmetic, calls to the AI model
/scripts API
Checks cover most of what monitoring needs and need no code. Scripts exist for the cases checks cannot
express.
Where you work with alarms
Alerts in the console is the operator’s view: the alarms currently raised, the history of what has
been logged, and the Rules configuration button that opens the editor for the rules described below.
An autoreload toggle keeps the list current while you watch an incident develop.
Each row names the alarm, the check type behind it, the node it came from, the agent, the severity and a
description that includes when the condition was first seen. ACK acknowledges the selected alarm.
Two tabs sit above the table. Recent reads the live feed — the most recent alarms the probe already
holds, answered immediately. Range queries a time window from history instead, which is what you want
when reconstructing an incident after the fact:
Rules configuration opens the Alarm config screen, which is where both kinds of rule live — the
declarative alarm rules in the upper table, and the JavaScript Expert System at the bottom with its
own enable switch:
Everything on this page can be done from that screen or from the API, and both paths are shown together
wherever they differ.
Checks — declarative rules
A check watches one event type from one agent over a time window, and raises an alarm when its condition
holds.
flowchart TB
EV["Event arrives"] --> MATCH{"Matches<br>a check?"}
MATCH -->|no| DROP["Stored only"]
MATCH -->|yes| TYPE{"Check type"}
TYPE -->|count| CNT{"Count over<br>threshold?"}
TYPE -->|deadmachine| SILENT{"Silent for<br>the window?"}
CNT -->|no| WAIT["Keep counting"]
CNT -->|yes| FIRE["Raise alarm"]
SILENT -->|yes| FIRE
FIRE --> COAL{"Alarm<br>already open?"}
COAL -->|yes| INC["Increment count"]
COAL -->|no| NEW["New alarm"]
The two check types
ctype
Fires when
threshold
count
The event occurs at least threshold times within freqs
Required
deadmachine
No events arrive from the node within freqs
Not used, send 0
deadmachine is the one worth calling out: it alarms on absence, which is how you detect a node that
stopped reporting rather than a node reporting something bad.
Alarming on every occurrence
To raise an alarm whenever an event happens at all, use a count check with "threshold": 1 and a short
freqs. The first matching event trips the condition immediately.
Creating a check
From Alerts → Rules configuration, use New alarm rule. The wizard walks three steps — Rule
config, Alarm config and Summary — and collects exactly the fields described above:
Rule type is the check type, Agent and event choose what to watch, Trigger sets the window and the
count, and UUIDs selects the nodes. Only agents actually reporting in are offered, which is why a rule
cannot be created before its agent has sent data.
Every field is required on create. freqs is a duration string — 30s, 5m, 1h. level is info,
low, medium, high or critical. uuids lists the nodes the check applies to, and accepts alias names when
the request carries ?alias=true.
A worked example: catching a node that went quiet
The most valuable check is usually the one that alarms on silence. In the wizard, choose dead
machine as the rule type, pick the agent that reports the node’s health, set the window to something
comfortably longer than its reporting interval — ten minutes against a one-minute heartbeat — and select
the nodes it applies to.
There is no threshold to set: the condition is that nothing arrived. Give the alarm a name an operator
will understand at three in the morning, such as Node stopped reporting.
Managing checks
The rules table on Alerts → Rules configuration lists every check, and each row carries its own edit
and delete actions. Editing reopens the same wizard.
Three things cannot be changed after creation
Editing a check keeps its rule type, its agent and its event. To change what a check watches,
or how it evaluates, delete it and create it again. Everything else — threshold, window, severity, alarm
text, nodes, whether it is enabled — edits normally.
To pause a check without losing its definition, switch it off rather than deleting it.
Alarm coalescing
A brute-force attempt that trips a threshold every five minutes for an hour should be one alarm with
a count, not twelve identical alarms. Axiom Border coalesces repeated firings of the same rule against
the same node into a single open alarm:
Field
Meaning
firstSeen
When the condition first held
lastSeen
The most recent firing
count
How many times it has fired
The alarm stays open and accumulating until someone acknowledges it. Acknowledgement is what closes
the coalescing window — the next occurrence after an acknowledgement opens a fresh alarm, so the
operator gets a new signal rather than a silent increment on something they already dealt with.
Acknowledging
Select the alarm on the Alerts view and use ACK. It is marked as seen, with who acknowledged it
and when.
If someone else got there first, the action is refused rather than applied twice — worth knowing when
two operators are working the same incident.
Reading alarms
The two tabs above the table reach the same events by different routes:
Tab
Reads
Use it for
Recent
The probe’s live in-memory feed
Watching an incident unfold. Answers instantly, however much history the probe holds
Range
The stored history over a time window
Reconstructing what happened after the fact
Columns filter individually, and the autoreload control keeps the list current while you watch.
Each alarm carries its name and description, the check type behind it, the node and agent it came from,
its severity, when it was raised, whether it has been acknowledged, and the coalescing trio of first
seen, last seen and count.
A small tolerance window absorbs clock skew
Evaluation applies a short grace period — ten seconds by default — around each window boundary, so an
event landing milliseconds outside one is still counted. Without it, a node whose clock drifts slightly
would silently miss conditions it genuinely met.
Rule scripts
For logic that a declarative check cannot express, Axiom Border runs rule scripts written in JavaScript.
They are evaluated on the device, server-side, on events you did not trigger.
In the console these are the Expert System, edited from Alerts → Rules configuration → Edit script.
The editor opens on a working skeleton, so you can see the shape a script must have before writing one:
Note the Enable switch beside the editor on the Alarm config screen: a saved script does nothing until
it is turned on.
How scripts are organised
A script is identified by name, and the name determines when it runs. Scripts named after an agent —
ssh, iface, usb, metrics — run on events for that agent. Scripts named after a probe — network,
vulns, snmp, sniff — run on that probe’s findings. A general-purpose rulesengine script runs over
every ingested batch.
Every script has an enabled state, set with the ?enabled= query parameter when you upload it and
reported by GET /scripts. A disabled script is stored but never invoked.
The script contract
A script must define a function called process, which receives the batch of metrics:
functionprocess(metrics) {
for (vari=0; i<metrics.length; i++) {
varmetric=metrics[i];
metric.SetT0();
// your logic here
metric.SetT1();
}
}
metrics is not a real JavaScript array
Iterate it by index with .length, as above. .filter(), .map() and .forEach() are not available
and will throw. This is the single most common mistake when writing a first rule.
SetT0() and SetT1() bracket your processing and are what populate the timing fields in the audit
record. They are not required for the rule to work, but including them is the convention and it makes
slow rules visible.
Each metric exposes: GetTagByName(key), GetFieldByName(key), ExistsField(key), GetMetricName(),
GetAliasName(), GetAgentType(), GetMonitoredEvents(), GetEventValues(), GetTime(), SetT0(),
SetT1() and String().
A worked example, raising an alarm when a scan finds a risky port open:
varRISKY_PORTS= { 23:"telnet", 21:"ftp", 3389:"rdp", 445:"smb", 5900:"vnc" };
functionprocess(metrics) {
for (vari=0; i<metrics.length; i++) {
varm=metrics[i];
m.SetT0();
if (m.GetTagByName("kind") ==="port"&&m.GetFieldByName("portStatus") ==="open") {
varport=m.GetFieldByName("portNumber");
if (RISKY_PORTS[port]) {
newAlarm(m, "critical",
"Risky service "+RISKY_PORTS[port] +" exposed on port "+port,
"Risky port open", "port_discovery");
}
}
m.SetT1();
}
}
The tags and fields available per probe are documented in the header comment of each deployed script, so
read the script with GET /scripts/{scriptname} before writing rules against it.
What probe rules can react to
Probe rules react to appearances and changes: a new host, a new open port, a changed SNMP value. To
alarm on a node that stops responding, use a deadmachine check against that node’s agent data instead —
that is exactly what checks on absence are for.
Saving and enabling a script
Everything happens in the Expert System editor on the Alarm config screen: write or paste the script,
save it, and use the Enable switch beside it.
A saved script does nothing until it is enabled
Saving and enabling are two separate actions, and the most common report of “my rule never fires” is a
saved script with the switch still off. The editor shows the switch right next to it for exactly this
reason.
Scripts can also be managed through the API — /scripts lists them with their enabled state, and each
one can be read, replaced or deleted by name. That is what an automated deployment would use; from a
browser the editor is the shorter path.
Always set a script timeout
Each script invocation is bounded by gojaTimeout. Define it explicitly: without a value the limit is
zero and no script runs at all, which shows up as missing alarms rather than as an error. The shipped
value is 8s.
gojaTimeout: "8s"
Scripts can call the AI model
A script can invoke inference against a deployed AI capability, using the predict endpoint configured
under trainerDetails.predict. This is what connects anomaly detection to alarm generation: the model
scores an event, and the script decides whether that score warrants an alarm.
Timeouts and retries for that call come from trainerDetails.predict — default 10 s, one retry. Note
that the call is bounded by gojaTimeout as well, so a predict timeout longer than the script timeout
cannot complete. Keep gojaTimeout comfortably above the predict timeout if your rules use inference.
See AI capabilities for deploying a model in the first place.
Security probe results reach the rules engine too
Security probe findings are evaluated by the rules engine and audited exactly like agent metrics. A scan
finding can therefore raise an alarm the same way a metric can — a newly discovered host, a critical
vulnerability, a port that opened when it should not have. See Security probes.
Choosing between a check and a script
Reach for a check when the condition is “this event, this many times, this window”. It is
declarative, visible in the API, and cannot fail in interesting ways.
Reach for a script when you need to remember something between events, combine two signals,
compute a value, or ask the model. The cost is that scripts are code: they need a timeout that works,
they fail in ways checks do not, and they are harder to audit at a glance.
If a check can express it, use the check.
Where alarms go next
Locally, alarms land in eg_alarms and surface through the feeds above and in the web console.
If OpenGate integration is enabled, alarms and executions also publish over the embedded MQTT broker and
are forwarded to the platform, which is how a fleet of probes becomes a single operational picture. See
MQTT and OpenGate operations.
Security Probes
Security probes
Axiom Border assesses the network it sits on with four probes. They share one execution model, one audit
trail and one accumulated view of results, so the findings of each one reinforce the others instead of
living in separate reports.
Probe
What it answers
Requires
Network discovery
What is out there, and what is it listening on?
Nothing beyond a target range
Vulnerability scanning
Which of those services are vulnerable?
Nothing — the checks ship with the product
SNMP
What does the device say about itself?
A reachable SNMP agent and credentials
Passive analysis
What is actually crossing the wire?
A capture interface
Each runs two ways: automatically on a schedule you configure, and manually from the console when
you want an answer now.
Network discovery establishes the baseline for the two probes that ask questions, and that ordering
matters: a vulnerability scan with no explicit target scans every host in the baseline, so discovery must
have run for it to have anything to do. Newly discovered hosts also trigger a vulnerability scan on their
own, grouped together after a short delay, so new assets get assessed without waiting for the next
scheduled sweep.
Passive analysis stands apart — it needs no baseline, because it is not asking anyone anything. See
Passive and active for why the two must not be read as the same kind
of result.
Network status — where all of it lands
The header names the last assessment that ran and how it finished, so you can tell at a glance whether
what you are looking at is current. Three buttons launch and configure the probes:
Button
What it does
Scan network
Runs a discovery scan now, against a target you choose
Passive analysis
Opens what the listening probe has worked out, with its evidence
Automatic scans
Jumps to the schedules for all of them, in Configuration
Each host row carries its own actions — Ports, Vulnerabilities and SNMP — each opening that
host’s detail and each able to re-scan just that host, so you can reassess one asset without sweeping the
whole range.
Network discovery and port scanning
Scan network opens the launch dialog. Every option the probe supports is here, so there is no reason
to drop to the API for a scan:
Field
What to know
Target
Whole network uses the configured range; Custom IP scans a single address
Ports
Leave empty and it scans all 65,535 per host. On a /24 at cautious timing, that is a long scan — narrow it
Timing
Five presets from cautious to flat out, each with a one-line description of what it trades away
Timeout
Raise it whenever you widen the target or the port range
Scan ports · UDP · Service detection · OS detection
UDP is slow — restrict the port list rather than sweeping. OS detection needs the probe to run privileged
A port list worth copying for industrial networks
1-1024,502,2404,20000,47808 covers the common IT range plus the Modbus, IEC-104, DNP3 and BACnet ports,
so industrial assets show up in the baseline the vulnerability probe later works from.
One discovery scan at a time
Launching a second while one is running is refused. Forcing it cancels the running scan and marks it
failed with the reason, rather than letting it look as though it completed.
What discovery gives you per host
A host’s Ports panel lists what it is listening on, with the service the scan identified and when
each port was first and last seen:
The first-seen and last-seen pair is what makes this more than a snapshot: a port with a recent first
seen is new, and that is usually the thing worth acting on. The panel re-scans just this host, so
you can confirm a change without sweeping the range again.
Scheduled discovery is configured under Configuration → Automatic scans, in the nmap block.
Vulnerability scanning
Two distinct halves. The generic half uses the bundled upstream template set. The OT/ICS half
uses Axiom Border’s own suite of 57 industrial protocol checks, which travel inside the product and work
with no internet access. Both are covered in
Catalogs: vulnerabilities, OIDs, MIBs and more.
Open a host’s Vulnerabilities panel and use Re-scan IP address vulnerabilities:
Depth is the setting that matters most, and the dialog explains each option as you select it:
Depth
What runs
Light
Technology detection and TLS only. Checks no CVEs
Medium
Adds known CVEs, misconfigurations and default credentials
Deep
All of the above, plus exposures, network services and the OT/ICS suite
OT/ICS (industrial)
The industrial suite on its own — Modbus, IEC-104, DNP3, BACnet, OPC UA
Selection is by check family rather than by folder, so it does not depend on how the template set is laid
out on disk.
Severity toggles which findings are reported at all, and Intrusive mode (OT/ICS) is the switch
that adds checks which write to the device rather than only reading it.
Intrusive mode needs two locks released, not one
The switch in this dialog is only one of two locks. The probe must also be configured to permit intrusive
scanning at all, and that setting is off on every installation.
With it off, the scan is not quietly downgraded to a read-only run — it is accepted and then ends as
failed, and nothing is scanned at all. That matters more than it sounds: a request for intrusive mode
you were not authorised to make does not come back as a clean read-only report, it comes back as no
report.
The Network status header names the reason, so you are not left looking at a scan that did nothing
and said nothing. It is recorded with the execution and in the service log as well.
Name says what was confirmed — Modbus/TCP Diagnostics Function Exposed Without Authentication — and
Description explains how it was confirmed and why it matters. CVE is empty whenever the finding is
an exposure rather than a published vulnerability, so Template ID is the stable way to refer to one.
Origin is the column to read first: probe means the request was sent and the target answered, while
inferred means it was derived from the device’s identity with no traffic emitted — a lead to verify,
not a demonstrated fact. Confidence qualifies it further, and where an inference has evidence behind
it, the Evidence toggle in that column opens it.
Checks from the write/control layer are marked twice over: the name ends in [INTRUSIVE] and the
description opens with INTRUSIVE / GATED.
Detected, and what is merely potential
The table is titled Detected vulnerabilities, and the word is doing real work. It holds what was
confirmed by an active scan, plus inferences where the product was actually identified. What it does
not hold is the surface attributable to a device known only down to its manufacturer — that would be
hundreds of rows the probe cannot stand behind, burying the findings you can act on.
That surface is not discarded. It is summarised above the table, as a count with its severity breakdown
and a recommendation to scan the host actively.
An amber Vulnerabilities button means look inside
On Network status, a host whose potential surface is being summarised rather than listed shows its
Vulnerabilities row action in amber. Without that cue a host with a hundred unconfirmed CVEs
behind it reads exactly like a clean one from the collapsed row — which is the one thing an assessment
tool must never do.
There is a cap on how many unconfirmed CVEs a single device lists individually before it switches to a
summary — 30 by default. Version-confirmed findings are never summarised, however many there are.
The cap is sniffing.passiveVulnRowLimit in Configuration; a negative value removes
it and lists everything.
SNMP — interrogation and profiles
Open a host’s SNMP action to query it. The panel takes symbolic names as readily as numeric OIDs and
carries a Standard OIDs helper that explains the common ones in plain language, so you do not need a
MIB browser open beside you:
Results render as a table or as a tree, and the tree is the one to use after a walk. How names resolve to
numbers and back is covered in Catalogs: vulnerabilities, OIDs, MIBs and more.
Profiles instead of credentials
Rather than supplying credentials with every query, store them once as a profile and bind it to the
hosts it applies to. The console has a wizard for this, with predefined profiles to start from, reachable
from the SNMP panel’s profile selector.
Supported versions are v1, v2c and v3. For v3 the console explains the three security levels as you
choose between them — only authPriv both authenticates and encrypts, and it is the only one that
hides what is being polled rather than merely proving who is asking.
Resolution order when a scan runs: the profile named in the request, then the profile bound to that host,
then the configured default. A target that resolves to no profile is skipped, and the execution says so.
Prefer profiles over one-off credentials
Credentials passed inline with a single query are persisted with that execution record and appear in its
detail afterwards. Profiles keep them out of execution history entirely. Use inline credentials for
one-off diagnostics only.
Note
The scheduled SNMP probe runs a discovery pass first, with a fixed budget. A /24 at cautious timing will
exhaust it, so narrow the range or raise the discovery timing value in Configuration.
Passive analysis
The one probe you do not launch. It listens continuously on its capture interface and emits nothing,
building an inventory indexed by MAC address alongside the address-indexed one the active probes fill.
Passive analysis on the Network status header opens what it has established:
Three tabs: the per-device Inventory with vendor, type, role and the confidence behind each, the
LLDP neighbours it has overheard, and Findings such as the capture-point verdict, gateway
identification and address conflicts.
The type and role columns are where the industrial coverage shows. The probe recognises thirteen
industrial protocols carried over IP — Modbus, S7comm, OPC UA, DNP3, IEC-104, EtherNet/IP, BACnet,
CODESYS, MELSEC, PTP, HART-IP, KNXnet/IP and FINS — and records which side is serving and which is
asking. It also reads four protocols that travel directly over Ethernet with no IP layer at all:
IEC 61850 GOOSE and Sampled Values, PTP/IEEE 1588, and PROFINET DCP. On a substation or production
segment those are frequently the bulk of the traffic, and nothing that keys off addresses and ports can
describe them. See Passive and active
for the full picture, including which ports are vendor convention rather than registered and are
therefore reported at lower confidence.
The neighbours tab is LLDP only. The probe sees and counts Cisco’s own discovery frames, but it does
not derive neighbours from them — so a segment of Cisco equipment speaking CDP rather than LLDP produces
traffic the probe accounts for and a neighbour table that stays empty. That is a limitation, not a fault
to chase. The coverage note above the table states plainly what the figure
leaves out — passive analysis only sees what talks, so a silent device is not counted.
Everything about it is configured under Configuration → Automatic scans, in the sniffing block:
which interfaces to capture on, an optional capture filter, which observed addresses reach the host
inventory, how often what it learns is persisted, and whether it infers vulnerabilities from identity.
The interface name is the usual culprit
Capture failing silently almost always comes down to the interface name, which must be the one the
capture library uses: eth0 or enp3s0 on Linux, en0 on macOS. The friendly name from the operating
system’s own network settings does not work.
The Notices panel on Network status reports capture conditions directly — a rejected capture filter,
or analysis stopped by an error — so check there before assuming the network is quiet.
The shared execution model
Every launch is asynchronous: the request is accepted, the work continues in the background, and the
Network status header reports the state of the most recent run as it progresses. A run ends as
finished or failed, and a run interrupted by a probe restart is moved to failed on start-up
rather than being left in progress forever.
Executions also publish over MQTT
For integrations that would rather not poll, the embedded broker publishes started, finished and failed
events for every execution. See MQTT and OpenGate operations.
The merged result view
An individual execution tells you what one probe found. The Network status table tells you what is
known about a host, merged across all four probes: address and hostname, MAC address, manufacturer
and device type with their provenance, operating system, status, when it was first and last seen, then
the per-probe contributions — ports from discovery, findings from vulnerability scanning, values from
SNMP, and traffic counters from passive analysis.
The first-seen and last-updated pair is what turns the baseline into change detection: a host with a
recent first-seen is new to the network.
This same merged view is available through the API for dashboards and integrations, at
GET /security/results/last.
Feeding results into rules
Probe results reach the rules engine, so a finding can raise an alarm the same way a metric can — a new
host appearing, a critical vulnerability, a port opening that should not be open. See
Alarms and rules.
Generic vulnerability scanners are built for IT. Point one at an industrial segment and two things go
wrong: it probes for a web server that a PLC does not have and drops the host from the scan, and when
it does find something it has no idea what a coil or a Common Address is.
Axiom Border ships its own suite of 57 checks for five industrial protocols, written specifically
for this problem. They are installed with the product and made available to every scan
automatically, so they travel in every deployment role and work with no internet access and no
upstream template feed.
Industrial equipment is not a web application
A write to the wrong register on a live PLC has physical consequences. Axiom Border defaults to
read-only and requires two independent switches before it will send a single write frame. Read
the safety model before you enable anything, and never enable intrusive
mode without written authorisation for the segment you are testing.
Protocol coverage
Protocol
Port
Checks
Of which intrusive
Modbus/TCP
502/TCP
19
6
IEC 60870-5-104
2404/TCP
11
4
DNP3
20000/TCP
10
3
BACnet/IP
47808/UDP
10
1
OPC UA
4840/TCP
7
2
Total
—
57
16
Every check is labelled with the protocol it targets, and the ones in the write/control layer are
additionally labelled as intrusive. That intrusive label is what the safety model keys on.
What each layer detects
The suite is organised in four layers of increasing invasiveness:
flowchart TB
L2["<b>Layer 2 — Detection</b><br>Is this protocol here?<br>Identify vendor and version"]
L3["<b>Layer 3 — Exposure</b><br>Structural weaknesses reachable<br>without authentication"]
L3B["<b>Layer 3b — Recon</b><br>Read process data and object lists<br>without writing anything"]
L4["<b>Layer 4 — Intrusive</b><br>Write / control confirmation<br><i>gated behind two locks</i>"]
CVE["<b>CVE checks</b><br>Vendor-specific, only where<br>fingerprinting is reliable"]
L2 --> L3 --> L3B --> L4
L2 --> CVE
L4:::danger
classDef danger fill:#fff0ed,stroke:#ff664e,color:#101010
Detection confirms the protocol is listening and extracts identity where the protocol allows it —
Modbus device identification, DNP3 Object Group 0 device attributes, BACnet vendor identifier, OPC UA
BuildInfo software version.
Exposure reports structural problems that need no credentials to observe: Modbus and DNP3
responding to unauthenticated requests, IEC-104 accepting a station interrogation, BACnet/IP being
usable as a reflection and amplification source, OPC UA offering endpoints with None security policy
or anonymous authentication.
Recon reads real process data — Modbus holding registers via FC03, Modbus diagnostics via FC08
sub-function 0, IEC-104 counter interrogation and read commands, DNP3 event classes and class-0
integrity polls, BACnet Who-Is discovery and object enumeration. These checks read; they never write.
Intrusive confirms a write is actually possible. It is described in detail below.
CVE checks exist only for the cases where the protocol itself reveals enough to be sure: Schneider
Modicon over Modbus/UMAS, Delta enteliBUS (CVE-2019-9569) and Contemporary Controls (CVE-2025-13926)
over BACnet, plus a multi-vendor Modbus fingerprint that maps identity to known advisories.
Why some known CVEs are deliberately absent
Axiom Border only reports what it can actually confirm. Three known CVEs cannot be confirmed over the
industrial protocol itself, so no check claims to detect them: DNP3 CVE-2020-6996 (the Triangle
MicroWorks stack version is not observable over DNP3), OPC UA stack versions below 1.5.374.158 (only
the Basic128Rsa15 precondition is observable, and that is already covered by an exposure check), and
the IEC-104 device CVEs (IEC-104 carries no native device identifier). For those, use
SNMP interrogation to fingerprint the device and correlate the version
externally.
Scan depth and how OT checks get selected
Depth decides which checks run. OT checks are never included by accident — you either choose a deep
scan, choose OT explicitly, or opt in for scheduled scans:
Depth in the console
Web templates
OT read-only checks
Notes
Light
Yes
No
Unless the scheduled probe has OT checks enabled
Medium
Yes
No
Unless the scheduled probe has OT checks enabled
Deep
Yes (full)
Yes
Full web scan plus a separate OT pass
OT/ICS (industrial)
No
Yes
The industrial suite only — for dedicated OT segments
In configuration.yaml the same four depths are written ligero, medio, profundo and ot. The
console labels them Light, Medium, Deep and OT/ICS. They are the same four settings — worth knowing if
you move between the two.
Scheduled scans with OT checks enabled add the read-only OT layer to whatever depth they run at.
The OT pass runs separately, on purpose
When a scan includes OT checks, that part runs as a pass of its own that does not discard hosts
without a web server. A general-purpose scan pre-filters targets by HTTP reachability, which would drop
a PLC or RTU before a single Modbus request was ever sent. Running the OT pass separately is what makes
industrial assets visible at all.
The safety model: two locks
Intrusive checks send write or control frames. Enabling them requires two independent switches that
live in different places, so neither an operator nor a configuration mistake can unlock them alone:
Per-scan opt-in — Intrusive mode (OT/ICS) in the scan dialog, off every time you open it:
Deployment kill-switch — vulnScan: authorise intrusive mode in
Configuration → Automatic scans, which is off on every installation and has to be turned on
deliberately, by someone with access to the probe’s configuration.
If the deployment lock is closed, an intrusive scan is rejected outright, not silently downgraded.
The run is accepted and then ends as failed, and no checks execute — not even the read-only ones
the same request asked for.
So an unauthorised intrusive request gives you nothing, never a partial result you might mistake for a
clean bill of health — and the Network status header names the setting that blocked it, so the
refusal is visible where you launched the scan rather than buried in a log.
Neither lock can be bypassed — the same rule applies to scans launched by the platform as to scans
launched from the console.
The scheduled sweep is never intrusive
Whatever those two switches say, the scheduled vulnerability scan does not run write or control
checks. Intrusive mode is a deliberate, manual, per-scan act — it can never become the background
behaviour of a probe someone configured months ago and forgot.
The scheduled probe never runs the intrusive layer. Automatic periodic scans are always
read-only, whatever the configuration says. Intrusive checks only ever happen because someone asked
for one, explicitly, right now.
Every intrusive execution is audited. A WARN entry goes to the log and a notice is attached to
the details field of the execution record.
Intrusive means “no net change”, not “no writes”. The approach is read-then-write-back — read
the current value, write the same value back — or SELECT-only for command protocols, issuing the
select phase without the execute phase. Genuinely destructive actuation is excluded from the suite
entirely.
What the intrusive layer actually does, per protocol
Write-back of the read value; CROB in SELECT-only form
BACnet/IP
writeproperty-noauth
Writes present-value back verbatim, preserving the original tag encoding
OPC UA
anonymous-session, node-write-back
Establishes an anonymous session; writes a read value back
Real physical risk
“No net change” is a design goal, not a law of physics. A PLC may react to the act of being written
to — some stacks latch, some log, some fault. A SELECT without an execute leaves a control point
reserved on some IEC-104 implementations. Treat intrusive mode as an operation on live plant, because
that is what it is: schedule it, get authorisation, and have someone watching the process while it
runs.
Three ways to run it
All three start the same way: open the host’s Vulnerabilities panel and use Re-scan IP address
vulnerabilities. What changes is what you set in the dialog.
A dedicated OT segment scan, read-only
The common case — assess industrial equipment without touching a single register.
Set Depth to OT/ICS (industrial) and leave Intrusive mode off. That runs the industrial suite
on its own: detection, exposure and recon layers, all read-only. Nothing else runs, so there is no web
scanning noise against equipment that has no web interface.
A deep scan covering both IT and OT
Set Depth to Deep. That is everything — technology detection, CVEs, misconfigurations, default
credentials, exposures, network services and the OT/ICS read-only suite.
Use it on a mixed segment where industrial equipment sits alongside ordinary servers. On a pure OT
segment prefer OT/ICS, which does the same industrial work without the rest.
An intrusive confirmation scan
Only once the deployment lock has been opened, and only against equipment you are authorised to write to.
Set Depth to OT/ICS, turn Intrusive mode (OT/ICS) on, and — this is the part that matters —
run it against one host, not a subnet. Open the panel for that single asset rather than sweeping a
range.
Narrow the target before you open the second lock
A read-only sweep across a /24 is routine. An intrusive sweep across a /24 sends write and control
frames to every industrial device that answers, including ones you did not have in mind.
Intrusive runs are per-asset by discipline, not because the product forces it.
Enabling OT checks on the scheduled probe
To have the periodic automatic scan include the OT read-only layer without changing its level:
securityProbes:
vulnScan:
enabled: truelevel: "medio"enableOT: true# adds the read-only OT layer to scheduled scansallowIntrusive: false# keep the master lock closed
This is the recommended steady-state configuration for a probe sitting on an industrial segment:
continuous read-only OT visibility, with the write layer bolted shut.
Reading the results
OT findings surface through the same execution model as every other probe — poll
GET /security/executions/{uuid} for status, and read the findings from the execution record once the
status reaches finished. See Security probes for the shared asynchronous execution model.
Findings identify the protocol, the affected host and port, the check that fired, and the severity. For
fingerprint checks the extracted identity (vendor, model, firmware or software version) is part of the
finding, which is what makes the CVE correlation useful downstream.
Operational guidance
Start with level: "ot" on a narrow target. A /24 sweep of an industrial segment generates
traffic that some networks are not used to. Validate against one host, confirm the findings make
sense, then widen.
Keep allowIntrusive: false as the normal state. Open it for the duration of an authorised test
window and close it again. It is a configuration change and requires a service restart, which is a
feature here rather than an inconvenience — it makes the unlock deliberate and visible.
Expect true negatives. The multi-vendor Modbus fingerprint reports nothing when no listed vendor
is present. That is correct behaviour, not a missed detection.
Segment scans do not need internet. The OT checks are installed with the product and run offline.
If your OT network is air-gapped — and it should be — nothing about this capability degrades.
Catalogs: Vulnerabilities, OIDs, MIBs and more
What the probe knows before it is plugged in
A scanner is only as good as the data behind it, and the usual arrangement is to fetch that data on
demand: a vulnerability feed pulled at scan time, a vendor lookup resolved against a web service, a MIB
downloaded when an unknown OID turns up. Every one of those assumes a route to the internet.
Axiom Border carries all of it. Nothing is downloaded at run time — not before a scan, not during
one, not to interpret a result afterwards. A probe in an air-gapped plant resolves manufacturers, names
OIDs, and matches vulnerabilities with exactly the same coverage as one sitting in an office.
The rule that decides what is updatable
Data is updatable in the field. Decisions are not.
The IEEE registry and the CVE database are facts about the world that change without anyone here
deciding anything, so they can be refreshed on a running probe. The industrial port table and the
device-typing rules are auditable decisions, each with its evidence, and they stay compiled into the
product on purpose — so that what the probe concludes about your network is reproducible, and changes
only when the product does.
What ships, and where it comes from
Catalogue
Source
What is installed
Vulnerabilities — CVE database
The NVD, the US NIST National Vulnerability Database
13,275 unique CVEs across 218,111 vendor·product·version rows, in 20 vendor feeds
Manufacturers — IEEE registry
The IEEE, published registry of MAC address blocks
39,979 assignments, laid over the built-in table
Manufacturers — built-in table
The same IEEE registry, frozen into the product at build
38,242 prefixes. The floor that can never go missing
OIDs and MIBs
Vendor-published MIB modules, gathered from public sources
12,547 modules in the format the probe reads, plus 15,869 in ASN.1 for your own tooling
Generic vulnerability checks
The upstream nuclei-templates project, pinned to a fixed release
13,279 templates
OT/ICS vulnerability checks
Written by amplía))) for this product
57 checks — 41 read-only, 16 intrusive behind two locks
Every figure above is what the probe reports about itself. None of it needs a network to be true.
Vulnerabilities — why those 20 vendors
The vendor list is not “who makes industrial equipment”. It is which vendors the probe can actually put
a name and a version to from what it observes — a neighbour announcement, a MAC address block, or a
device declaring itself. A vendor the probe cannot identify would contribute rows that could never match
anything.
The last group is there on purpose, and it is not a category error. Neither vendor makes industrial
equipment, but both turn up in plants regardless — the NAS somebody parked the historical data on, the
router somebody plugged in. The probe identifies them by MAC address block like anything else and their
firmware carries versions, which is the only criterion this list applies.
What is in there, by severity: 1,341 critical, 4,853 high, 4,316 medium, 215 low, and 2,549 not
scored, spanning disclosures from 1999 to 2026.
The database is what turns an identity into a finding without emitting a packet, and how complete the
identity is decides what the probe is allowed to say:
What was identified
What it reports
Vendor, product and exact version
Affected — a genuine “vulnerable to this CVE”
Vendor and product, version unknown
Potentially affected, verify — never presented as the same thing
Vendor only
No CVE can be pinned to the host, so it reports the vendor’s known CVE surface as a count and severity breakdown, with a recommendation to scan it actively
That last row is the one worth reading twice. A host identified only down to its manufacturer is not a
clean host — it is one the probe could not narrow far enough to name a finding. Reporting it as an
empty row would be the single most misleading thing an assessment tool can do, so it reports the size of
what it cannot yet see instead.
Two vendors that looked present and were not
Hirschmann and Phoenix Contact originally returned nothing at all, while appearing perfectly healthy in
the list: the NVD files them under Belden and phoenixcontact respectively. Both are manufacturers
the probe identifies routinely, so the empty feeds would have meant silent blind spots on common
industrial equipment — a good illustration of why the coverage figures above are verified against the
source rather than assumed.
Manufacturers — the registry and the floor beneath it
The installed IEEE registry turns a MAC address into a vendor name. It wins for the prefixes it
carries; everything else keeps resolving against the table built into the product. See
Passive and active for how that claim is presented with its
evidence and its caveats.
Only the built-in table is mandatory
Remove the installed registry and nobody loses their manufacturer — resolution simply falls back to the
table inside the product. That is deliberate: making the overlay compulsory would turn an offline-first
probe into one that needs an external file to do its job.
Only full-length assignments are used
The IEEE publishes three sizes of address block. Axiom Border uses only the full-length (MA-L)
assignments, because the two smaller kinds divide a single 24-bit prefix between several companies —
including them would confidently attribute one company’s block to a different company. A wrong
manufacturer is worse than no manufacturer.
Against the registry documented here, the installed file adds 1,737 prefixes the built-in table
cannot resolve at all and changes the name on 270 more. Most of that second number is the registry
tidying its own punctuation and character encoding rather than a company changing hands, but the ones
that matter are in there: Phoenix Contact and ABB, now Hitachi Energy, are the renamings you are most
likely to notice on a real inventory.
Take those three numbers as a snapshot, not a specification. They are a comparison between two things
that both move on their own — the registry the IEEE republishes every few days, and the table compiled
into whichever build you are running. The probe works the current figures out for itself and reports them;
see checking what a probe actually has.
OIDs and MIBs — the SNMP catalogue
An OID like .1.3.6.1.4.1.6574.2.1.1.5 means nothing on its own. Turning it into diskTemperature
requires a MIB, and on an air-gapped probe you cannot look one up — so the catalogue ships with the
product.
Contents
Used by
JSON catalogue
12,547 modules across 2,762 vendors
The probe. This is the catalogue it reads
ASN.1 catalogue
15,869 modules
Not the probe — supplied for the host’s own SNMP tooling
The modules are vendor-published MIBs, gathered from the manufacturers’ own documentation and public MIB
collections, and installed as a single catalogue. It is treated as an external source of truth: it is not
hand-edited, and it is refreshed as a whole rather than patched.
The ASN.1 tree is a convenience, not a spare copy
The probe never reads it. It is there so that snmpwalk and similar tools on the same host can resolve
names too — copy it to /usr/share/snmp/mibs if you want that. Pointing the probe at it does not work.
Vulnerability check templates
Two origins, and the pin is what holds the offline model together.
The generic templates come from the upstream project, pinned to a fixed release, and the engine’s
own self-update is switched off. Both are load-bearing: an engine allowed to chase “latest” would try to
download templates the first time it ran a scan, and a probe with no route out would simply fail there.
The OT/ICS suite is written in-house and lives inside the probe itself rather than in the
templates directory. It is written out to disk each time a vulnerability scan runs, and anything left
over from a previous version is removed at the same time.
That mirroring is a safety property, not housekeeping
Because the suite on disk is rebuilt from the copy inside the product at every scan, a check withdrawn in
an upgrade stops firing everywhere. That matters most for the intrusive ones: a write-capable check
removed on purpose cannot survive on disk and keep running.
All three locations are set from Configuration → Automatic scans, and the defaults are correct for a
standard installation — you only touch these to point the probe at data you placed somewhere else.
Setting
What it points at
Sniffing: CVE feed directory
Where the CVE database is seeded from at start-up
Sniffing: IEEE OUI registry
The registry file laid over the built-in manufacturer table
SNMP: MIB directory
The MIB catalogue, in the format the probe reads
Sniffing: passive vulnerabilities, on the same screen, is the switch that turns identity into findings
after each observation window. With it on and no CVE database seeded, you still get identity — you just
get no CVEs from it.
Working with OIDs from the console
Network status → the SNMP action on a host row opens the query panel. This is the normal way to
interrogate a device, and it needs no knowledge of OID numbering at all:
Version and Port set how to talk to the device.
Add OID takes a symbolic name or a numeric OID. You can paste several at once, separated by
commas, spaces or line breaks.
Standard OIDs expands into the common ones grouped by purpose — System, Interfaces, Host
resources — each explained in plain language rather than by number. sysDescr is described as
vendor, model and firmware, all in one string; sysObjectID as the vendor’s identifier for the
model — the usual fingerprint. Click one to add it.
Manual OID / Retrieve OID switches between naming OIDs yourself and reading back what the probe
already holds for that host.
Results render as a Table or a Tree, and the tree is the one to use after a walk.
Credentials do not belong in this panel. Store them once as an SNMP profile — the console has a
wizard for it, with predefined profiles to start from — and bind the profile to the host. See
Security assessment.
How resolution works
Two directions matter, and they behave differently: symbols become OIDs before the request goes out, and
OIDs get names again on the way back.
Inbound, when a query contains symbolic names, they are resolved before anything is sent on the
wire: first a small built-in table of the universal system OIDs, then anything already numeric passes
through untouched, then everything else is looked up in the vendor’s modules.
flowchart TB
S["Requested name<br>sysDescr"] --> C1{"Built-in<br>system OID?"}
C1 -->|"no"| C2{"Already<br>numeric?"}
C2 -->|"no"| C3{"In the vendor's<br>modules?"}
C3 -->|"no"| FAIL["Query fails<br>unresolved oids"]:::danger
C1 -->|"yes"| OK["Numeric OID<br>sent on the wire"]
C2 -->|"yes"| OK
C3 -->|"yes"| OK
classDef danger fill:#fff0ed,stroke:#ff664e,color:#101010
An unresolved symbol fails the whole query
If any requested symbol cannot be resolved, the run ends as failed — it does not silently skip the
unknown ones and query the rest. The failure names the symbols it could not resolve, so the fix is
usually obvious: correct the spelling, pick the name from Standard OIDs, or use the numeric OID.
Outbound, every OID that comes back is put through four steps, first match winning: the built-in
system OIDs; the vendor’s modules, trimming up to two trailing segments — which is how indexed OIDs
such as ifDescr.3 resolve to ifDescr; the SNMPv2 module; and a set of generic modules by exact match.
If nothing matches, the name comes back as unknown. The value is still returned — only the label is
missing.
Ambiguity yields no name rather than a wrong one
When trimming produces more than one candidate match, resolution stops and returns no name. This is
deliberate, and it is the same principle the probe applies to manufacturer identity: a value labelled
with a plausible-but-wrong symbol is worse than an unlabelled one, because it silently misleads whoever
reads the report.
The vendor hint
Symbol resolution needs to know which vendor’s modules to search. Axiom Border works it out in order:
The MIB named in the query itself.
The default MIB from Configuration → Automatic scans → SNMP: default MIB.
Inferred from the host’s manufacturer, as already recorded in the inventory.
The third is the useful one, and it is why running discovery before SNMP pays off: the manufacturer
already established for that host becomes the vendor hint automatically. Explicit rules exist for common
vendors — Synology, Cisco, HP, Huawei, Juniper, D-Link — falling back to the first word of the
manufacturer name.
The hint is only consulted when a query actually contains non-numeric symbols. All-numeric queries need
no vendor at all.
Values in results
Each result entry carries the numeric OID, the resolved name (or unknown), the formatted value and a
status. Values are formatted by type: numbers as numbers, IP addresses in dotted form, and byte strings
as text when they are printable, otherwise as hexadecimal — so binary values are legible rather than
mangled.
Walks mark disappearances, single queries do not
A walk covers a whole subtree, so an OID that was previously known and is now absent is genuinely
gone, and gets marked as down. A single-OID query only asks about what you listed, so absence proves
nothing and nothing is marked. This is why change detection over SNMP inventory should use walks.
Browsing the MIB catalogue
Listing vendors, searching for a symbol and inspecting a module are not in the console — the
catalogue browser is available through the API only. Day-to-day this rarely matters, because the
Standard OIDs helper covers the common cases and the vendor hint resolves the rest automatically.
Reach for these when you are working out what a specific vendor exposes.
# Vendors and their modules — inexpensive regardless of catalogue sizecurl -sk https://192.168.1.10:8083/security/mibs \
-H "Authorization: Bearer <jwt-token>"# Search for a symbol. Always pass vendor when you cancurl -sk 'https://192.168.1.10:8083/security/mibs/search?q=diskTemp&vendor=synology&limit=50'\
-H "Authorization: Bearer <jwt-token>"# Inspect one module. Names are exact and case-sensitivecurl -sk https://192.168.1.10:8083/security/mibs/SYNOLOGY-DISK-MIB \
-H "Authorization: Bearer <jwt-token>"
q is matched as a case-insensitive substring against object names. Always pass vendor when you
can: with it the search covers one vendor’s modules, without it the whole catalogue, and that is the
one operation whose cost grows with catalogue size. Everything else here is fast.
How a module ends up under a vendor
Vendor is derived from the module name: everything before the first hyphen, lowercased. So
SYNOLOGY-DISK-MIB belongs to vendor synology, and A3COM-HUAWEI-DEVICE-MIB to a3com. A module name
with no hyphen becomes its own vendor.
This is a heuristic rather than metadata read from the file. It works because MIB naming conventions are
near-universal, but do not expect it to be perfect on unusual modules — which is the other reason to
search by symbol rather than by browsing vendors.
Extending the MIB catalogue
To add a vendor’s MIB, place its JSON module in the configured catalogue directory. New modules are
picked up automatically, and changing the directory reloads the catalogue from the new location.
A missing catalogue does not stop the probe
If the catalogue cannot be loaded — wrong path, unreadable files — the probe logs a warning and carries
on with an empty catalogue rather than refusing to start.
The signature of that particular mistake is distinctive and worth recognising: numeric OIDs work,
sysDescr works, and everything else fails to resolve. Check SNMP: MIB directory in
Configuration → Automatic scans before looking anywhere else.
Keeping the catalogues current
Three of them can be replaced on a running probe, with no restart and no internet: the CVE feeds, the
IEEE registry, and the vulnerability check template bundle. You bring the file to the probe by whatever
means your site allows, and the probe takes it from there.
This is not in the console yet
Updating these catalogues is currently an API operation — the web console reads and edits where they
live, but does not yet offer uploading a new one. The calls below are the supported path today.
Accepts a single feed file or the whole bundle. Ingestion is idempotent per feed: re-ingesting a feed
deletes its previous rows before writing the new ones, so a CVE withdrawn upstream disappears here too
rather than lingering as a stale finding. Add ?replace=true to empty the directory first instead of
merging into it.
Takes the IEEE file exactly as published. The next observed frame already resolves against it — there is
no reload step.
It is validated on a copy before anything is replaced. A file that fails to yield a single usable
assignment is rejected and the running registry is left untouched, so a truncated download cannot take
your manufacturer resolution down with it.
The same shape exists for /security/oui-overlay and /security/vulnscan/templates.
Files on disk and rows ingested are two different numbers
Reading both at once is deliberate, because their disagreement is the exact signature of the most common
failure: the feeds are on the probe and nothing seeded them. A feed listed with a real size but
entries: 0 is a file sitting in the directory that is not a feed the probe can read.
The OT check count reads zero until the first scan
Because the industrial suite lives inside the probe and is written out at scan time, a probe that has not
run a vulnerability scan yet reports 0 OT checks. The suite is present and will be used; it simply
has not been laid down on disk yet.
Do not read that zero as a missing installation.
Why this is worth the disk it takes
Every catalogue here could have been a web service call. Making them local costs a few hundred megabytes
and buys four things that matter in an industrial network:
The probe works where it is most needed. Isolated segments are isolated deliberately. A tool that
phones out to stay useful is either useless there or a hole in the isolation.
Results are reproducible. The same probe, the same version, the same data, gives the same answer
next month. A feed that silently moved underneath you does not.
Nothing about your network leaves it to be analysed. Resolving a vulnerability against a hosted
service means telling that service what you have.
A scan cannot fail because something upstream was unreachable, renamed, or rate-limited.
And where the world genuinely does move — new CVEs, reassigned address blocks — you refresh it
deliberately, on your own schedule, with a file you can inspect before you install it.
AI Capabilities
AI capabilities
Axiom Border can run machine-learning models on the probe, in containers, to detect anomalies in the
metrics it ingests. A model trains locally on local data, exposes an inference endpoint on loopback, and
rules call it to decide whether an event is worth an alarm.
The point is the same as everywhere else in the product: no cloud round trip, no data leaving the site.
Linux and the central role are required
This feature requires Linux and the container engine that the central role installs, so deploy
AI capabilities on that role.
Anywhere else the rest of the probe runs normally — every other subsystem is unaffected — but the
AI capability does not start, and the controls that deploy or train a model have nothing behind them.
Anomaly detection covers system metrics
Deploy the capability with agent type metrics, which detects anomalies in the system metrics the
probe ingests. The other agent types — ssh, iface, usb — appear in the API but are not supported
yet.
Where you manage it
AI capabilities in the console lists the models configured on the probe. On a fresh installation it is
empty, because model images are supplied separately from the product:
From here you create a capability, follow its training state, force or cancel a training run, edit the
rule that calls the model, and read the quality metrics the model reports about itself. Everything on
this page is done from that view — the sections below follow it in order.
The lifecycle
flowchart TB
TAR["Model image tarball<br>supplied separately"]:::ext -->|"stage on disk"| IMG["Image imported<br>for one agent type"]
IMG -->|"deploy"| EXPORT["Training data<br>exported"]
EXPORT --> DEPLOY["Container deployed"]
DEPLOY --> HEALTH{"Model<br>healthy?"}
HEALTH -->|"not yet"| HEALTH
HEALTH -->|"responds"| READY["READY"]
READY -->|"retrain due"| TRAIN["TRAINING"]
TRAIN --> READY
READY -->|"predict"| INFER["Inference<br>from rules"]
classDef ext fill:#e9edfa,stroke:#486ac9,color:#101010
Each agent type has a fixed loopback port, which is how a rule reaches the right model:
Agent
Port
Container name
iface
5555
<trainerContainerName>-iface
ssh
5556
<trainerContainerName>-ssh
usb
5557
<trainerContainerName>-usb
metrics
5558
<trainerContainerName>-metrics
Each model listens on the host’s loopback address, so rules reach it at 127.0.0.1:<port>.
Loading a model image
Model images are not part of the installation bundle — they are supplied separately, because which
model you run is a decision about your data rather than about the product.
Create new AI trainer collects everything needed in one step: the model package, and the agent type
it applies to. You can upload the package from your machine, or tick Use file on disk and pick one
already staged on the probe — the wizard lists what is there, with the directory it is reading.
Loading an image replaces the others
Importing a model keeps the image for the agent you named and removes the images loaded for other
agent types. If you intend to run capabilities for more than one agent, importing them one after
another will not accumulate them.
Deploying a capability
The same wizard deploys it. Two settings decide how it behaves afterwards:
Setting
What it does
Retraining period
How often the model retrains. Ten minutes is the minimum — shorter is rejected. Leave it at zero and the model never retrains
Script enabled
Whether the rule for this agent runs. It can be set to enable itself as soon as data arrives from that agent
Deployment then does four things in order: exports the training data the probe already holds, starts the
model with that data available to it, waits for the model to report itself healthy, and marks the
capability ready — at which point it collects the model’s own quality metrics and enables the rule.
The health wait is bounded, roughly a minute and a half by default. A model that is slow to start needs
that raised in Configuration; it is not a failure of the model.
Only one capability per agent type can exist at a time. Deploying over an existing one is refused —
remove it first.
Following it from the console
The table on AI capabilities is the whole operational picture: trainer and model name, type, the
retraining period, when it last ran and when it runs next, whether the script is enabled, the data source
and inferencer, the model version, and the status.
Status
Meaning
READY
Trained and serving inference
TRAINING
A training run is in progress
READY, LAST TRAINING FAIL
Serving, but the most recent training run failed
CANCEL, WAITING TO RESUME
A run was cancelled; the schedule decides what happens next
ERROR
Something failed, with the detail alongside
Each row carries its actions:
Action
What it does
Train now
Forces a training run outside the schedule
Cancel training
Stops a run in progress
Edit retraining
Changes the retraining period
Edit script
Opens the rule that calls this model, with a template if it has none yet
Show metrics
The model’s own quality metrics from its last training
Audit log
Every execution recorded for this capability
Delete
Removes the capability
Forcing a run does not move the schedule
Train now updates the last-executed time but leaves the next scheduled run exactly where it was. It
is also refused while a run is already going, and it waits for a scheduled run rather than colliding
with it.
Cancel training stops the probe waiting for the model to come back rather than killing a computation
mid-flight, which is why the capability lands in a waiting state rather than simply stopping.
Training makes inference briefly unavailable
Every training run re-exports the data, restarts the model and waits for health again — so there is a
window during which inference does not answer. A rule that asks the model during that window gets an
error, and it should handle that as “no answer” rather than treating it as an anomaly. A model
restarting is not a security event.
Deleting is best-effort, and says so
Removing a capability cleans up the container, the image, the rule script, the exported data and the
stored record, and stops the retraining schedule. It reports success even when part of that cleanup
failed, with the details alongside — so read what it reports rather than assuming a silent success.
Calling inference from rules
This is where the capability earns its place. A rule script fetches recent metrics, builds a feature
vector, asks the model to score it, and raises an alarm when the model says anomaly:
Two globals are available to scripts for this: newPredict(payloadJSON, agentType) calls the model’s
inference endpoint, and newGetMetrics(agentType) fetches the model’s own metrics. Both target the
loopback port for that agent, and both are configured under trainerDetails.
Keep the script time limit above the predict timeout
The predict call has its own timeout (default 10 s), but the entire script invocation is bounded by
gojaTimeout (default 8 s). With those two defaults, a slow inference call cannot complete — the script
is stopped first.
If your rules call inference, set gojaTimeout comfortably above trainerDetails.predict.timeout, or
lower the predict timeout. Always define gojaTimeout: without a time limit, scripts do not run at all.
The rule script for an agent is enabled through ruleEnabled when deploying the capability, and can be
managed directly through the /scripts endpoints. See Alarms and rules.
Surviving a restart
Capabilities are part of the probe’s local state, and startup restores them: containers are resumed,
model metrics are re-fetched, and retraining schedules resume from their stored next-run time.
One case is treated deliberately: a capability that was training when the process stopped is
considered cancelled rather than resumed, because the training run did not finish. It moves to the
appropriate cancelled state and waits for its next scheduled run.
Failures during this restoration are logged and do not prevent startup.
Configuration reference
The relevant block is trainerDetails — container name, TLS material, and the three endpoint
definitions for health, metrics and inference. See
Configuration.
The health, metrics and inference endpoints are meant to be reached over loopback only. Keep them bound
to 127.0.0.1 and do not expose those ports beyond the host.
MQTT and OpenGate Operations
MQTT and OpenGate operations
Axiom Border carries its own MQTT broker, so a probe is a message bus as well as a monitoring probe. Three
independent pieces make up the messaging layer:
Piece
Role
Embedded broker
The MQTT broker running on the probe, on loopback. Optional TLS listener for remote clients
The broker listens on loopback only, on TCP port 1883. It is not reachable from the network, and that
is the shipped posture rather than a suggestion.
The console does not connect to it directly. It reaches the bus through a bridge inside the API’s own
encrypted connection: the console asks for a single-use ticket that expires in seconds, and exchanges it
when the connection is upgraded. So the live notifications you see in the console travel over the same
authenticated, encrypted channel as everything else, and no separate port is opened for them.
A TLS listener on 8883 exists for the case where you genuinely need remote clients, including mutual TLS
with client certificate verification. It is off by default.
This bus is the one inbound path that does not check a session
Operations arriving on the broker launch scans on the probe, and they are not authenticated by the
API’s session mechanism — that is what makes the loopback default load-bearing rather than merely tidy.
If you point the operations client at a remote broker, the probe requires an encrypted connection and
refuses a plaintext one unless you explicitly override it. Whoever can reach that broker can make the
probe scan.
Before exposing the broker on any network you do not fully control: restrict the port at the network
level, set broker credentials — with both empty it accepts anonymous connections — and enable TLS. After
changing TLS settings, confirm the broker came back up: if the certificates cannot be read it does not
start, and the log says so.
Execution lifecycle events
Every security scan publishes its lifecycle to a single topic, mqtt.client.topic, which defaults to
axiom-border/executions. This is the alternative to polling the executions API.
Note that type here is networkscan, while the REST API reports the same scan as nmap. Map the two
values if you correlate the event stream with the executions API.
Events are published on scan start, on completion, and on startup recovery for executions interrupted by
a restart.
Events are dropped, not queued, when disconnected
While the connection to the broker is down, or when the topic is left empty, lifecycle events are not
buffered for later delivery — they are simply not published. Do not treat this topic as an audit trail.
The authoritative record is the execution history, readable through GET /security/executions; the MQTT
stream is a convenience for live UIs.
Events are published with the configured QoS (default 1) and retain flag (default true), and the client
reconnects every 5 seconds while the broker is unreachable.
OpenGate operations over MQTT
The operations client lets the OpenGate platform trigger scans on the probe remotely. It subscribes to
mqtt.ops.topicSubscribe (default odm/operation) and replies on mqtt.ops.topicPublish (default
odm/response/{device-id}, with the device ID substituted at runtime).
name, id and deviceId are all mandatory. A request missing any of them, or one that does not parse,
is logged and silently ignored — no response is published. An unknown operation name does get a
response, with ERROR_PROCESSING and Unsupported operation.
There are exactly two result codes: SUCCESSFUL and ERROR_PROCESSING.
SUCCESSFUL means accepted, not completed
The operation response is published as soon as the scan is launched, not when it finishes — and it
does not carry the execution UUID. There is no field for it in the envelope.
To follow a scan triggered over MQTT, subscribe to the execution events topic or poll
GET /security/executions. In particular, an intrusive OT scan that the configuration lock rejects is
still answered with SUCCESSFUL; the rejection shows up afterwards as a failed execution.
The four operations
Operation
REST equivalent
hostNetworkScan
POST /security/scan/network
hostVulnScan
POST /security/scan/vulns
hostSnmpScan
POST /security/scan/snmp
hostSnmpWalkScan
POST /security/scan/snmp/walk
Both surfaces drive the same scan engine, so they share the same locking, history and safety gates. The
differences are in what each surface exposes.
hostVulnScan takes targets, timeout, level, severity and intrusive — all optional. It does
not expose templatesDir, so the configured resolution cascade always applies. The intrusive flag is
gated by securityProbes.vulnScan.allowIntrusive exactly as over REST.
hostNetworkScan takes targets, timeout, timing and portFilter. Four options are fixed for
MQTT-launched scans: port scanning is always on, OS detection is always on (which requires
privileges), service detection is always off, and UDP is always off. There is no force equivalent
either, so a scan launched while another manual network scan is running is rejected with
ERROR_PROCESSING and manual network scan already running.
hostSnmpScan and hostSnmpWalkScan take targets, port, timeout, credentials in an snmp
object, and either oids (mandatory for the GET) or walkRoot (defaulting to the enterprises subtree
.1.3.6.1.4.1).
The MQTT snmp object uses different names than the REST customParams: user rather than username,
authType rather than authProtocol, privKey rather than privPass, and privType rather than
privProtocol. The version field is snmpVersion.
Also: only the first entry of targets is used, and these credentials form an ephemeral profile that
ignores stored profiles and associations entirely. mib and profileName are not exposed over MQTT.
Request payloads are not logged
Because operation parameters can carry SNMP community strings and v3 passphrases, request payloads are
deliberately not written to the log — only the operation name, ID and device ID. Responses, which
carry no credentials, are logged in full.
OpenGate provision and collect
Separate from operations, the integration reports upward on a schedule — and it is inert until you
enable it. Everything it needs is on one screen, Configuration → OpenGate:
Setting
What it decides
OpenGate integration
The master switch. With it off, neither collect nor provision runs
API key
Authorises the probe to the platform. Also serves as the MQTT password when collect runs over MQTT and no separate password is set
Schedule
When provision and collect run, as a cron expression — unlike the scan periods, which are durations
Minimum period
A floor that protects the platform from a too-frequent schedule
Below it, HTTPS transport security governs how the probe talks to the platform: whether a private
certificate authority is needed, and whether the probe presents a client certificate of its own for
mutual TLS.
An unencrypted platform URL stops the integration
Allow unencrypted HTTP is off, and leaving it off is the right choice. What travels on this link is
the full inventory of your network together with the API key that authorises it — in the clear, over
plain HTTP.
With the escape hatch off, a plaintext platform URL does not start the integration: it disables it and
records why. It exists only for an installation that genuinely cannot move to HTTPS yet.
Scheduling and throttling
A five-field cron expression (default */30 * * * *) drives both, with descriptors such as @hourly
accepted. An empty or invalid expression means the integration does not run at all — check the log for a
warning if nothing is happening.
minPeriod (default 30 minutes) is a floor: if the cron expression would fire more often than that, the
schedule falls back to a fixed interval of minPeriod and logs a warning. Cycles never overlap — a cycle
due while the previous one is still running is skipped and logged.
Provision
Provisioning registers discovered hosts with the platform. It builds an Excel workbook — one row per host,
with device ID, addressing, state and the location metadata from opengate.collect.address — and uploads
it to the bulk endpoint.
The upload requires exactly 201 Created; anything else aborts the provision. The result is then polled
up to pollMaxAttempts times (default 10, every 5 seconds), and only counts as success when the platform
reports every submitted host as successful.
Provision is HTTP only — there is no MQTT variant.
Collect
Collect sends the accumulated per-host inventory: identity, ports, vulnerabilities and SNMP entries, with
timestamps.
Transport is chosen by collect.mode: mqtt, or http for anything else including an empty value. Over
HTTP the payload is posted with the X-ApiKey header; over MQTT it is published to collect.mqtt.topic,
falling back to opengate.apiKey as the password when no MQTT password is set.
Chunking. With collect.sendByParts: true, each host is split into several messages: a header with the
scalar fields plus one chunked block at a time — ports, then SNMP, then vulnerabilities — sized by
collect.partSize.* (default 100 each). This matters on metered or constrained links where a host with
hundreds of findings would otherwise produce one oversized message. With chunking off, each host is a
single message.
A failed chunk is logged and the cycle continues with the next one, so one bad message does not abort the
whole report.
Device identity
The device ID is derived per host as <ip>-<MAC with dots>, for example
192.168.1.50-00.11.22.33.44.55. Hosts without a discoverable MAC get the placeholder
AA.BB.CC.DD.EE.FF. This is the same format accepted by
GET /security/results/last?deviceId=, so an ID seen in the platform can be looked up on the probe
directly.
Before each cycle, hosts missing a MAC or hostname get a quick nmap ping scan to fill the gaps, bounded by
macDiscoveryTimeout (default 10 s).
A fixed collect.deviceId behaves differently per transport
Setting collect.deviceId forces one identifier for all hosts over HTTP, but the MQTT path always uses
the per-host derived ID. If you rely on this override, use HTTP transport — or better, leave it empty and
let each host keep its own identity, which is almost always what you want.
Configuration reference
Everything here is configured under the mqtt and opengate blocks. See
Configuration for the field-by-field tables, including the TLS options and the
retry parameters for both provision and collect.
Operation and Maintenance
Operation and maintenance
Service commands
Each role installs a different set of units. The standard systemd verbs apply to all of them:
Startup, crashes and early warnings only — 3 to 5 lines in normal operation
/var/log/oda-lite/oda-lite.log — plugin activity, HTTP errors towards central, emitted metrics
Automatic: every 24 h or at 100 MB, 7 archives kept
Lifecycle scripts
—
/var/log/axiom-border-install.log — install, upgrade and uninstall appended together
Not rotated; clear it by hand if it grows
The rule of thumb
To diagnose application logic, read the file. To diagnose a crash or a failure to start, read
the journal. Looking for probe results in journalctl is the most common wasted hour.
Axiom Border — the logger block of configuration.yaml. Set logLevel to DEBUG, INFO, WARN
or ERROR, then restart the service. See Configuration.
oda-lite agent — /etc/oda-lite/oda-lite.conf, [agent] section: log_level and debug. Restart
the service afterwards.
InfluxDB and containerd — the level comes from binary flags in the unit file. Changing it means
editing the unit, and is not recommended.
Turn DEBUG back off
DEBUG on a busy probe generates enough volume to fill a disk. Raise it to reproduce a problem, then
put it back to INFO. Do not leave it on “just in case”.
Rotation and disk usage
Axiom Border’s own log rotates through the logger settings: maxSize (MB per file, default 20),
maxBackups (default 20) and compress (gzip the rotated files).
The journald drop-in installed by the bundle is global — SystemMaxUse=500M and MaxFileSec=1day
apply to the entire host journal, not only to Axiom Border. On a host sharing other workloads, adjust it
or replace it with per-unit drop-ins.
Three things the probe reads off disk are facts about the world that change on their own: the
vulnerability templates, the local CVE database, and the IEEE OUI registry. All three ship with the
bundle, so a freshly installed probe already works. All three can be refreshed through the API,
without restarting the service and without an SSH session — which is the point, because the probe is
designed for a network with no route to the internet.
Data is updatable, decisions are not
The OUI registry and the CVE base change without anyone on this team deciding anything, so they can be
replaced in the field. The OT port table and the device-type rules are auditable decisions with their
evidence, and stay compiled into the product on purpose.
Vulnerability templates
# What is installed right nowcurl -sk https://<probe>:8083/security/vulnscan/templates -H "Authorization: Bearer $JWT"# Offline refresh — the mode that matters on an air-gapped probecurl -sk -X POST https://<probe>:8083/security/vulnscan/templates/bundle \
-H "Authorization: Bearer $JWT" -F "file=@vulnscan-templates.tar.gz"
The archive is expanded and validated in full in a separate directory, the product’s own OT/ICS
templates are re-mirrored on top of it, and only then is it swapped in atomically. A corrupt, empty or
traversal-carrying archive is rejected with 400 and the previous templates still serving. The
response reports what ended up active; a non-zero otTemplates is the check that the OT set survived
the replacement.
The upstream mode (POST /security/vulnscan/templates/update) needs connectivity andallowTemplateUpdates: true. On a standard deployment it answers 409 and points at the bundle route.
Both modes are serialised against a running scan, and the exclusion waits before giving up: the
request blocks for up to 20 s and only then returns 409.
otTemplates: 0 on a freshly installed probe is normal — the OT templates live inside the binary and
are written to the directory on the first scan. A zero after an update is not.
Local CVE database
curl -sk https://<probe>:8083/security/passive/cve-feeds -H "Authorization: Bearer $JWT"# One vendor, merged into what is already therecurl -sk -X POST https://<probe>:8083/security/passive/cve-feeds \
-H "Authorization: Bearer $JWT" -F "file=@nvd-siemens.json"# The whole base, guaranteeing nothing older survivescurl -sk -X POST 'https://<probe>:8083/security/passive/cve-feeds?replace=true'\
-H "Authorization: Bearer $JWT" -F "file=@cve-feeds.tar.gz"
Ingested immediately, no restart. The status reports both the files on disk and the rows in the
database: the two disagreeing is exactly the symptom of “the feeds are there but nothing seeded them”.
If a single file in the upload does not parse as a feed the whole upload is rejected — half a CVE
base is worse than none, because the probe then reports fewer vulnerabilities than there are and looks
like it worked.
OUI registry (manufacturer by MAC)
The table compiled into the binary freezes at each release while the IEEE republishes every few days.
The registry on disk is laid on top of it: it wins for the prefixes it carries, everything else
keeps resolving from the built-in table. Removing it leaves nobody without a manufacturer.
curl -fLO https://standards-oui.ieee.org/oui/oui.csv # on a machine with internetcurl -sk -X POST https://<probe>:8083/security/oui-overlay \
-H "Authorization: Bearer $JWT" -F "file=@oui.csv"
The file is accepted exactly as the IEEE publishes it, so what you installed can be diffed against
the source. It takes effect on the next frame. The response counts what it contributes:
newPrefixes (hardware currently reported with no manufacturer at all), overrides, and renames —
the last being the number that matters, since it is how many devices are about to be reported under a
different manufacturer. Hosts resolved this way publish manufacturerSource: "oui-overlay".
Only MA-L assignments are read. MA-M and MA-S share a 24-bit prefix between several companies, so
including them would credit one company’s block to another.
A version update restores the bundled copy
All three directories are re-staged from the bundle on every install: they are bundle content, not
operator state. An upload through the API is an update between versions. To make new data the
baseline for the fleet, publish its asset pack and let the next bundle carry it.
Loading AI images
AI images are not part of the bundle — they are distributed separately as OCI tarballs, and
resources/iaimages/ ships empty as a placeholder.
Extract the new bundle of the same role on the target and run upgrade.sh. It aborts if the bundle
role does not match the installed role — changing role requires uninstall followed by install.
sudo ./upgrade.sh
Flag
Meaning
--force-conf-regen
Regenerate the oda-lite configuration from the new template, saving the current one as .bak-<timestamp>
-h, --help
Print help and exit
Variable
Default
Meaning
HEALTHCHECK_RETRIES
12
Attempts before declaring failure
HEALTHCHECK_INTERVAL
5
Seconds between attempts — 12 × 5 s gives a 60 s window
AXIOM_API_PORT
8083
API port used for the health check
What it does: verifies the previous installation and role match, stops the role’s services (leaving
InfluxDB and containerd running, so data in flight is not disturbed), takes timestamped backups of the
binary and db.dat, replaces the binary and updatable assets, starts the service, and health-checks it.
Preserved across upgrade:config/, db.dat, .influx-creds, parquet/, logs/,
/var/lib/influxdb2/, resources/iaimages/ and the oda-lite configuration.
Replaced: the binary, MIBS/, resources/gojascripts/, vulnscan-templates/, the documentation
and the lifecycle scripts.
Failed upgrades roll back automatically
If the health check fails all 12 attempts, upgrade.shrestores the previous binary, confirms the
old version answers with HTTP 200, and exits with code 2. The probe is left operational on the old
version and the backup is kept at /opt/axiom-border/axiom-border.bak-<timestamp>. An upgrade that
reports a rollback has not broken anything — diagnose, then retry with a corrected bundle.
Back up db.dat before upgrading
The local state file db.dat is not migrated automatically. If a new version changes its format, the
file may have to be regenerated, and that loses local state — rules, aliases and execution history.
Always take a copy before upgrading, and if the new version will not start cleanly, restore the copy and
revert the binary.
Uninstalling
sudo /opt/axiom-border/uninstall.sh
It stops and disables the role’s services, removes only the units it created, removes the journald
and sshd drop-ins, and asks whether to keep the data — InfluxDB data, db.dat, logs and
configuration.yaml. Answer non-interactively with AXIOM_KEEP_DATA=true|false.
It removes shared binaries only where the manifest marks them as installed by this deployment. It does
not remove nmap, rsyslog or network-manager even if it installed them — those are host
infrastructure and are left to the operator. It does not revert the netplan switch by default.
Variable
Effect
AXIOM_KEEP_DATA=true|false
Answers the data-retention question without prompting
AXIOM_RESTORE_NETPLAN=1
Restores /etc/netplan/ from the backup, re-applies it, and switches back to systemd-networkd
AXIOM_FORCE_CLEAN=1
Destructive. Without a manifest, claims every detected artefact as its own — including global binaries that may belong to other software such as Docker or Kubernetes
Running it on a clean system is safe and idempotent: it reports there is nothing to uninstall and exits 0.
AXIOM_FORCE_CLEAN can remove another product’s binaries
Use it only after confirming nothing else on the host depends on containerd, runc, nerdctl or the CNI
plugins. Without the flag, a manifest-less uninstall stays conservative and touches only artefacts that
are unmistakably Axiom Border’s.
AXIOM_RESTORE_NETPLAN=1 warns about possible connectivity loss. In practice an established SSH session
usually survives, since the TCP connection is not torn down and the IP is retained — but do not count on
it over a link you cannot recover from out-of-band.
journalctl -u <service> --since "5 min ago", looking for start-limit
Install or upgrade behaved oddly
tail -200 /var/log/axiom-border-install.log
Disk filling up
du -sh /var/log/oda-lite /opt/axiom-border/logs /var/log/journal/
Detailed cases
The service will not start. Three usual causes: the binary lost its execute bit
(chmod +x /opt/axiom-border/axiom-border), a required port is occupied, or the YAML is invalid.
Validate the configuration directly:
A port is in use. Identify the holder, then either stop it or move the Axiom Border port:
sudo ss -tlnp | grep -E ':(8083|1883|1888|8086|9090|9091) '
Ports 8083, 1883 and 1888 move via apiPort, mqtt.broker.port and mqtt.broker.ws.port. Ports 9090
and 9091 move in /etc/oda-lite/oda-lite.conf.
Vulnerability scans return zero findings, suspiciously. The web template directory is probably
empty or incomplete:
ls /opt/axiom-border/vulnscan-templates/ | head
It should list per-protocol directories such as http/, network/ and ssl/. CVE templates live under
http/cves/, not at the root. Refresh them as described above. OT/ICS findings are unaffected, because
that suite ships with the product.
Sniffing captures nothing. Check the interface exists (ip -o link show), that the service runs as
root (systemctl show axiom-border -p User), and that there is actually traffic
(sudo tcpdump -i <iface> -c 10).
The UI loads but every API call returns 401. The JWT is missing or expired. Clear the browser’s
localStorage and log in again.
nmap probes hang or take very long. A large target range with poor reachability, a high timeout,
or udp: true with many ports. Narrow the range, lower the timeout, disable UDP.
High memory usage. Check for an AI capability working a large dataset, an Influx bucket with no
retention policy, or logLevel: DEBUG left on.
“Orphaned installation detected.” Bundle artefacts exist without an .install-manifest. Three ways
out: AXIOM_CLEAN_RESIDUALS=1 sudo bash install.sh moves the leftovers aside, sudo bash upgrade.sh
preserves data, sudo bash uninstall.sh cleans best-effort.
upgrade.sh exits with code 2 reporting a rollback. The new binary failed its health check and the
old one is back in service. Diagnose with the journal, the application log and the install log, then
retry with a corrected bundle.
The monitoring node floods the journal with “connection refused” to port 9090. The central node is
not up, a firewall blocks it, or the URL is wrong. The agent keeps retrying and buffers metrics while it
waits, so a short outage loses nothing — a long one eventually will.
Error executing 'netstat': exit status 1. Minimal Ubuntu Server images lack net-tools. Not
blocking — the other plugins continue:
NetworkManager is active but interfaces show as unmanaged. The netplan renderer was not switched
over. Re-run install.sh --switch-to-network-manager; it detects the current state and completes the
switch without reinstalling NetworkManager.
/etc/oda-lite/oda-lite.conf.new contains literal ${VARIABLE} placeholders. The file is an
unexpanded template. Do not copy it over the live configuration — the agent would not start. Delete
it and re-run the upgrade with the current bundle.
scp or tar -xzf fail with Permission denied in /tmp. Some base images ship /tmp with wrong
permissions. It should be drwxrwxrwt:
The information contained in this document is copyrighted, and Amplia Soluciones SL reserves all rights. Amplia Soluciones SL reserves the right to make periodic modifications to the document without the obligation to notify any person or entity of such revision. Copying, duplicating, selling, or otherwise distributing any part of the software or documentation without the prior written consent of an authorized representative of Amplia Soluciones SL is prohibited.
Documentation is provided as a reference sample on an “as is” basis, without warranty of any kind, either expressed or implied, including, without limitation, guarantees that the documentation is free of defects, merchantable, fit for a particular purpose, or non-infringing. The entire risk as to the documentation’s quality, accuracy, and performance is with you. Should any documentation prove defective in any respect, you (not the initial writer or any other contributor) assume the cost of any necessary servicing, repair, or correction. This disclaimer of warranty constitutes an essential part of this license. No use of any documentation is authorized hereunder except under this disclaimer.
Under no circumstances and no legal theory, whether in tort (including negligence), contract, or otherwise, shall the initial writer, any other contributor, or any distributor of documentation, or any supplier of any of such parties, be liable to any person for any direct, indirect, special, incidental, or consequential damages of any character including, without limitation, damages for loss of goodwill, work stoppage, computer failure or malfunction, or any other damages or losses arising out of or relating to the use of the documentation, even if such party shall have been informed of the possibility of such damages.
OpenGate and amplía))) are trademarks or registered trademarks of Amplia Soluciones SL. All other company and product names may be trademarks of the respective companies they are associated with. Specifications are subject to change without notice. Amplia Soluciones SL. is not responsible for errors or omissions.
Amplia Soluciones SL makes no warranties or commitments concerning the availability of future products or versions that may be planned or under development, whether they were notified or not in any format.

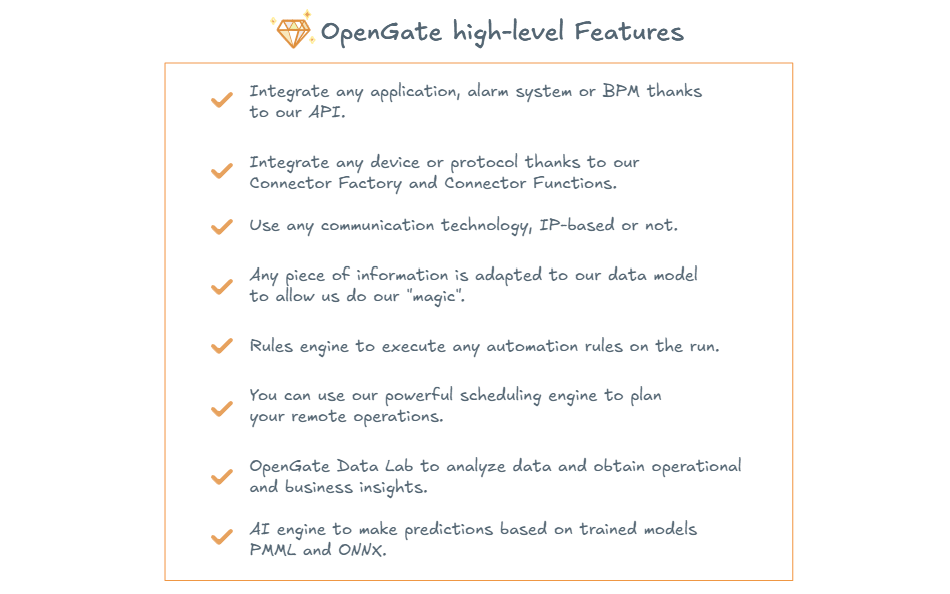 OpenGate stands out for several cutting-edge features that make it a next-level IoT platform. Here are some highlights:
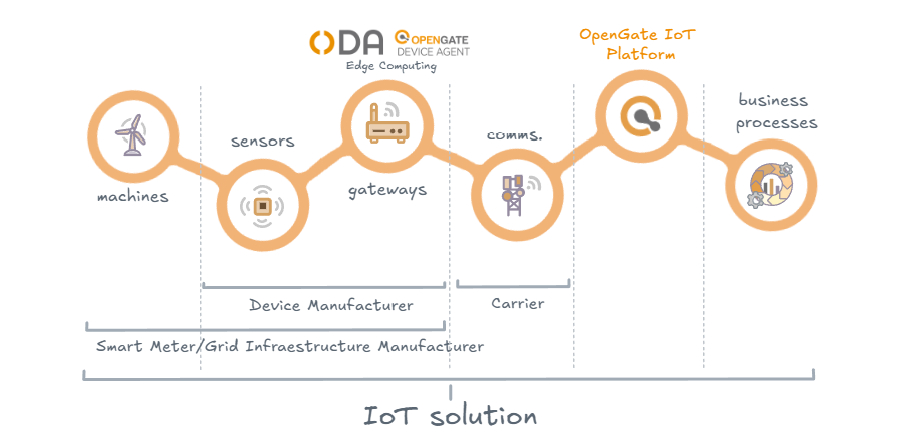 OpenGate covers the complete IoT lifecycle: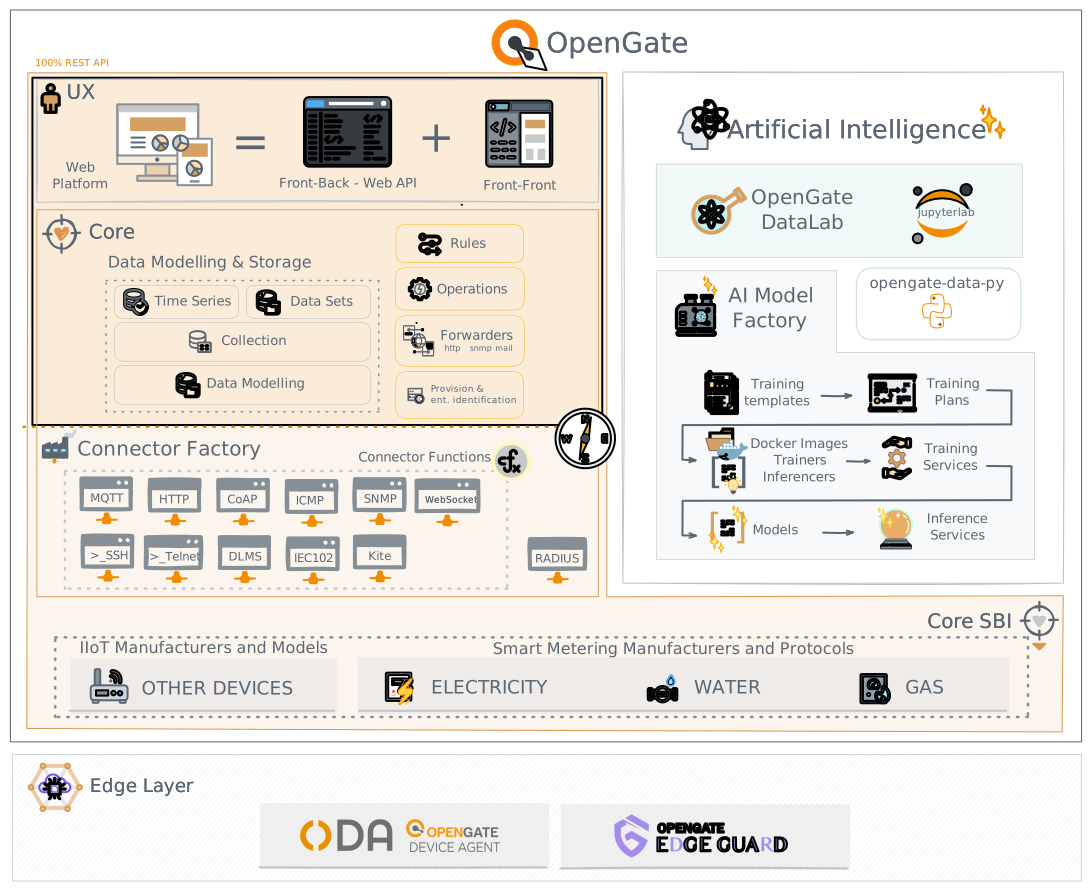

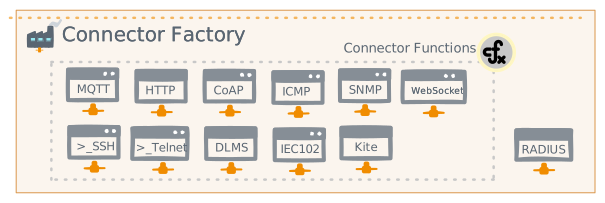
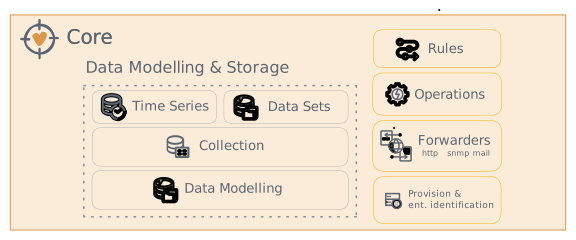
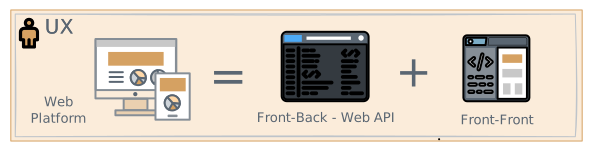
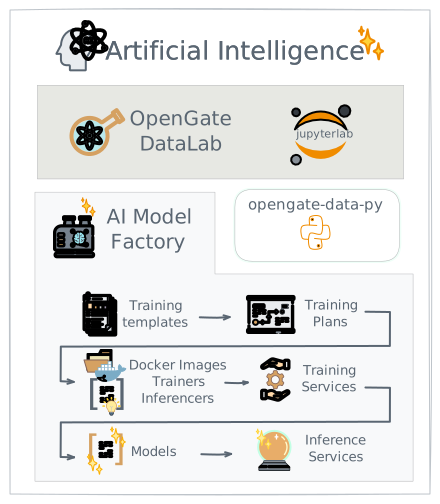
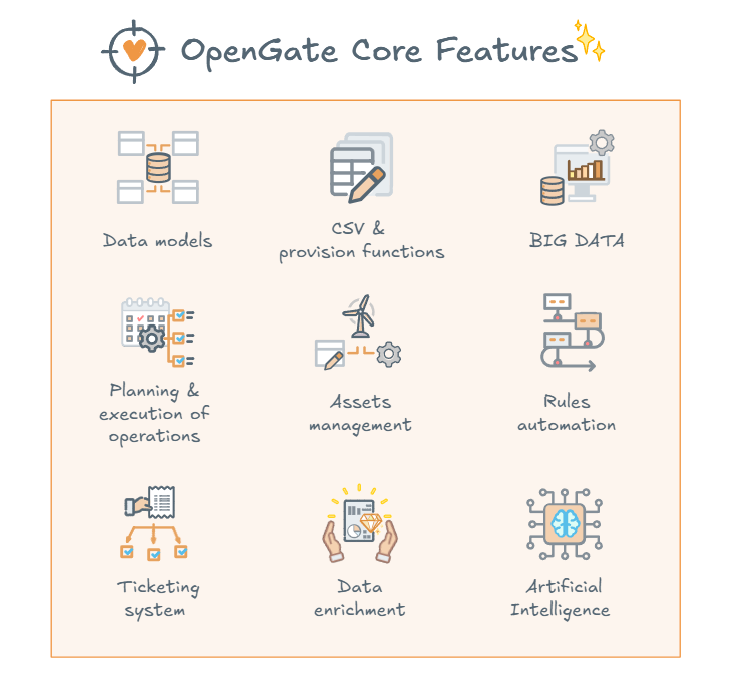
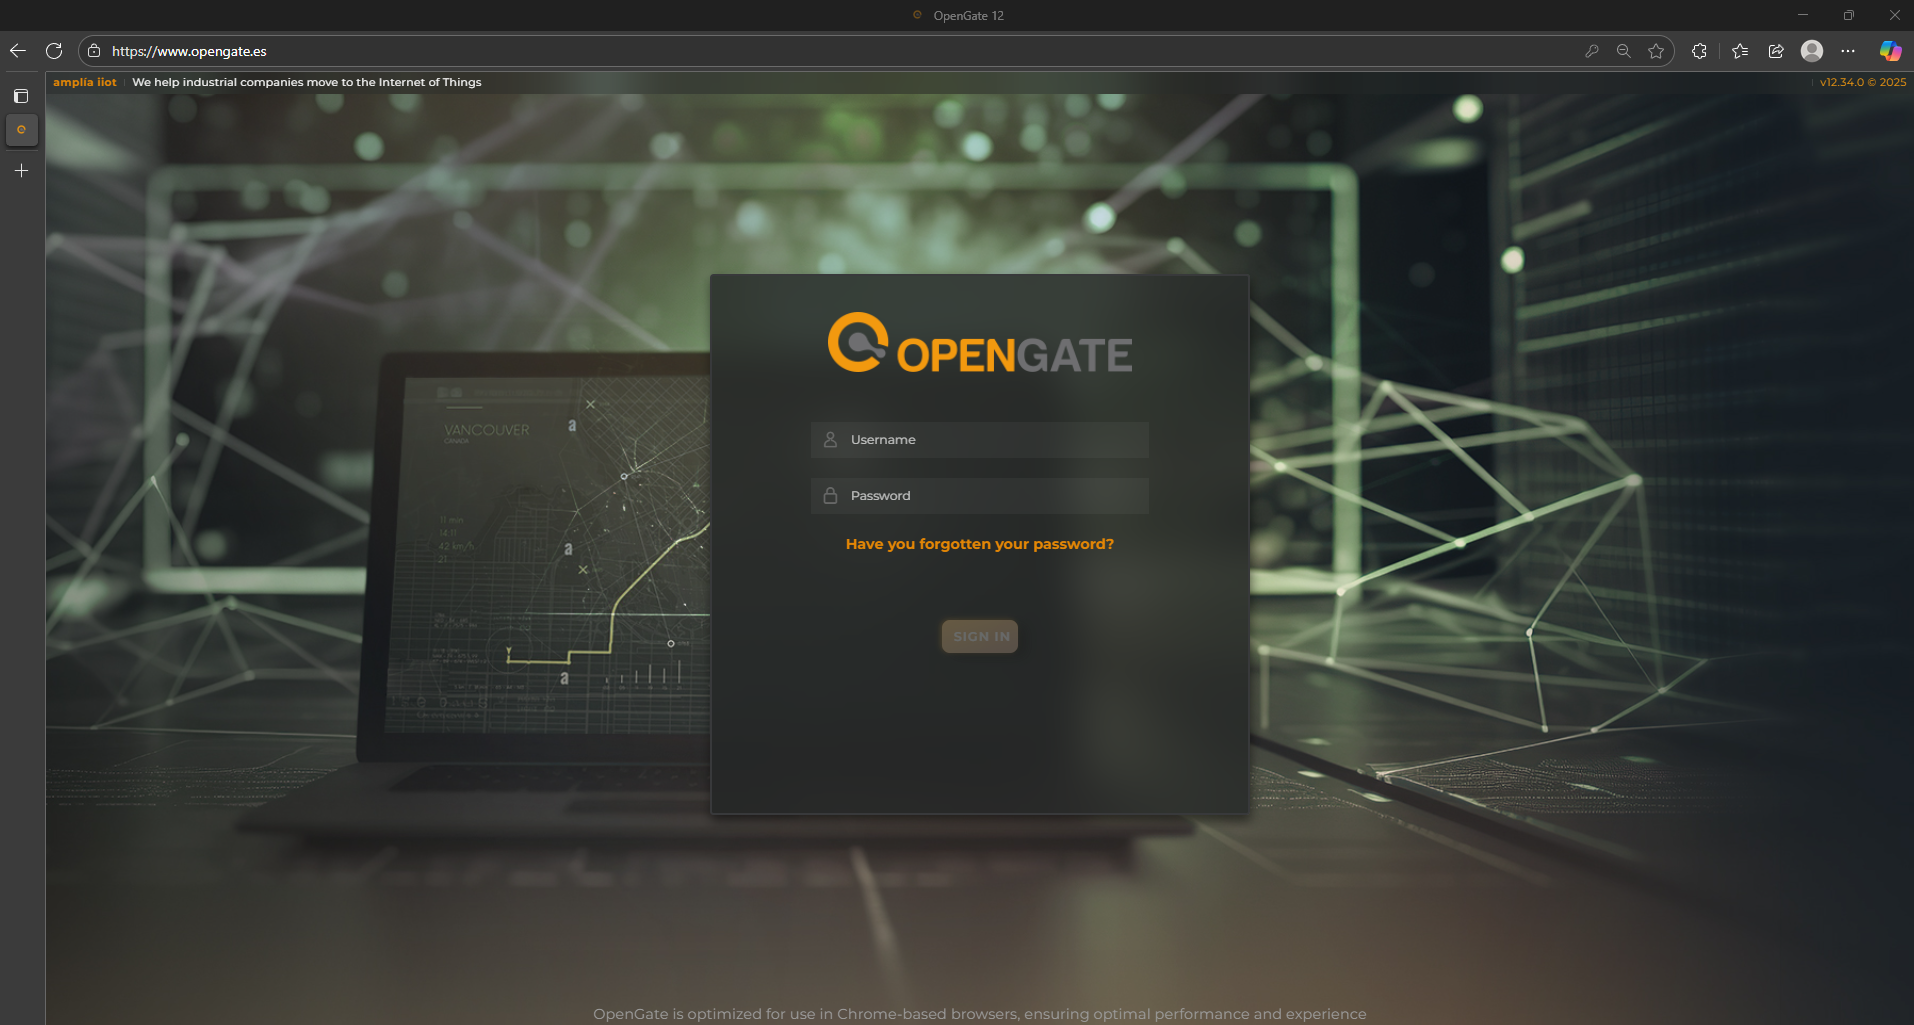
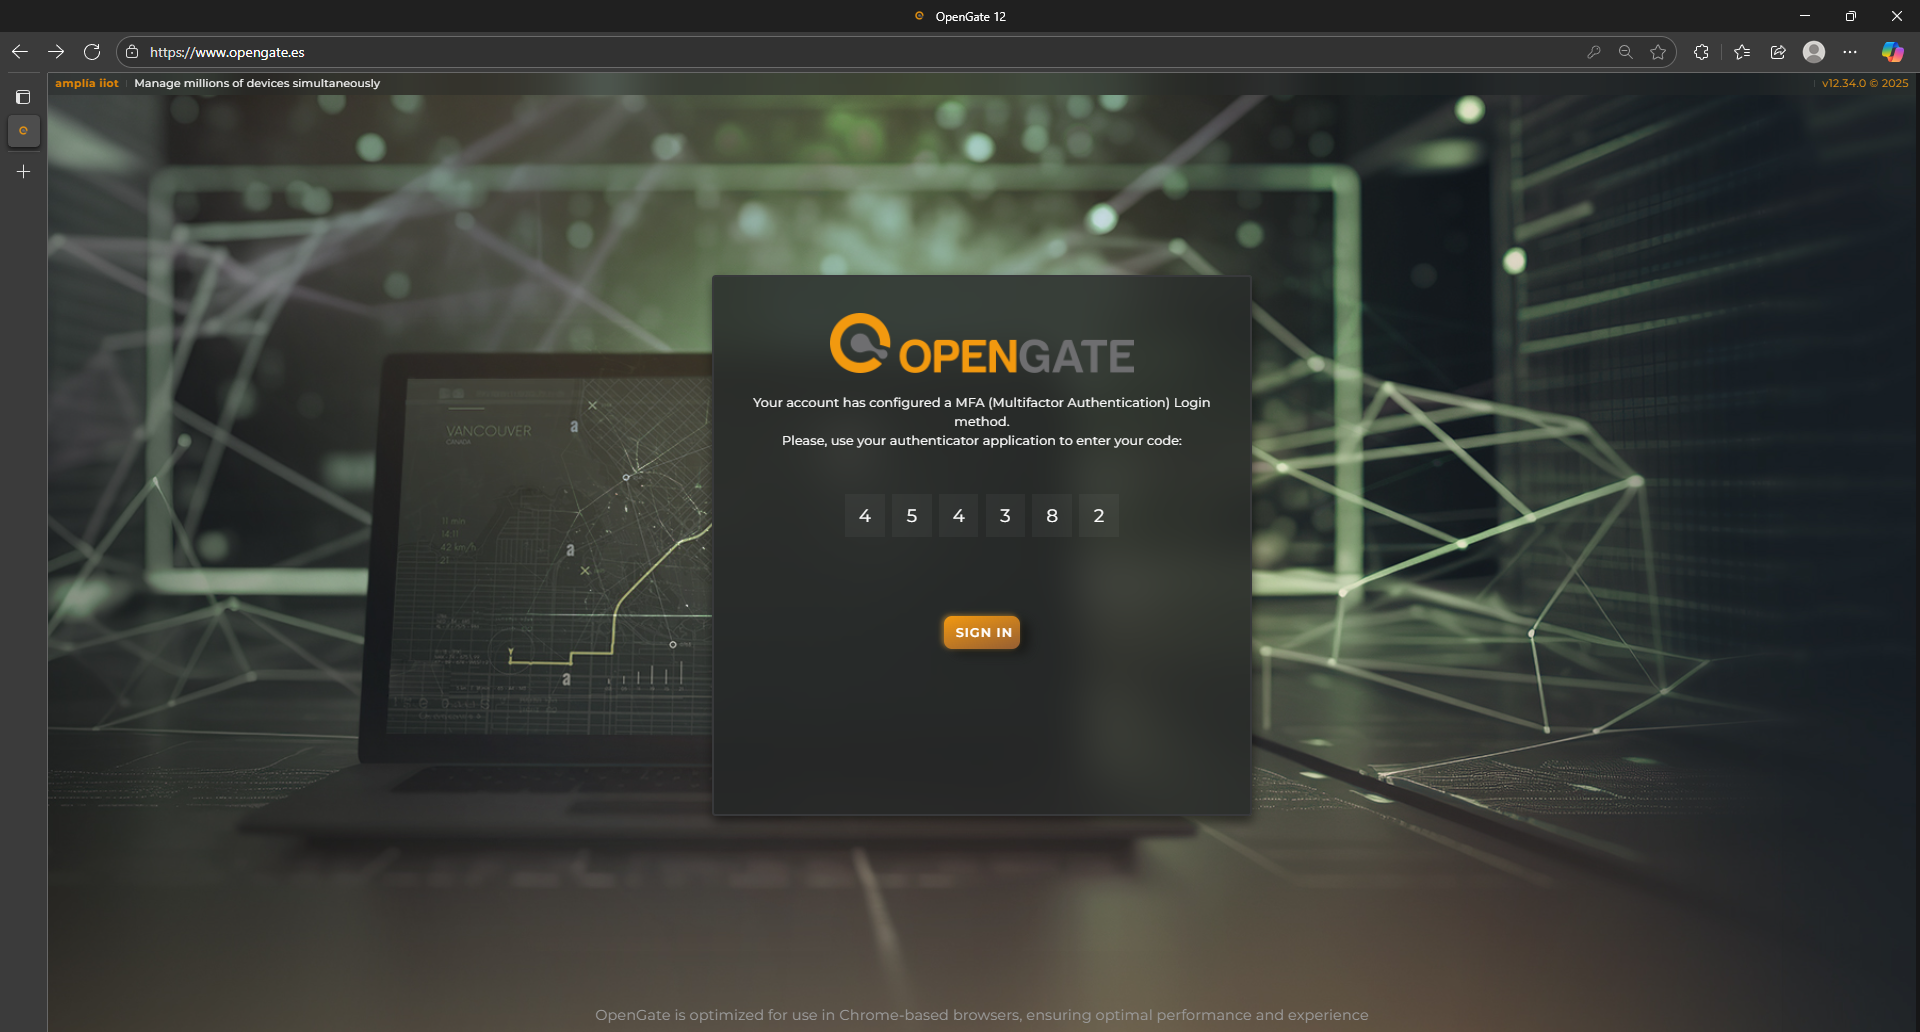
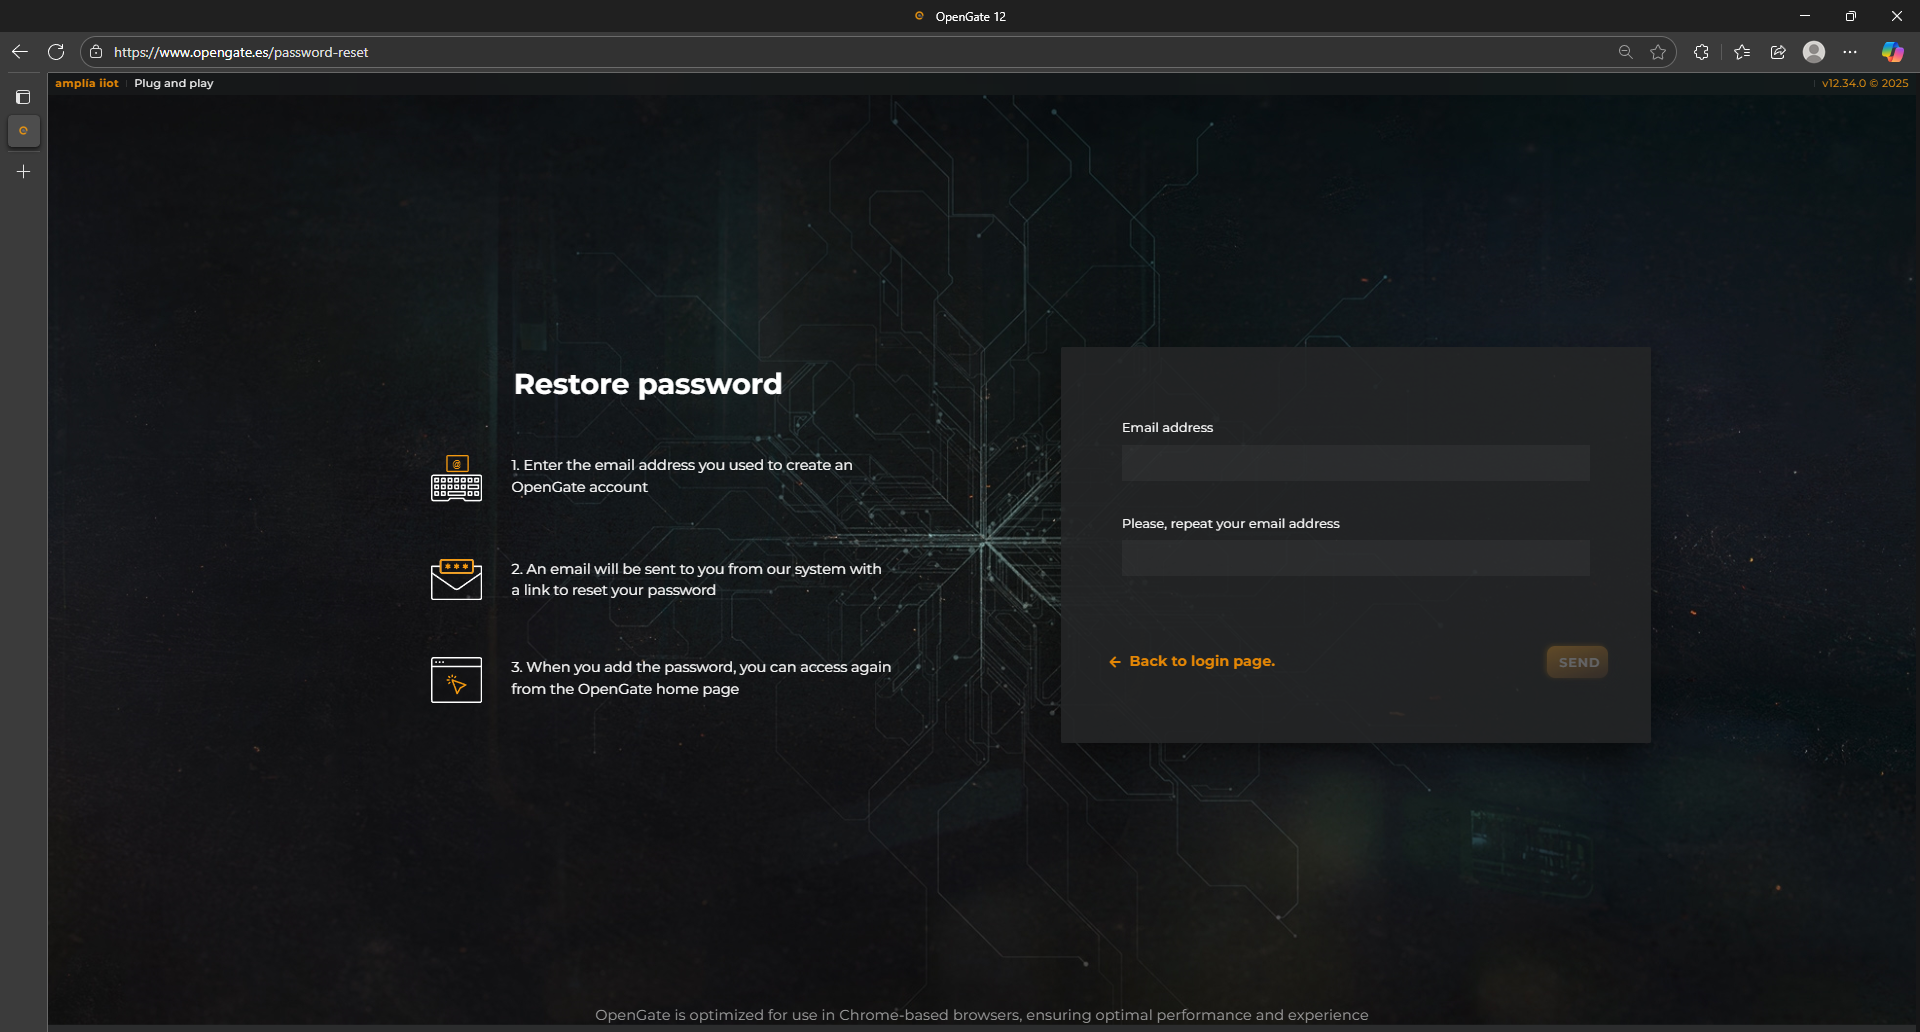
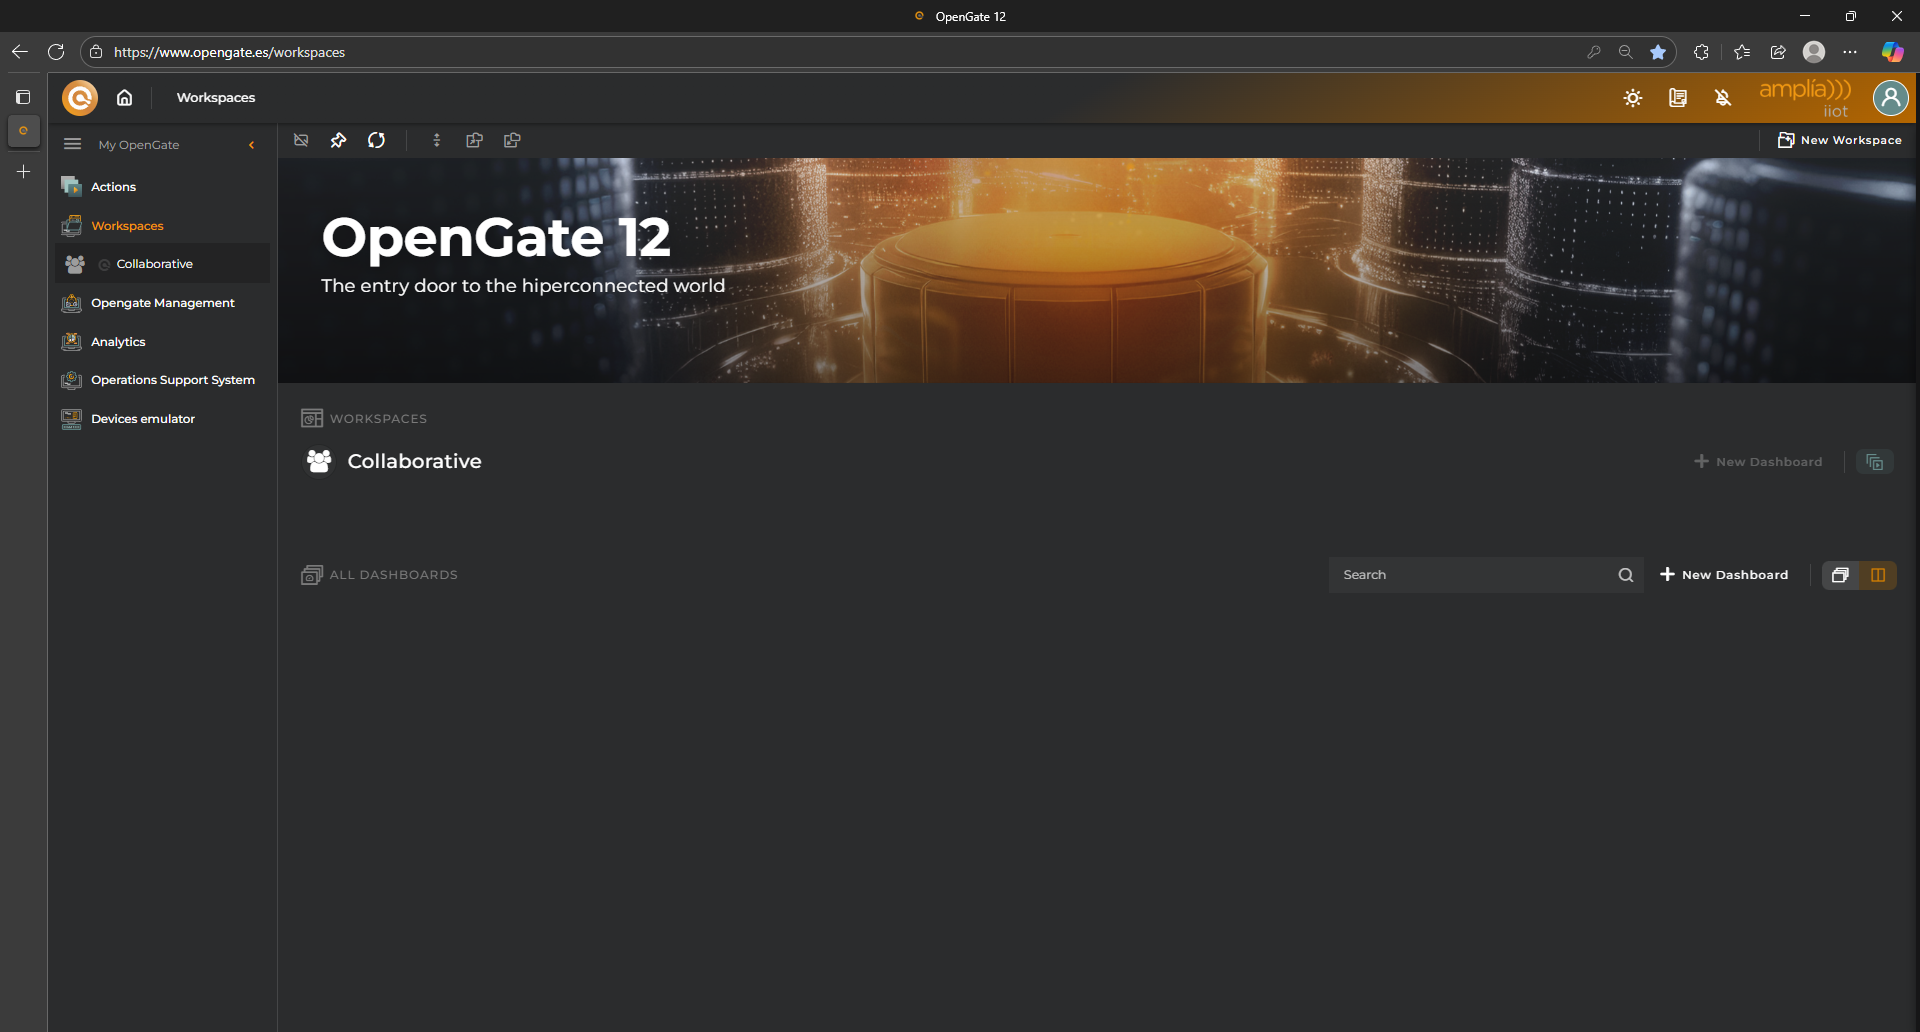
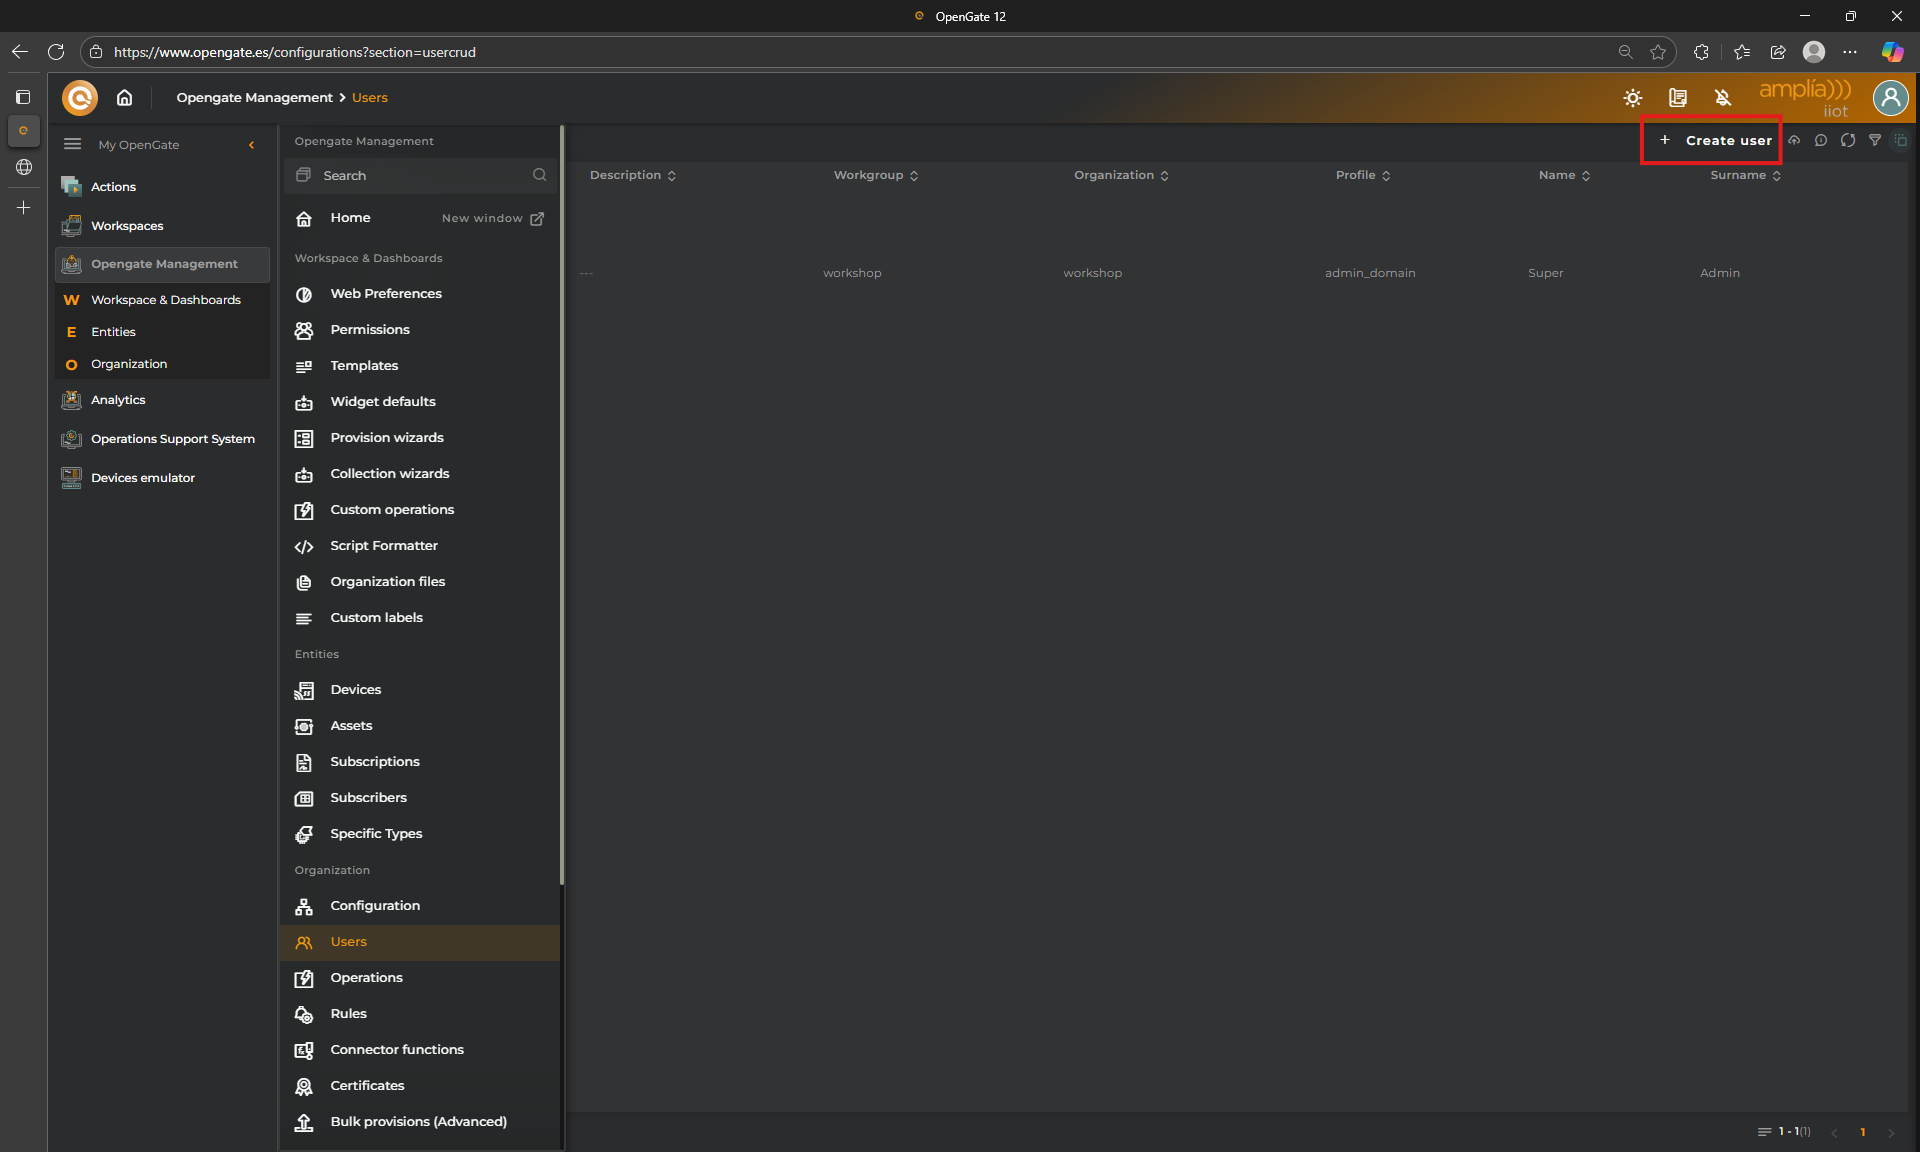
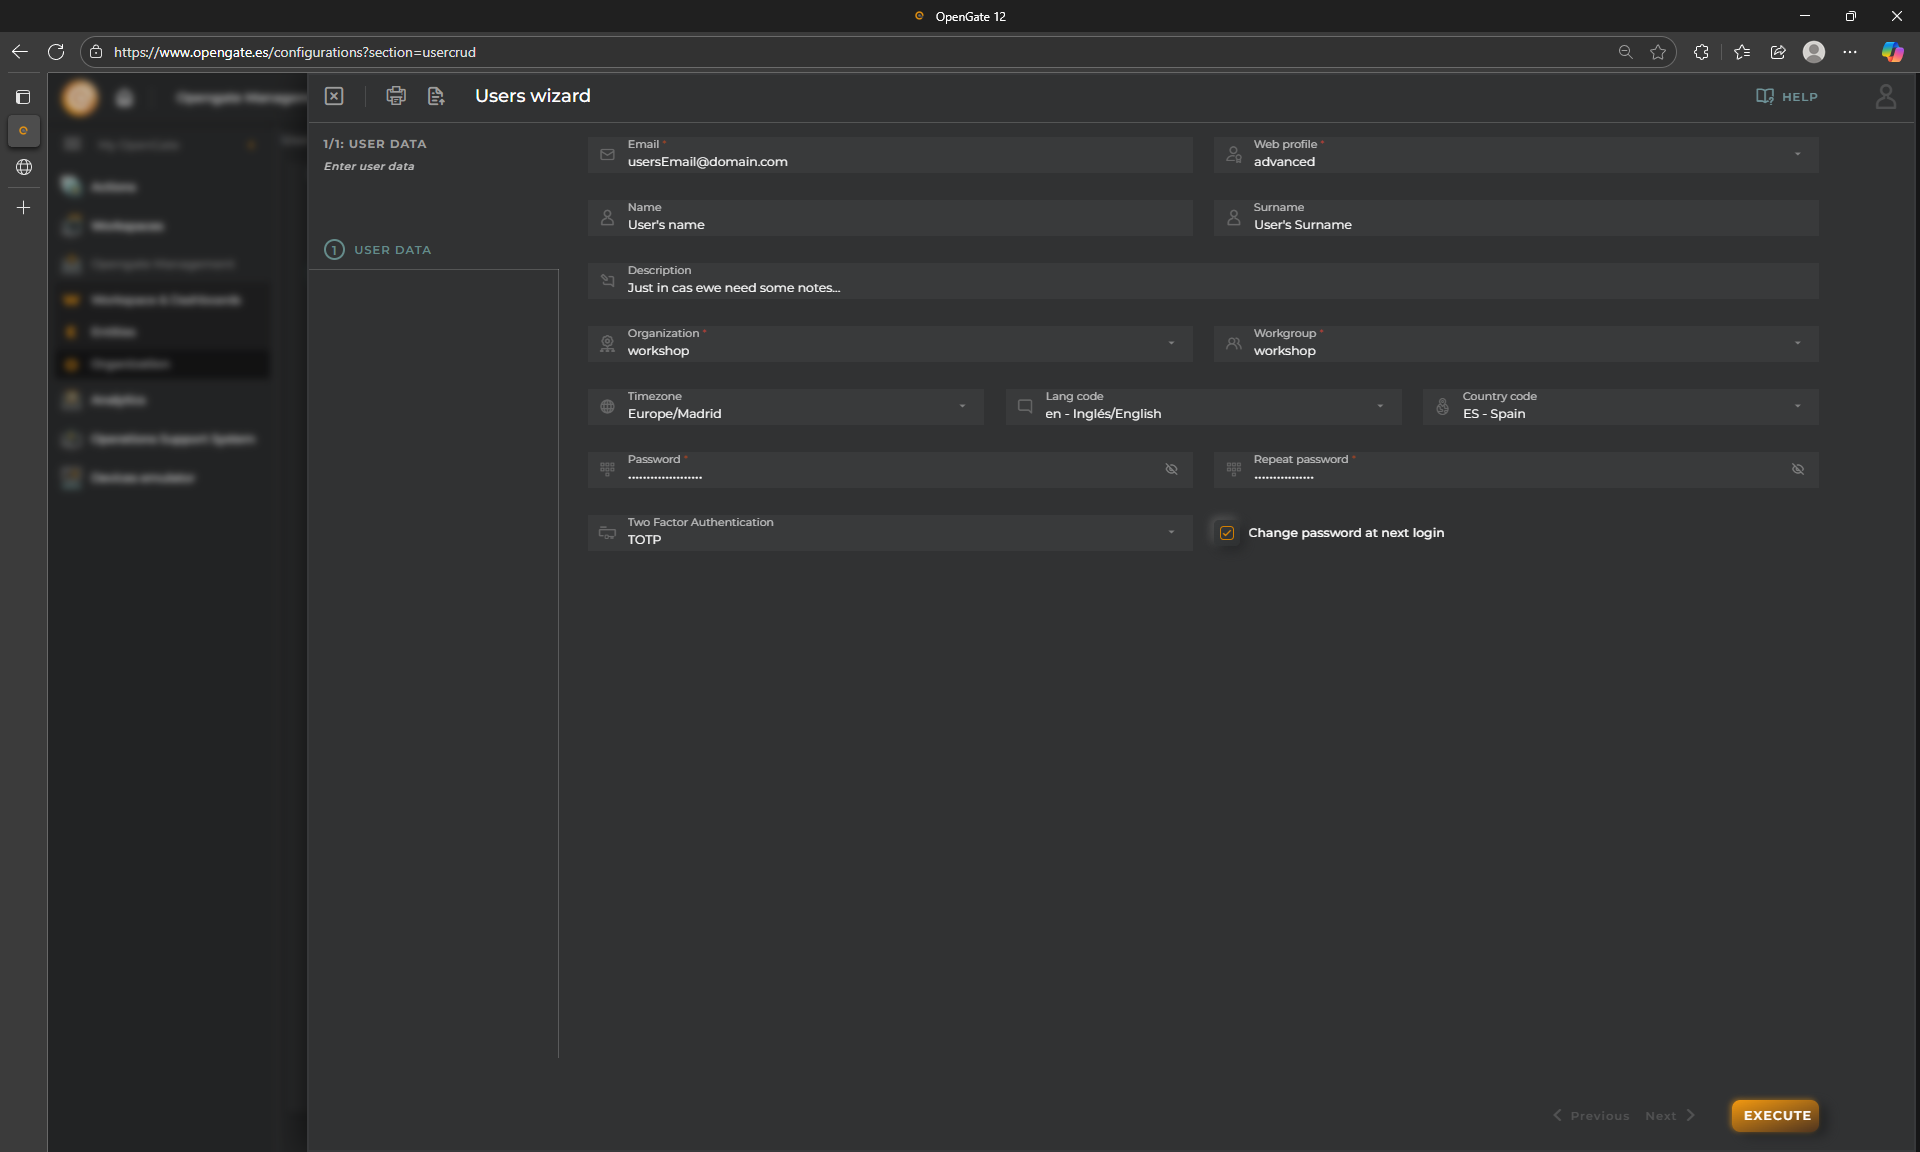
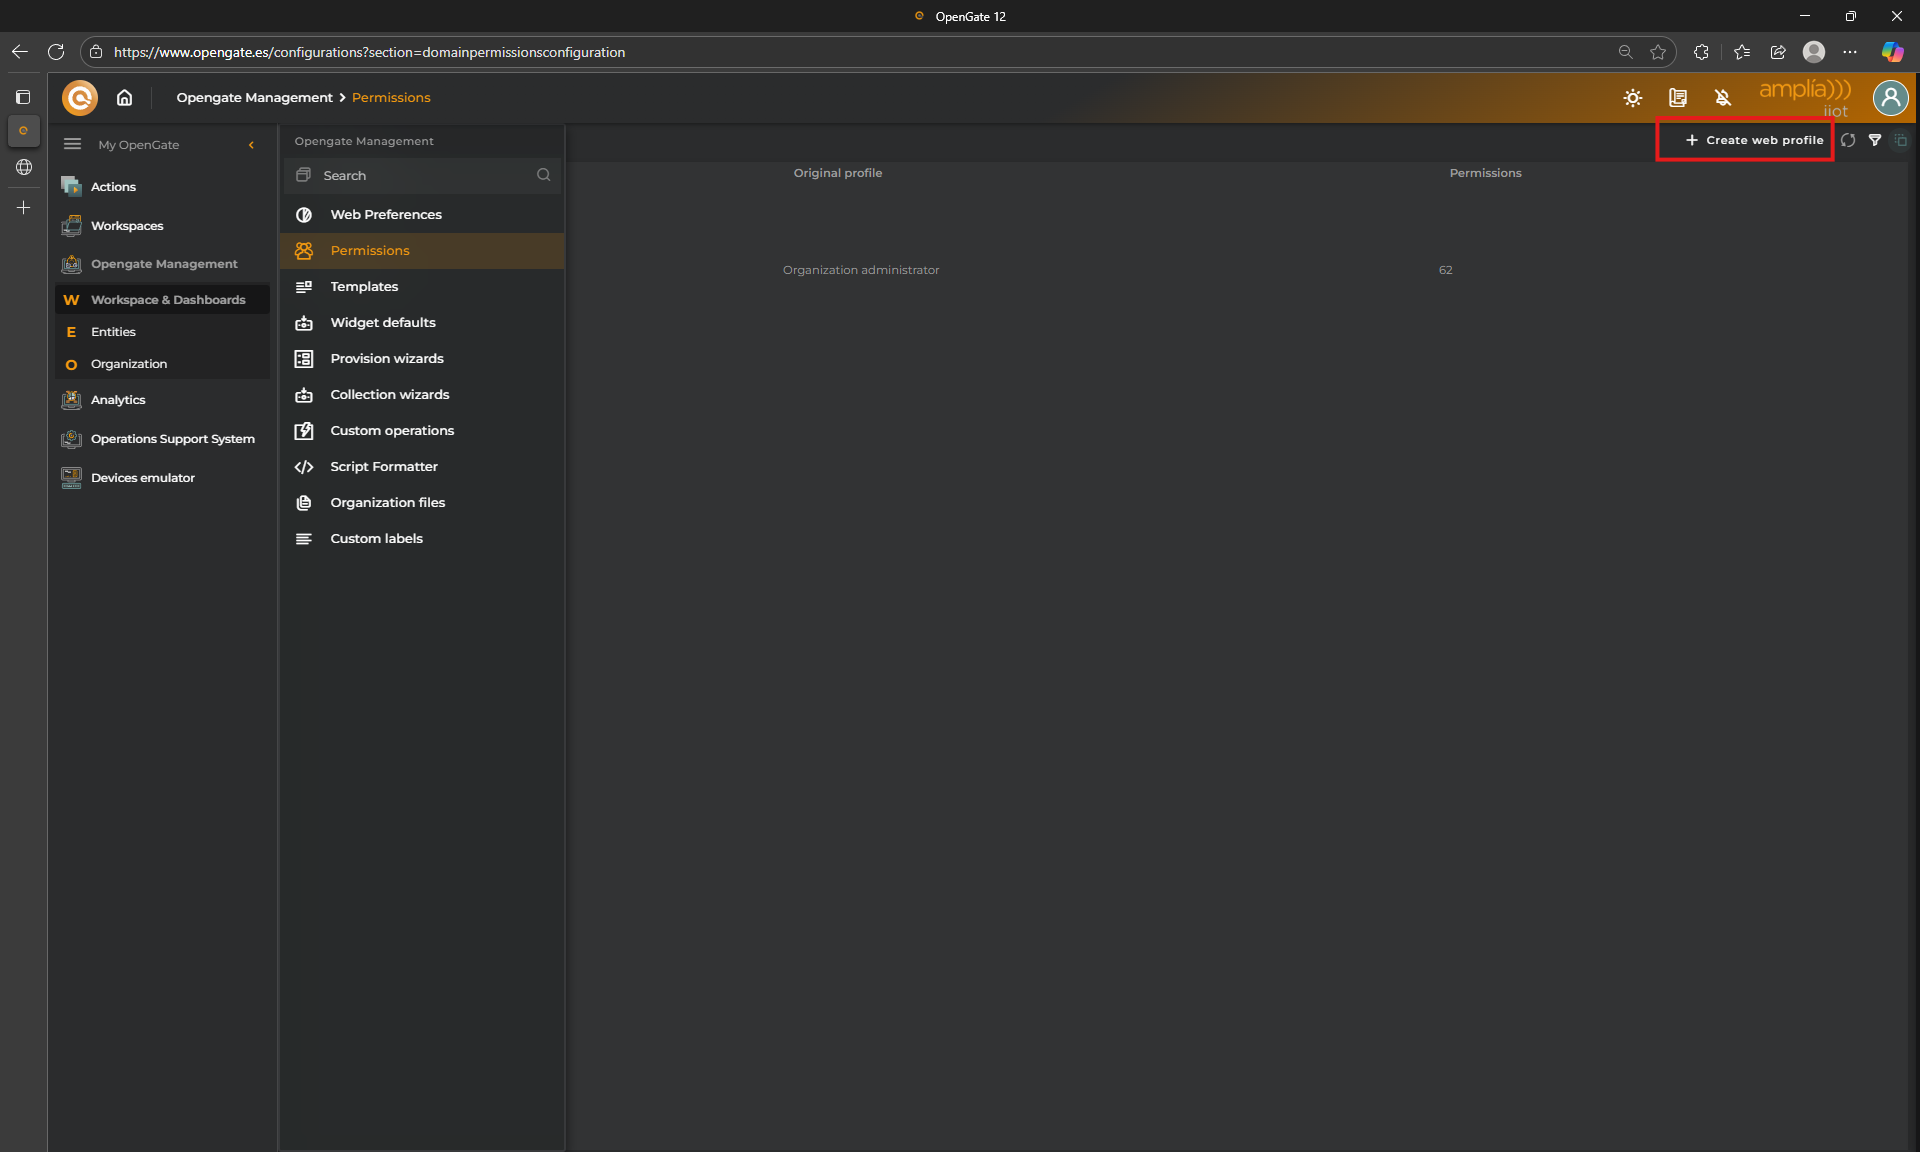
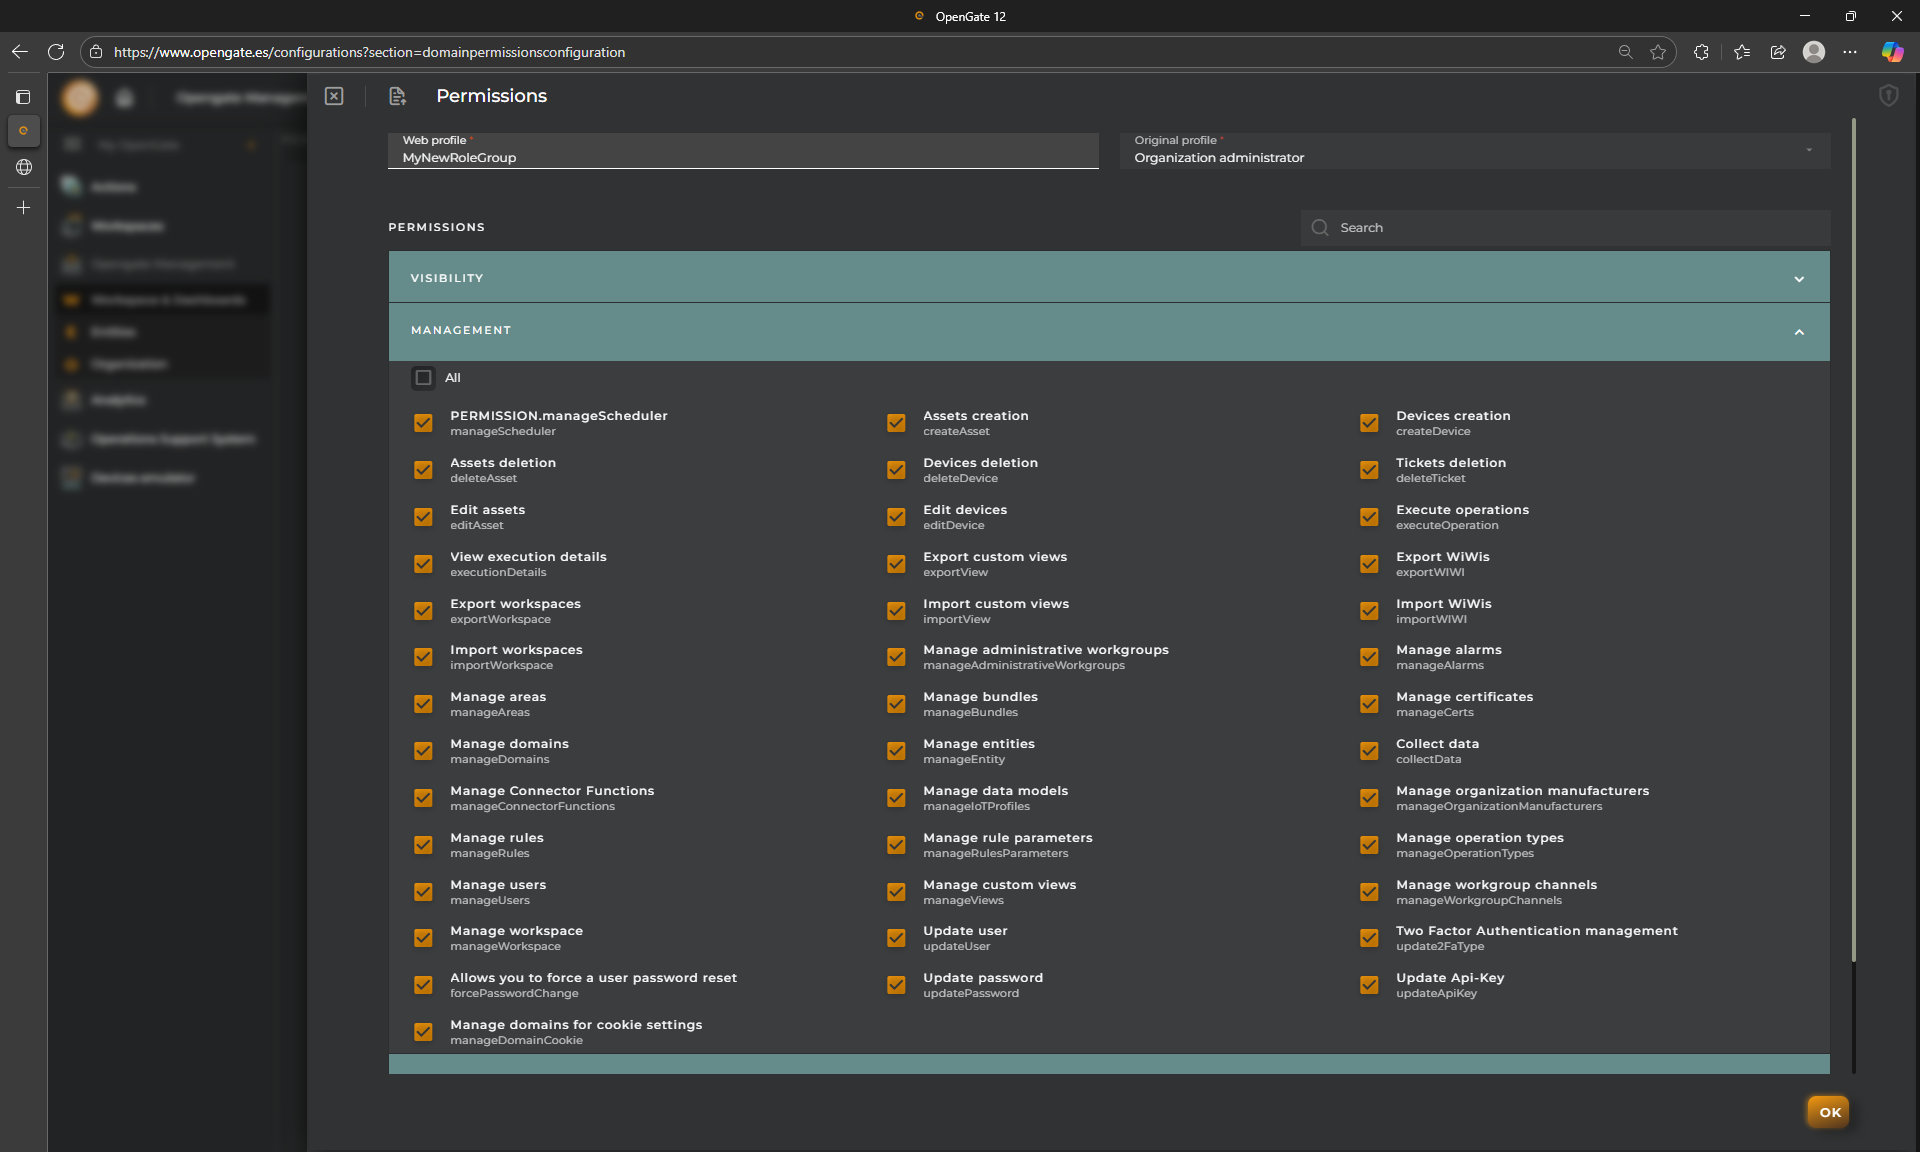
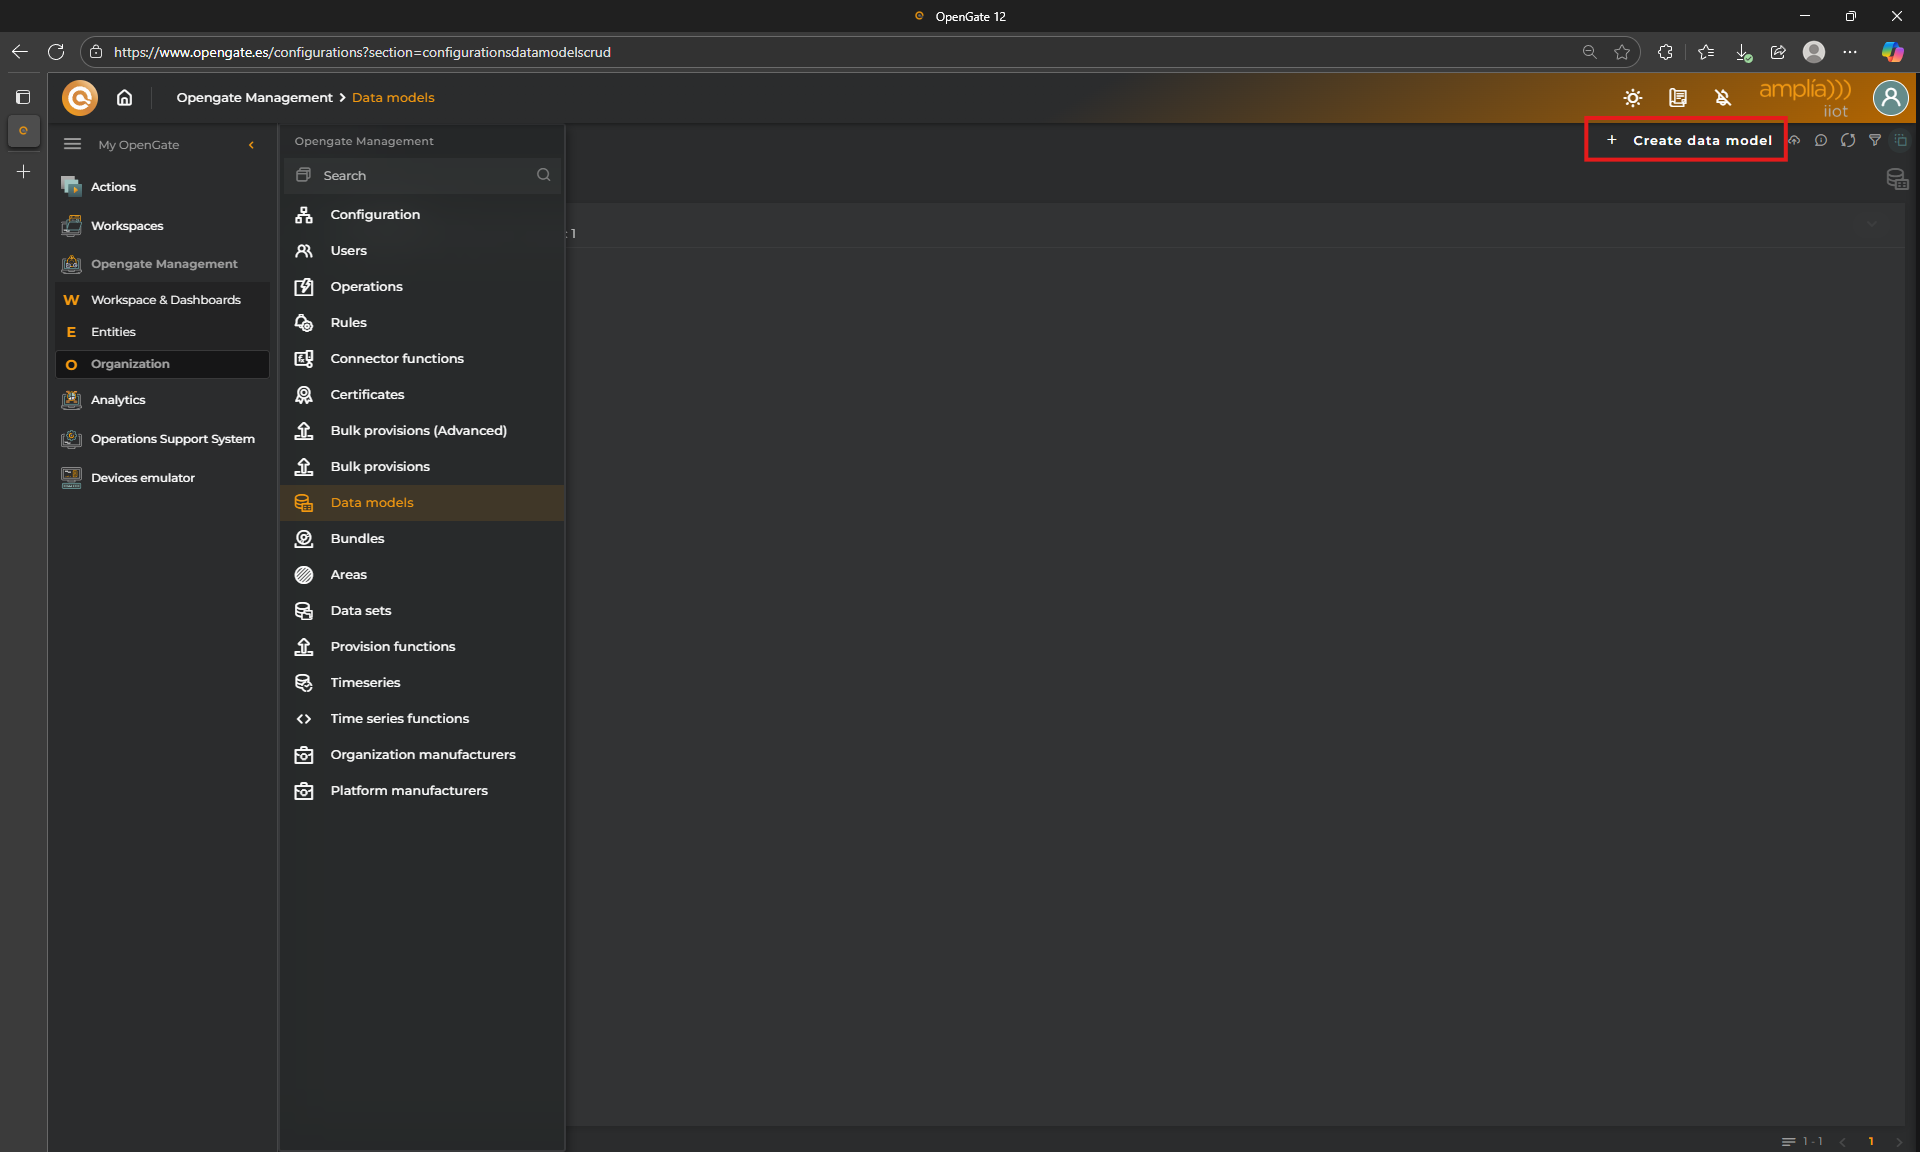
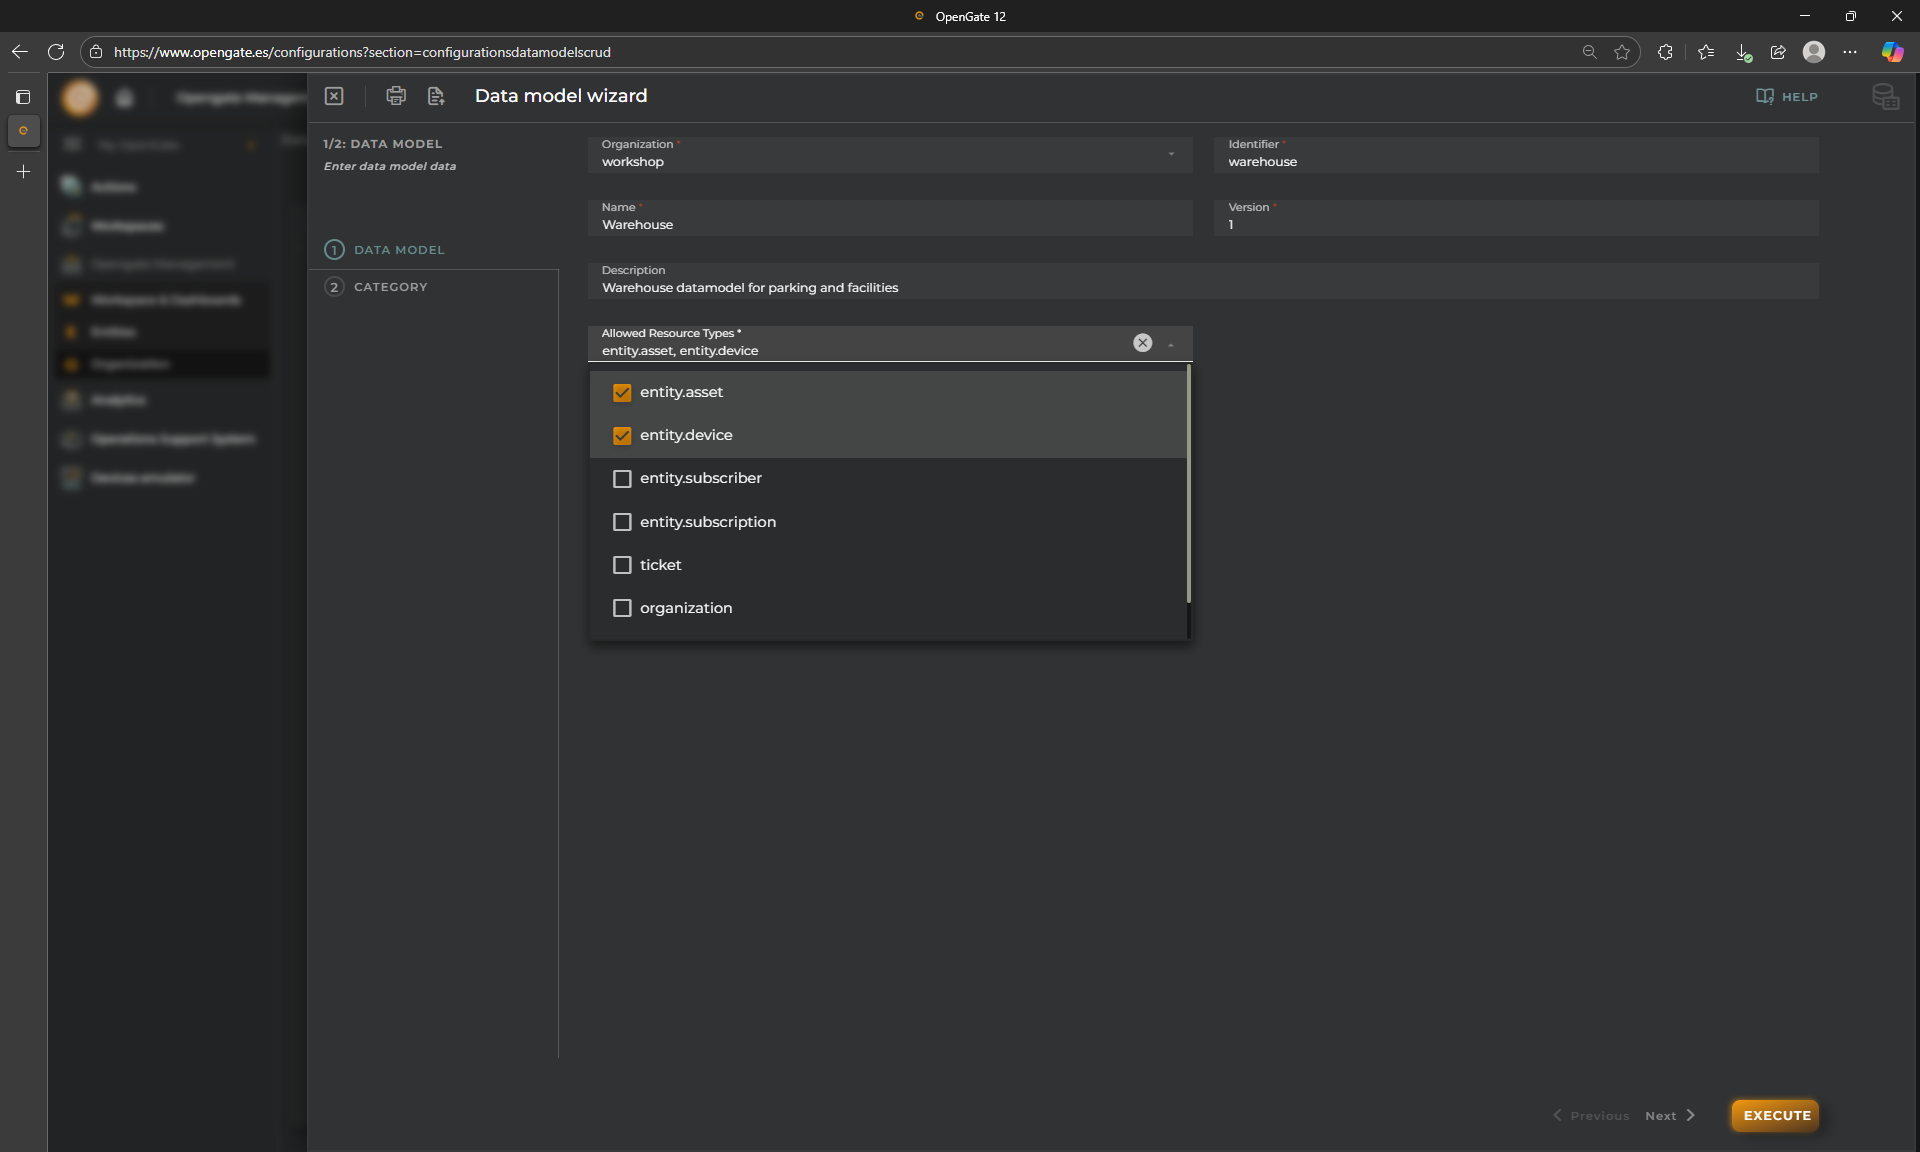
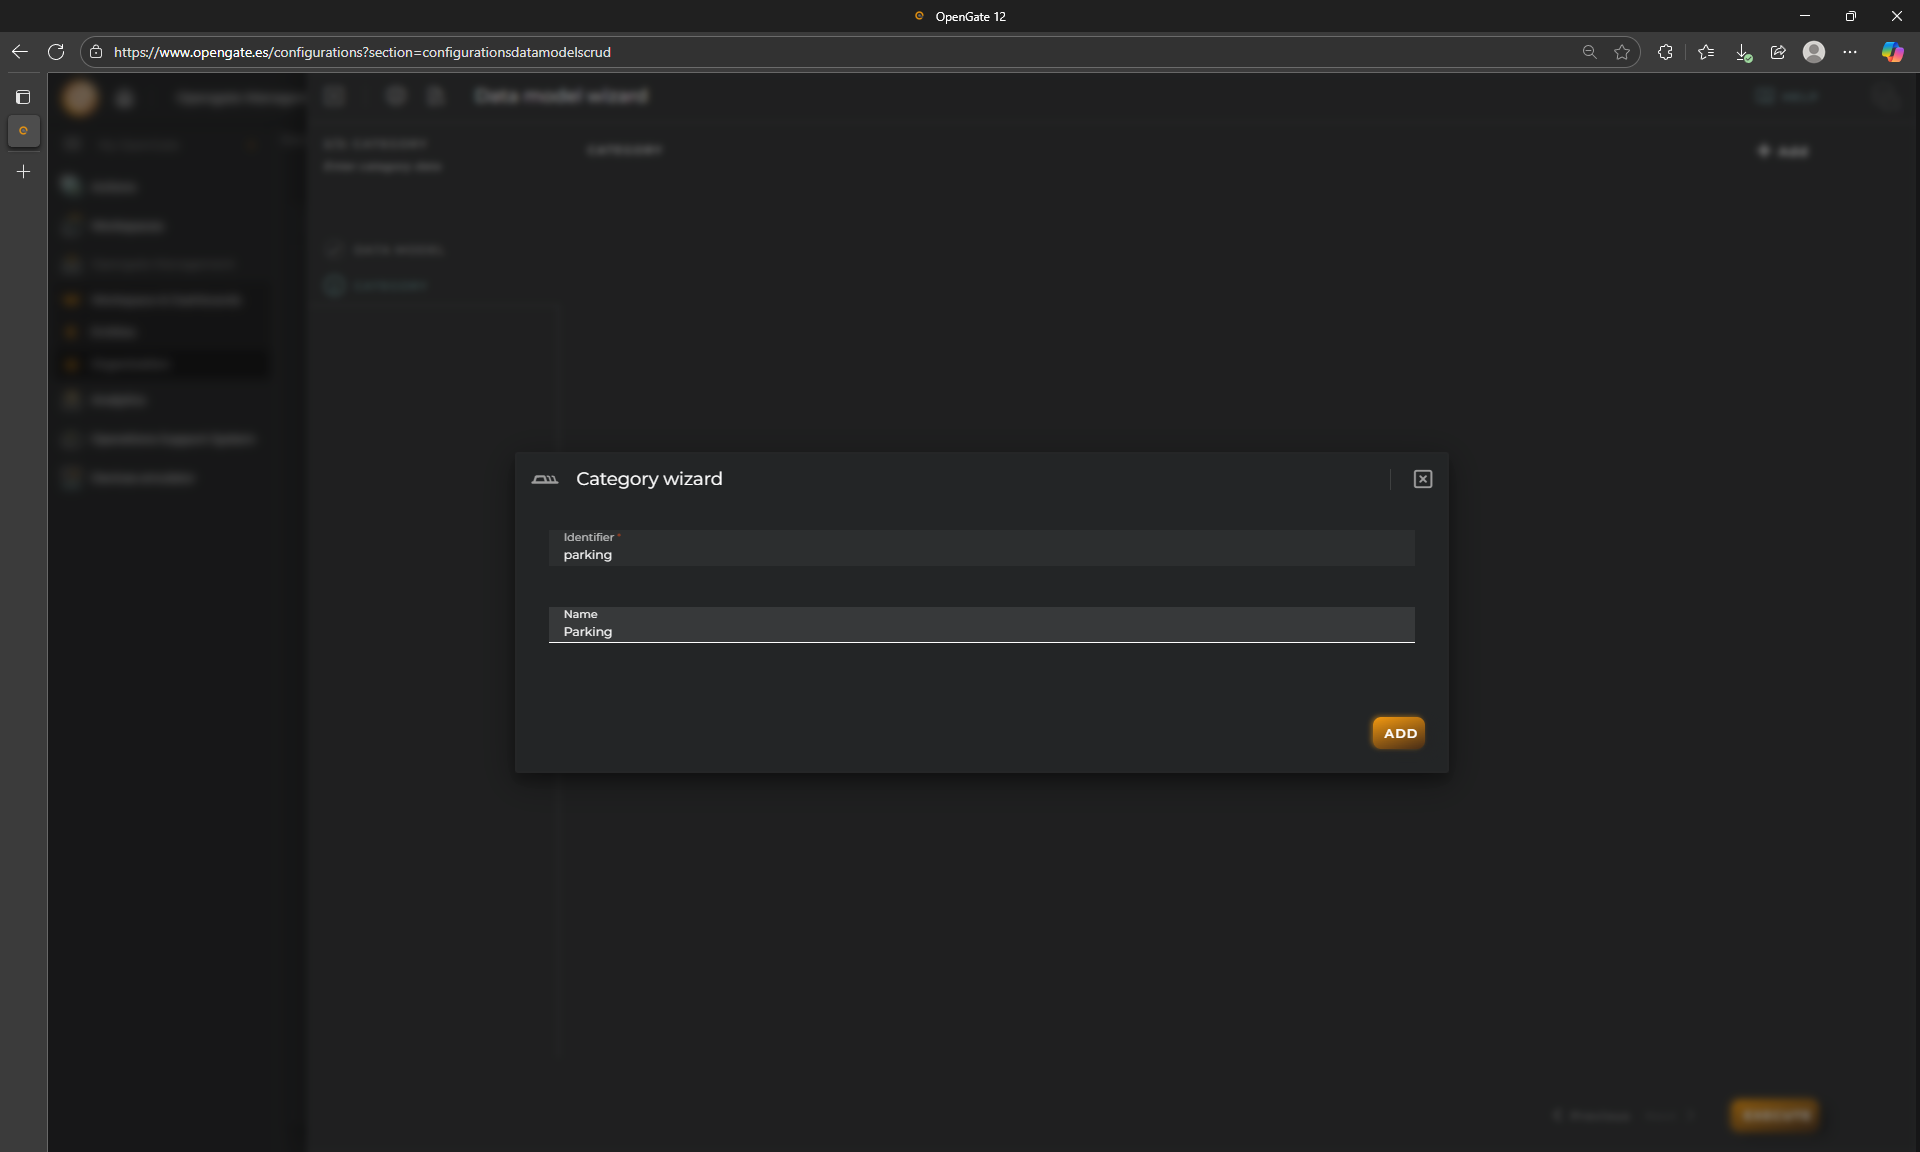

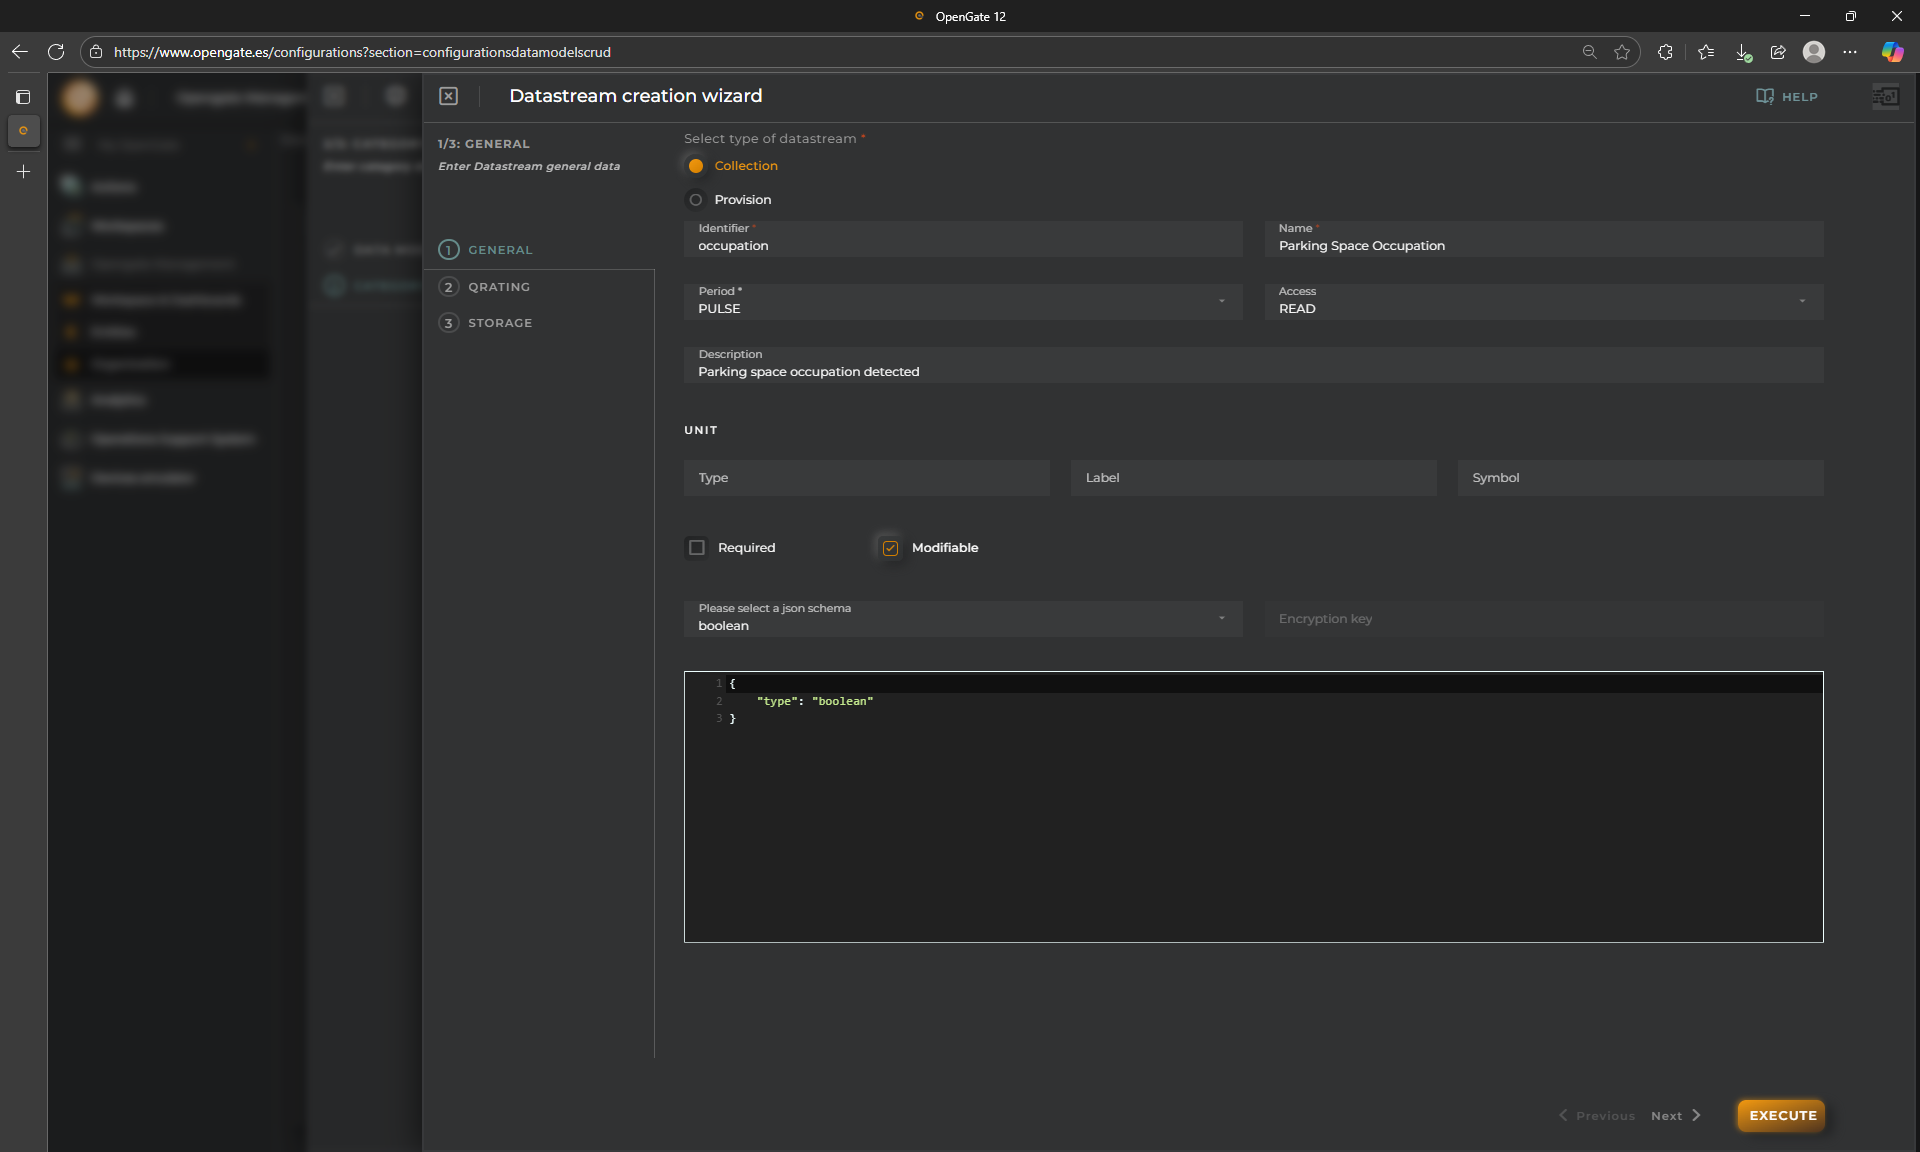
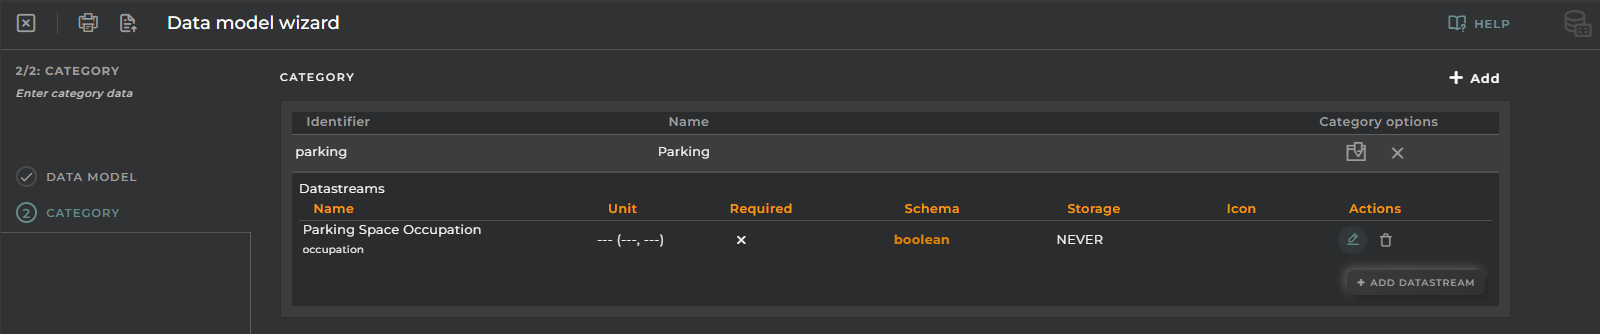
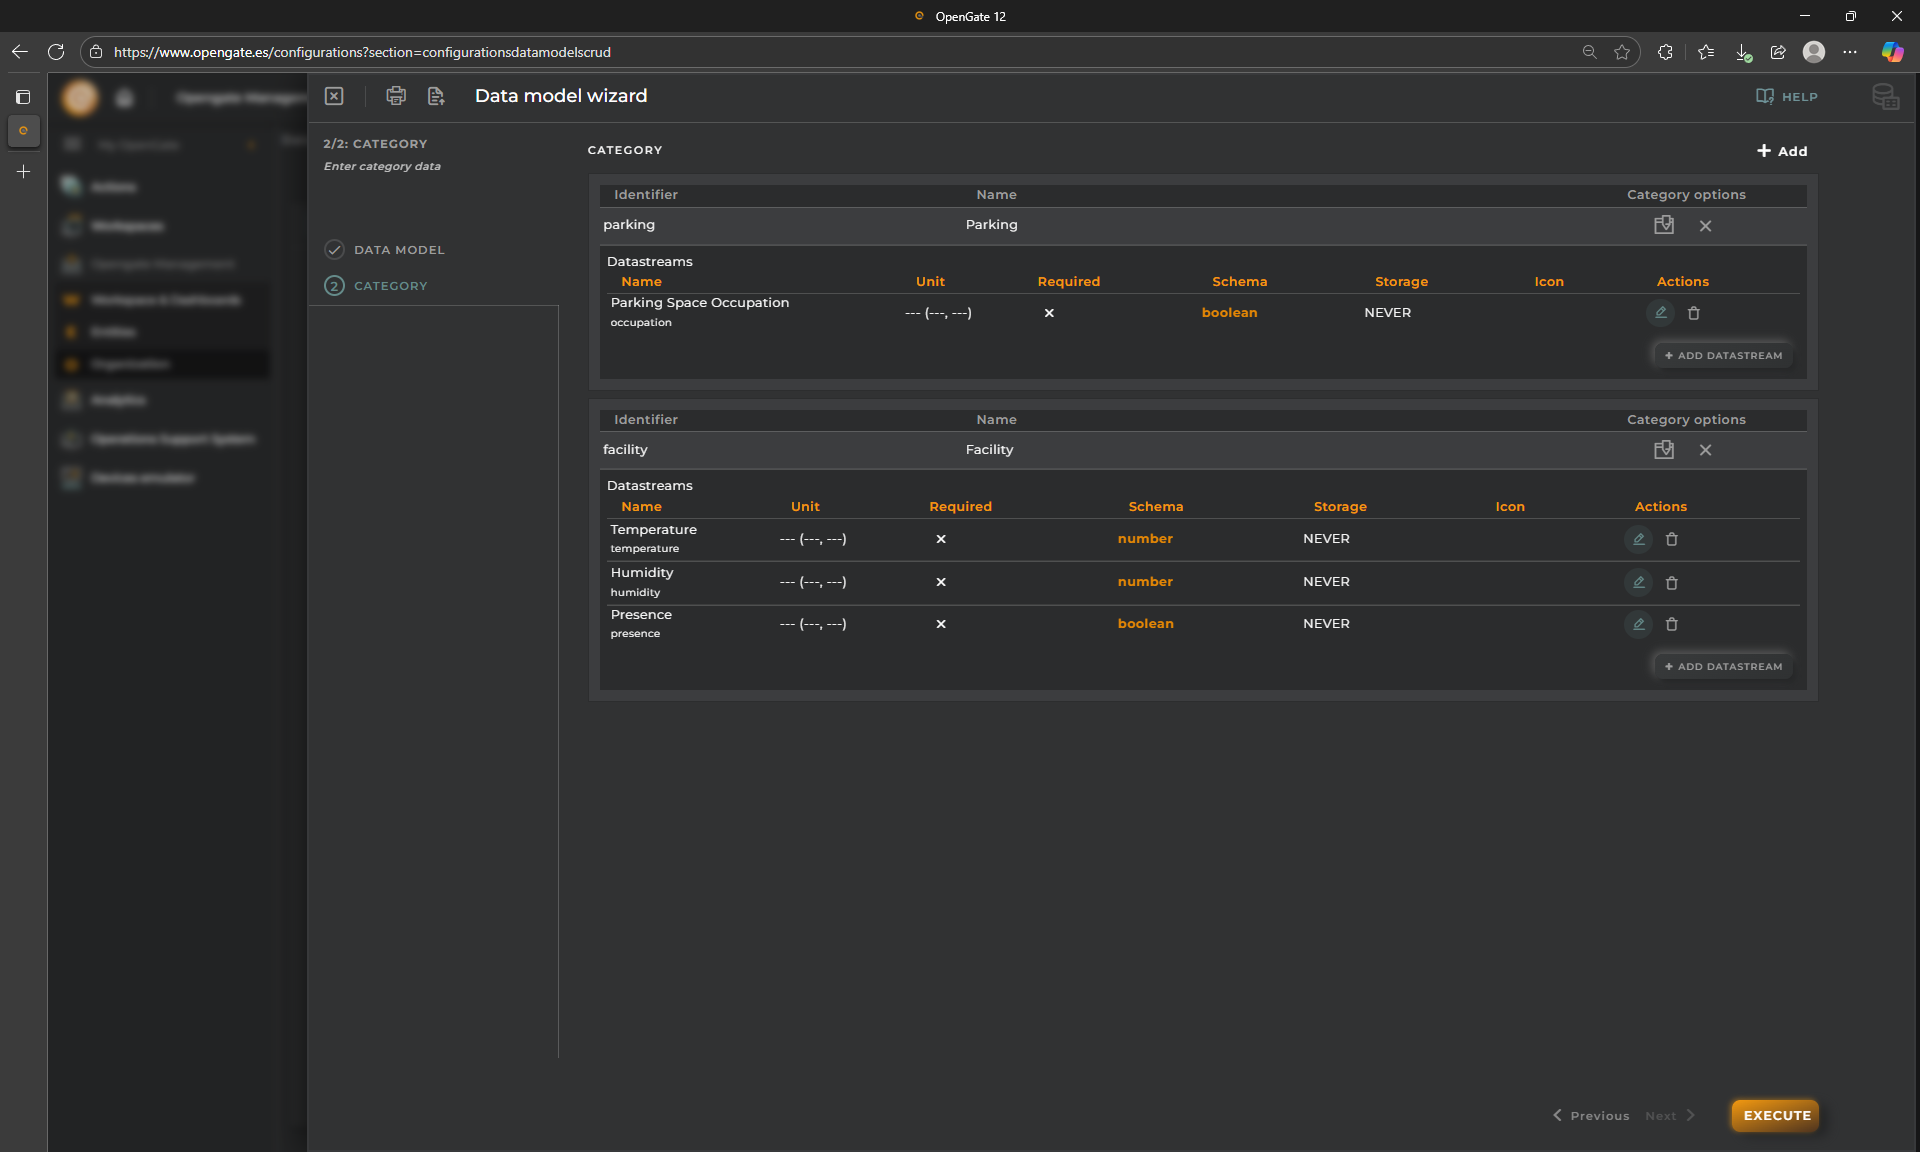
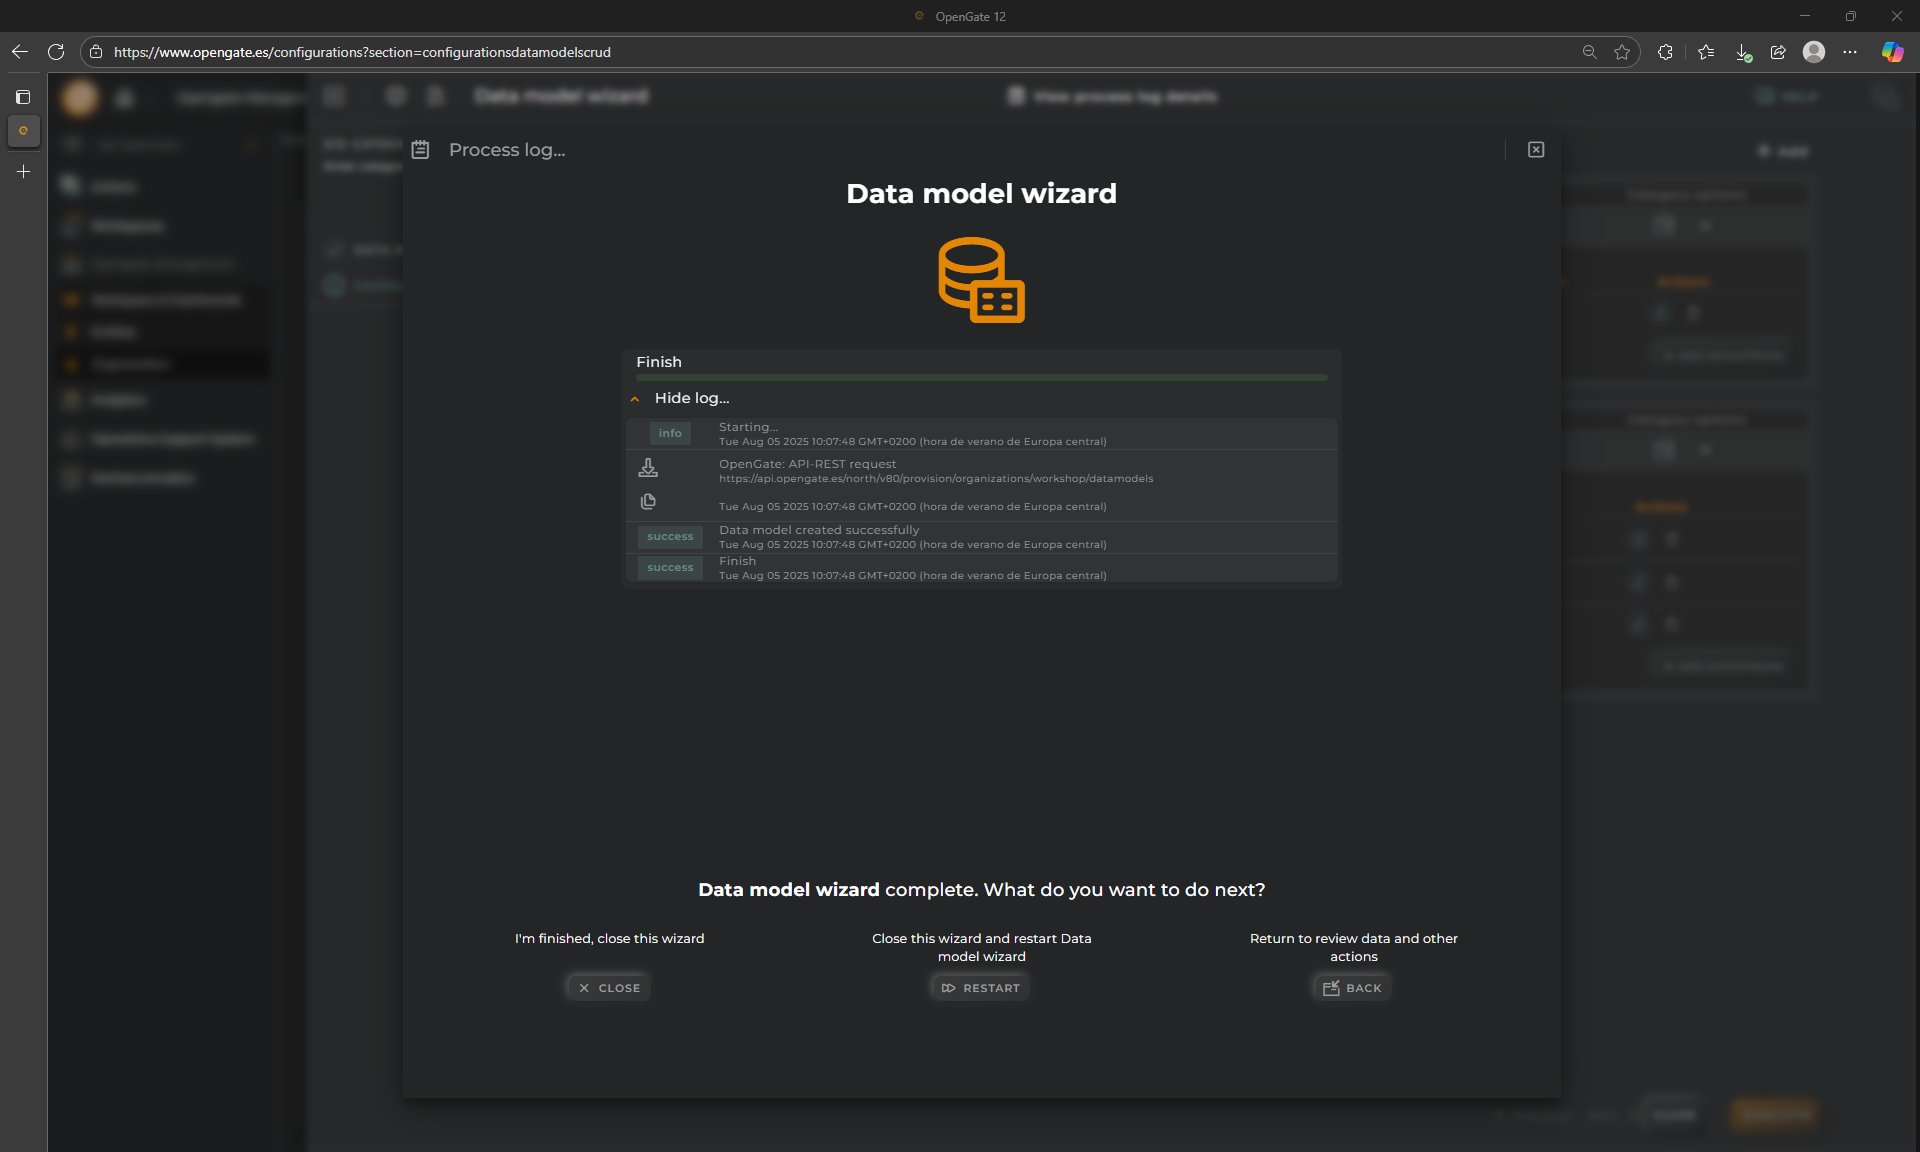
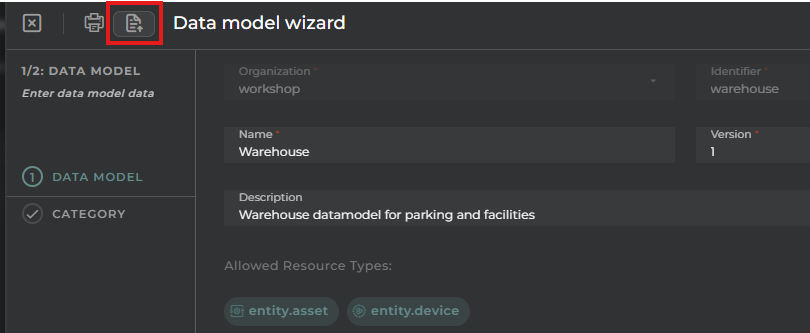
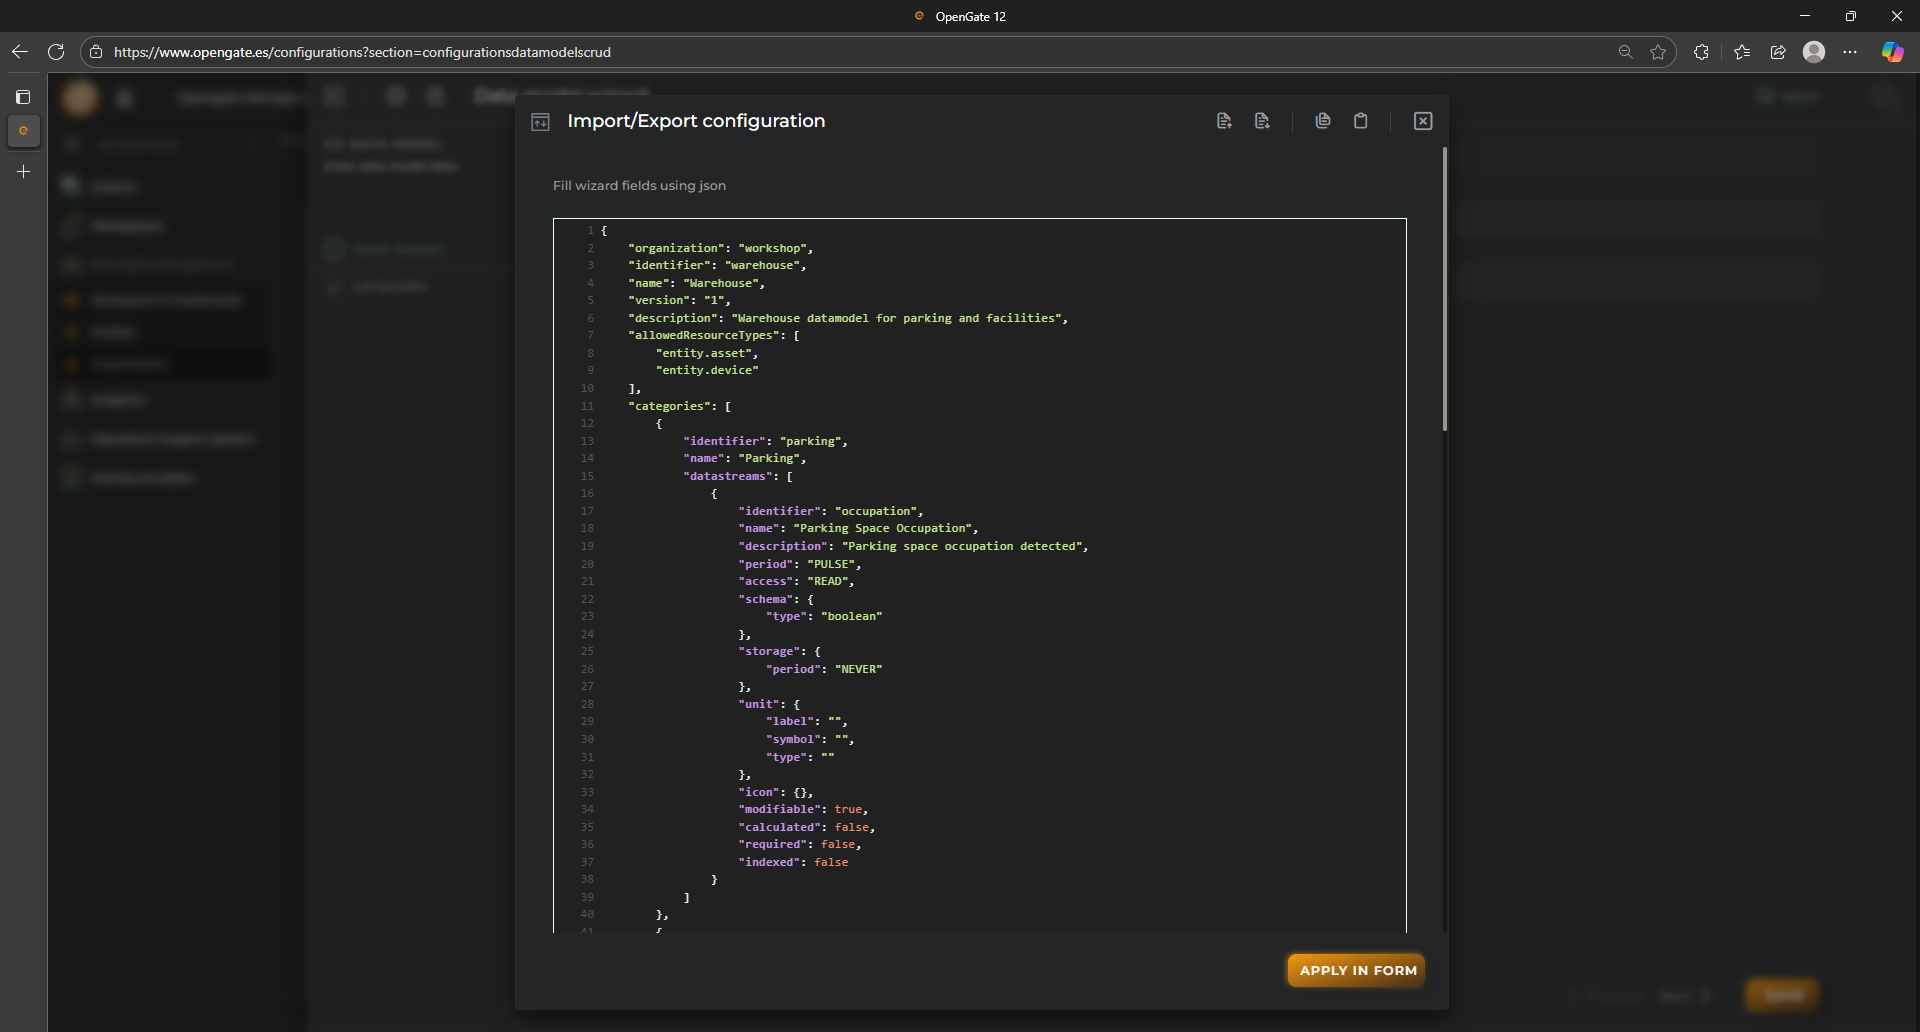
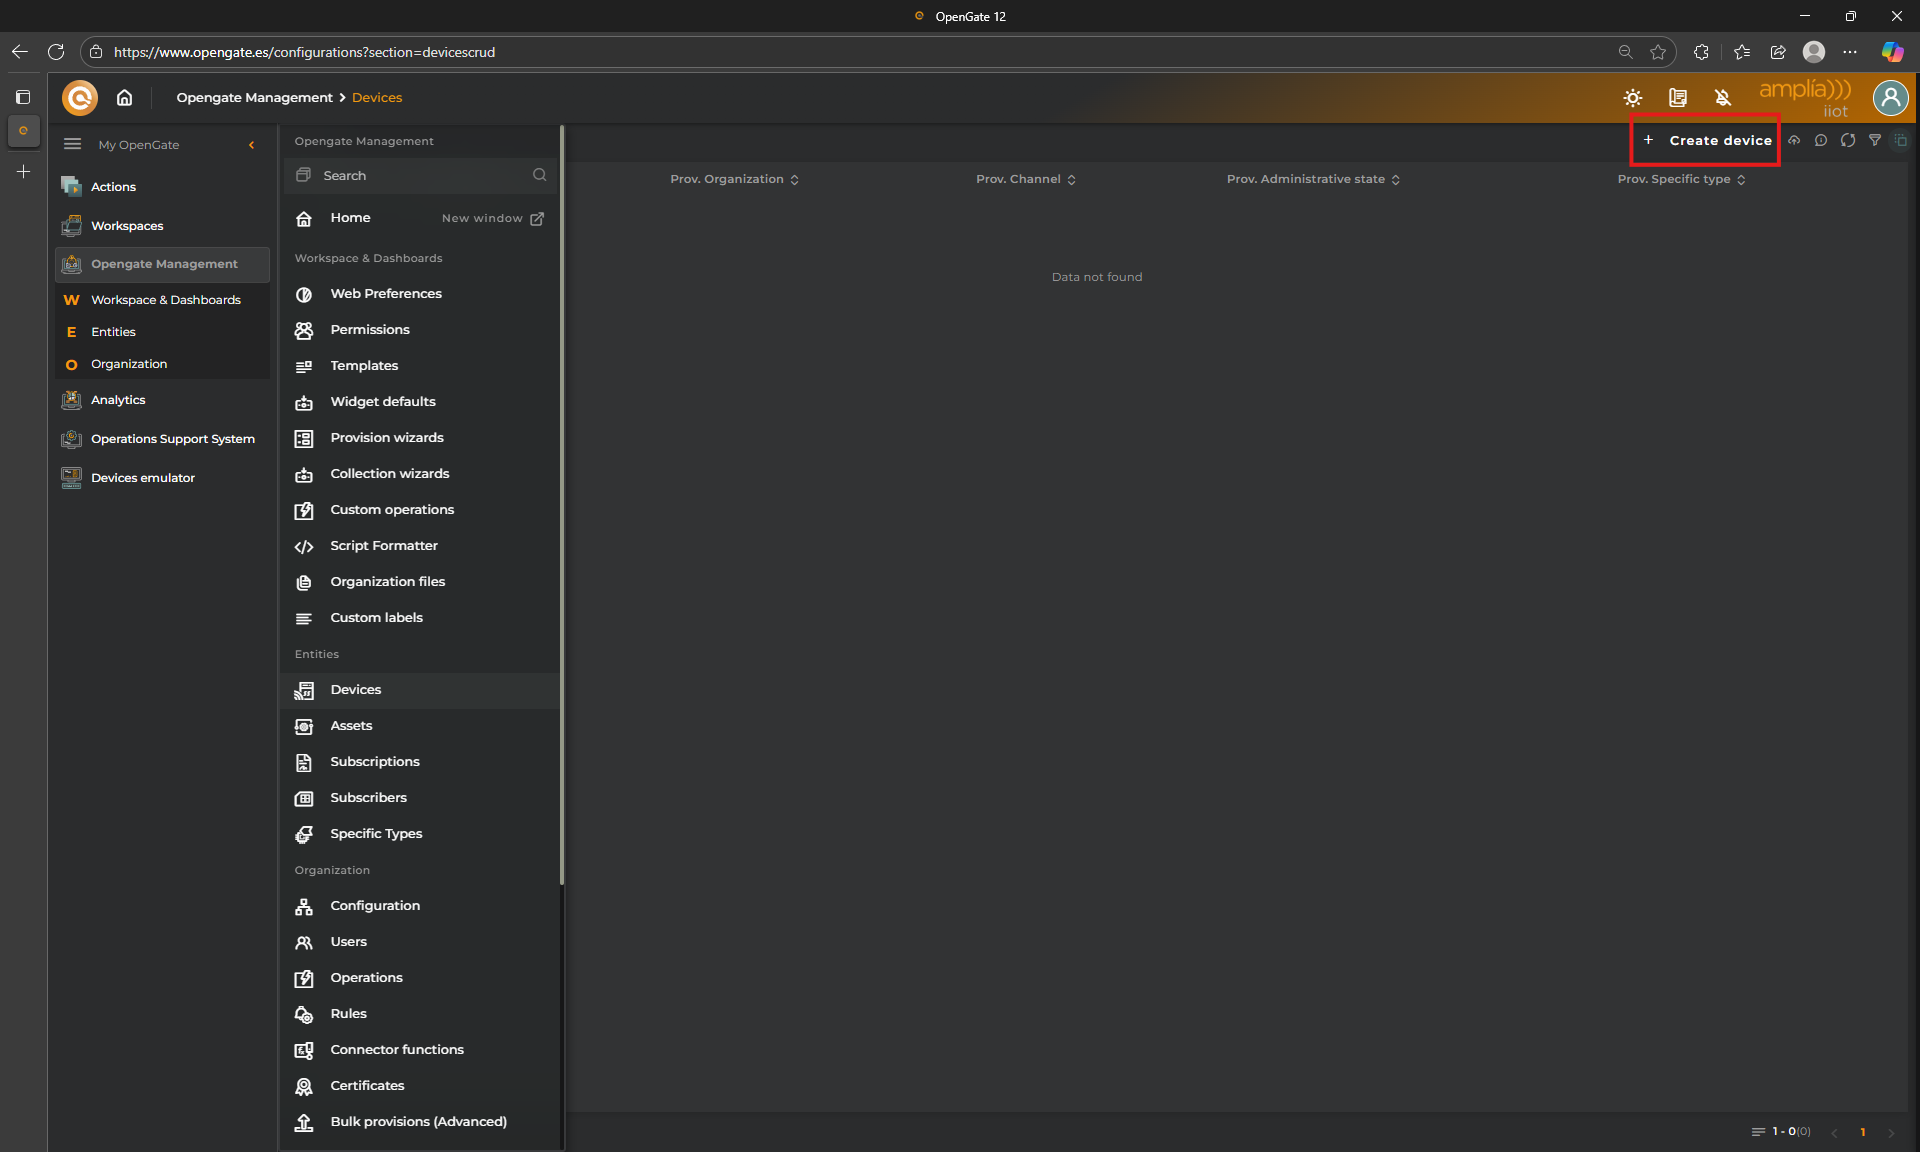
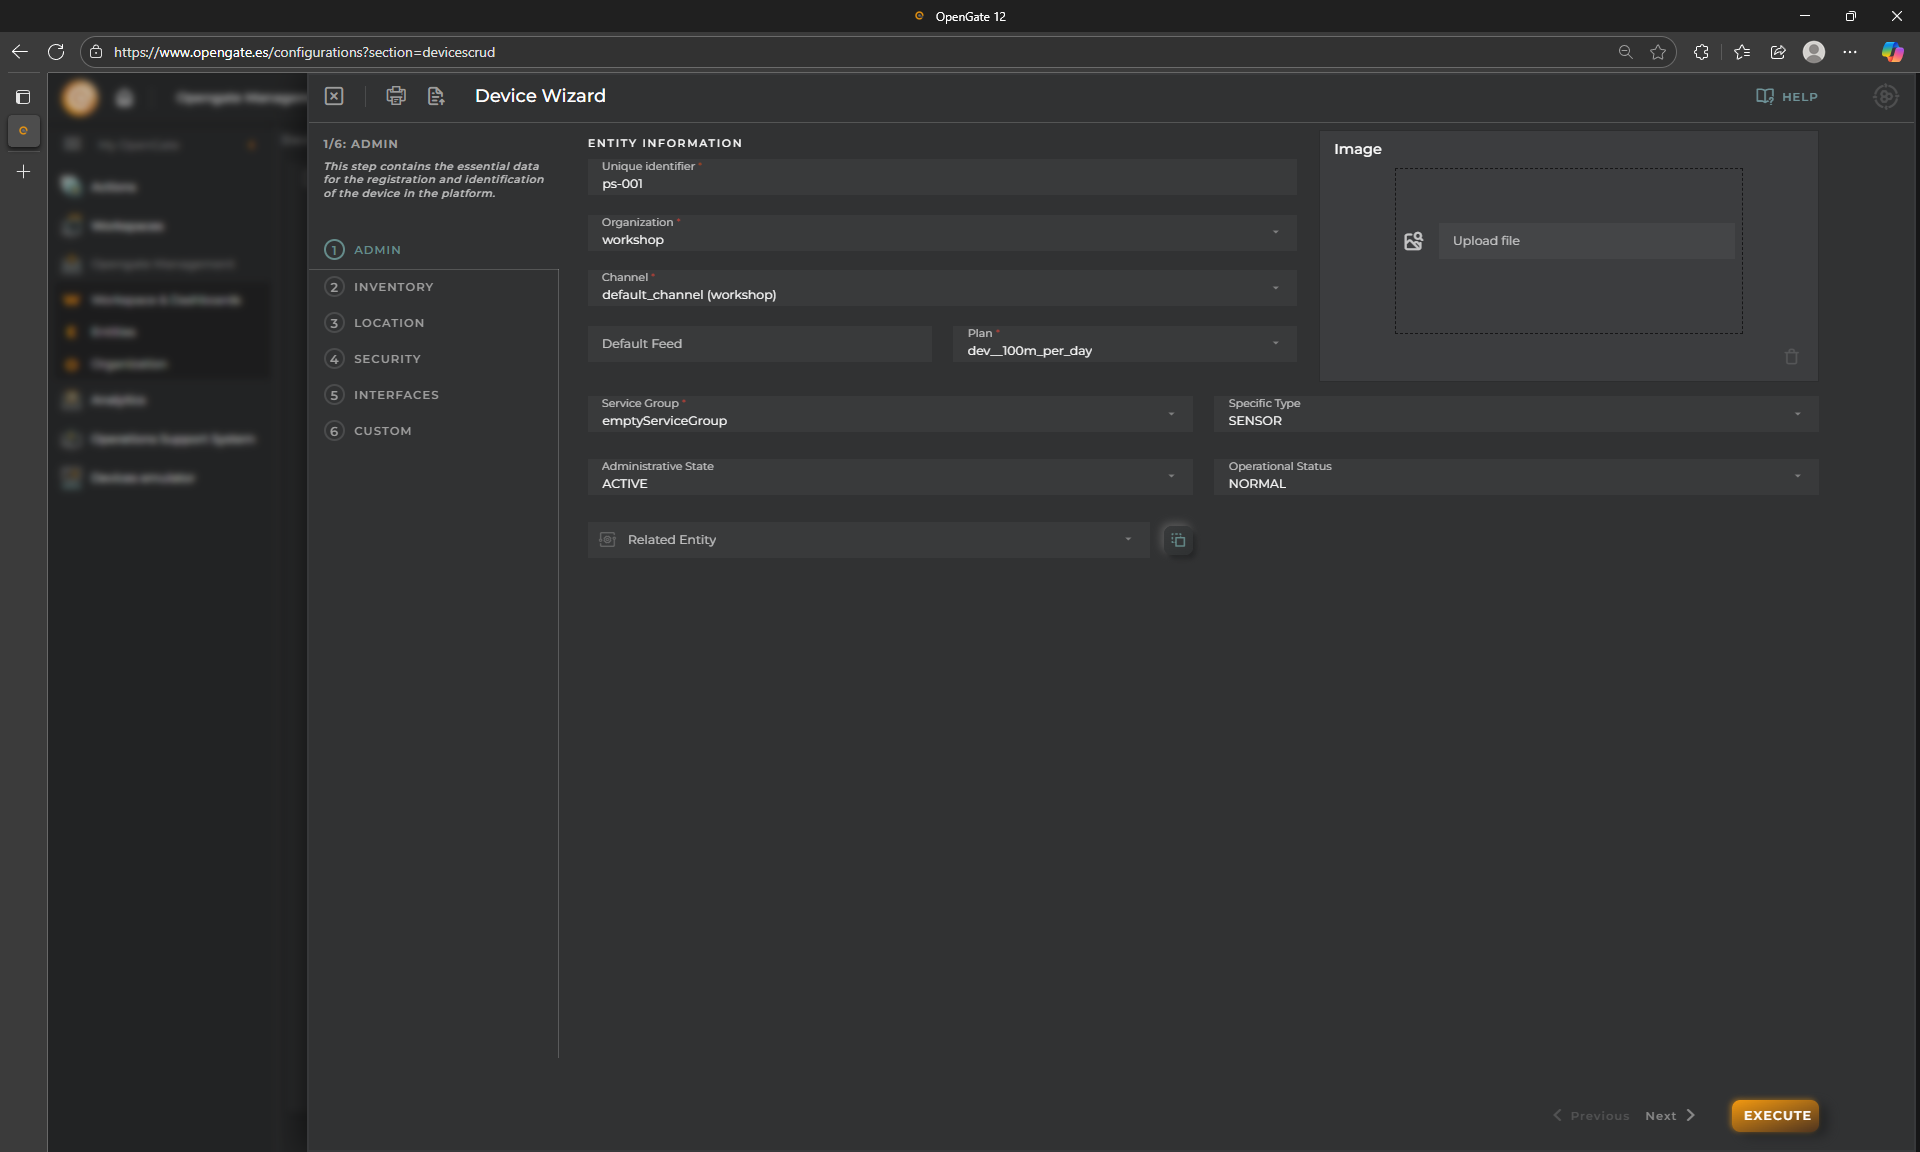
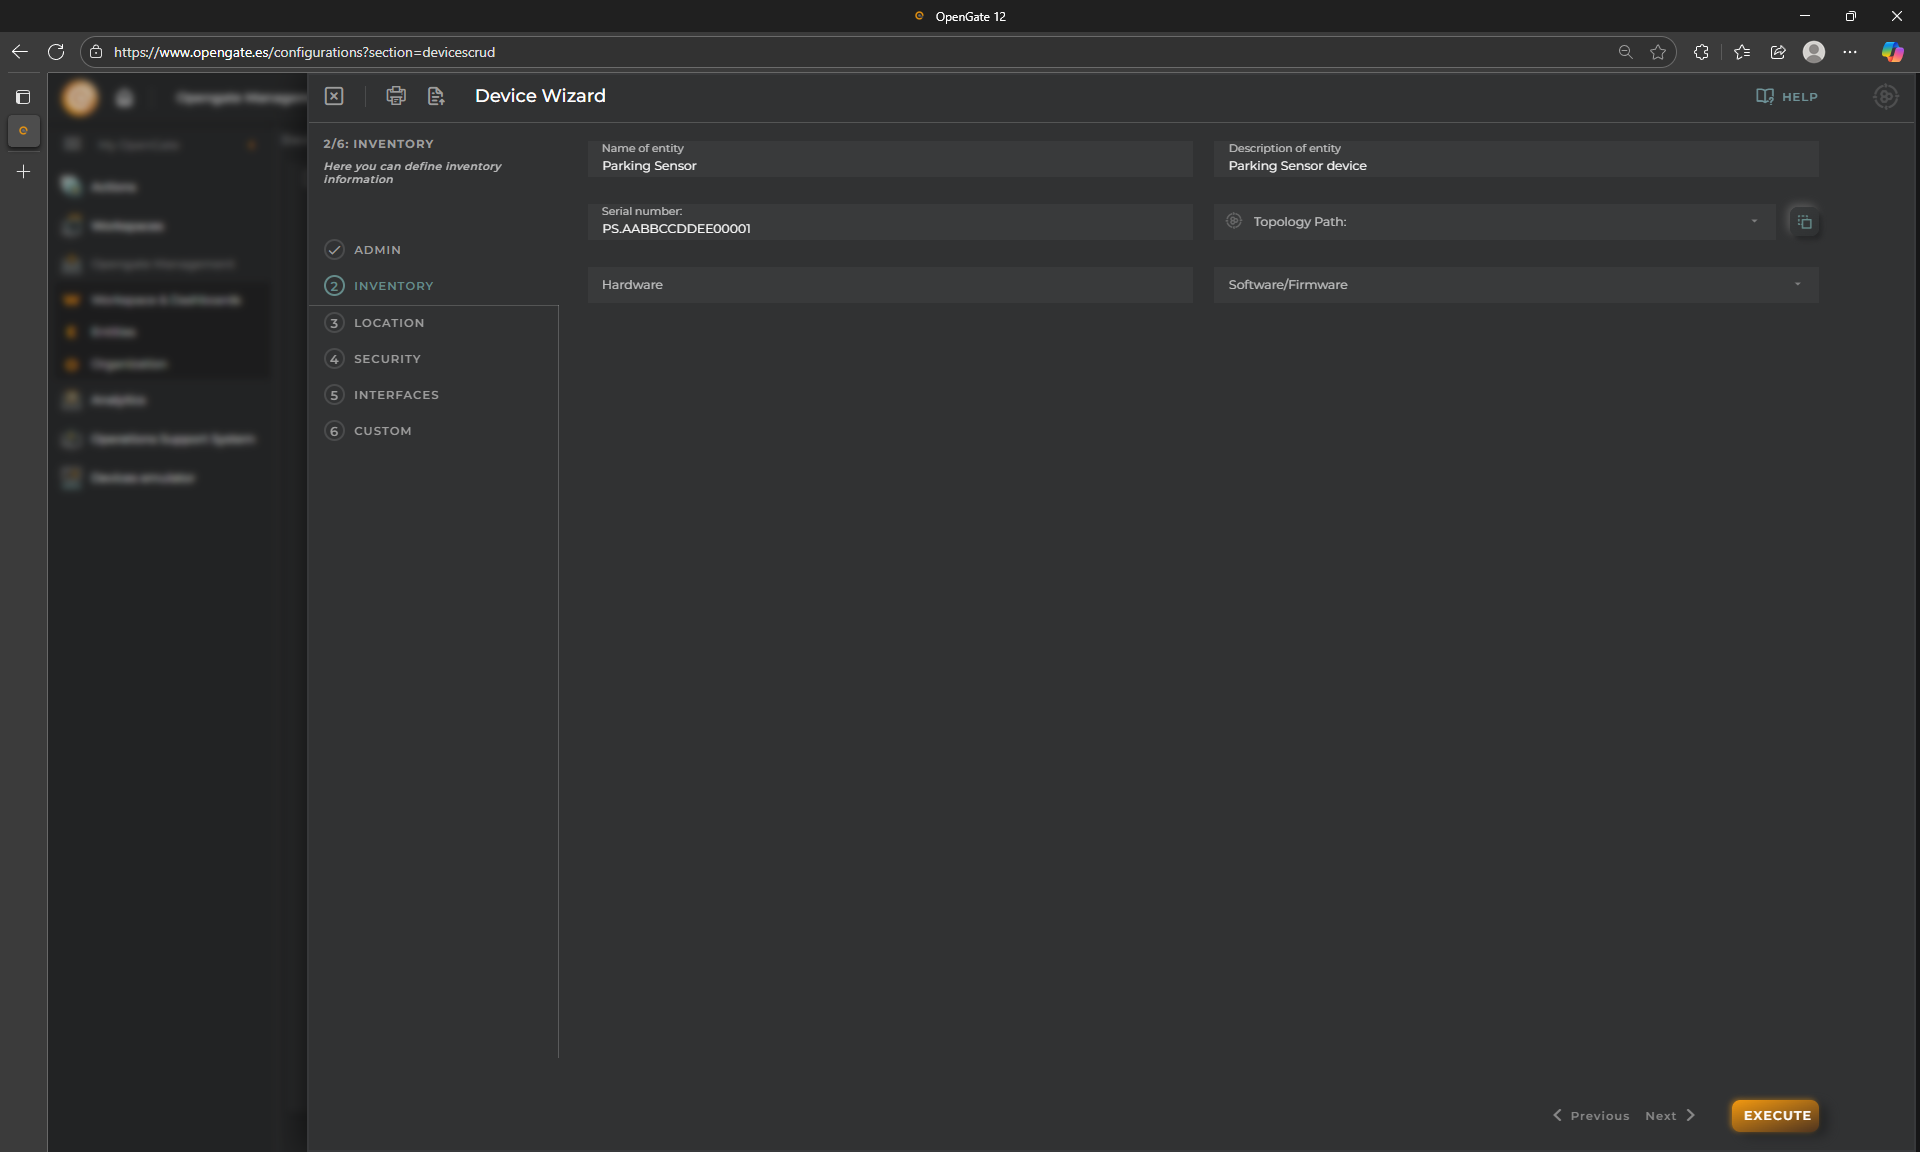
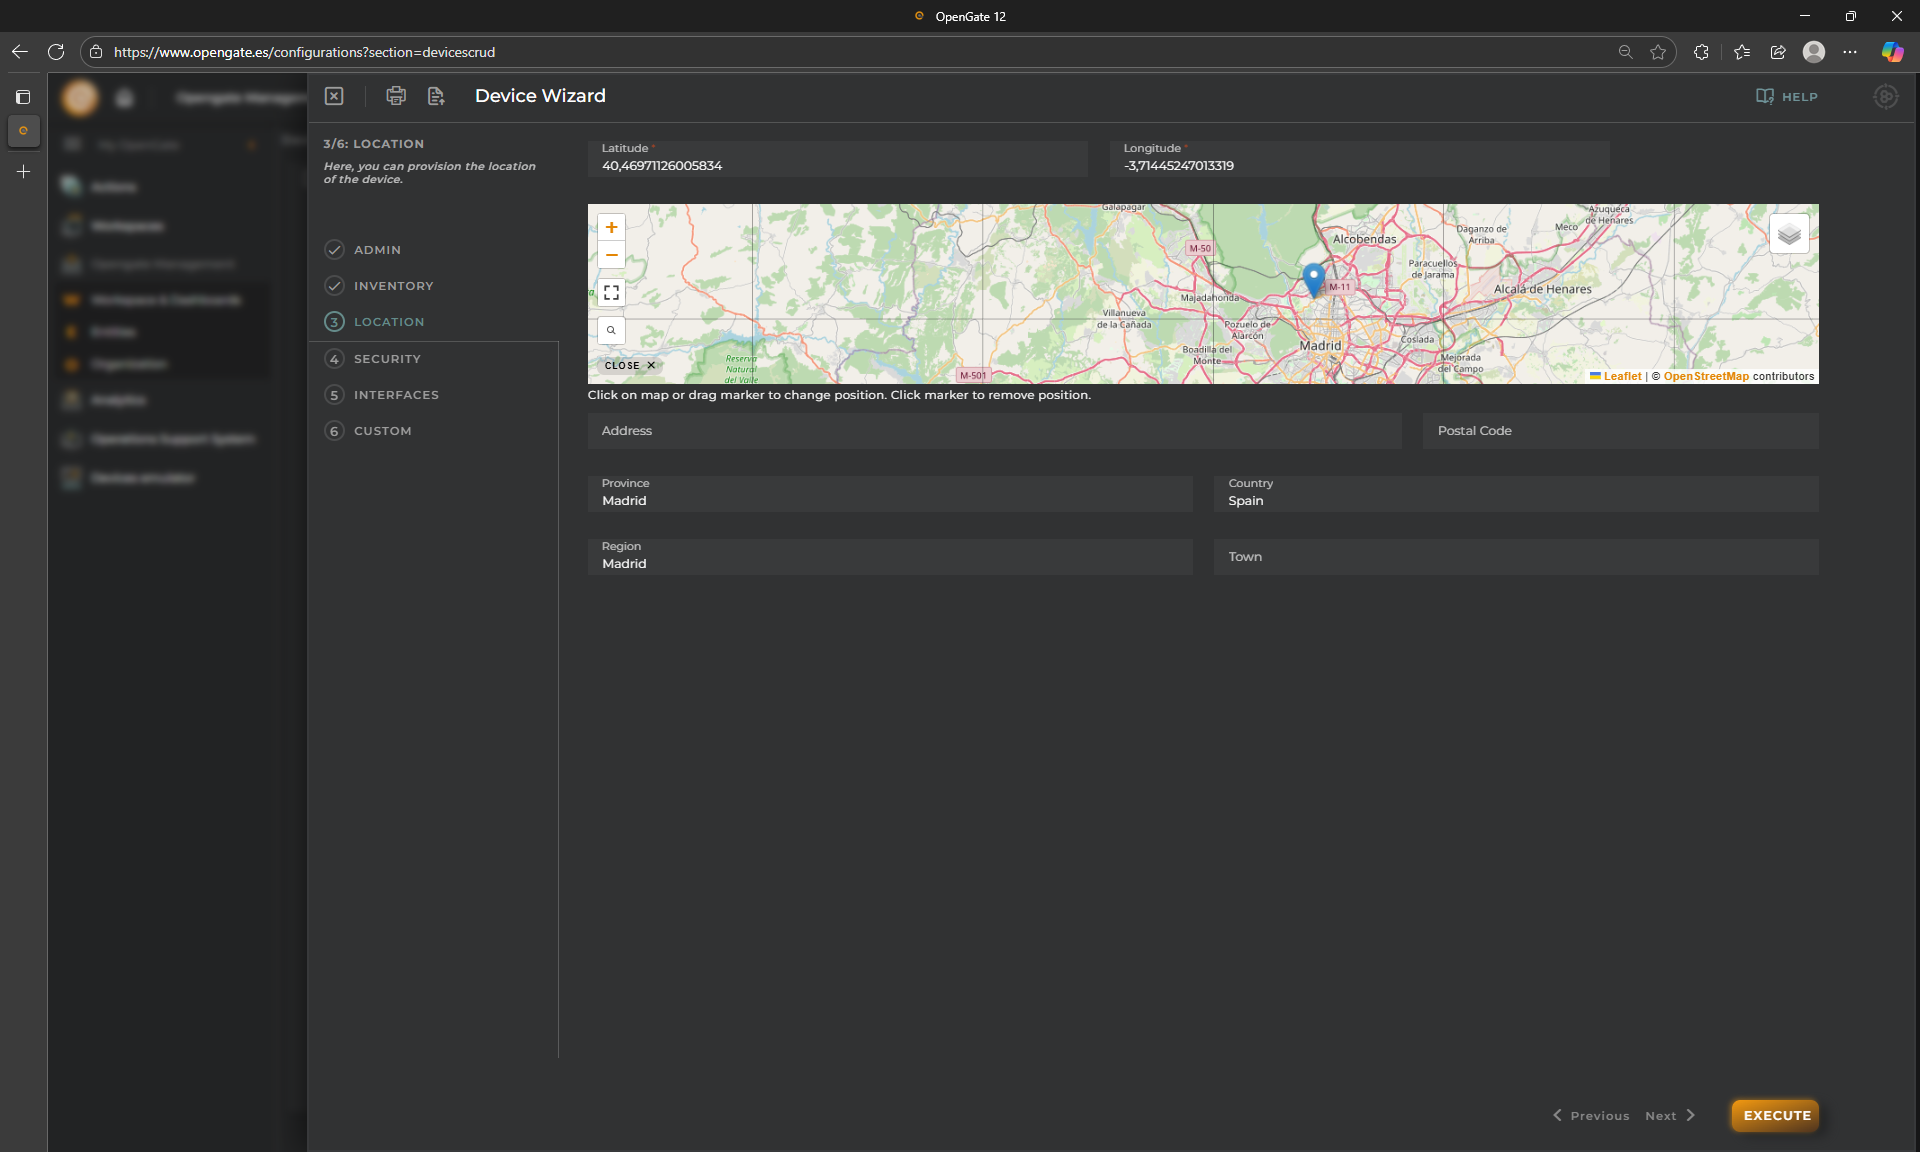
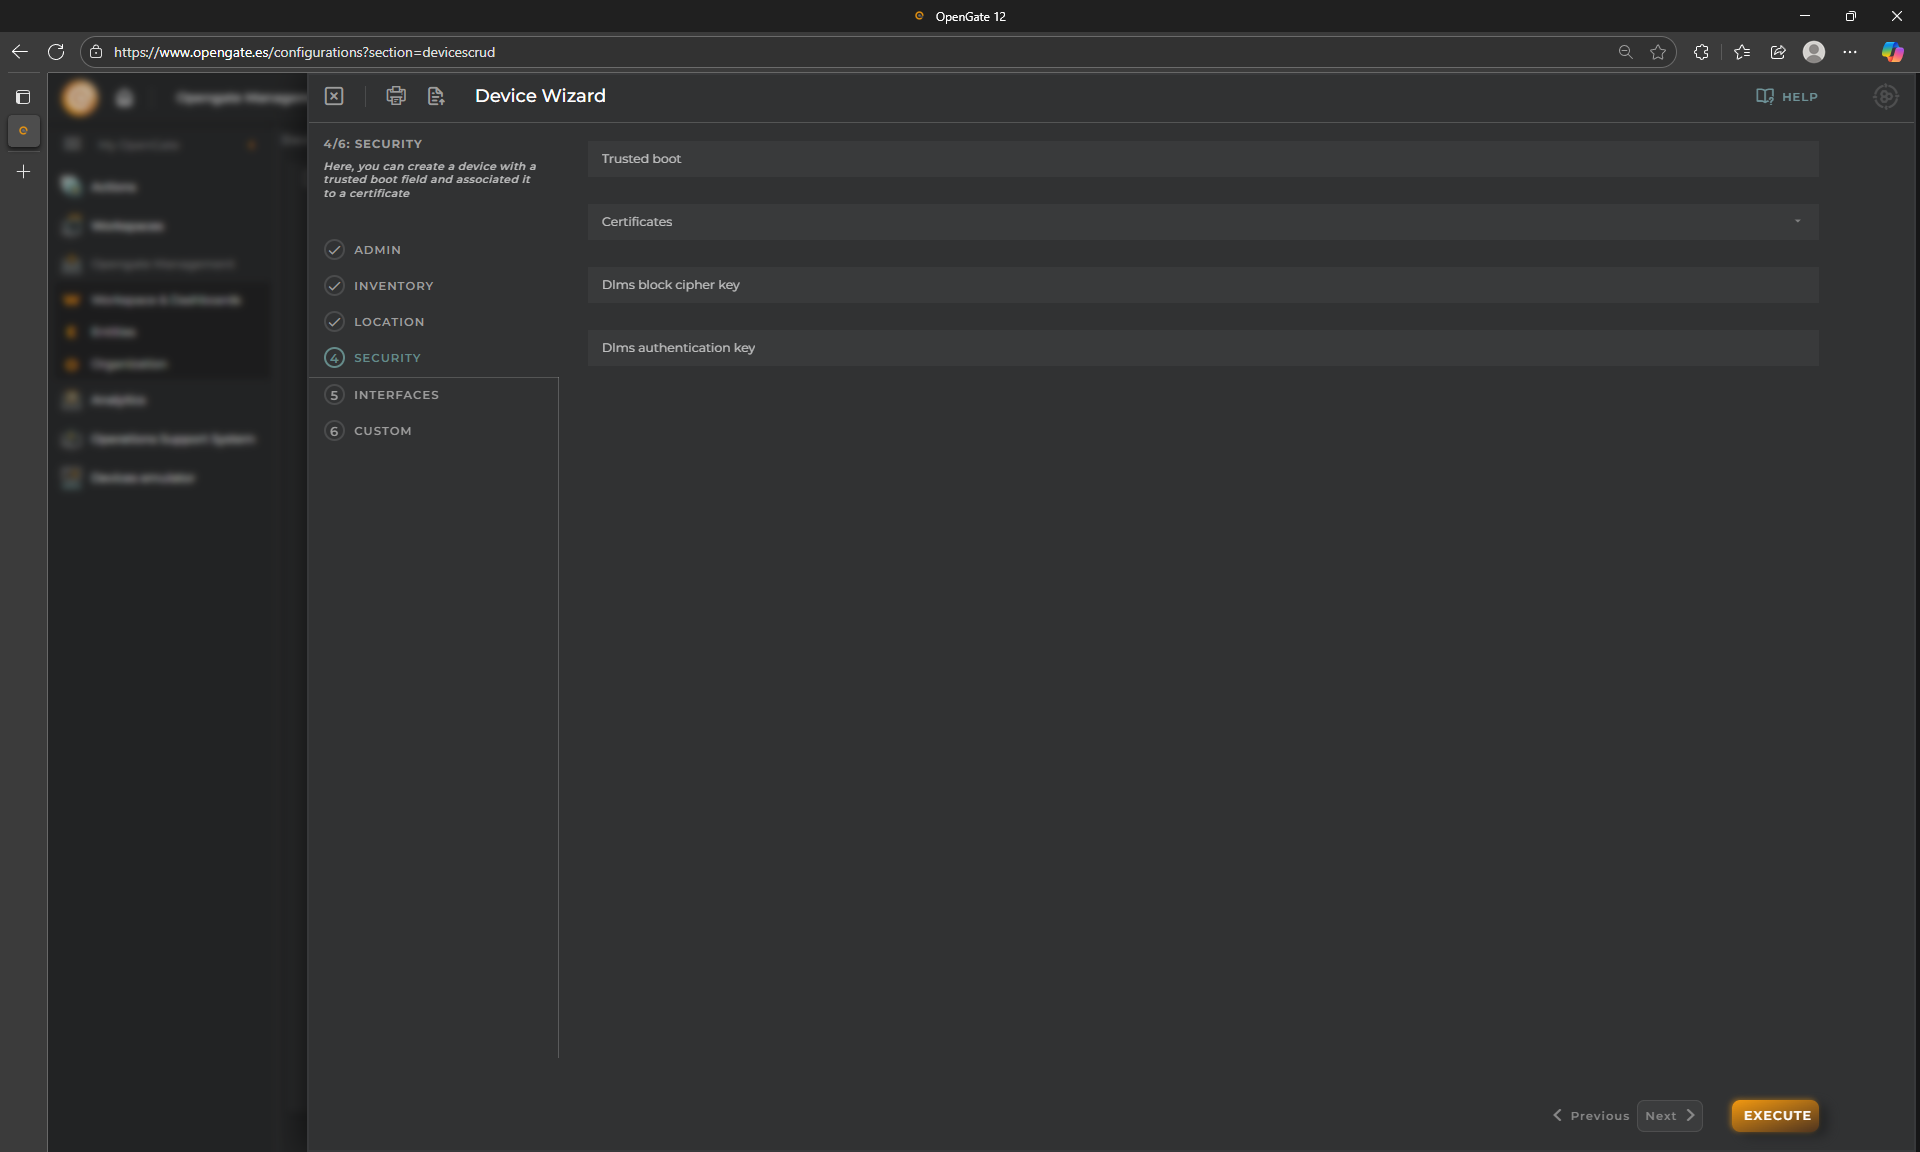
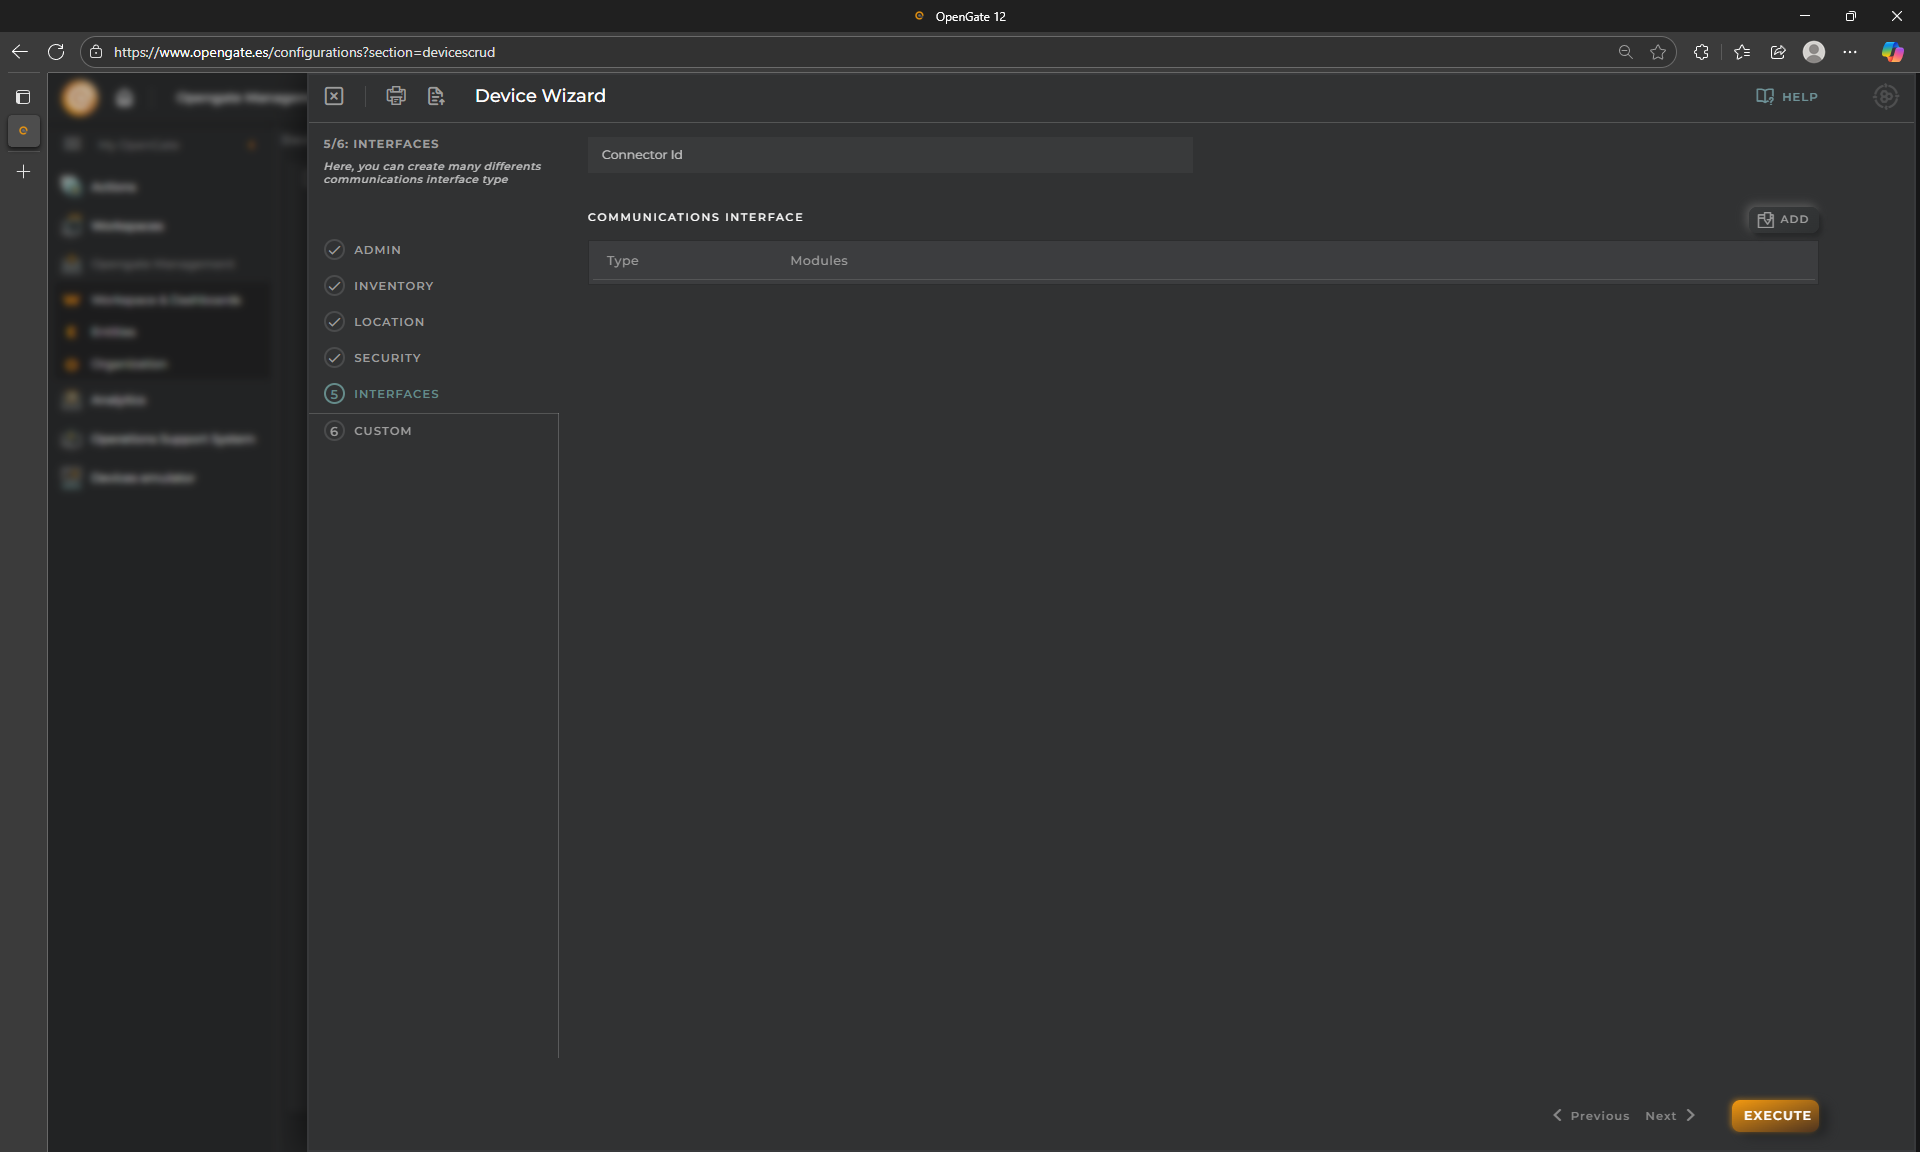
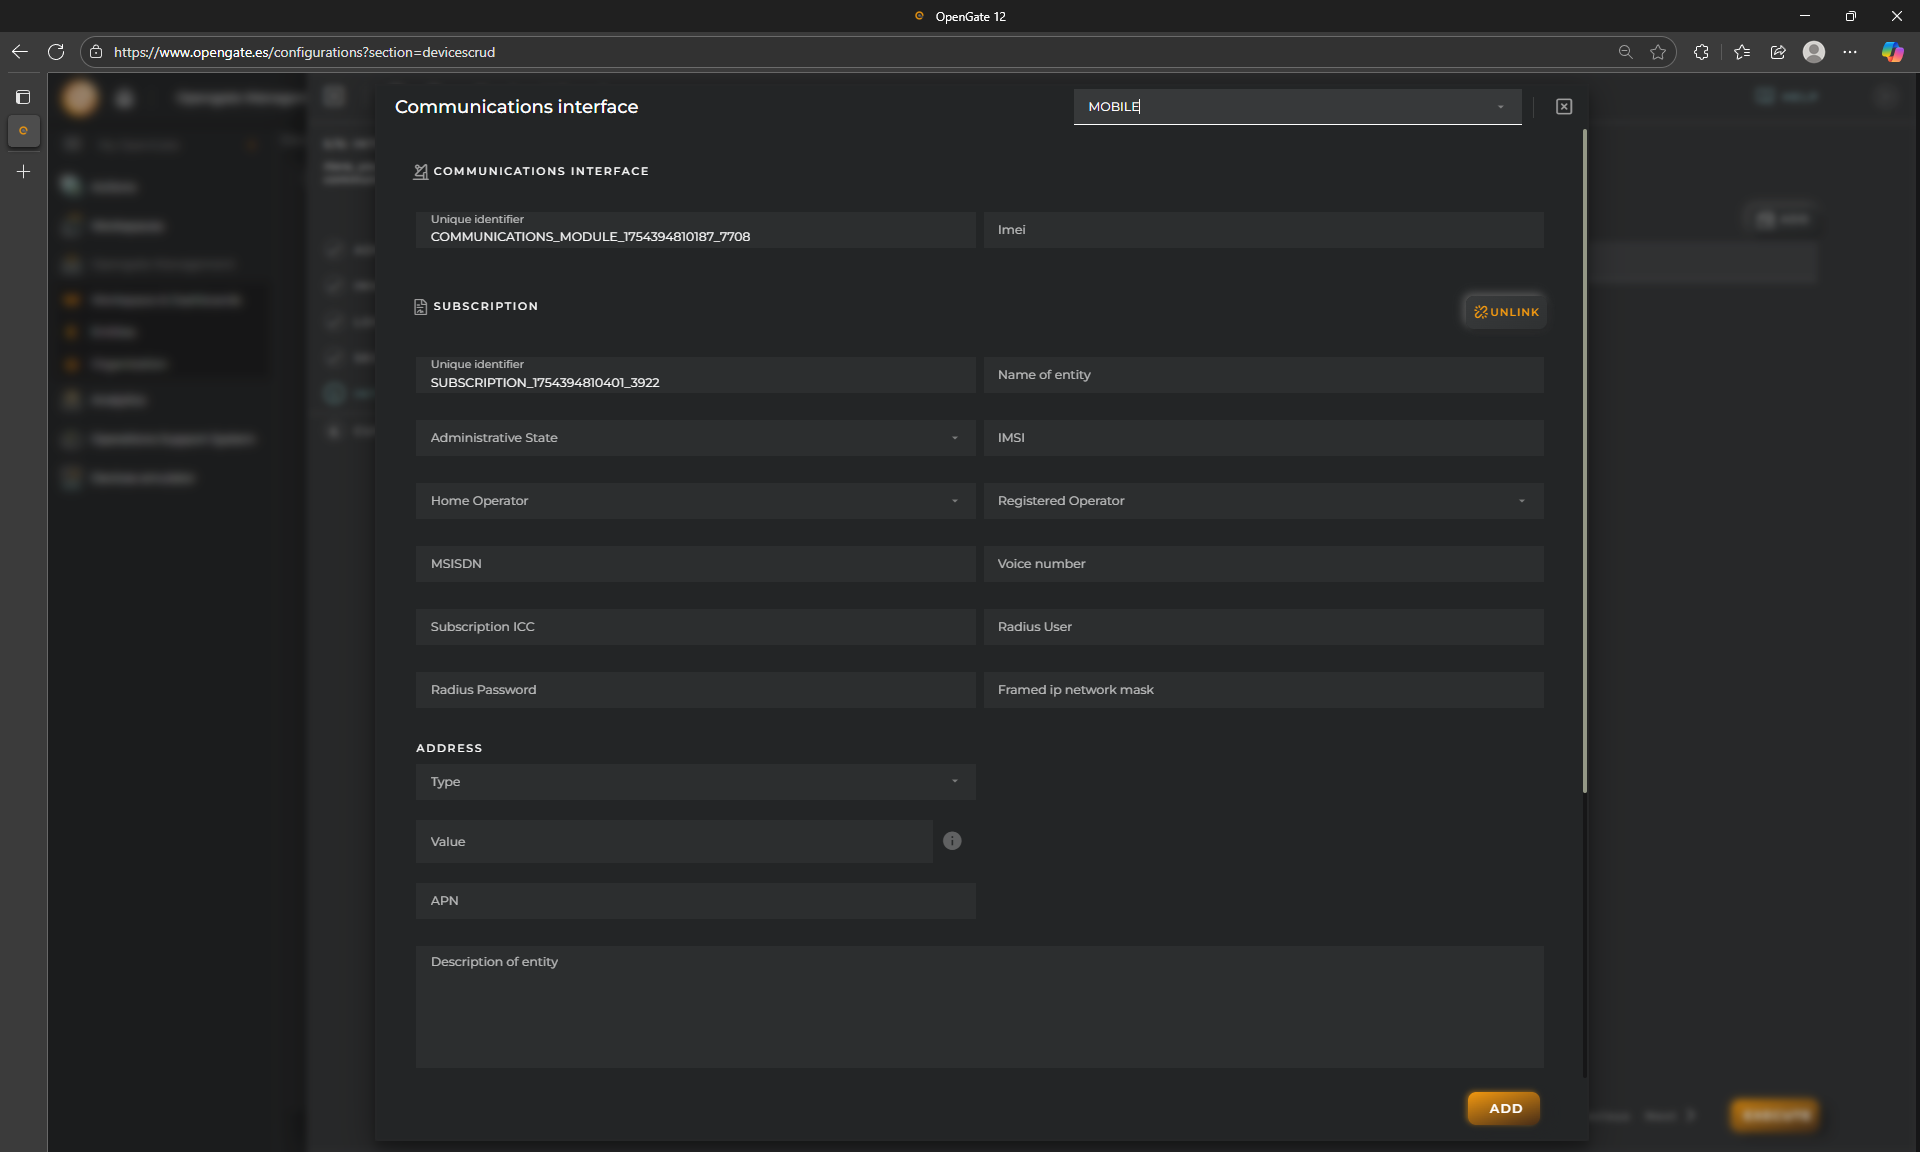
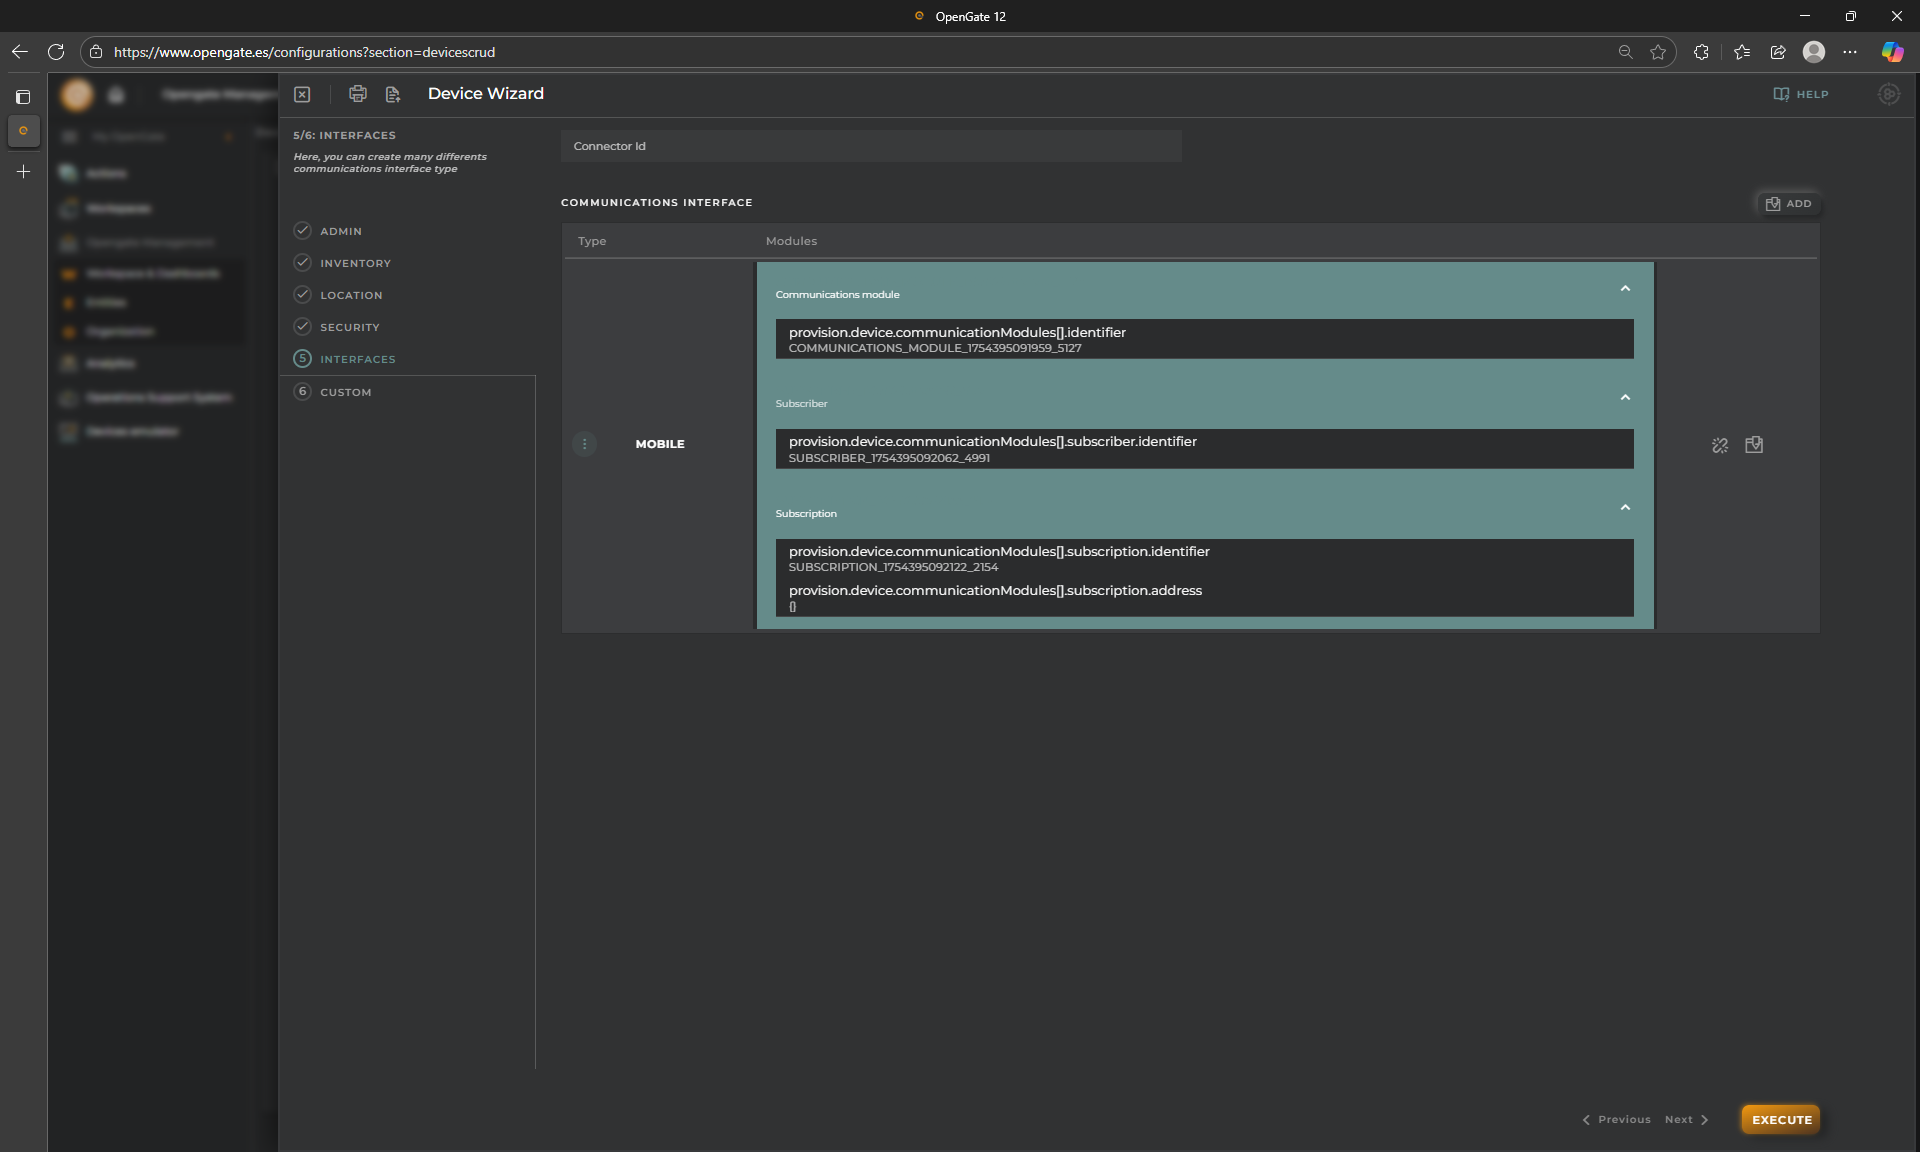
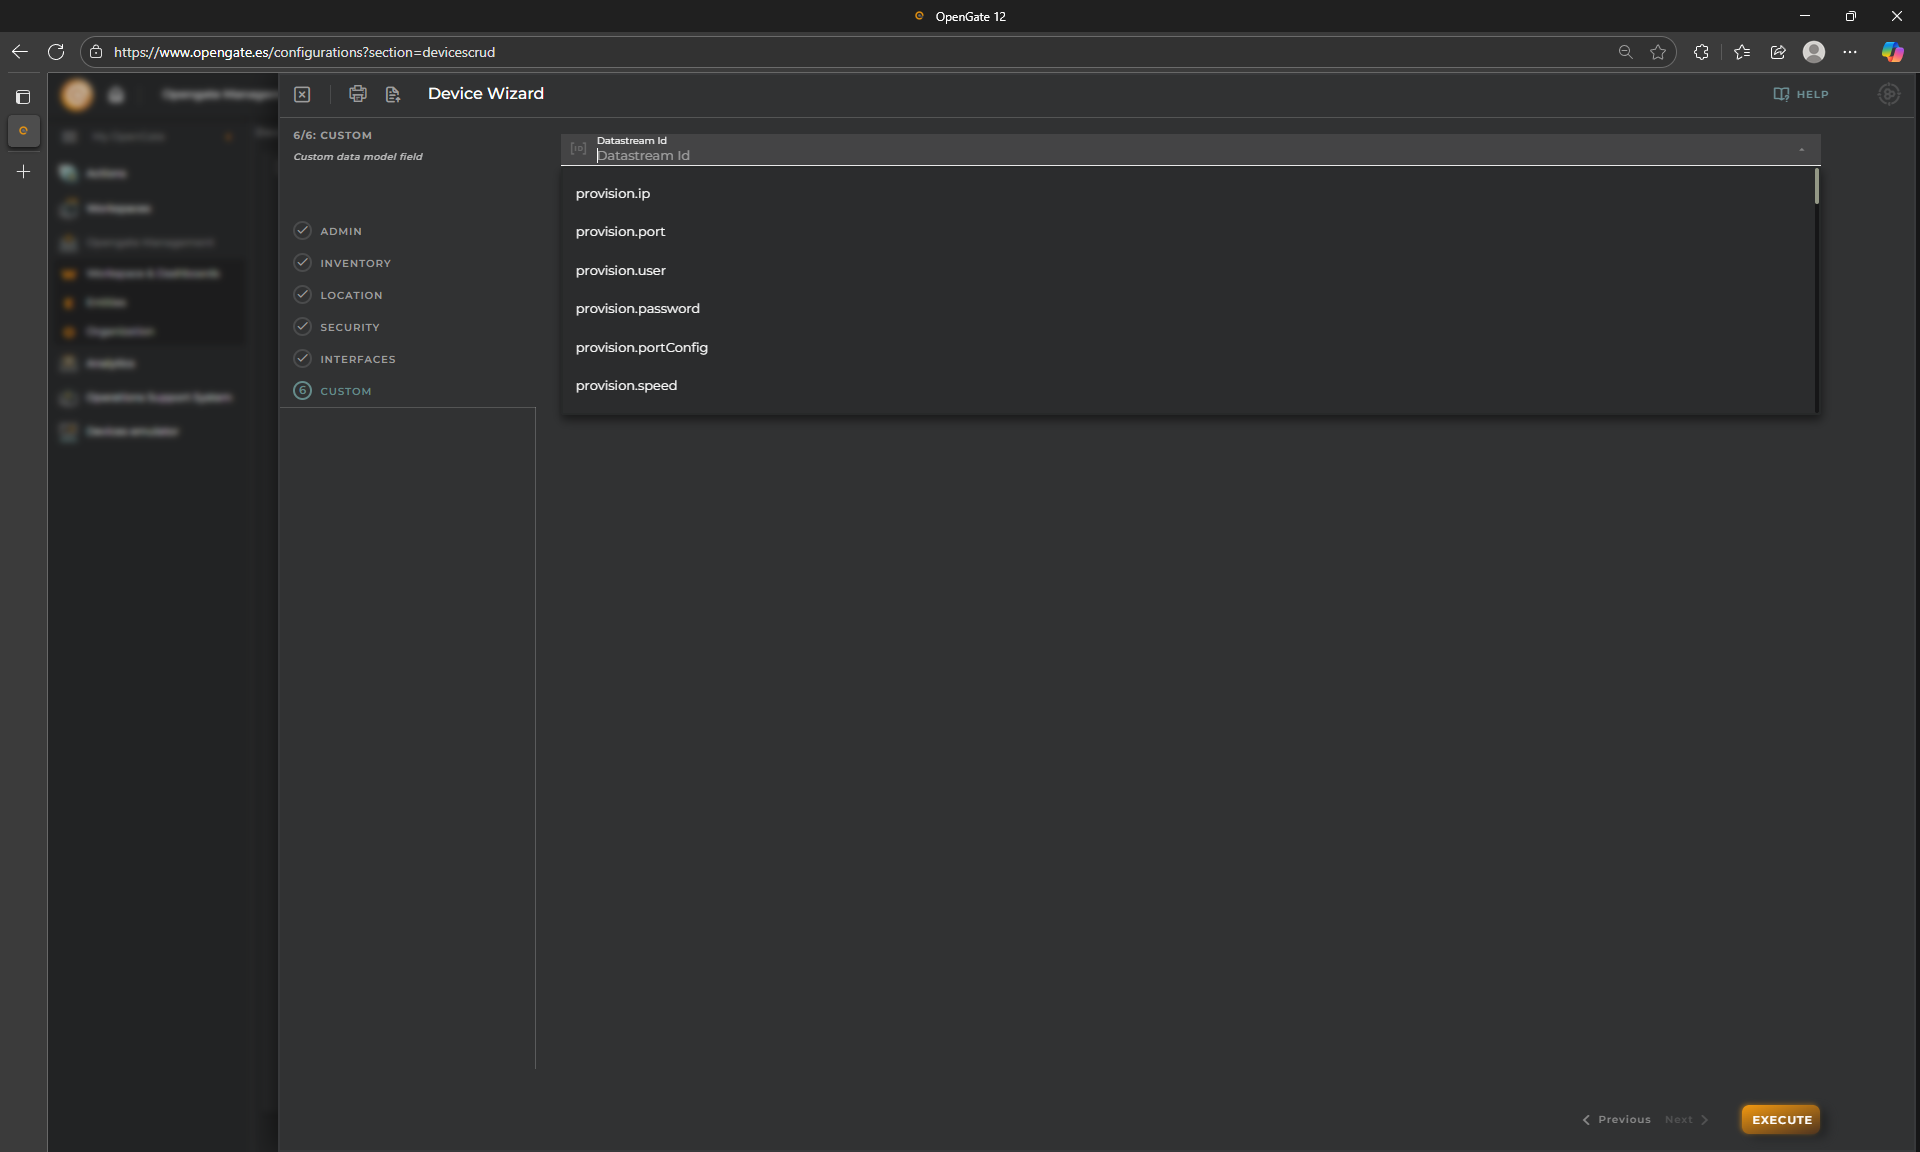
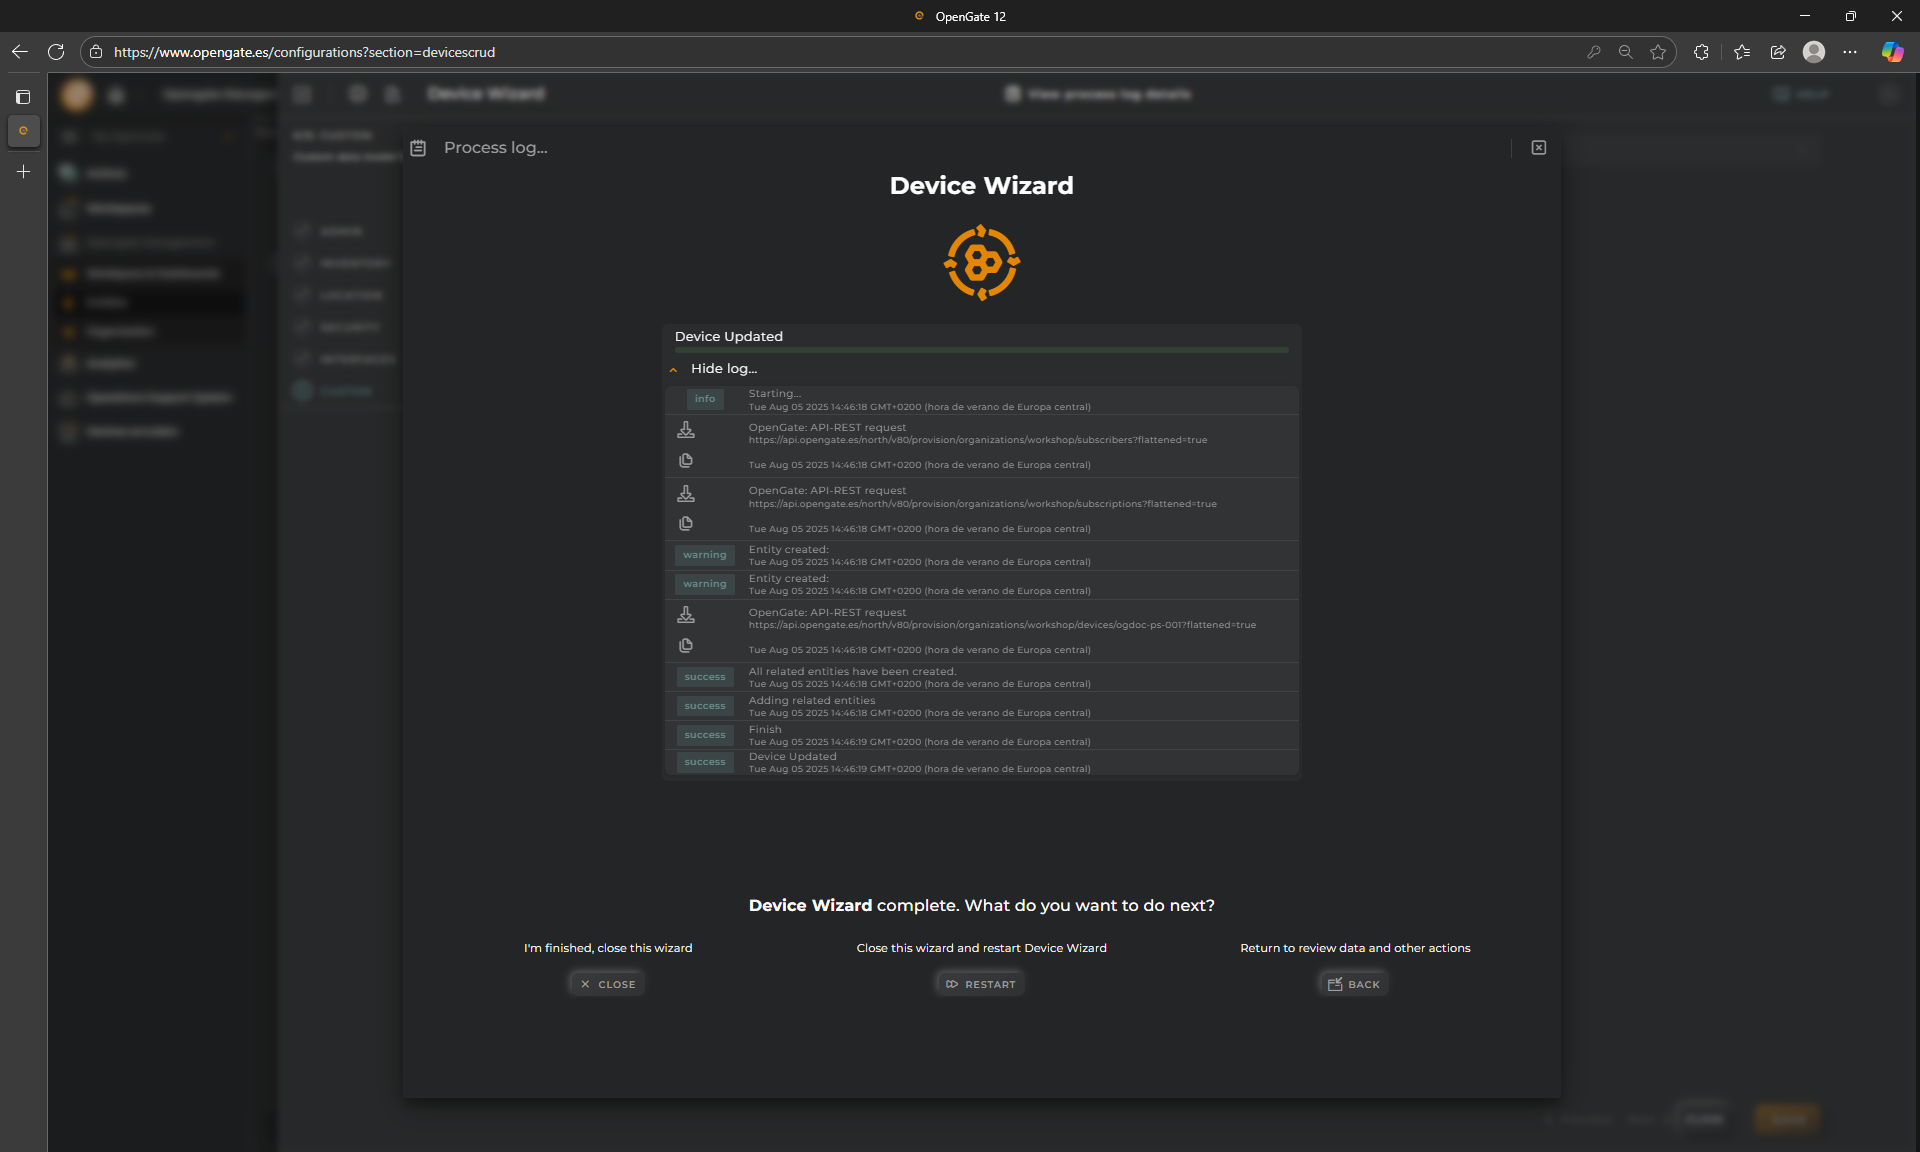
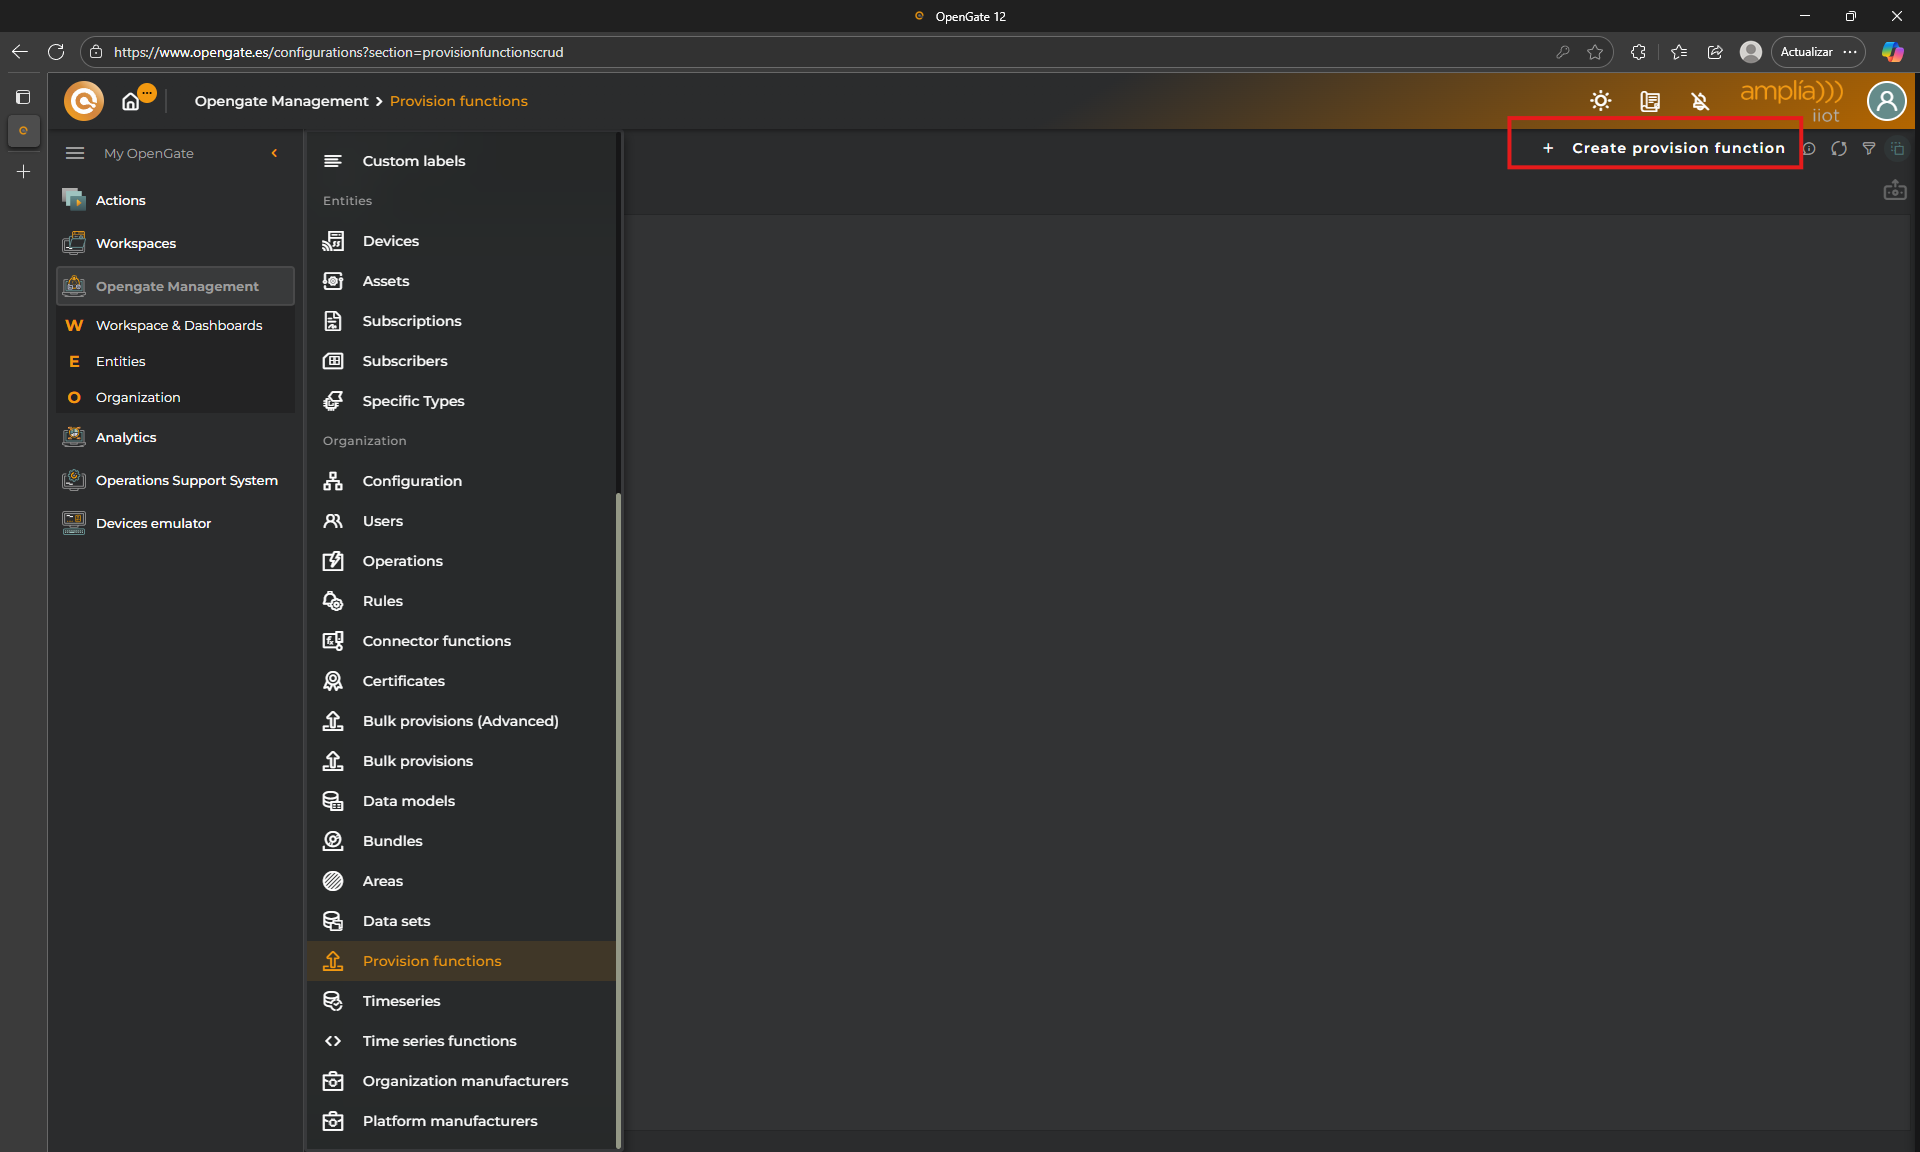
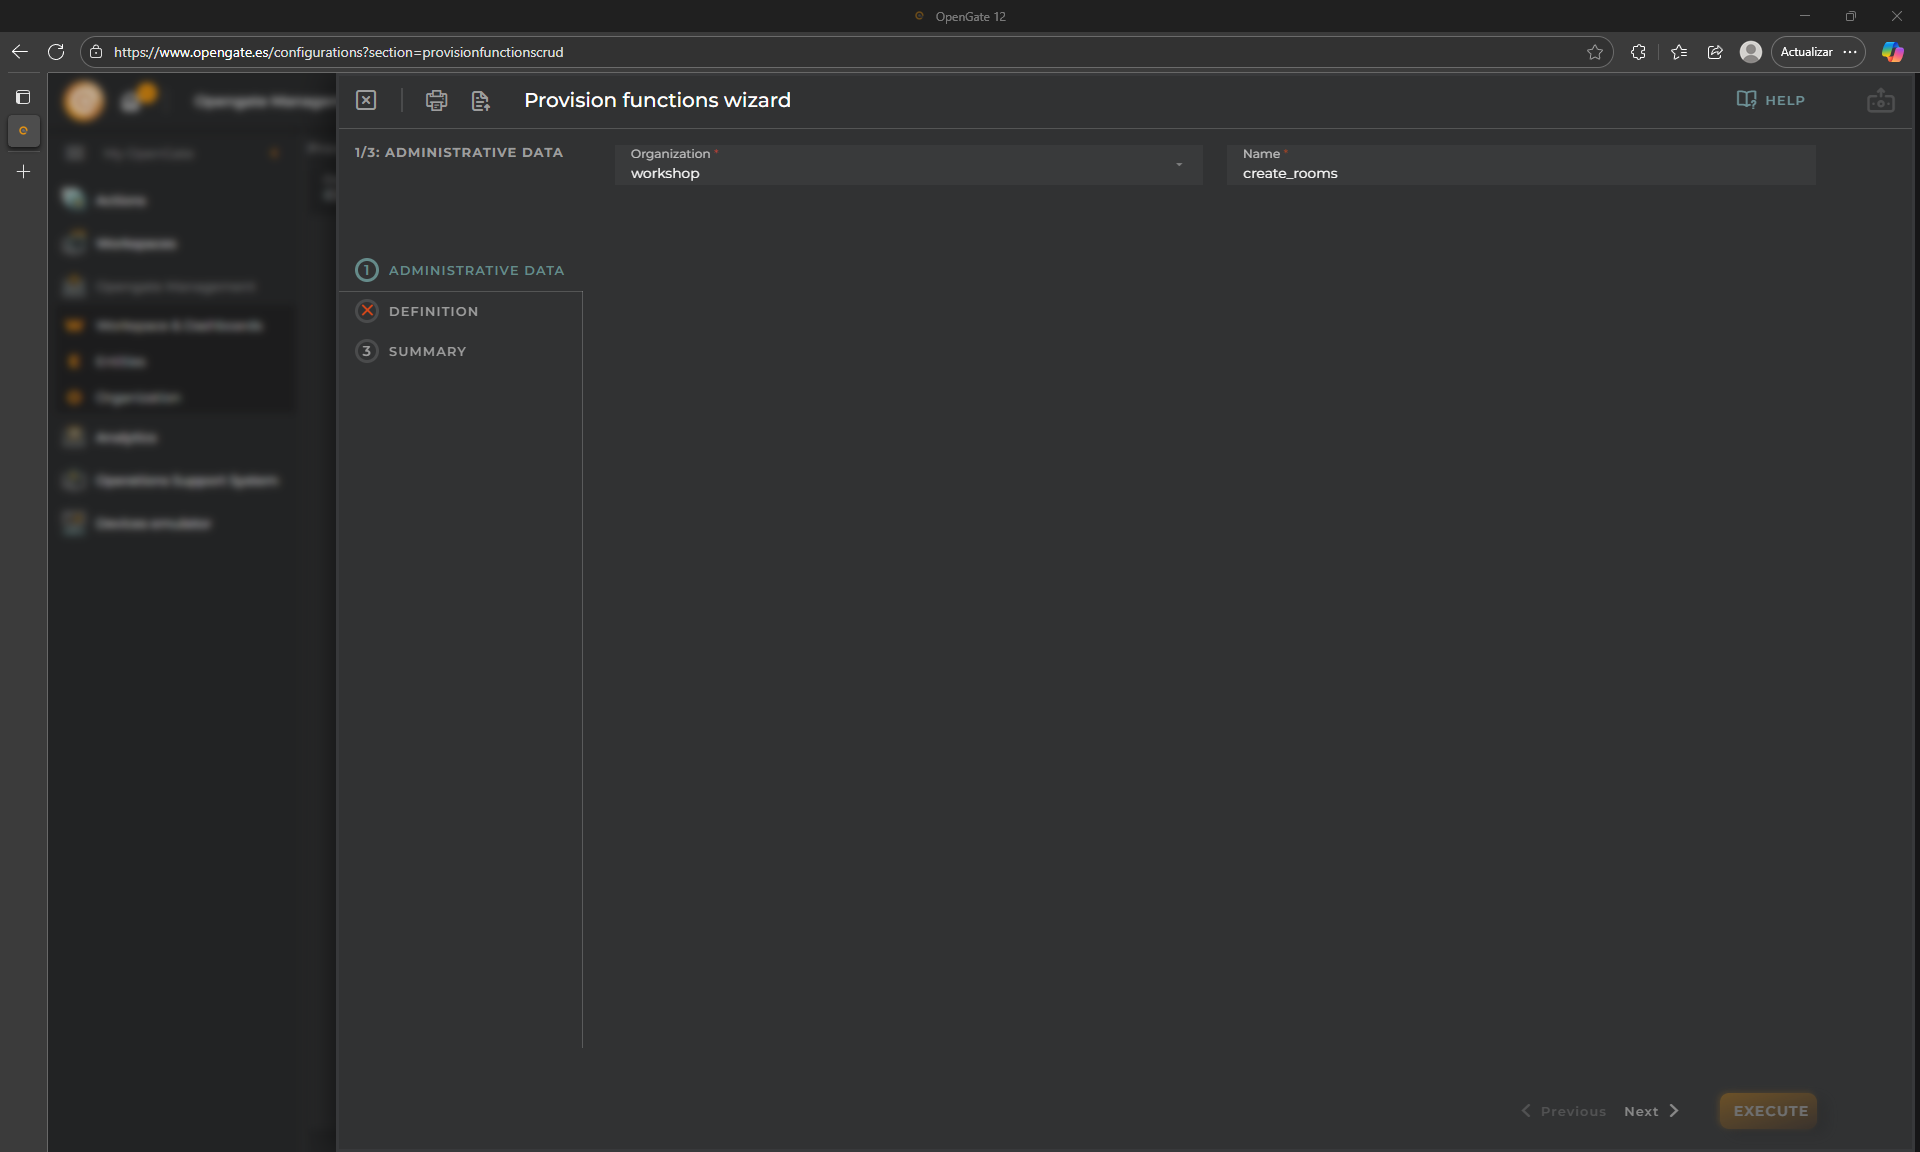
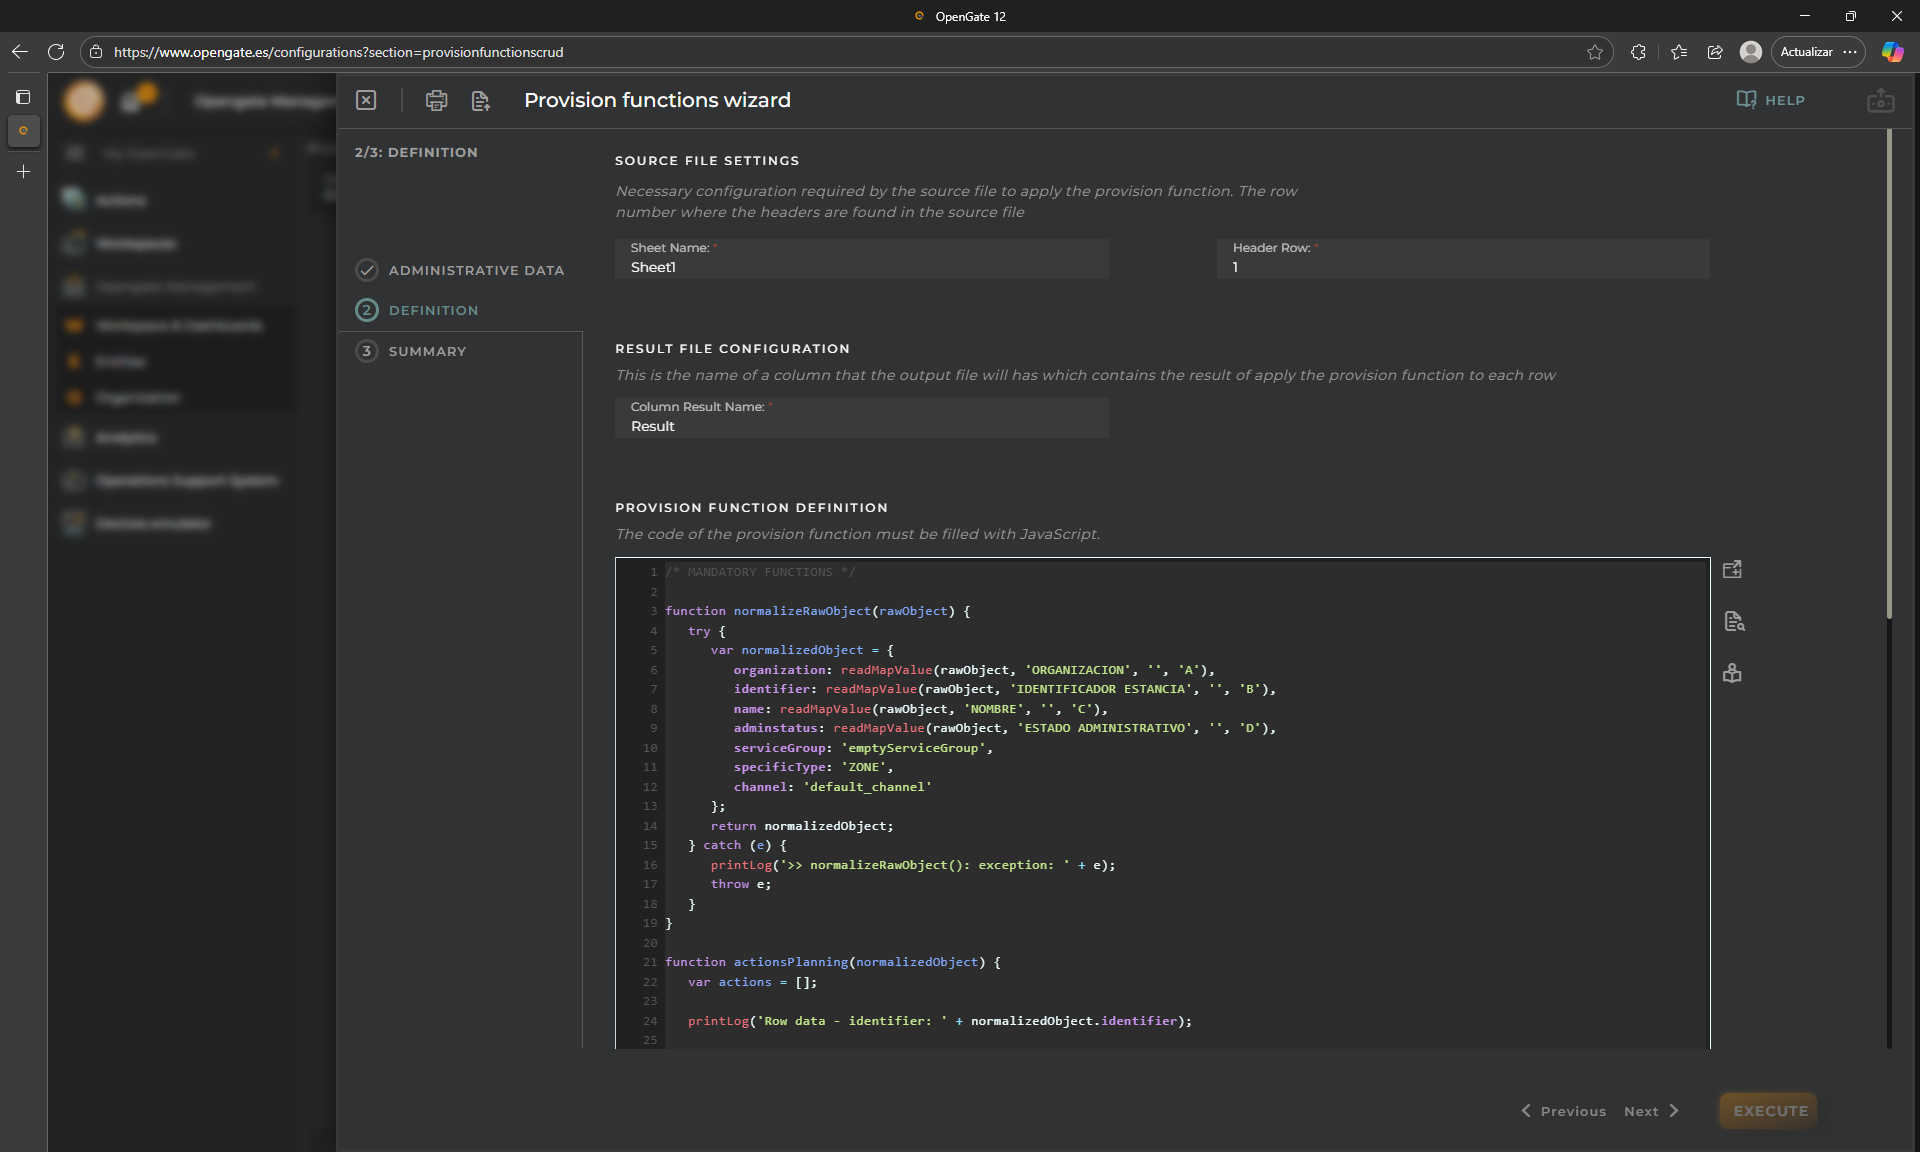
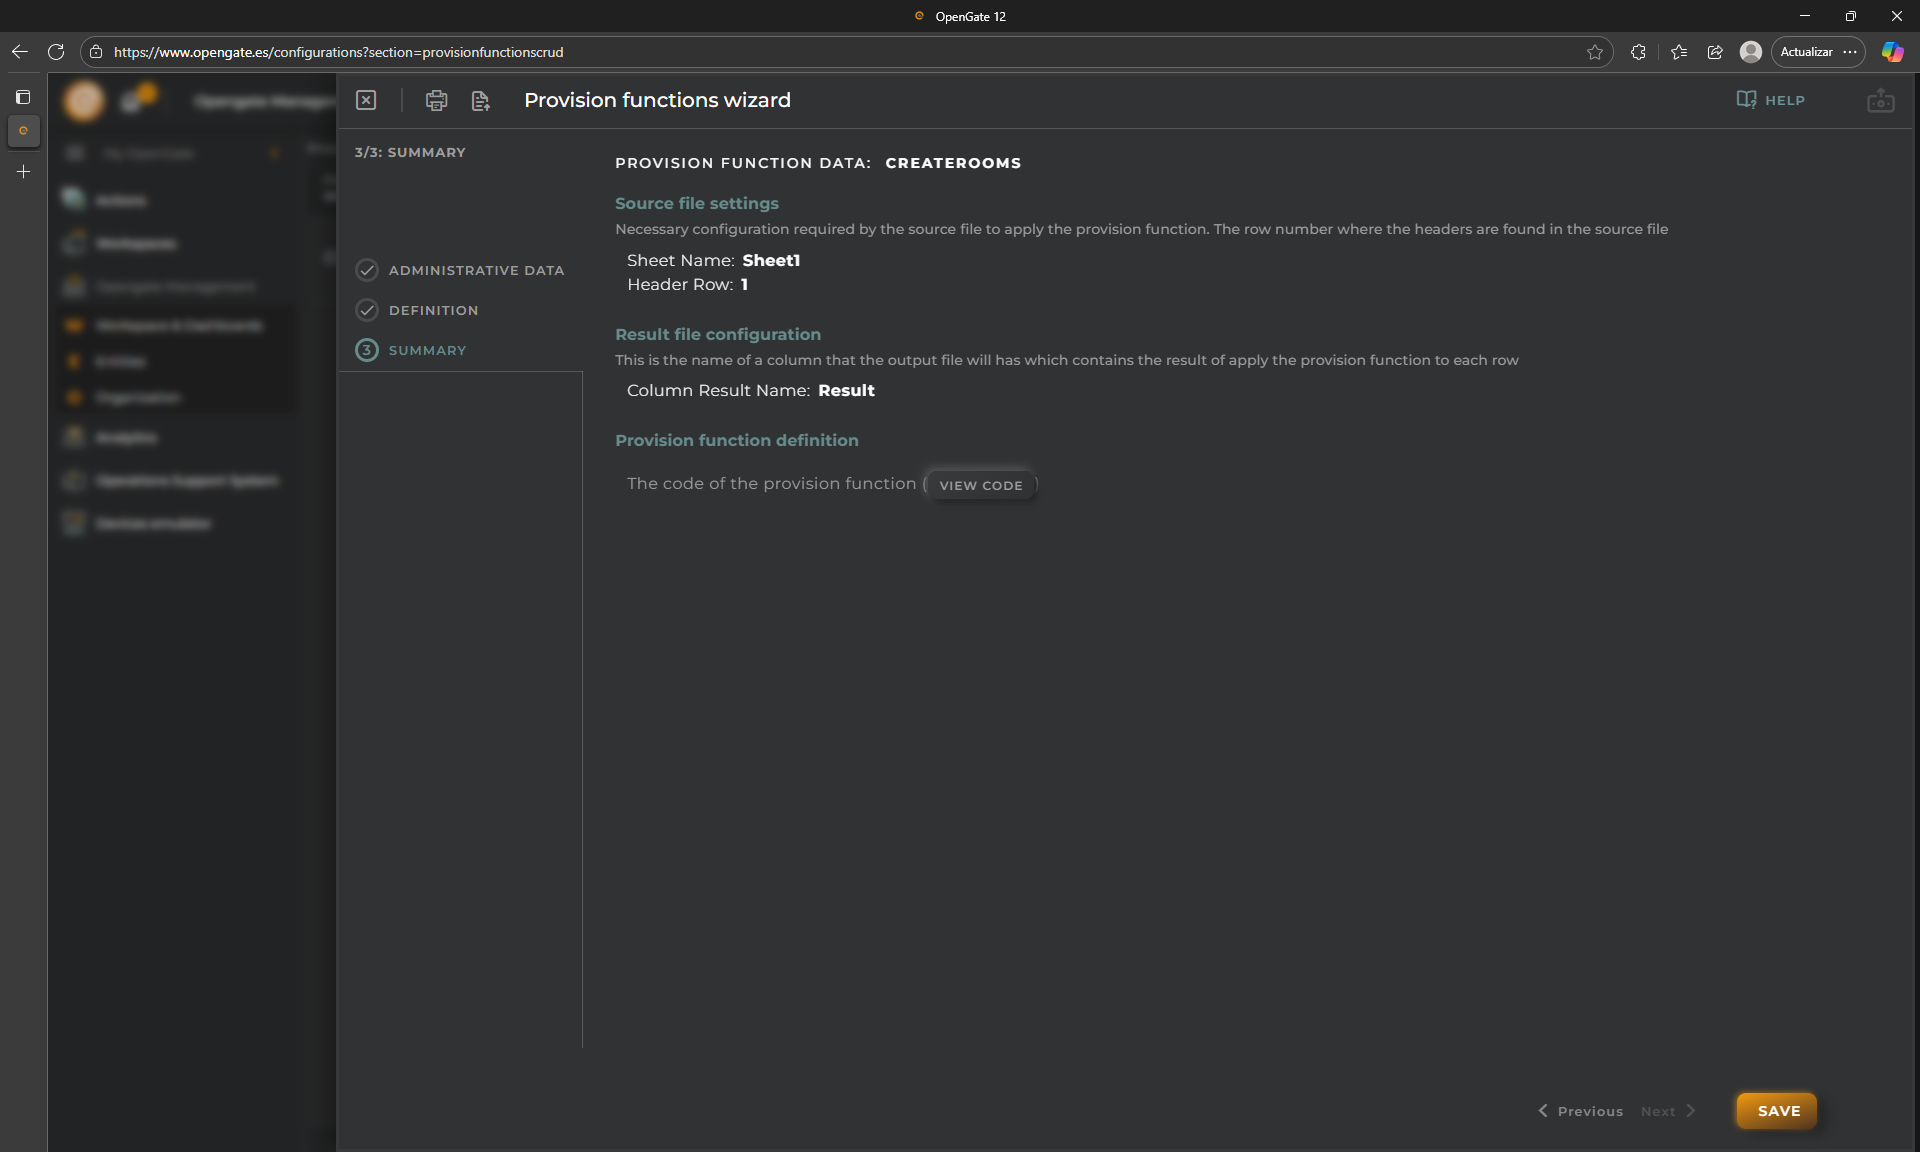
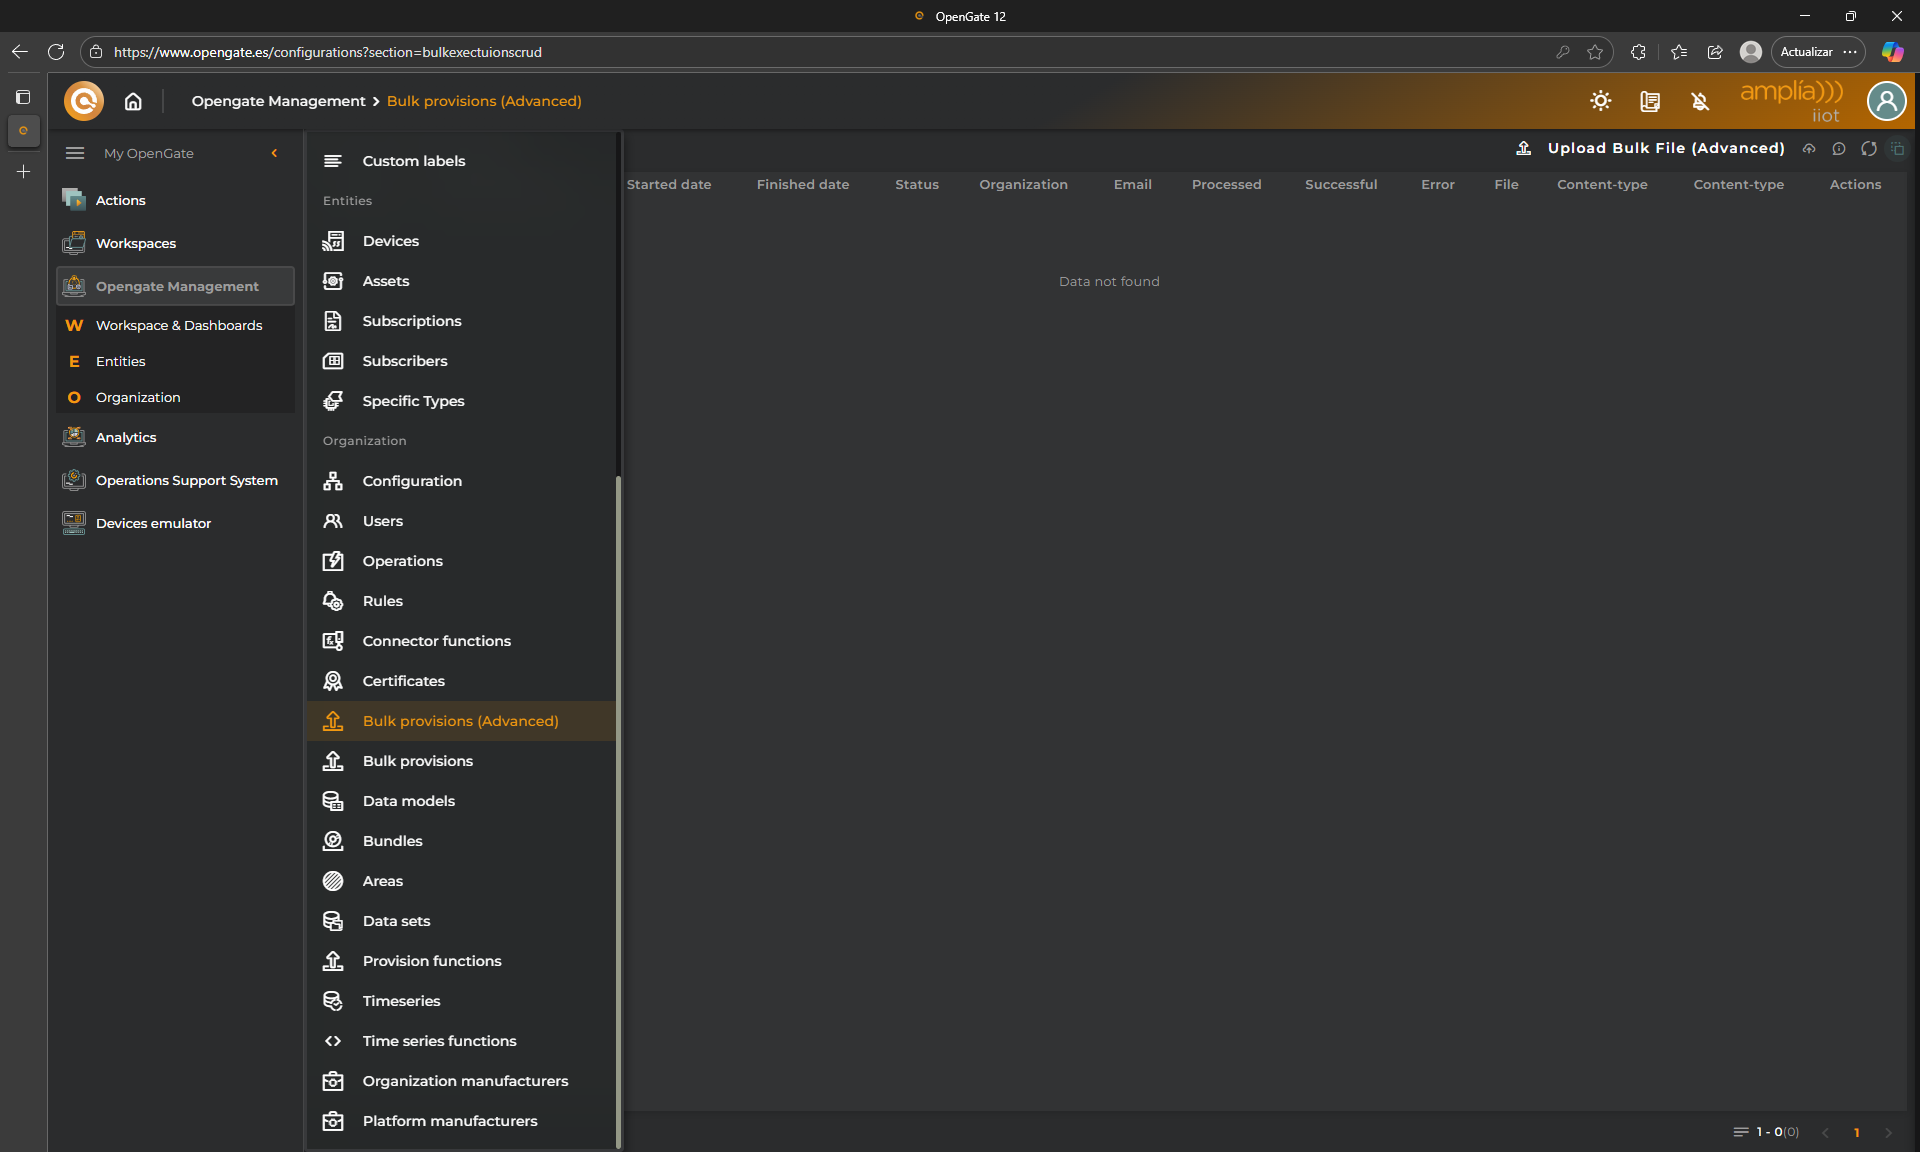
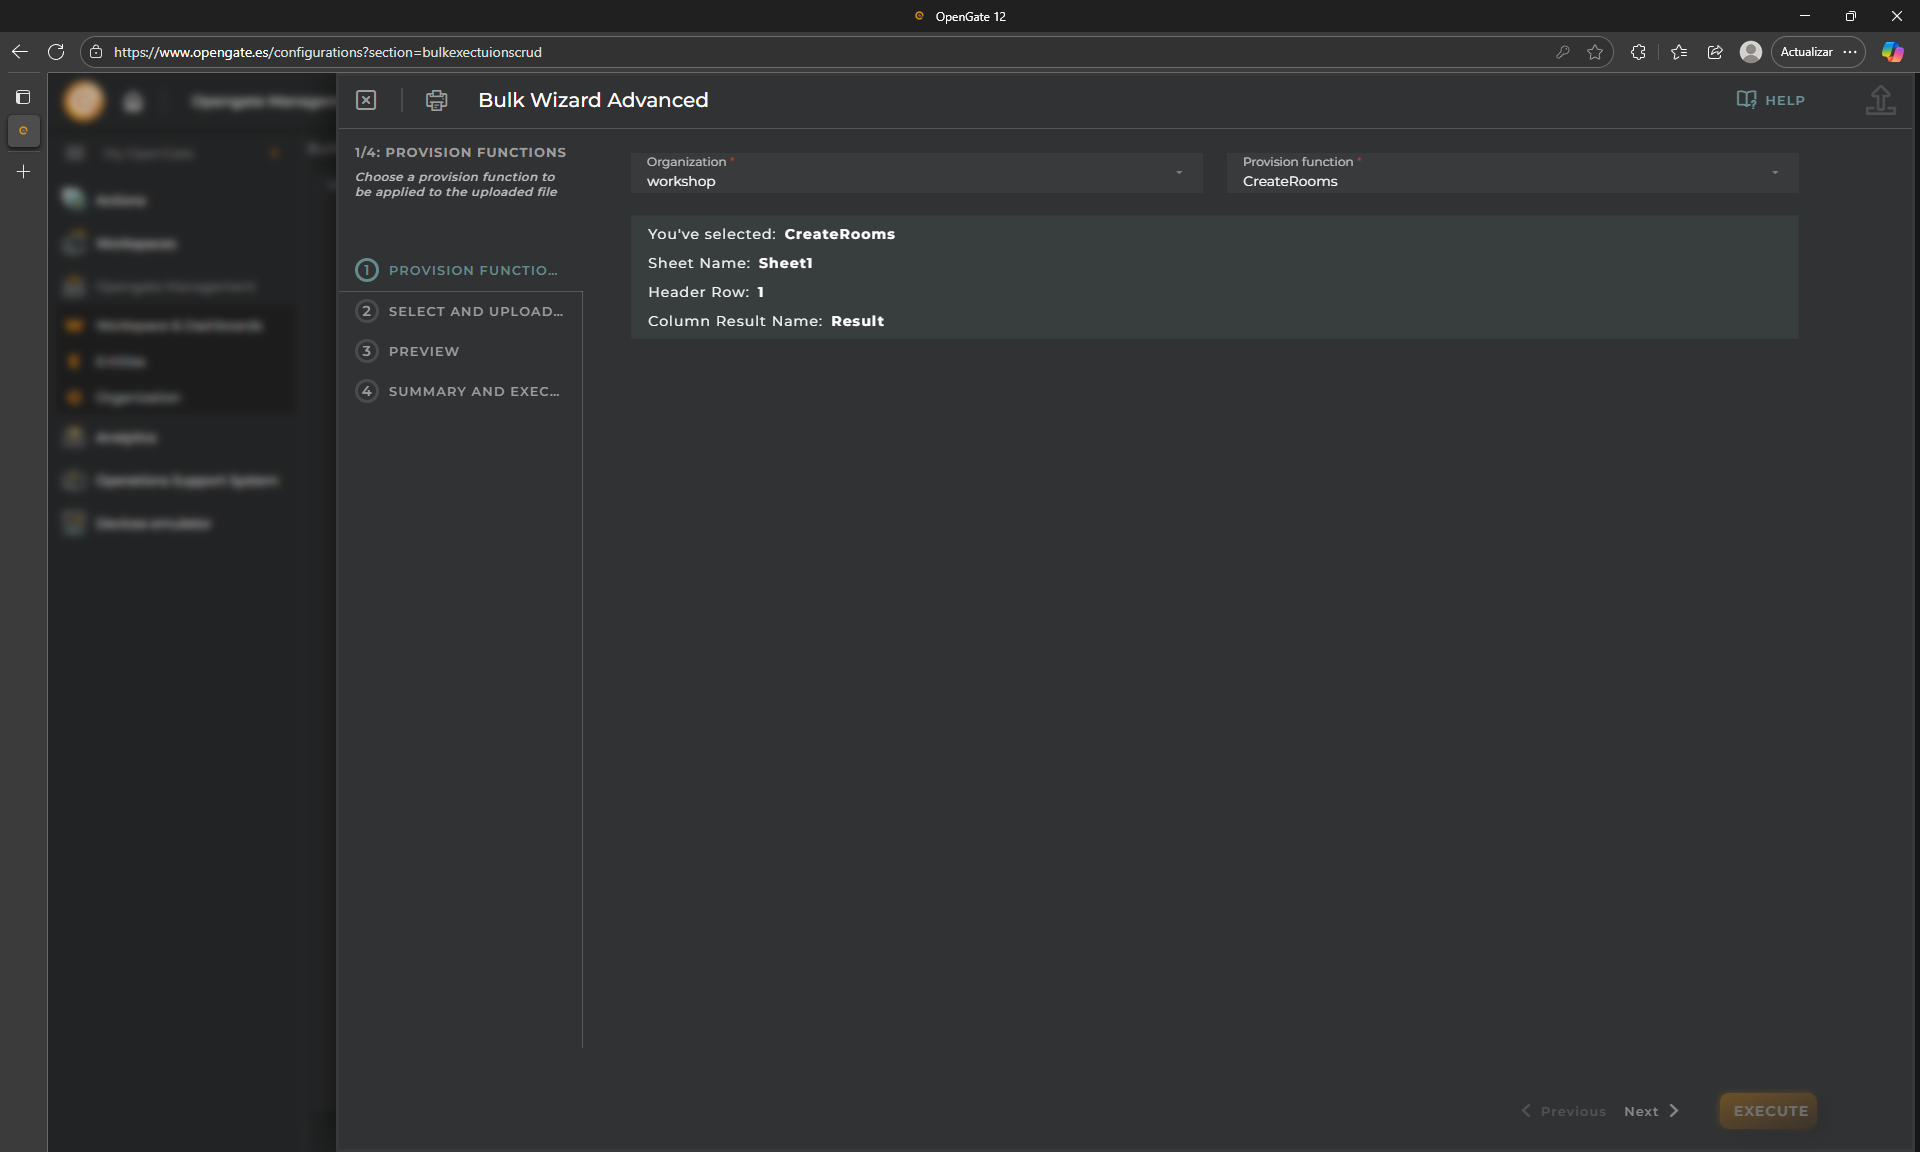
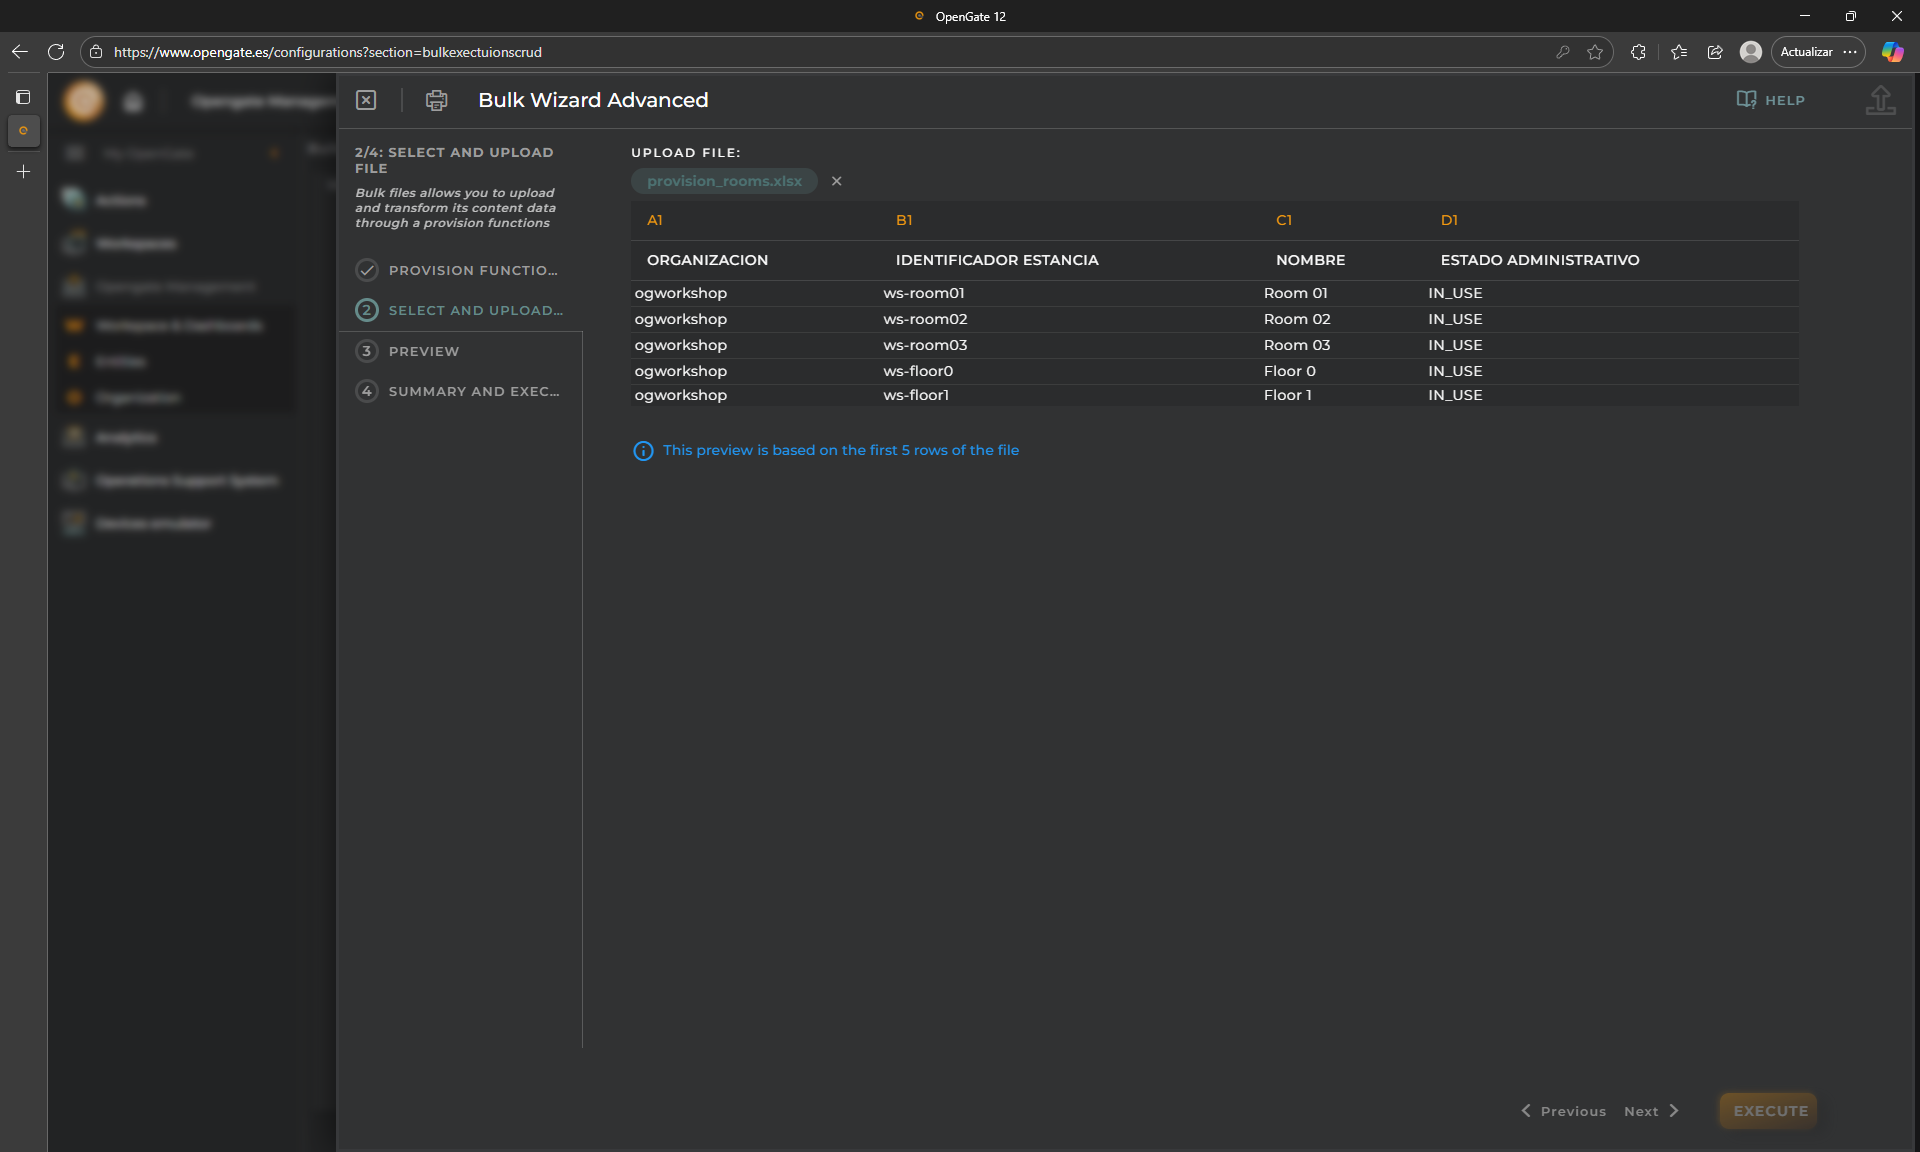
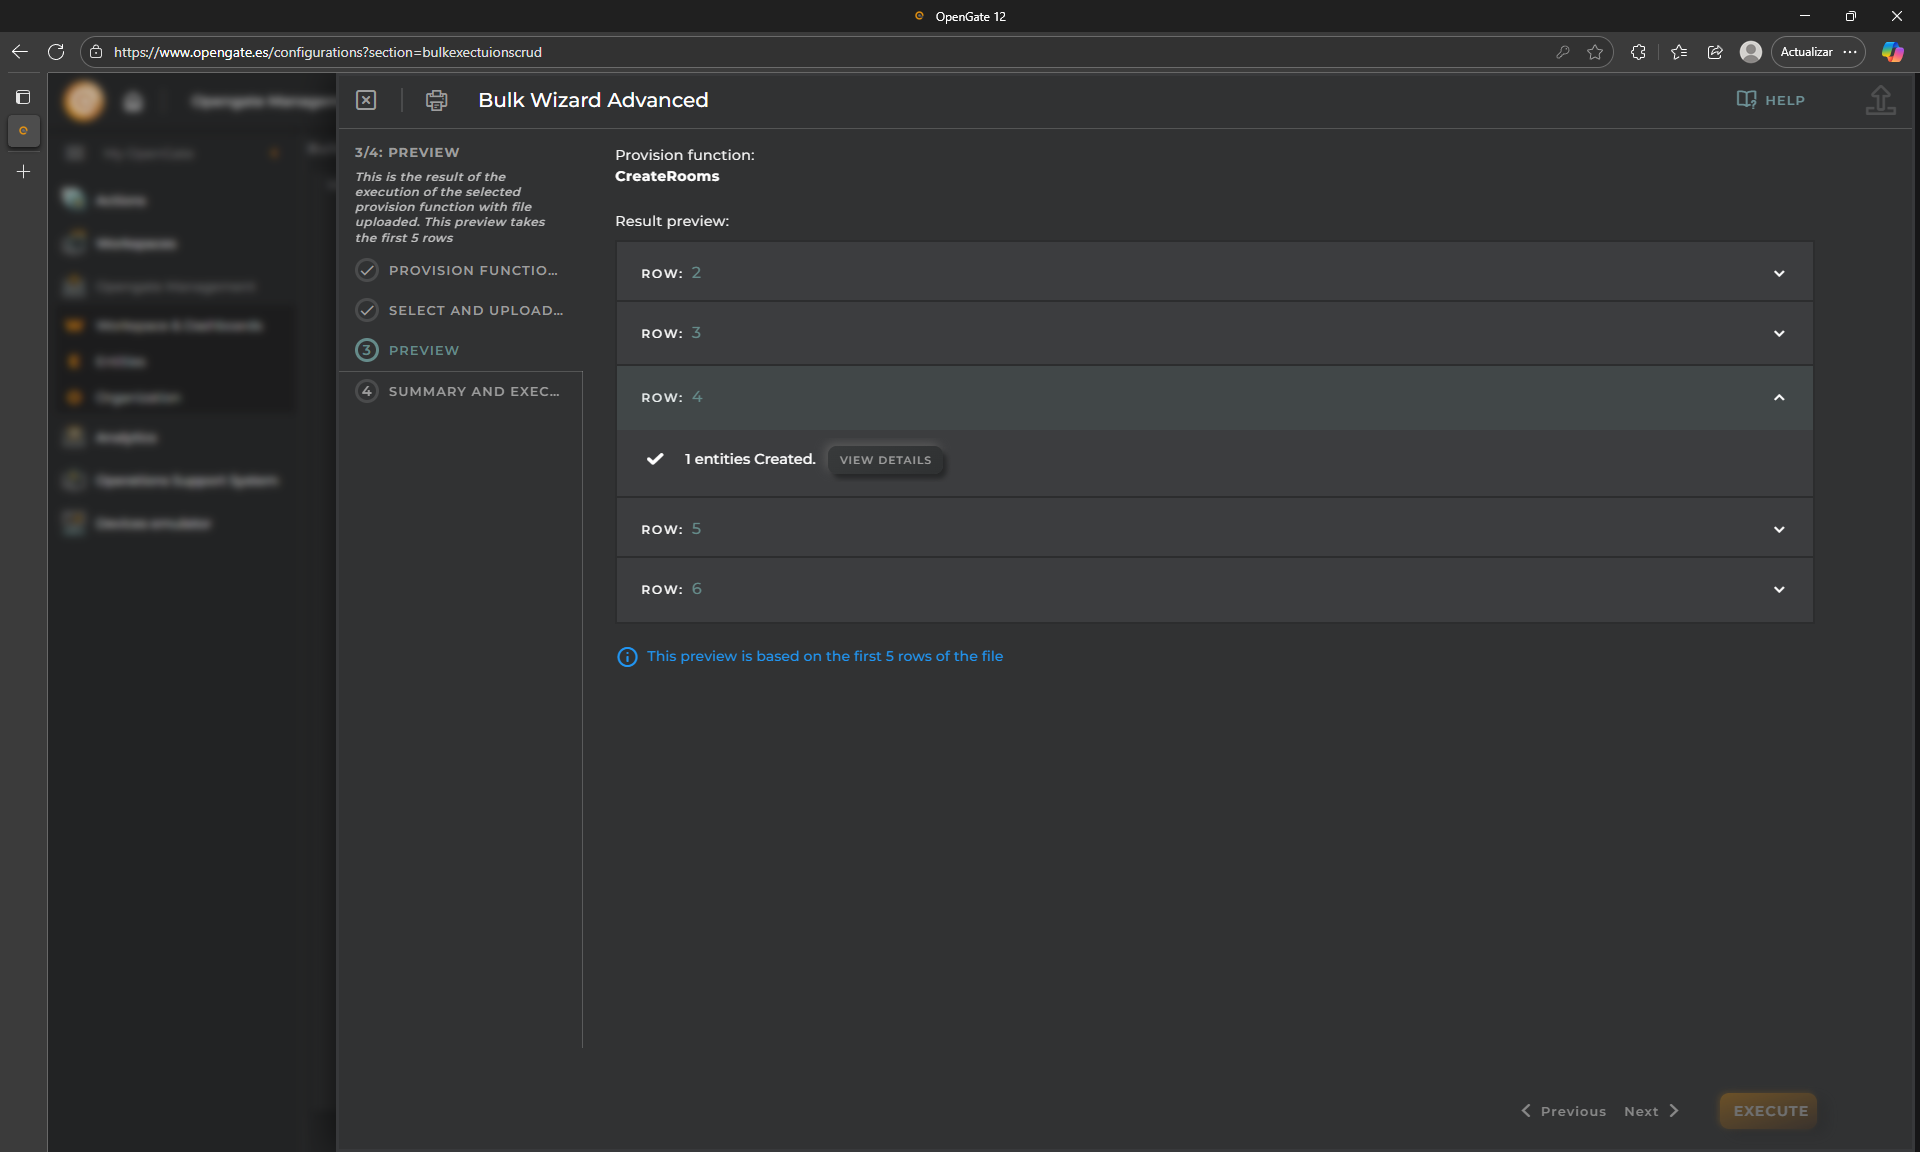
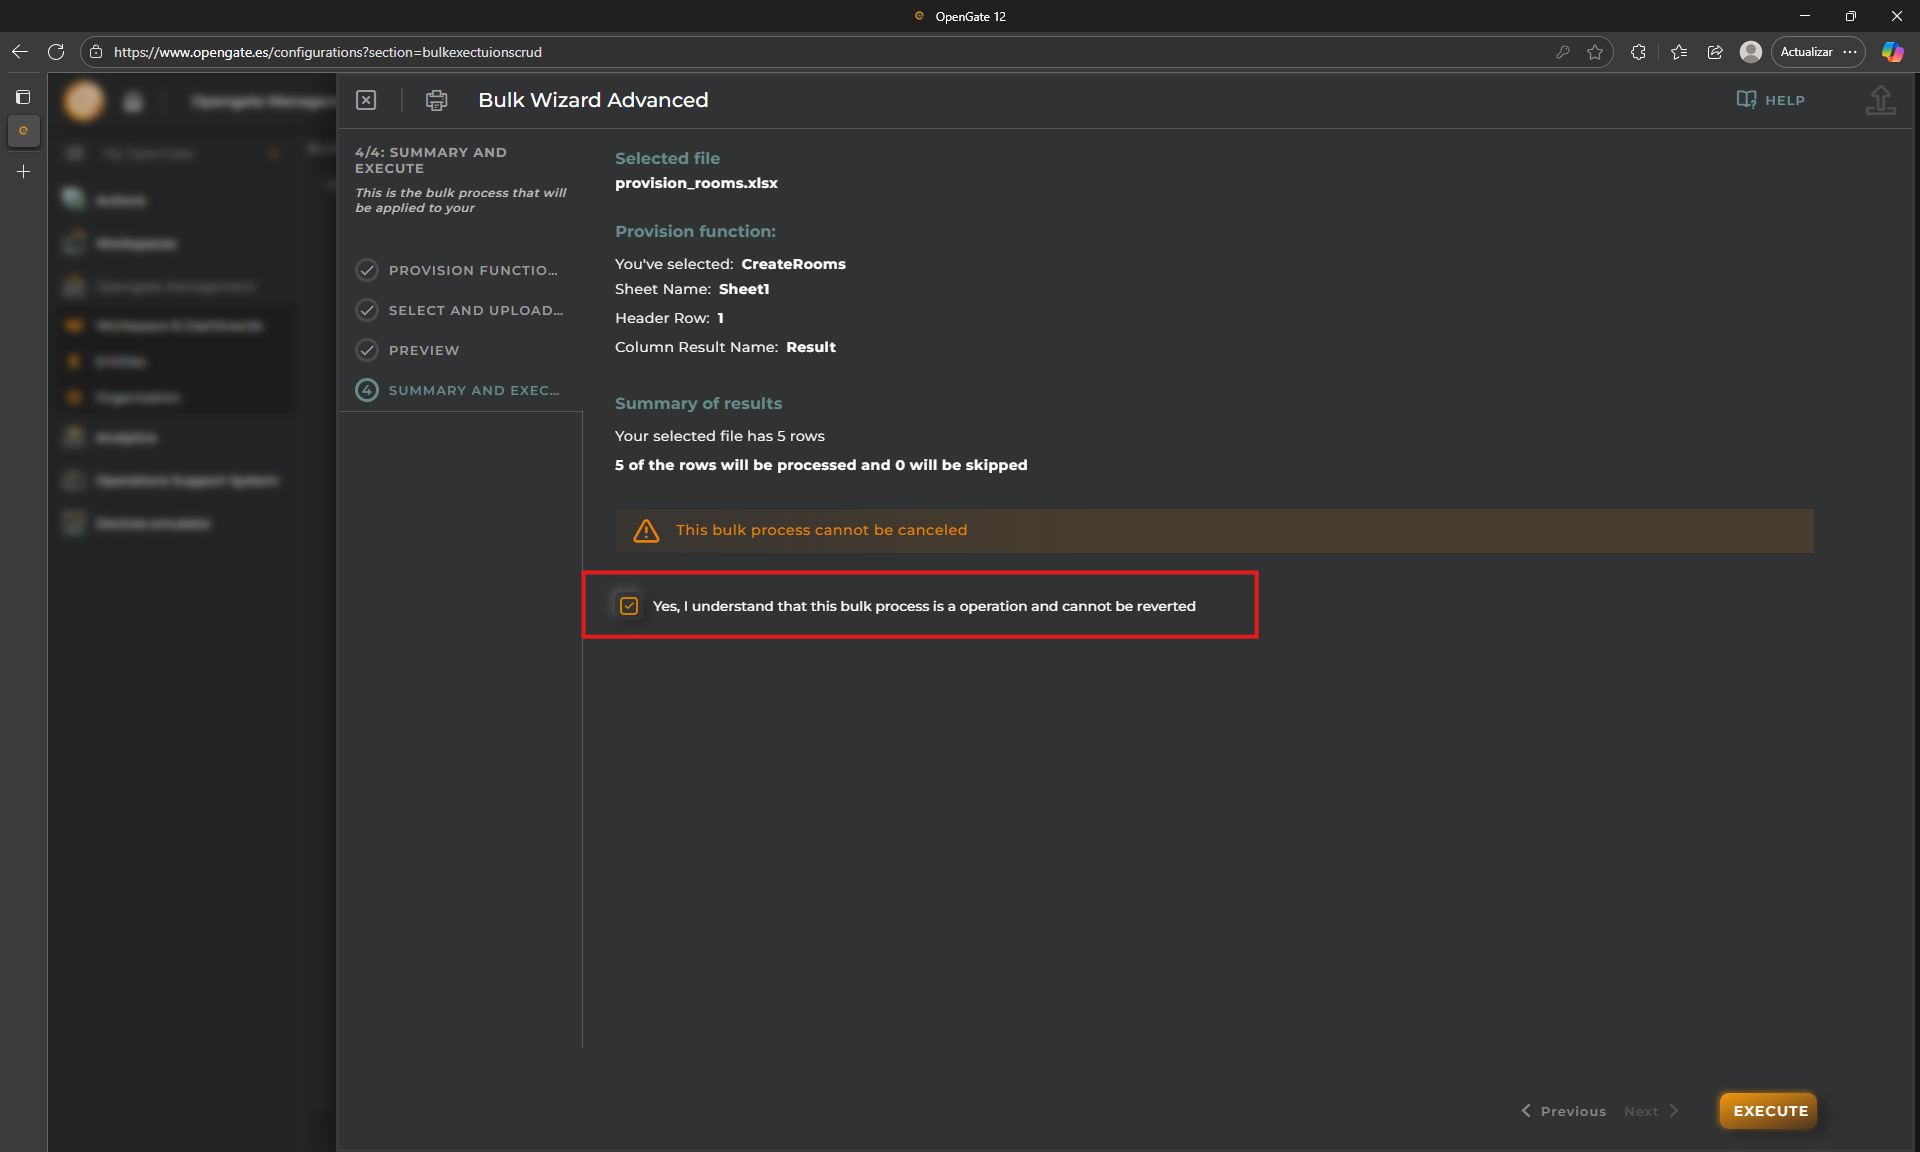
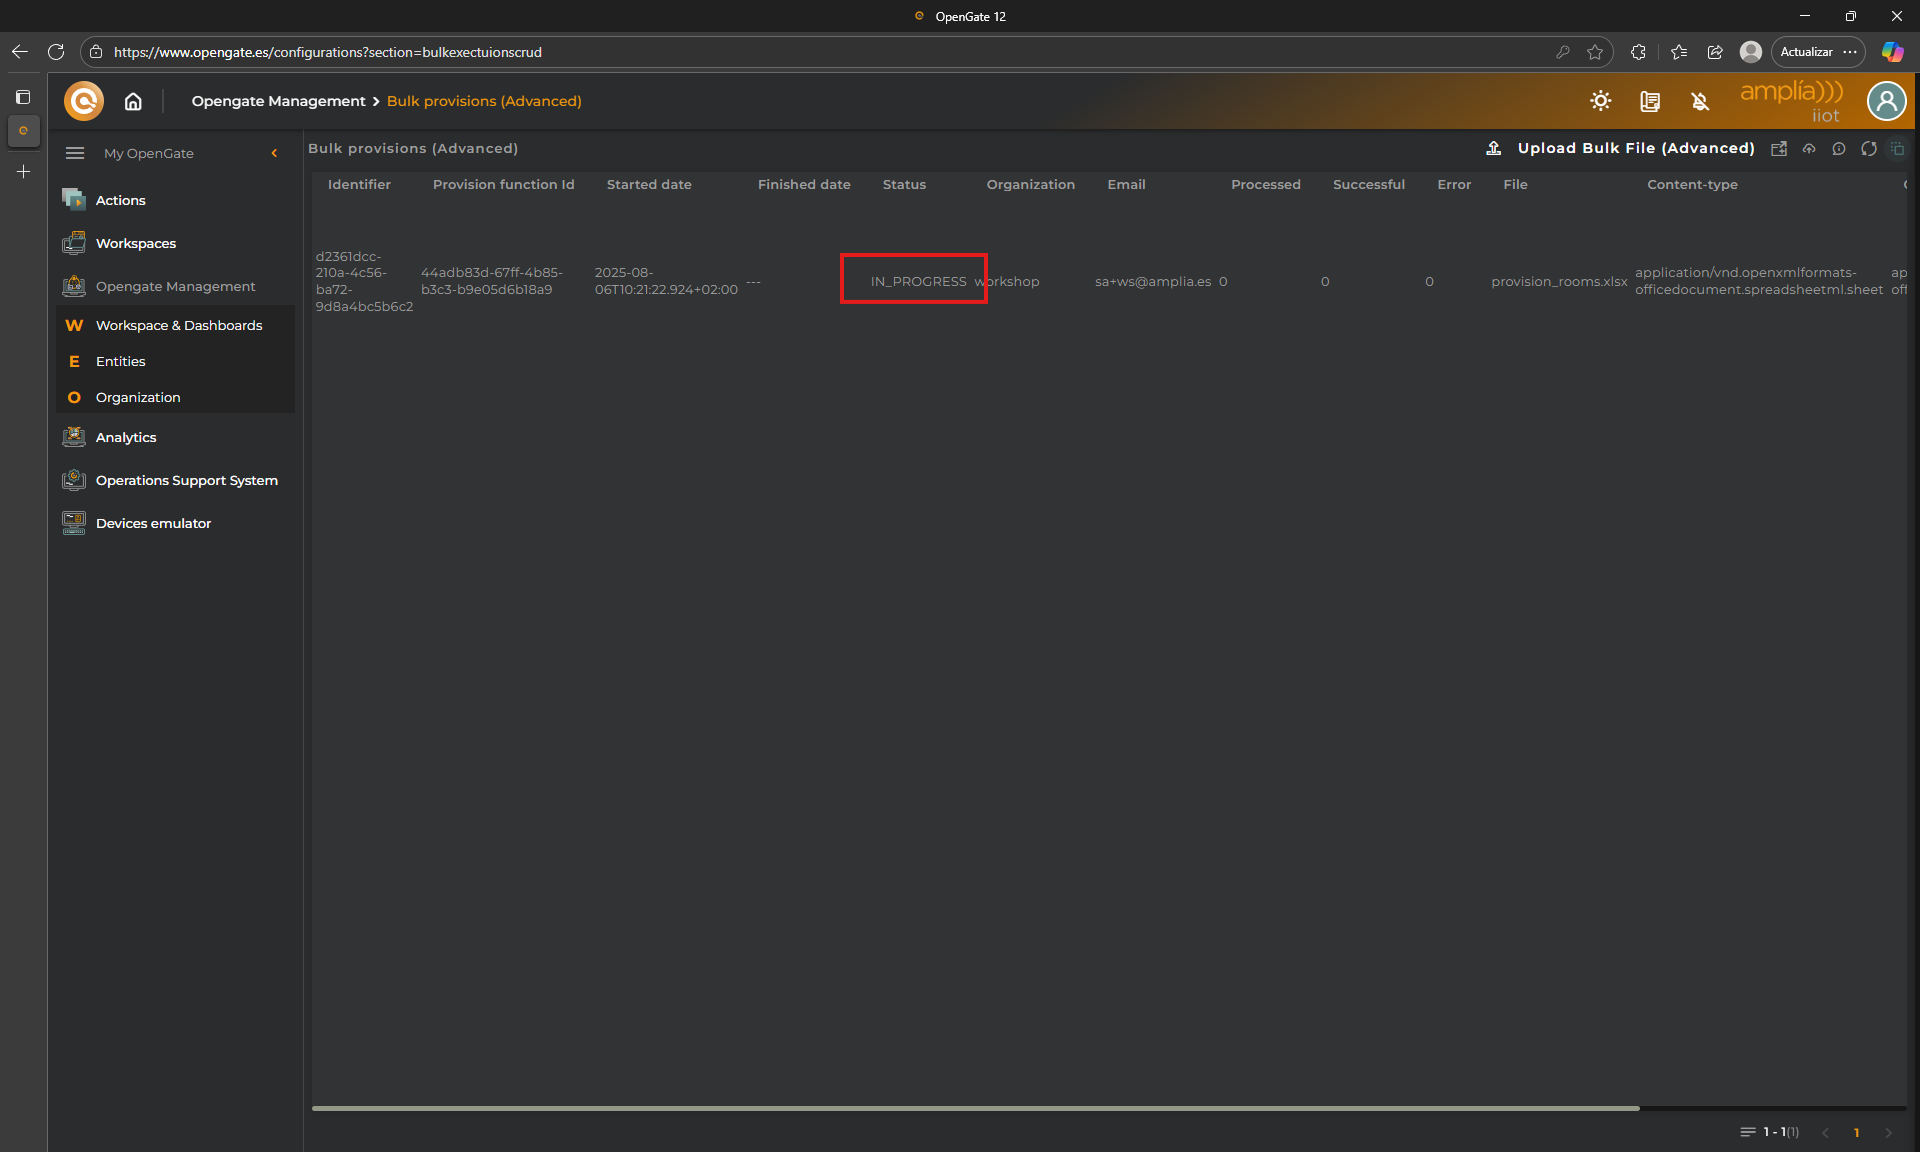
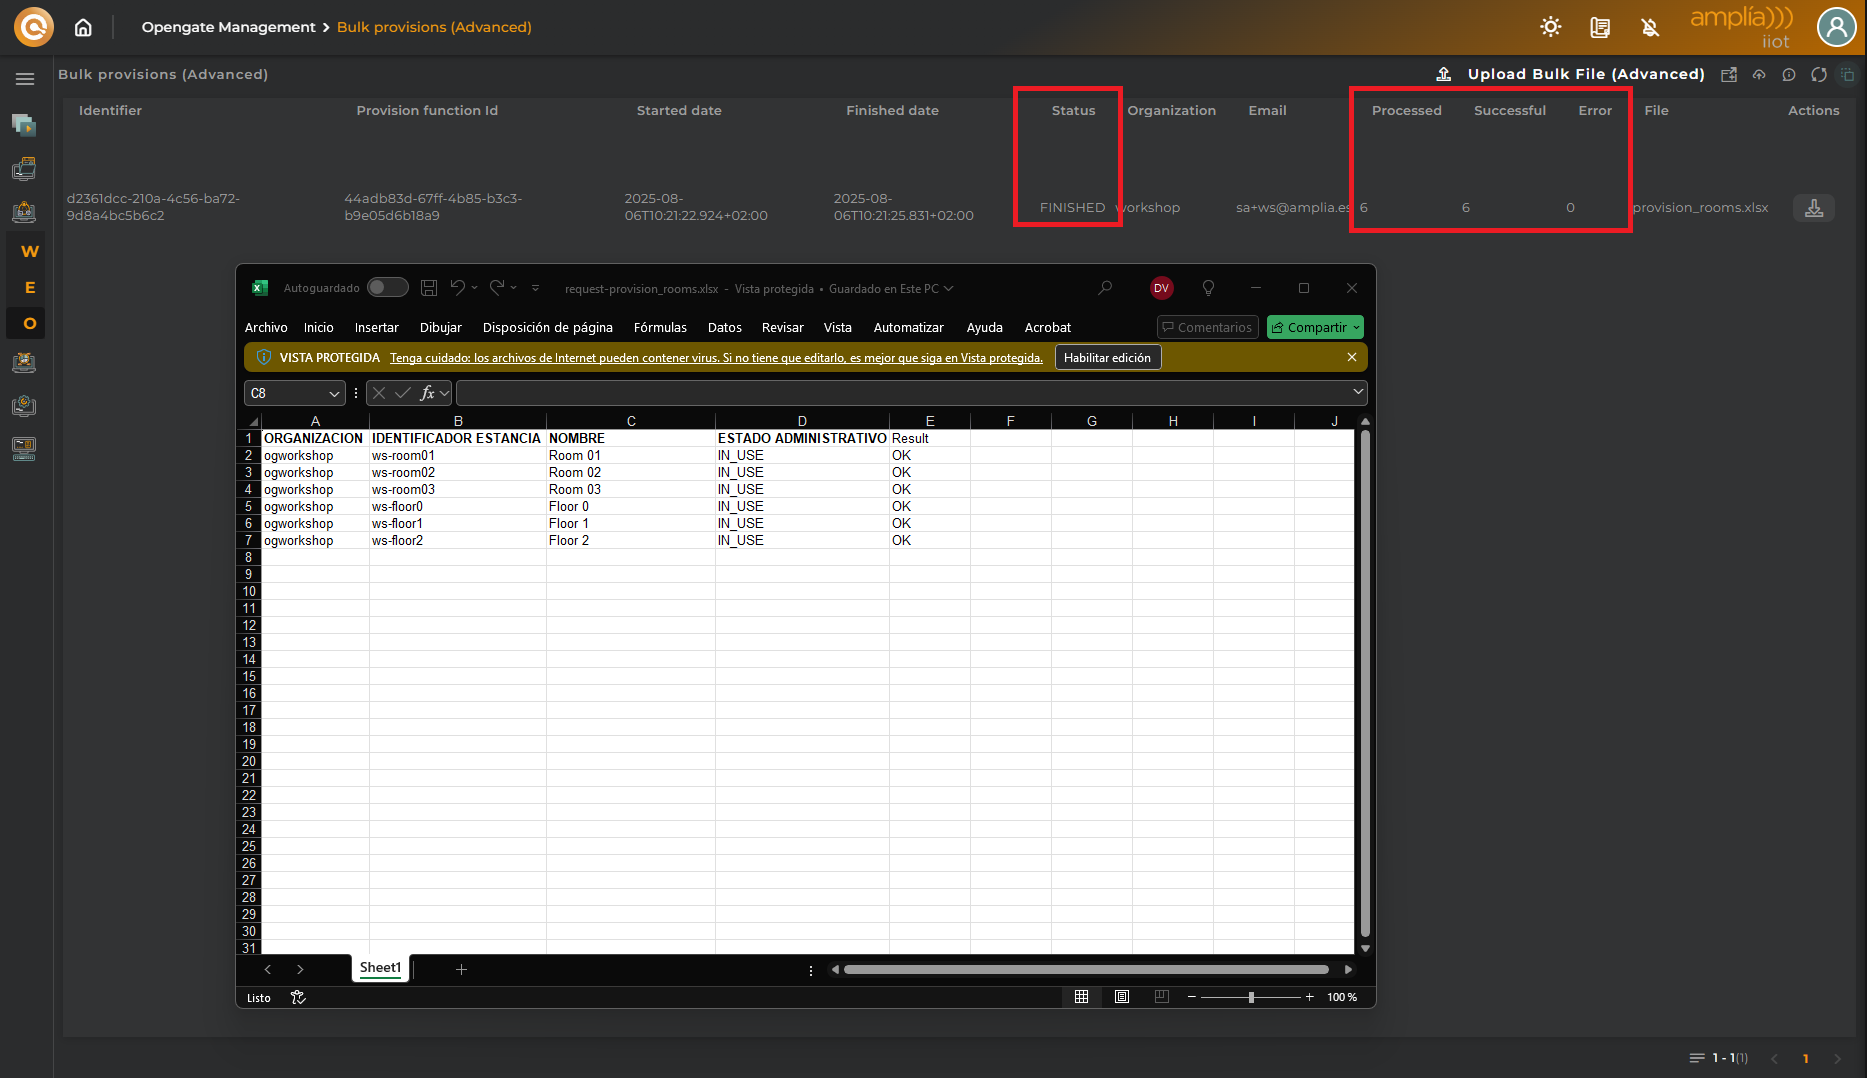
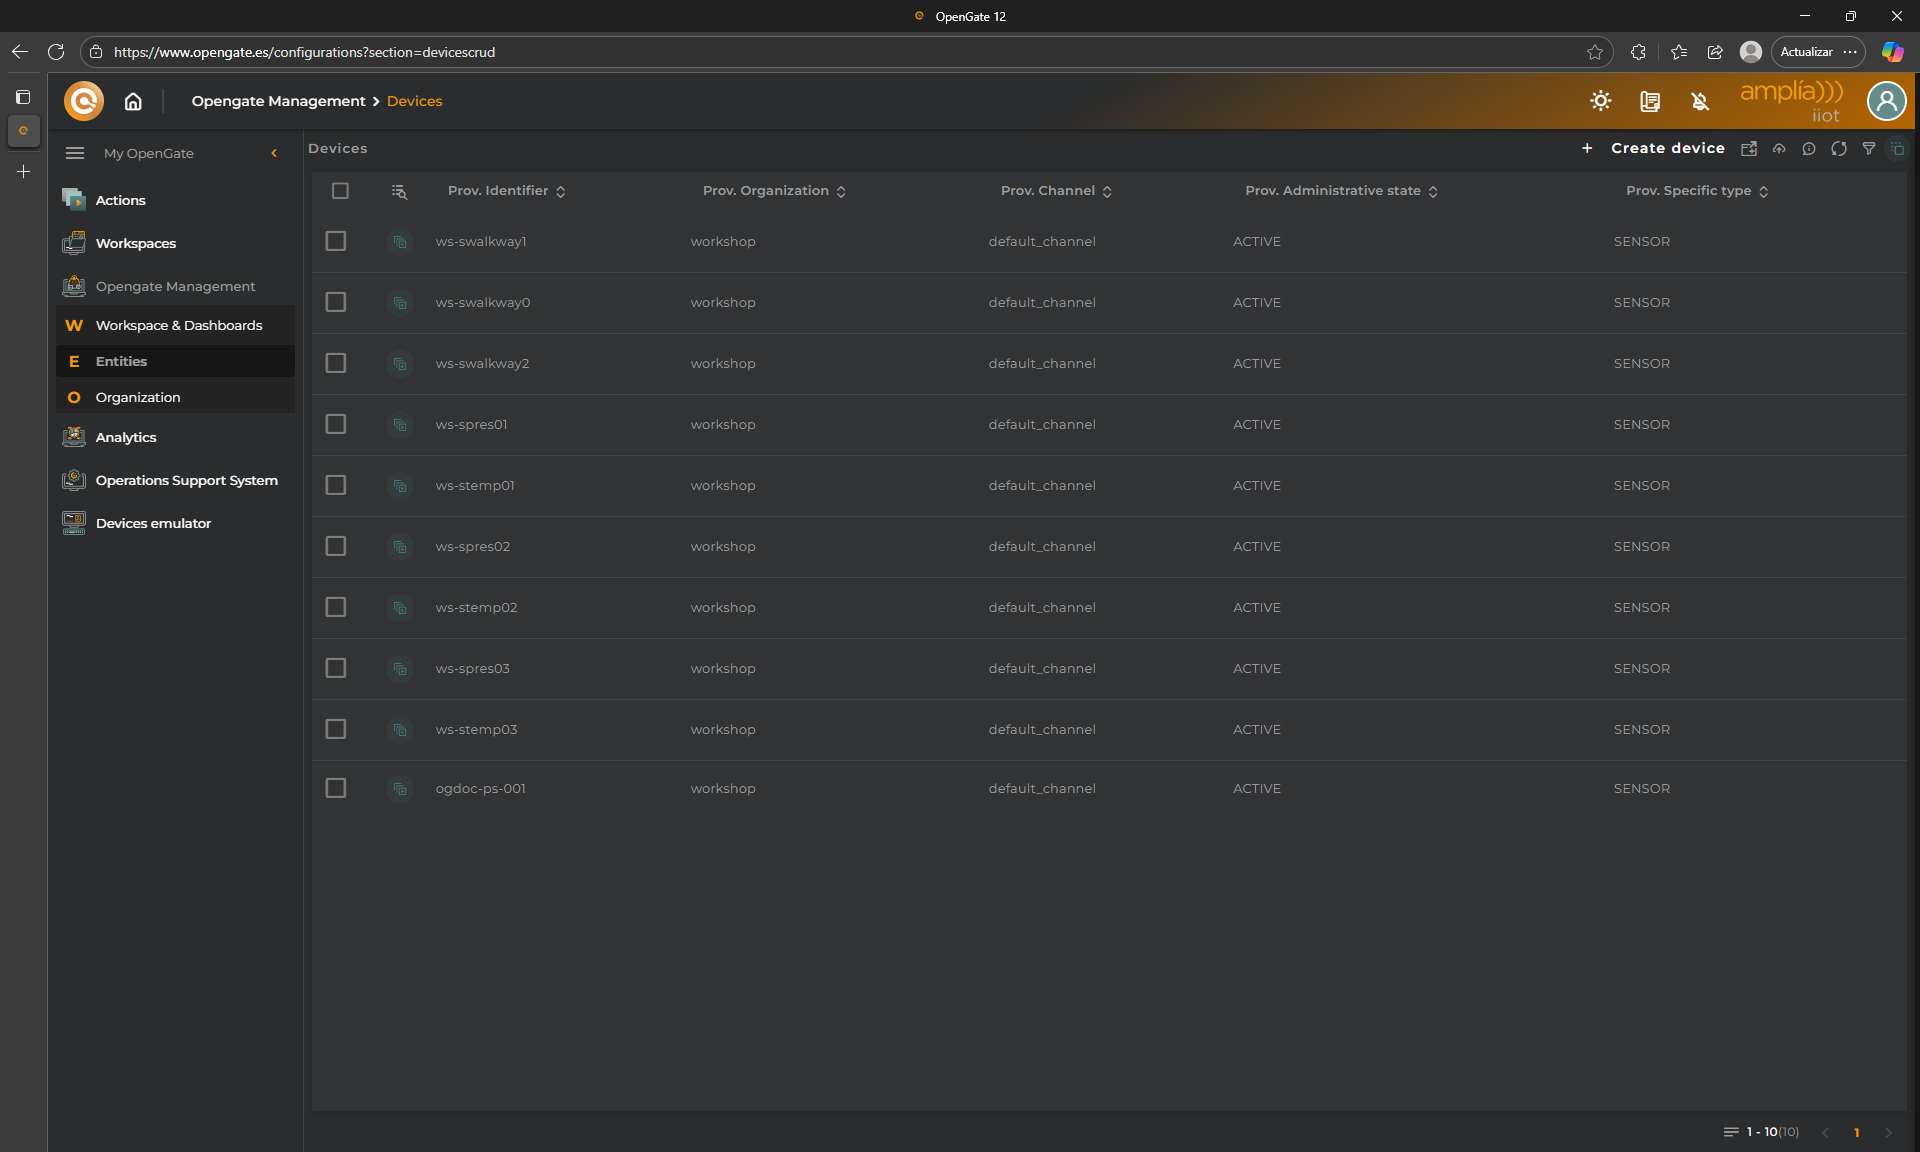
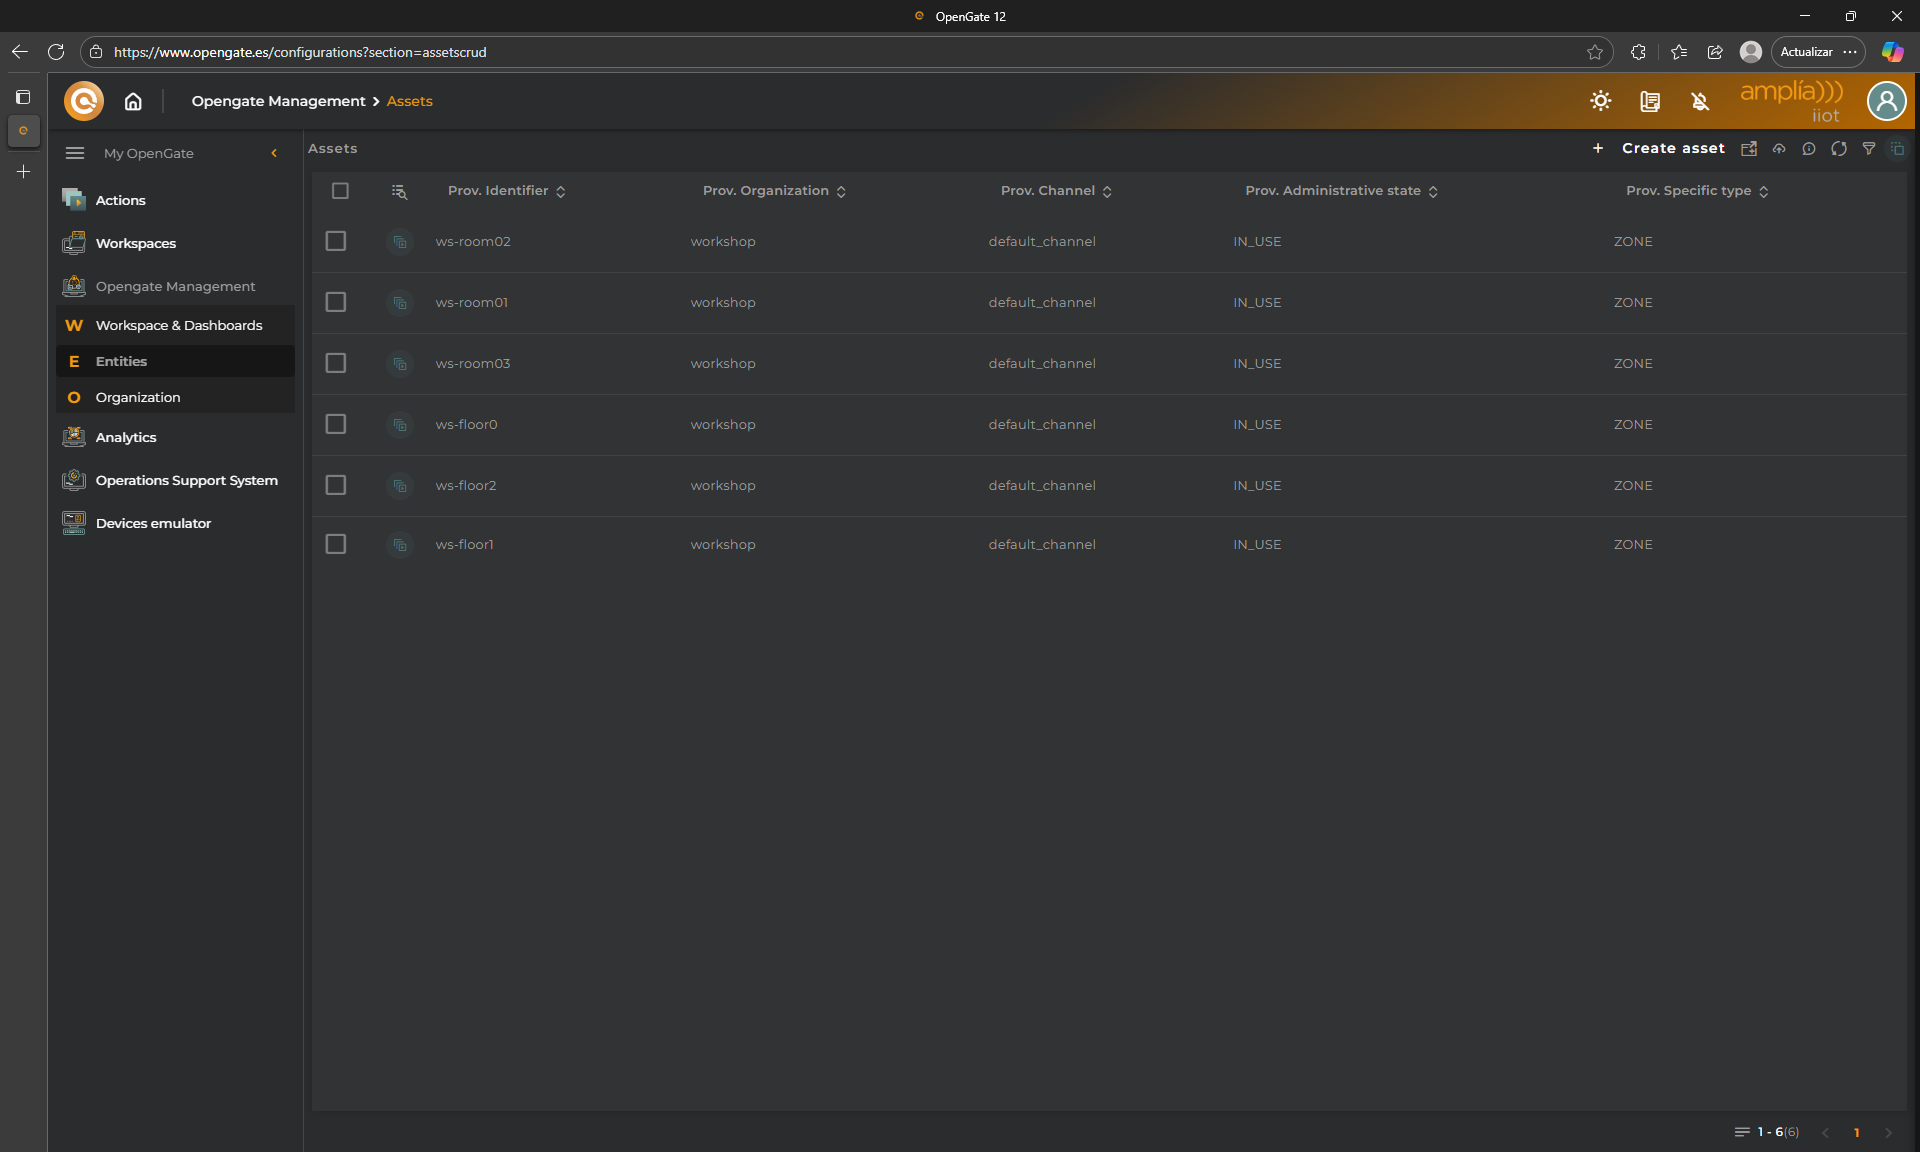
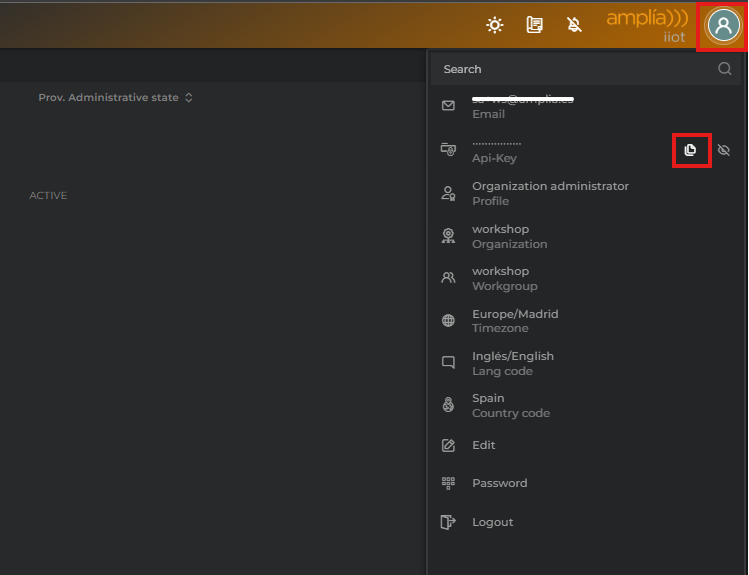
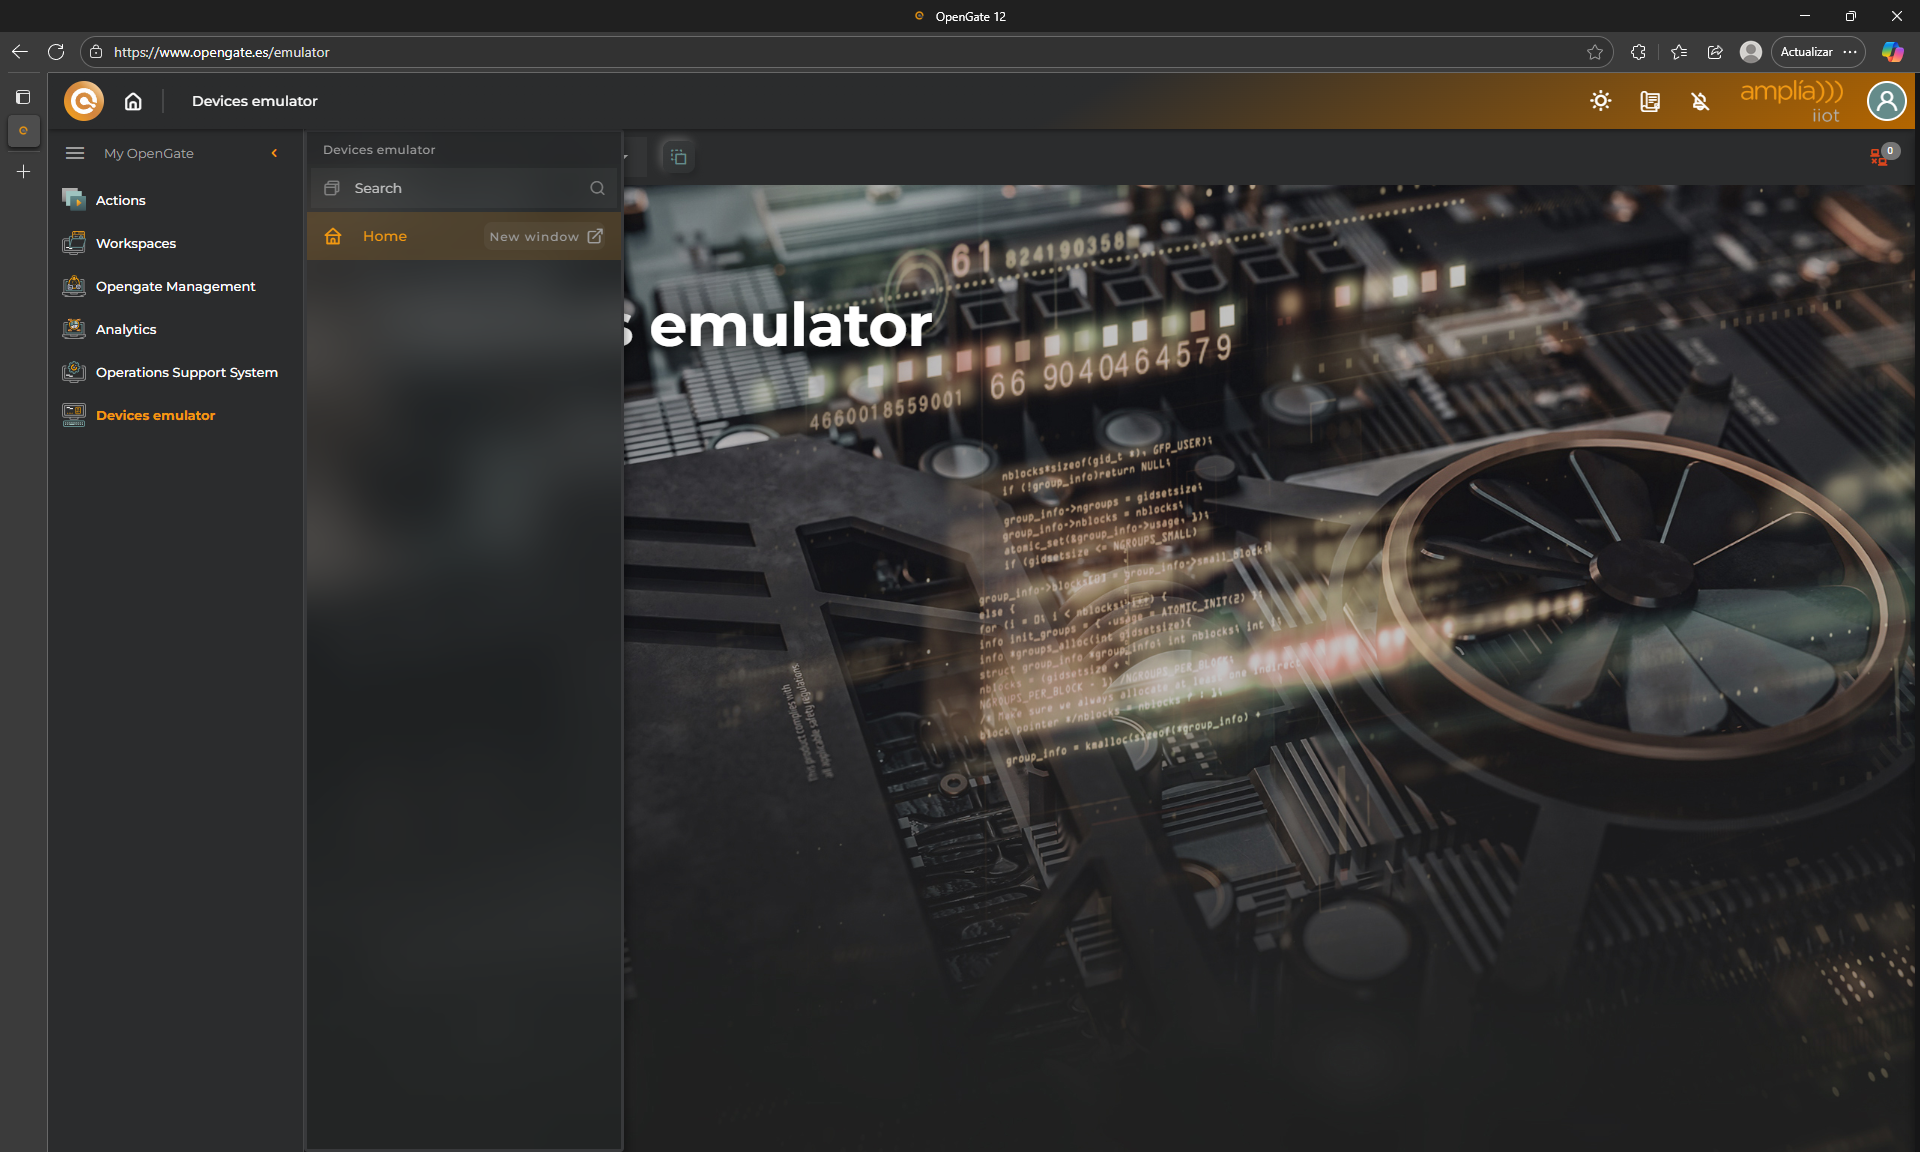
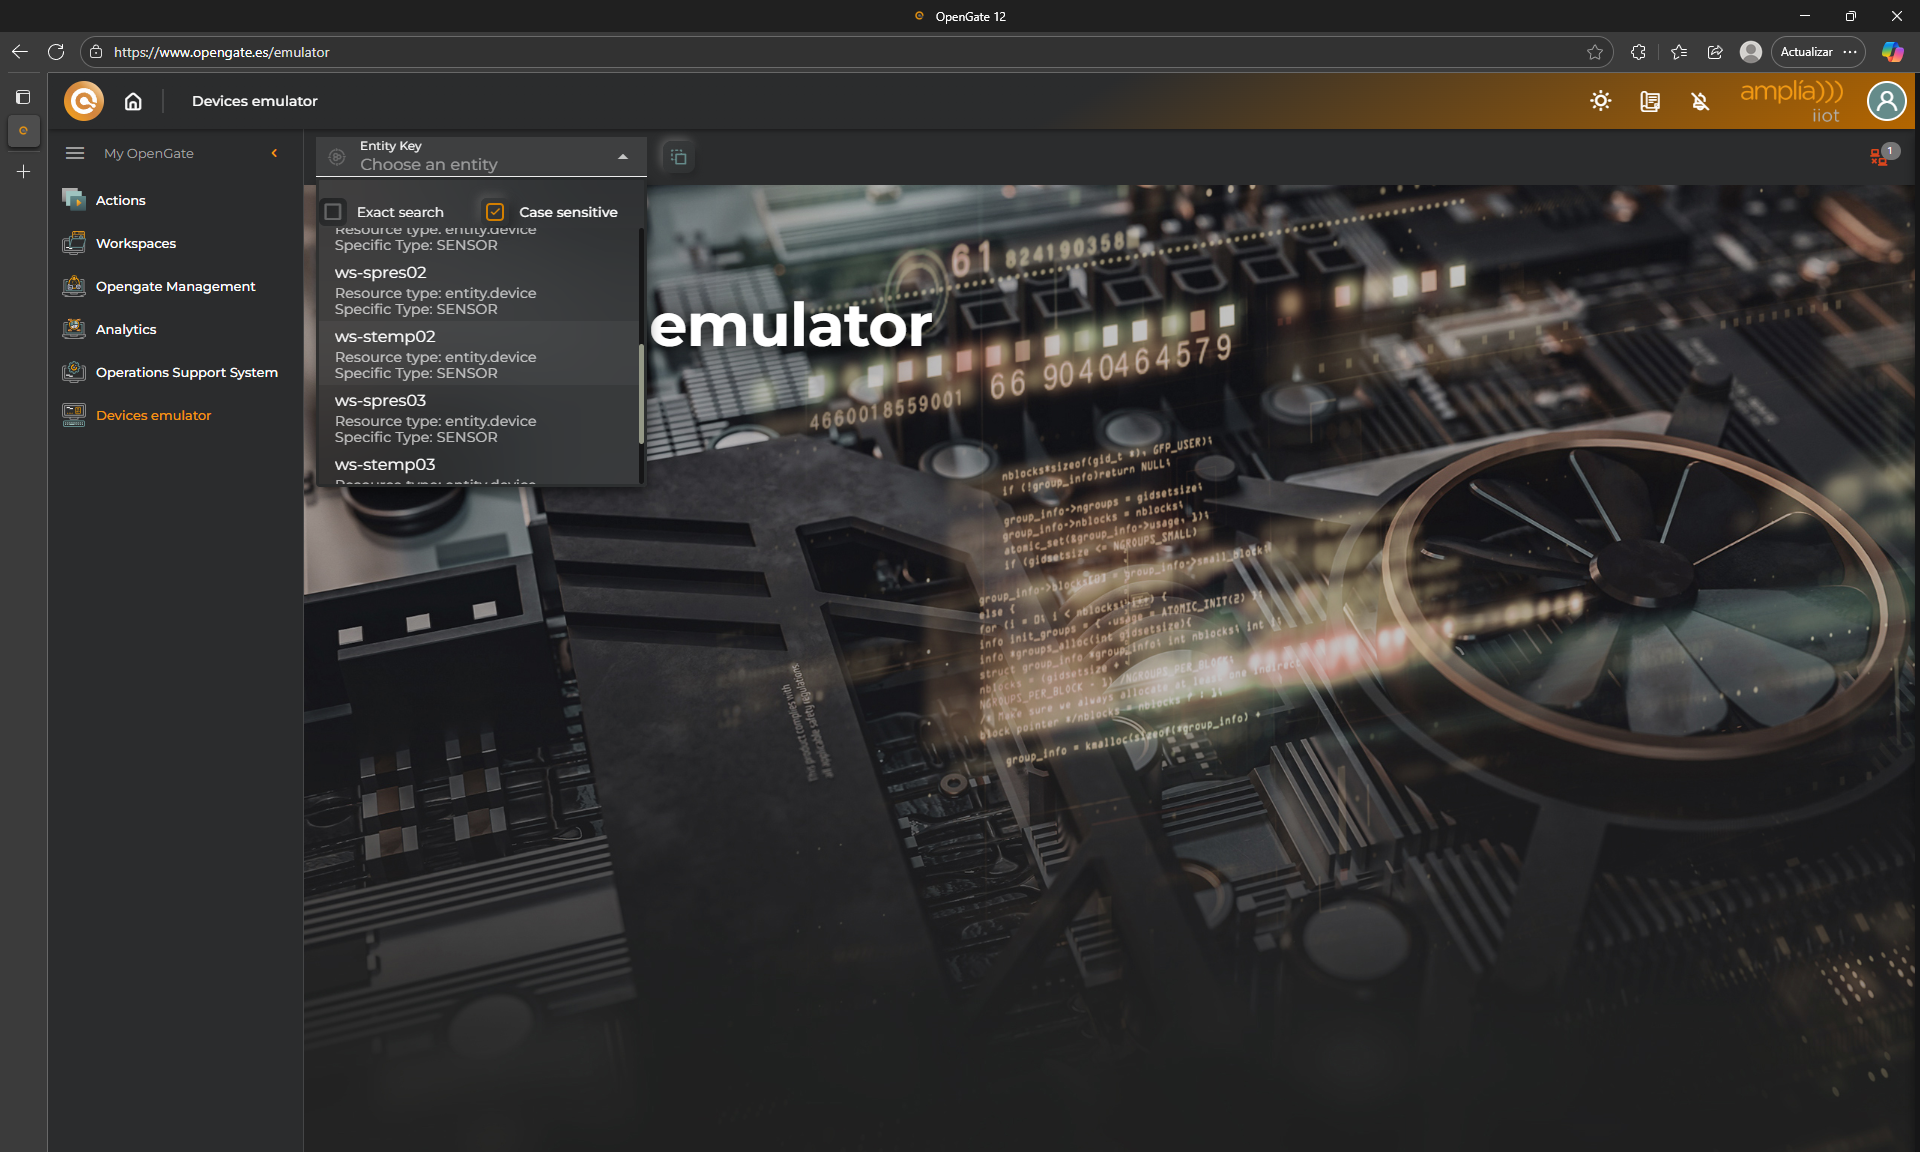

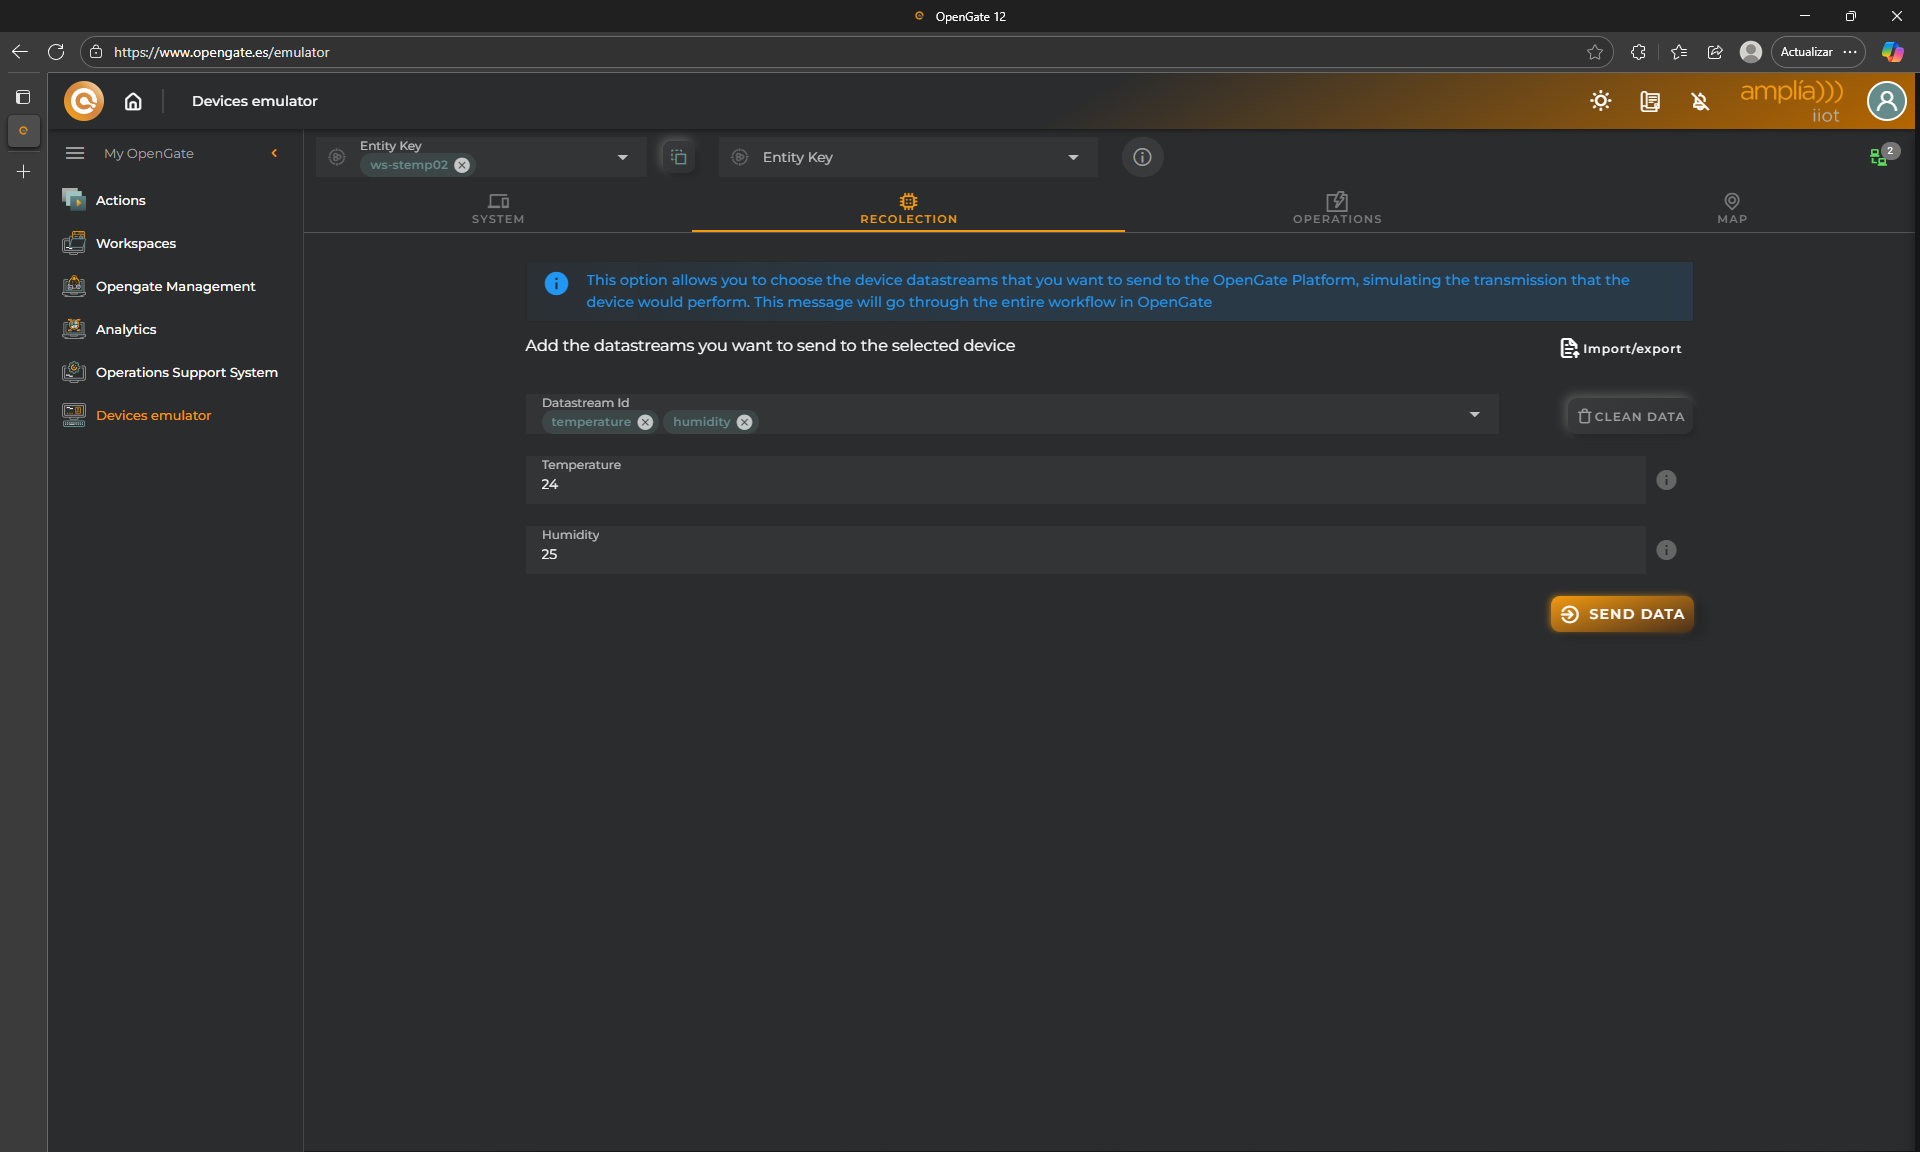
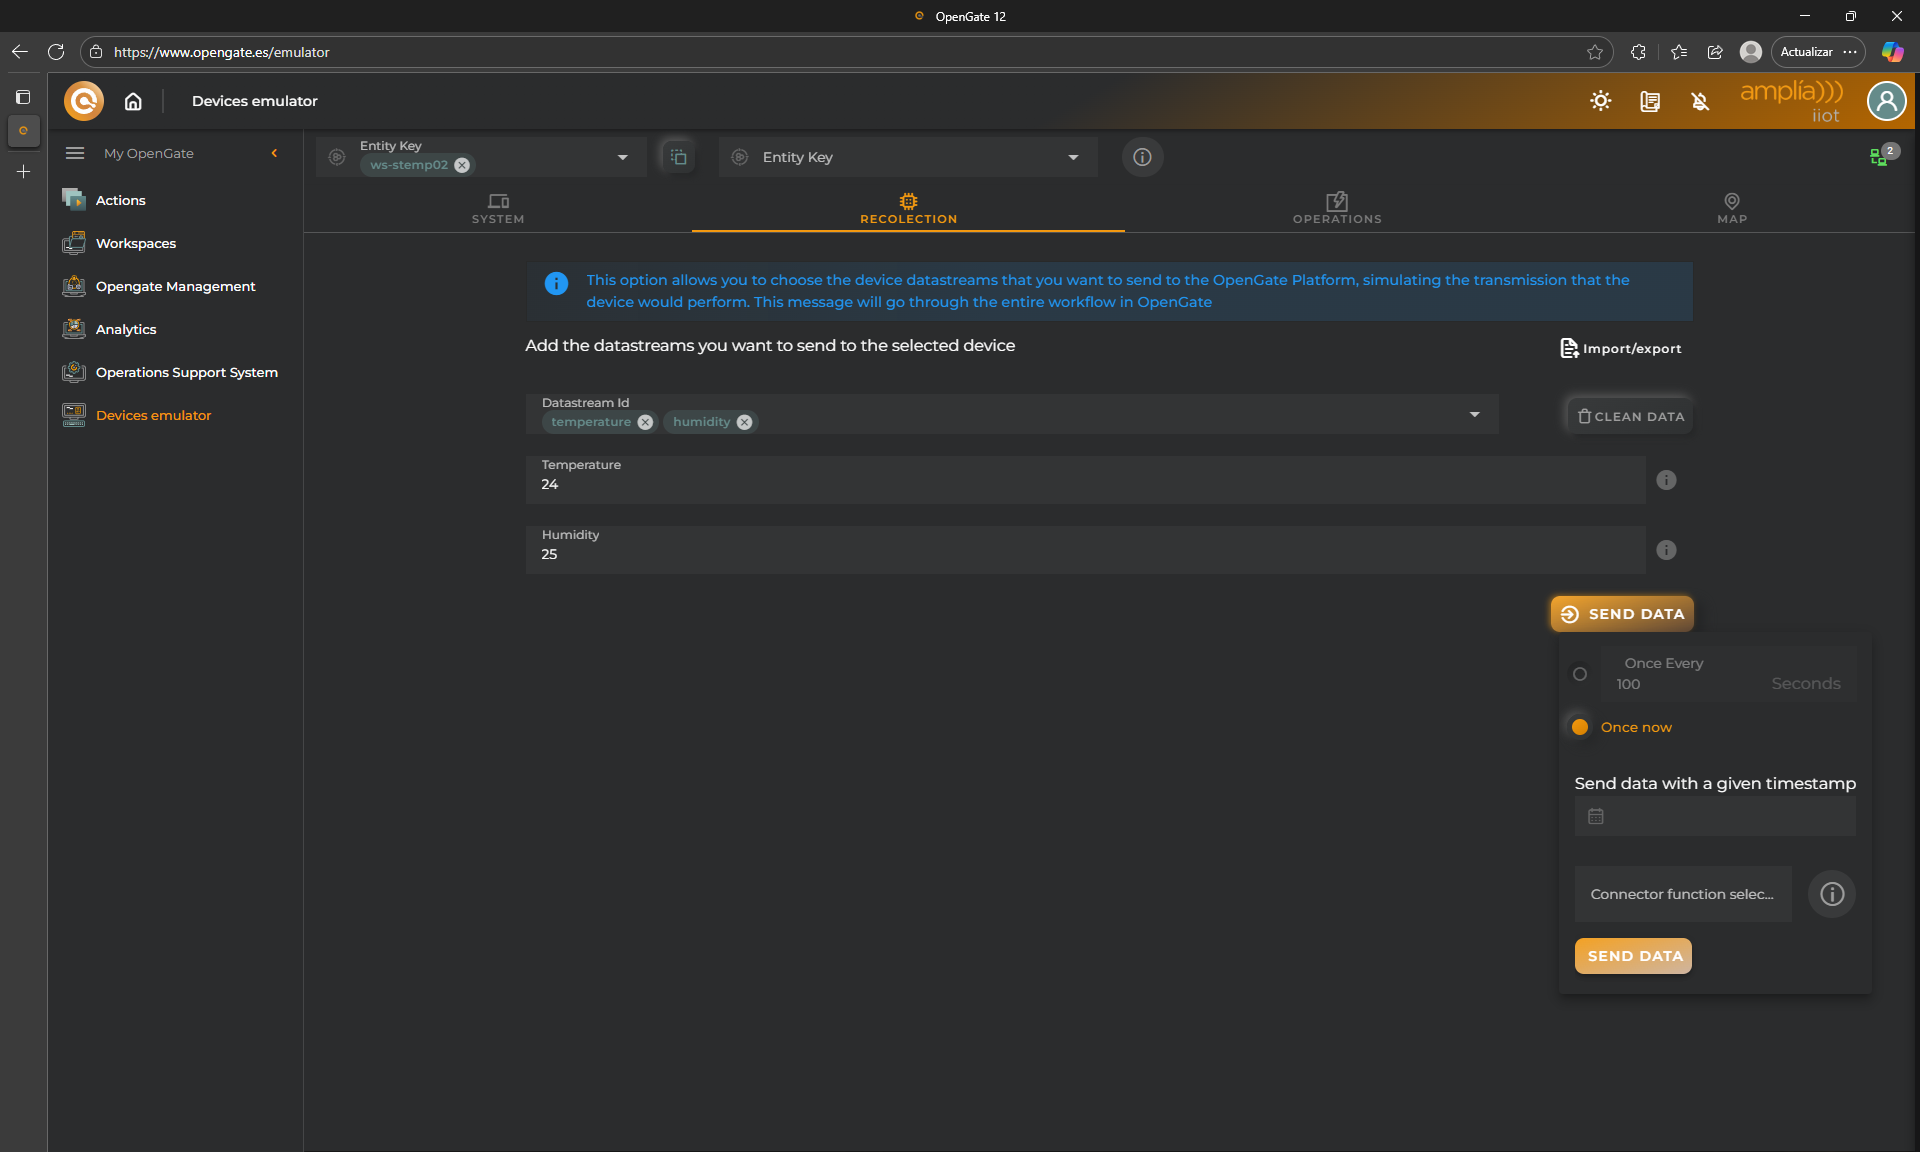
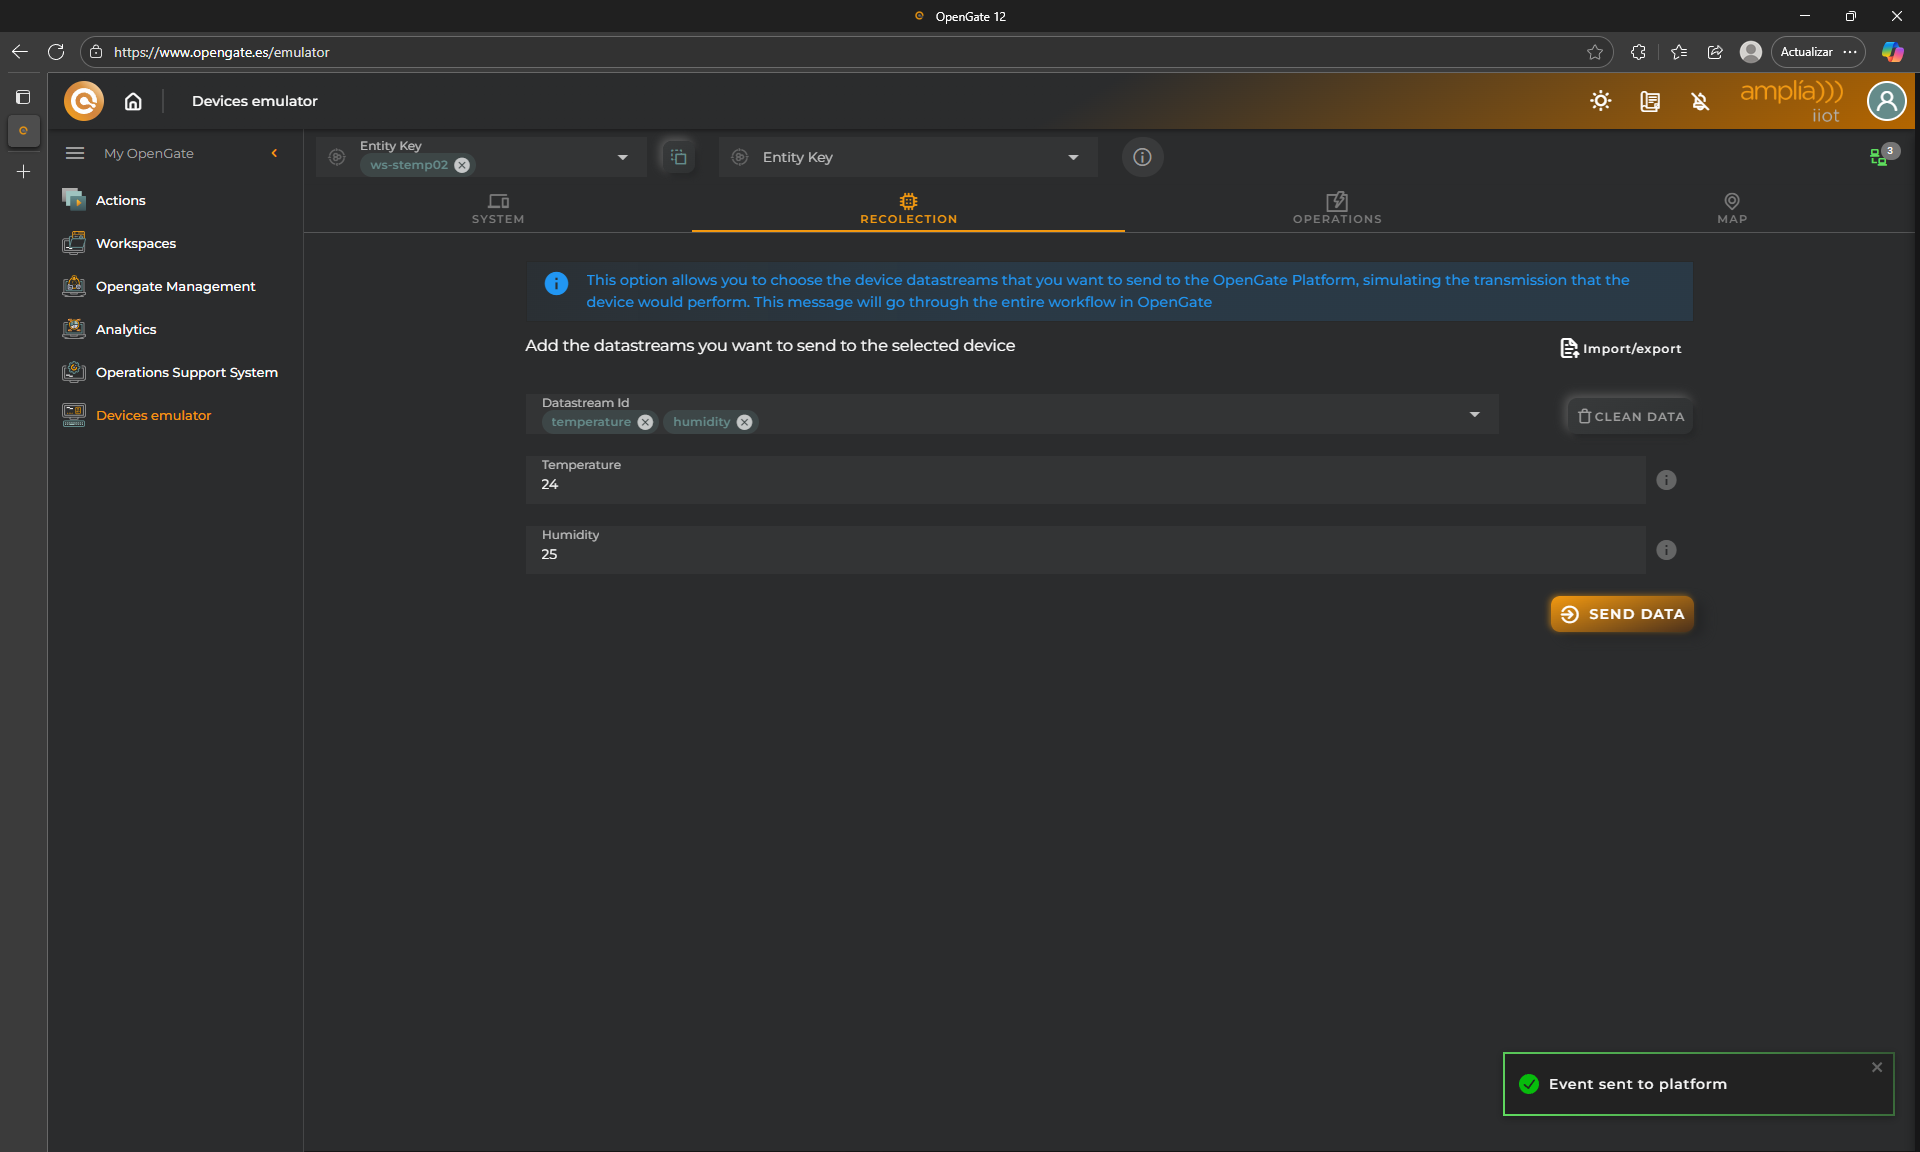
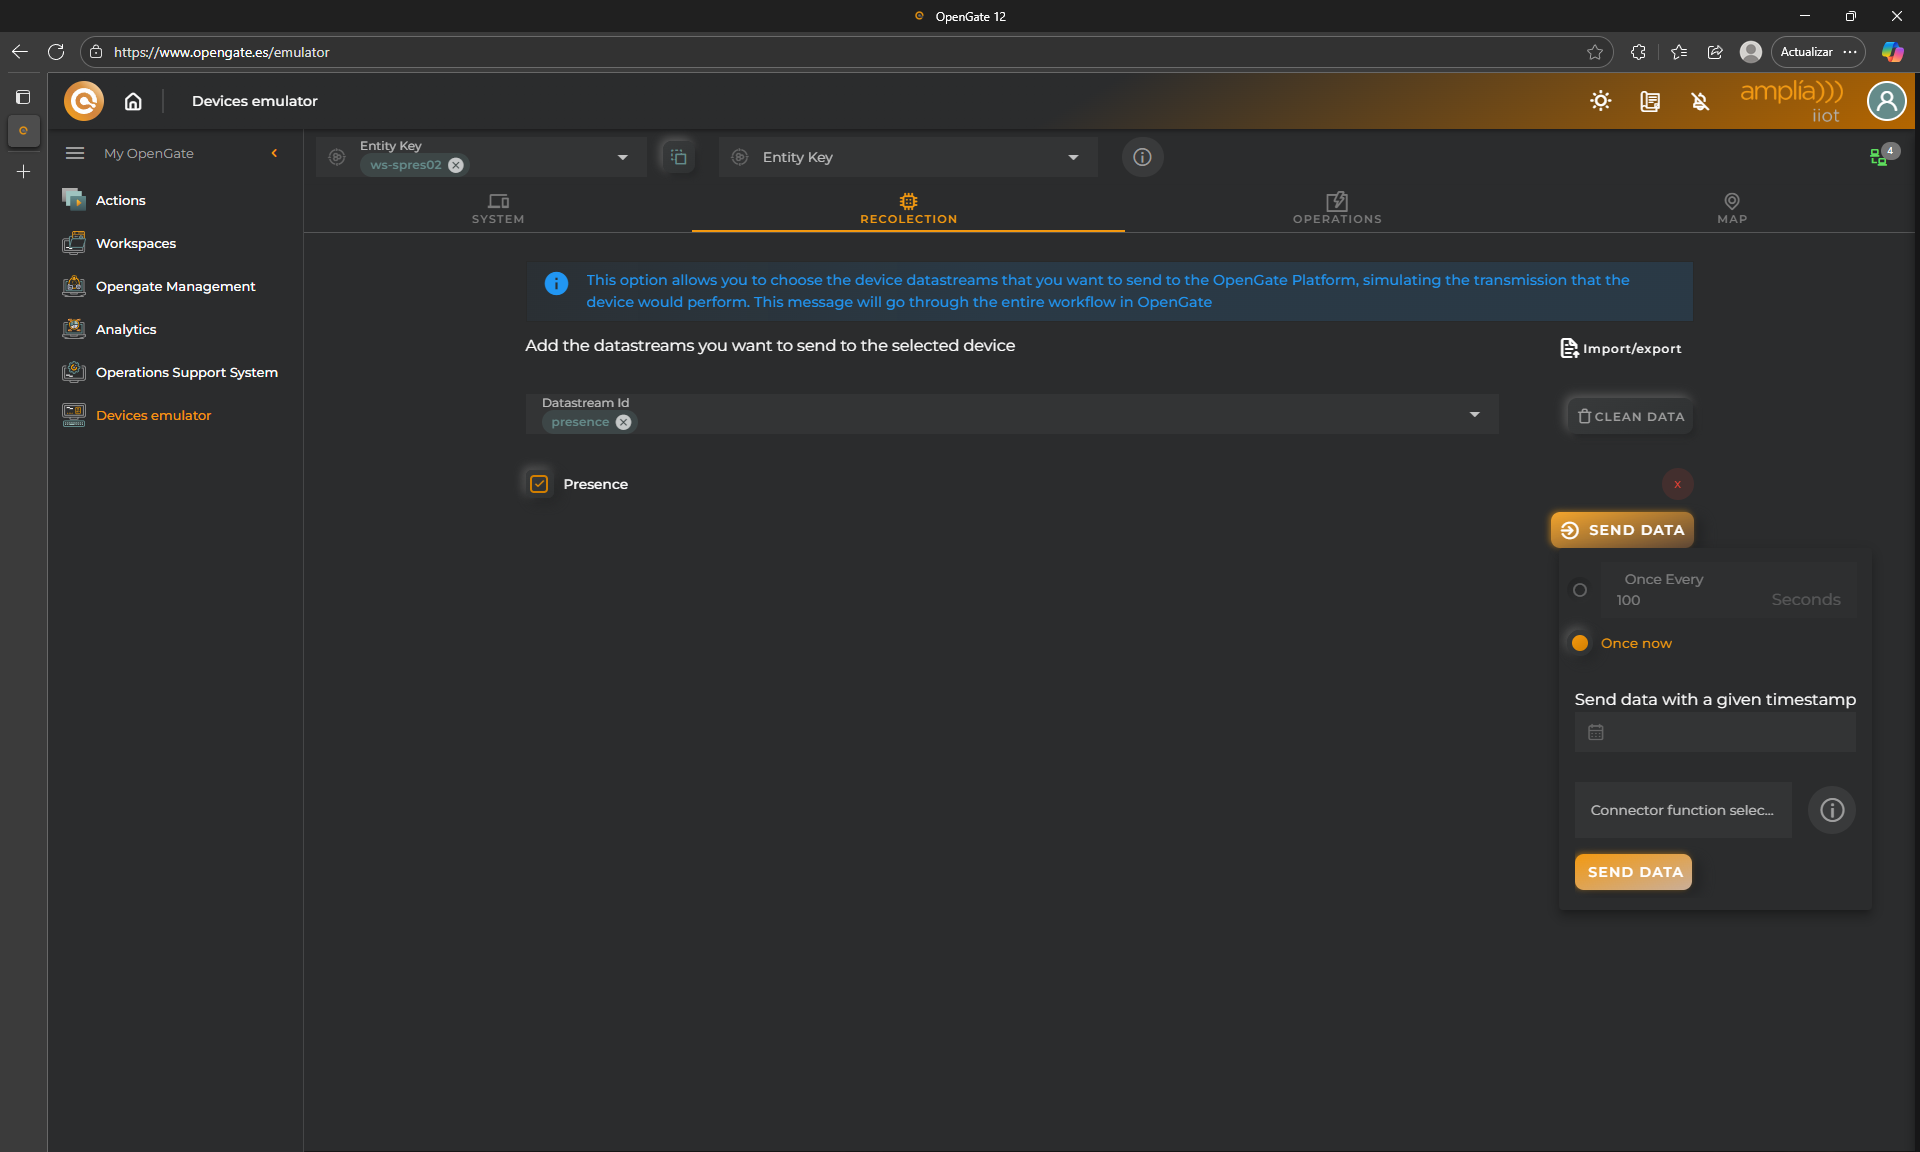
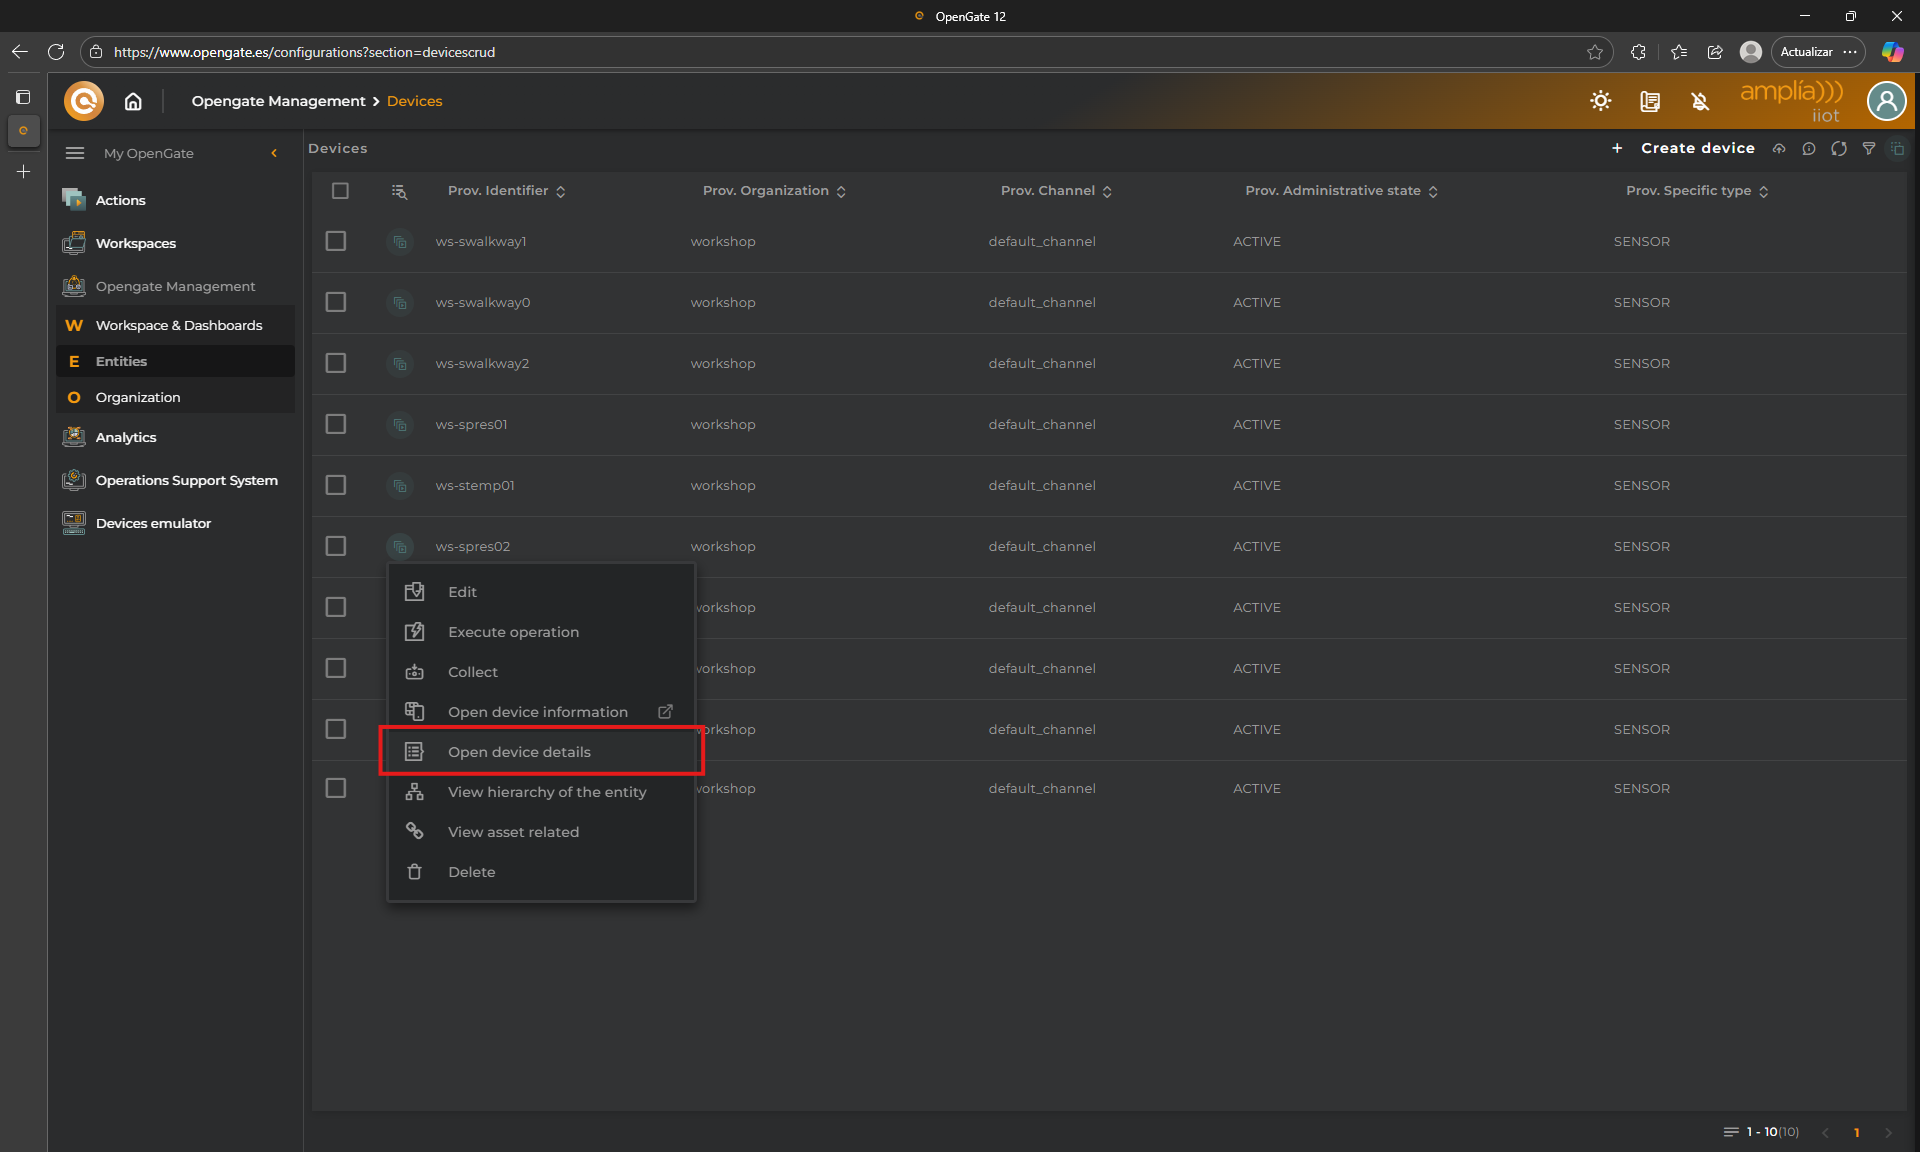
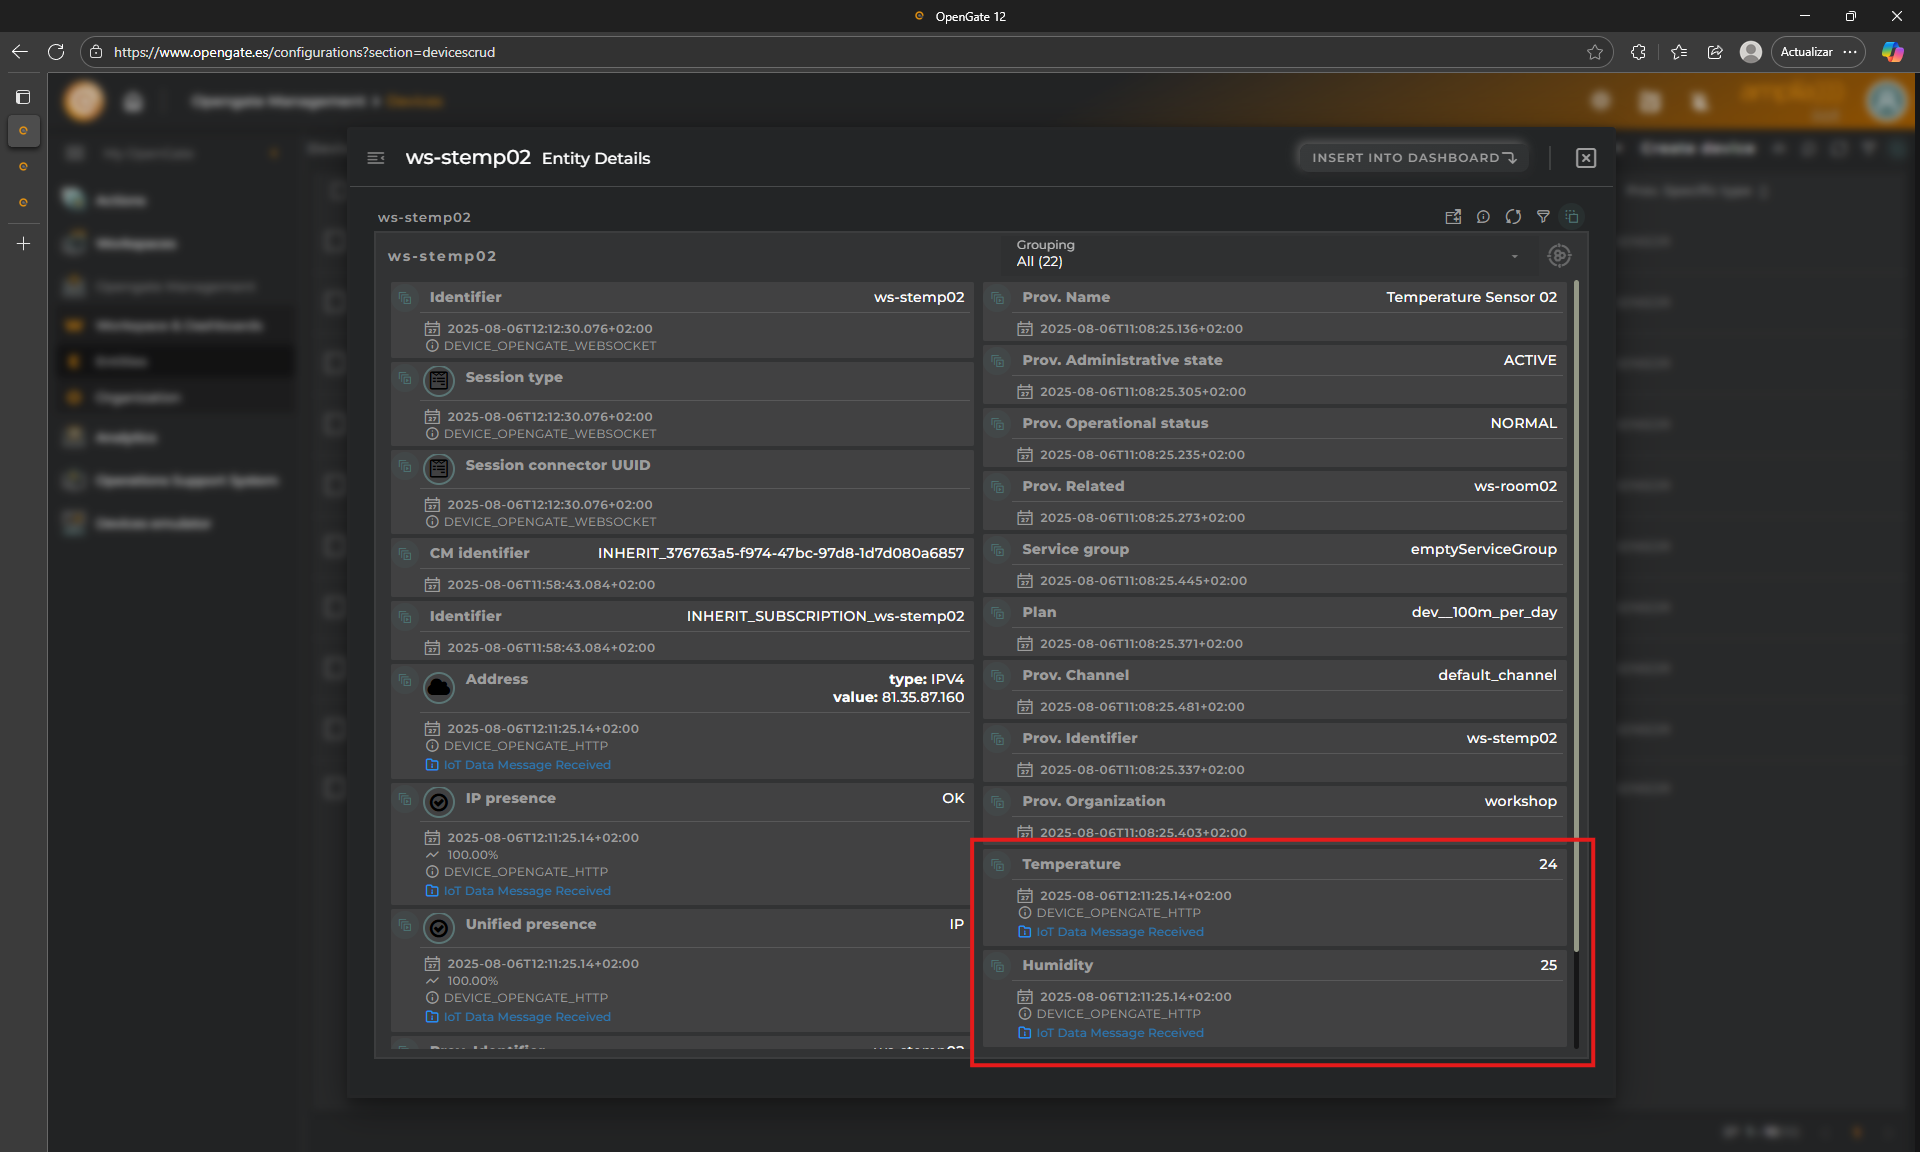
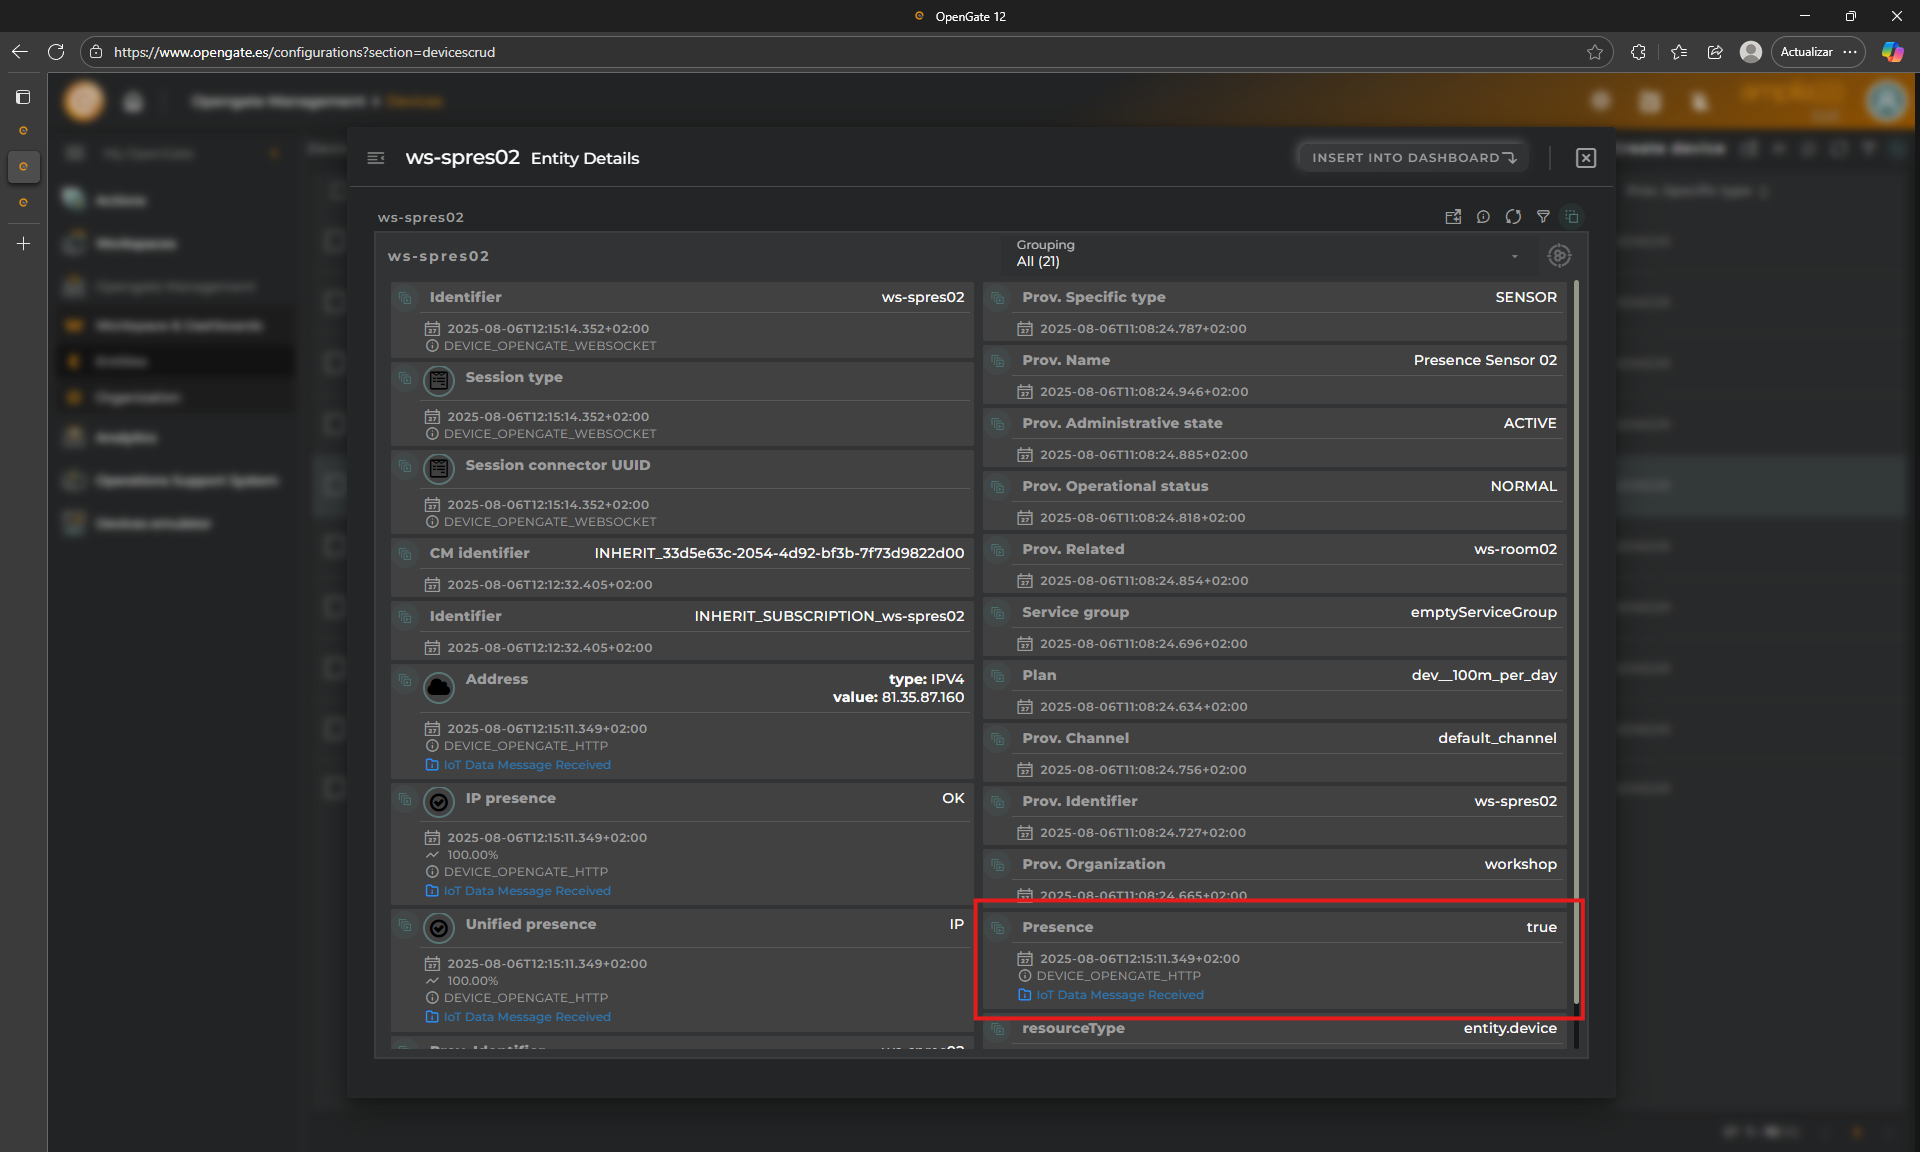
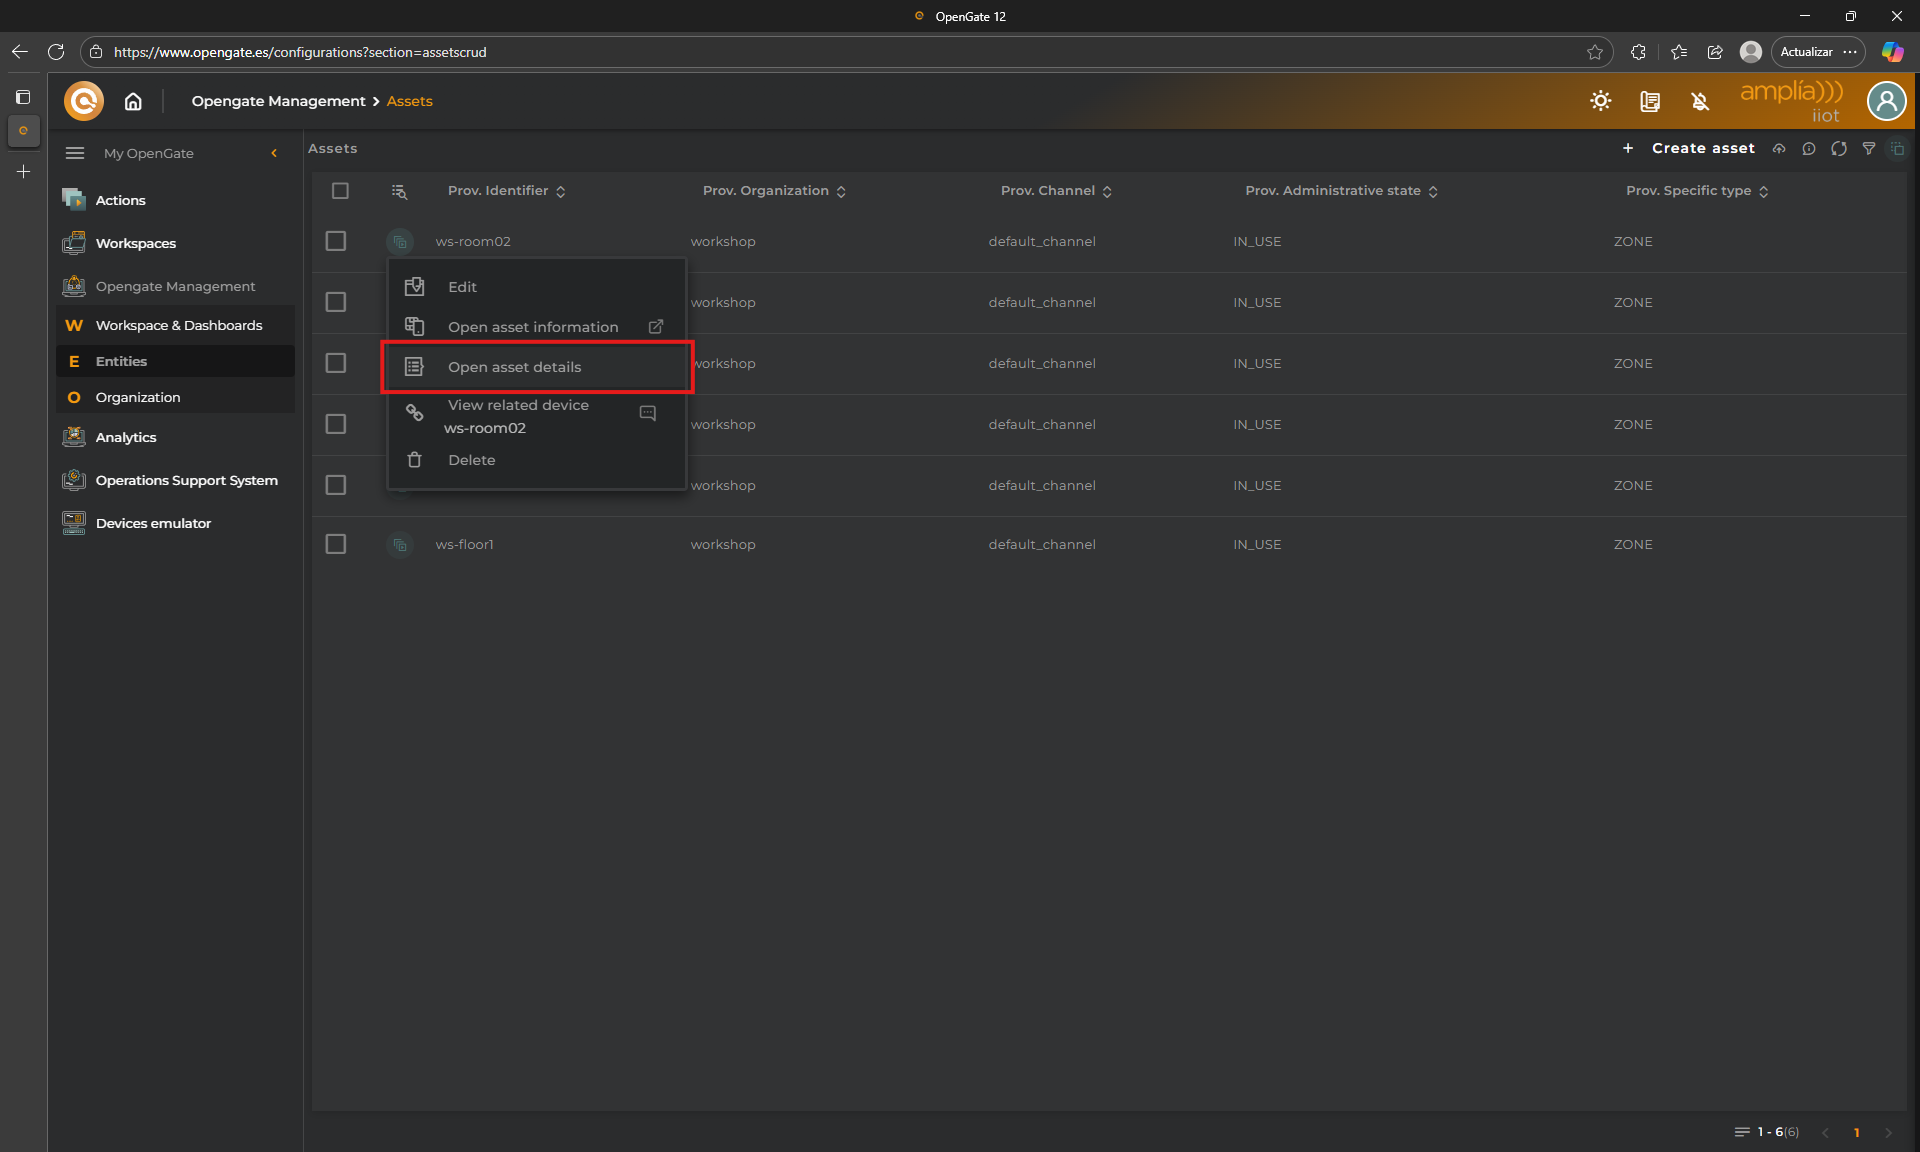
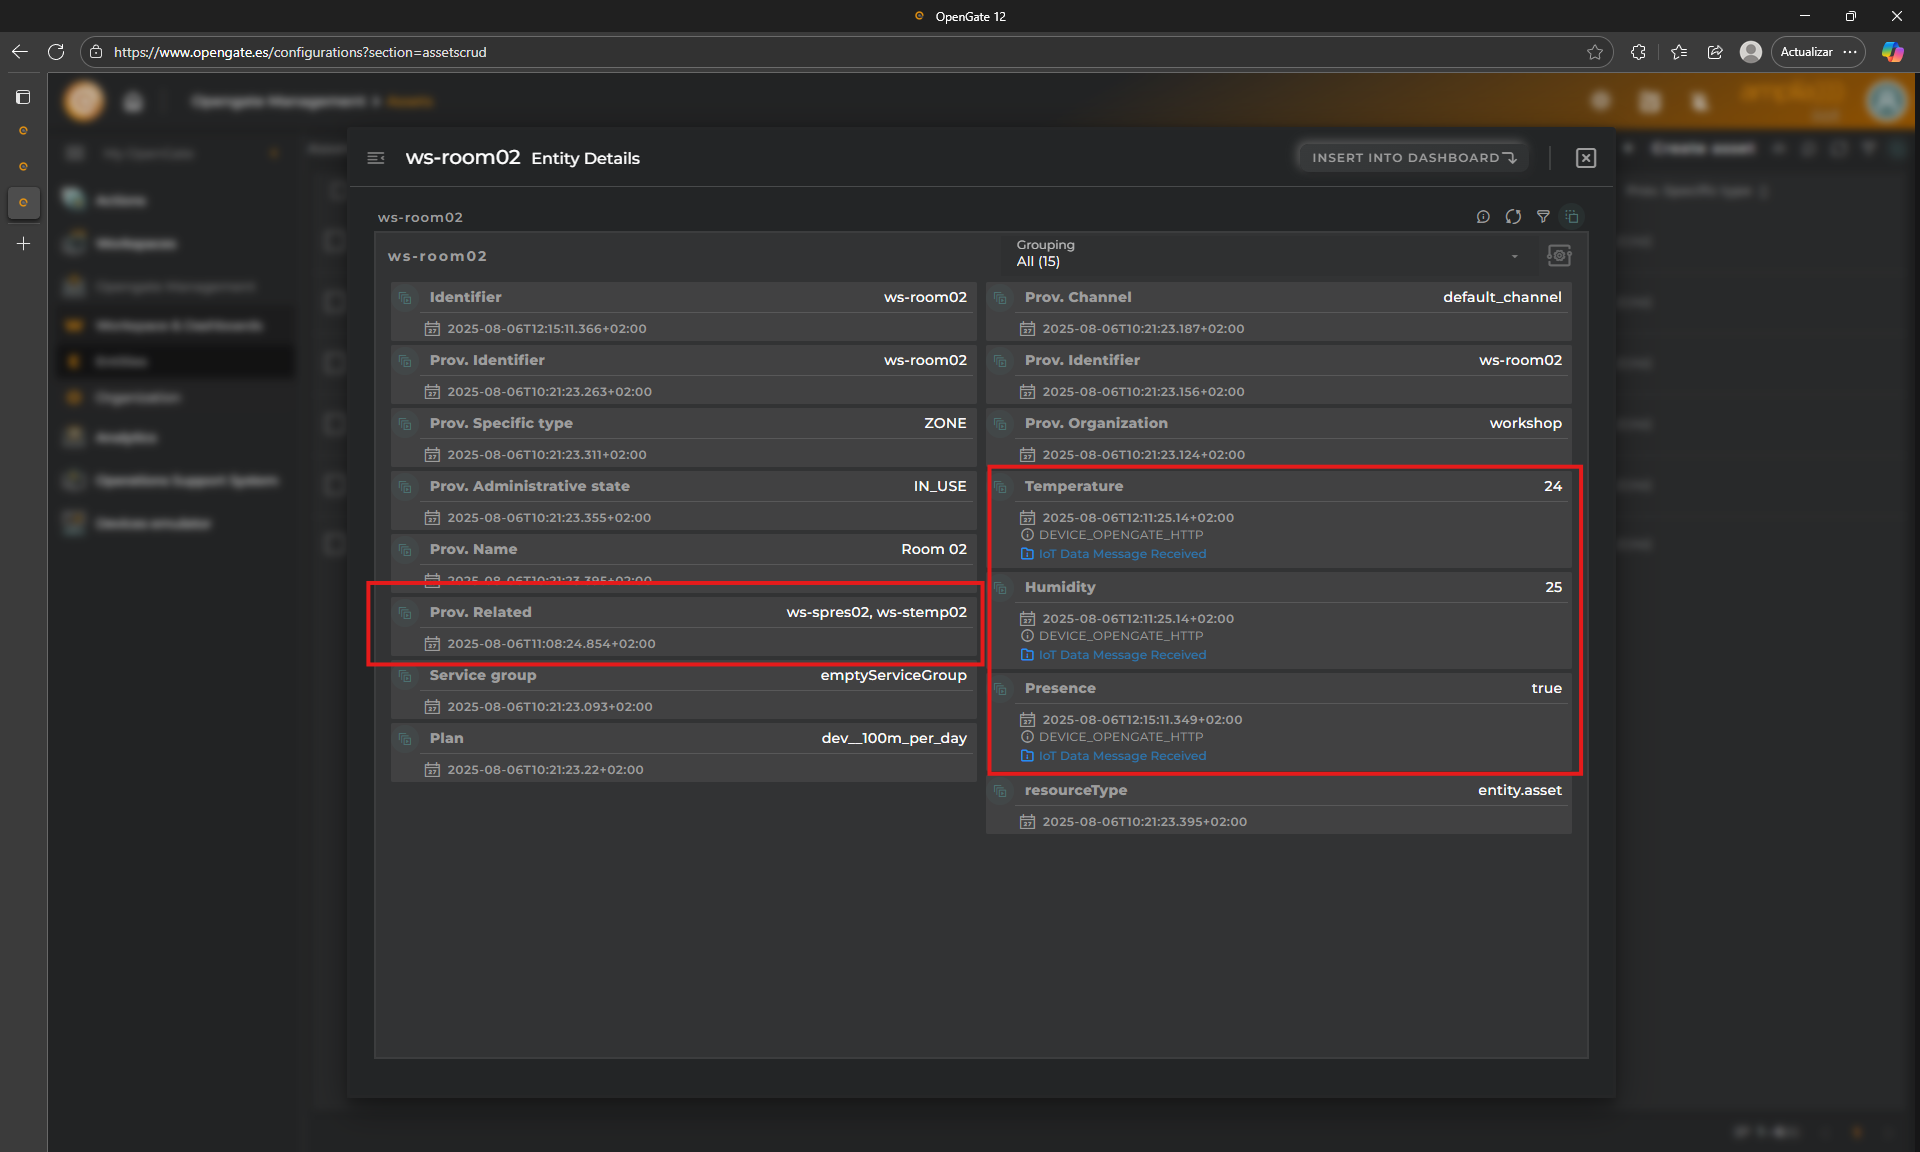
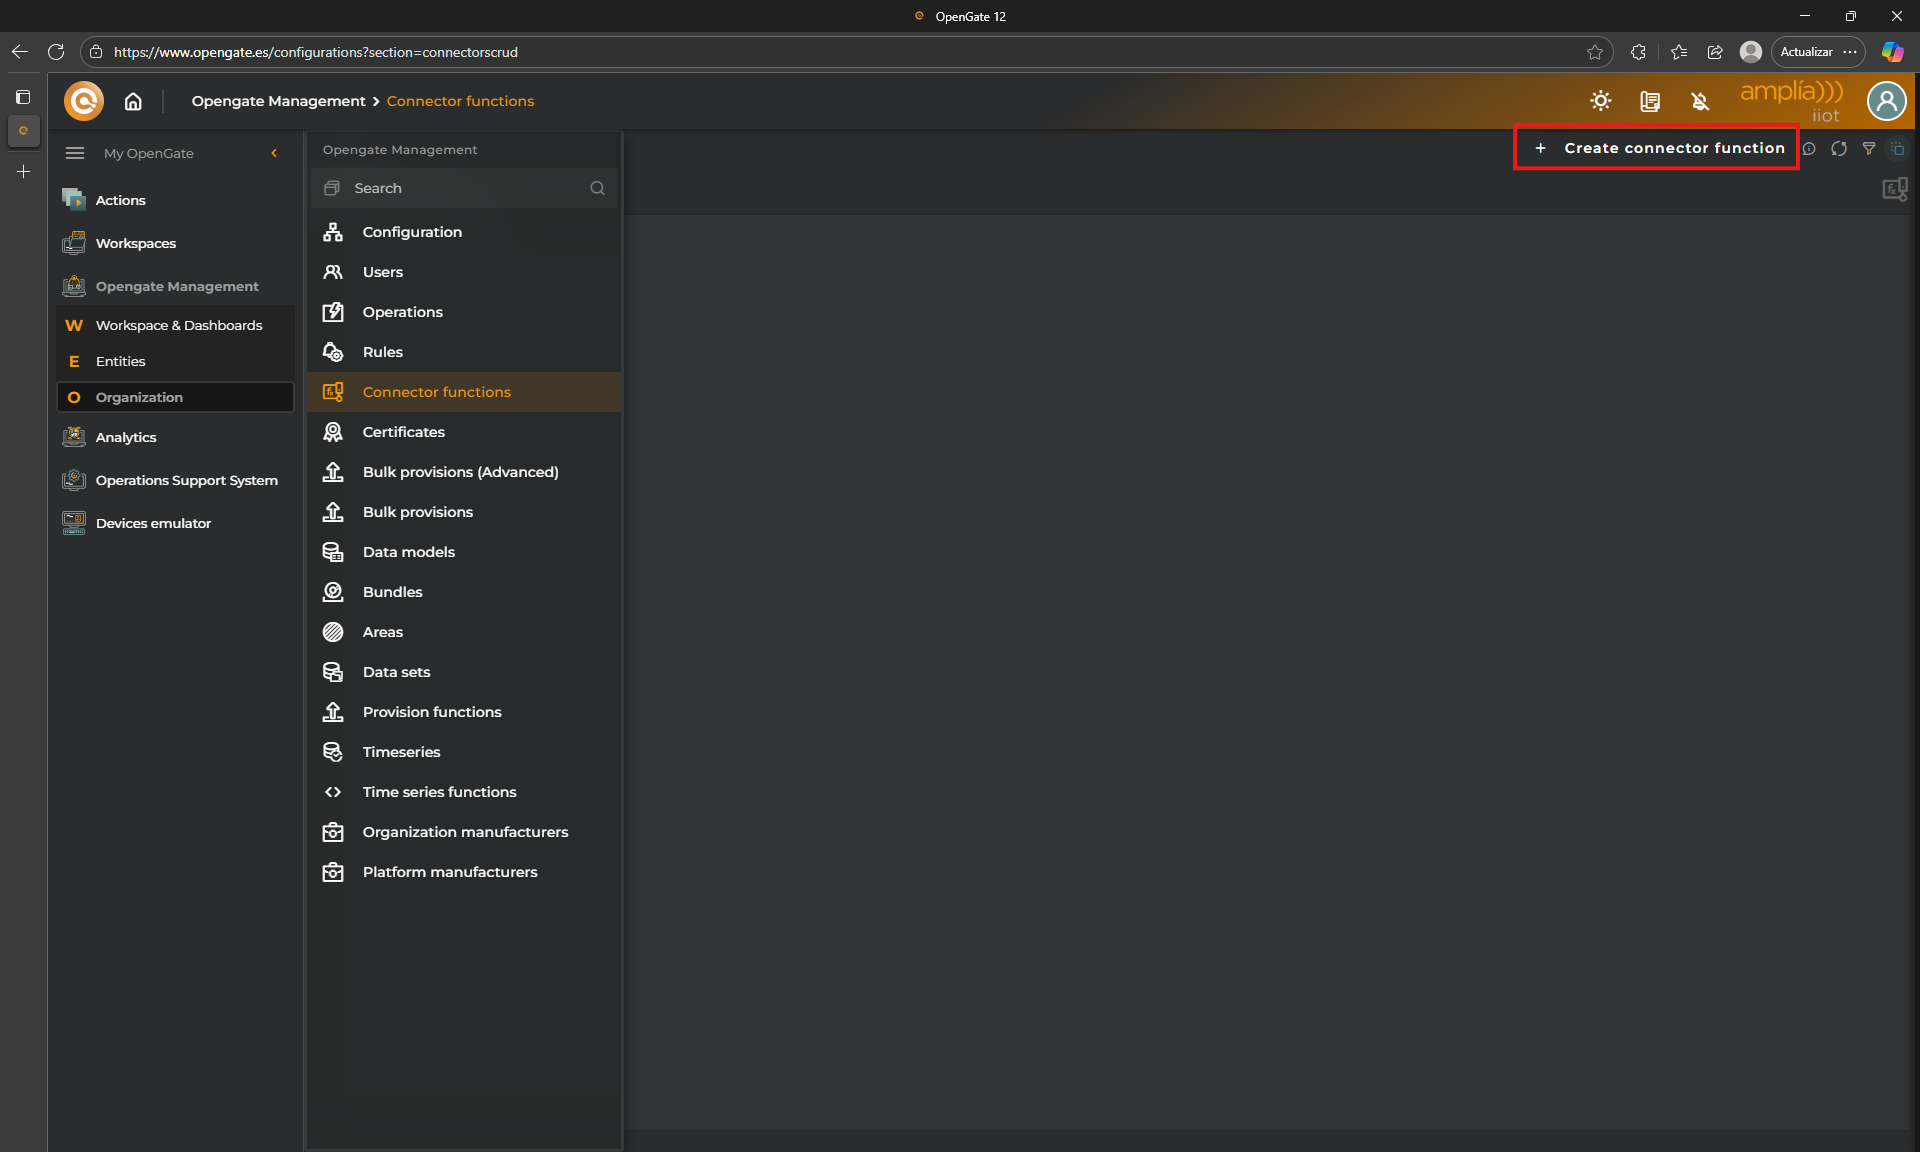
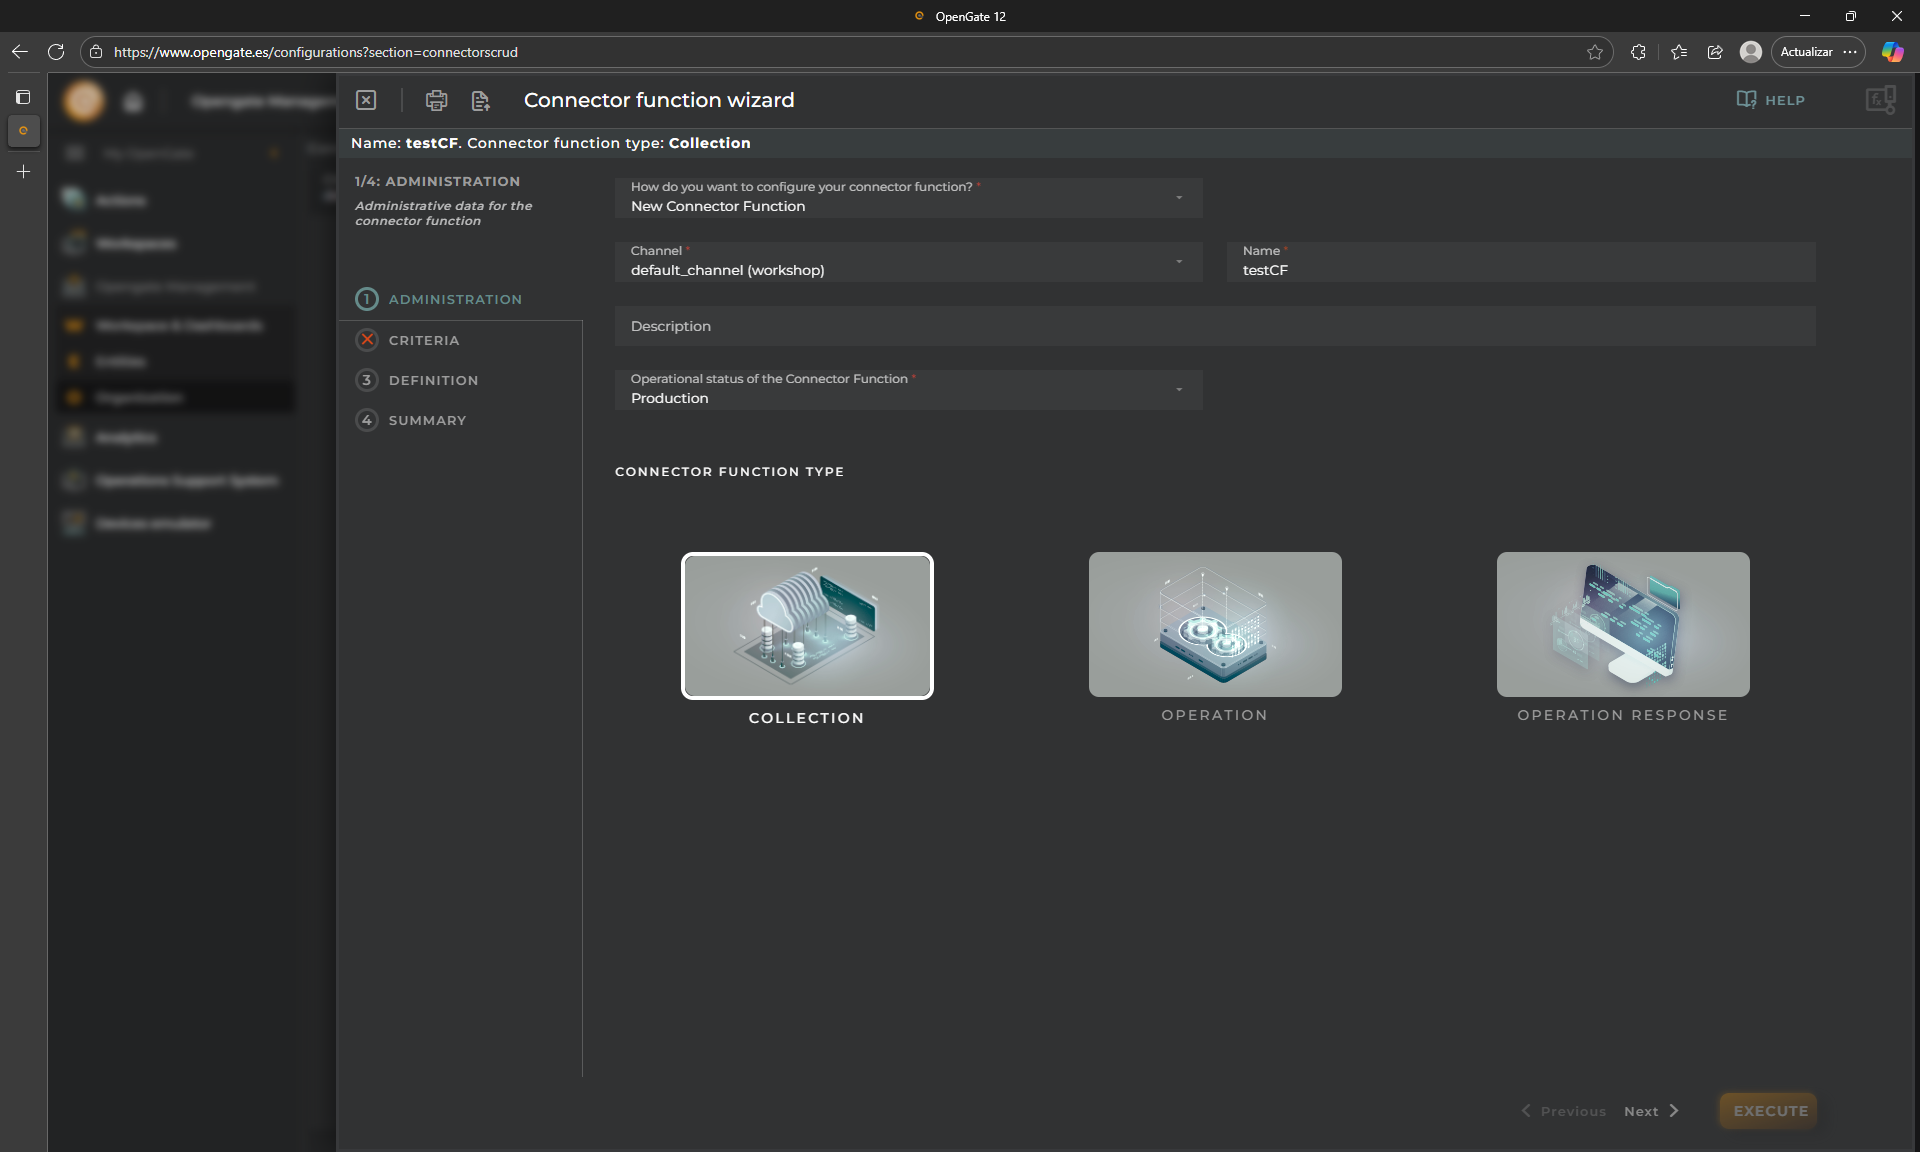
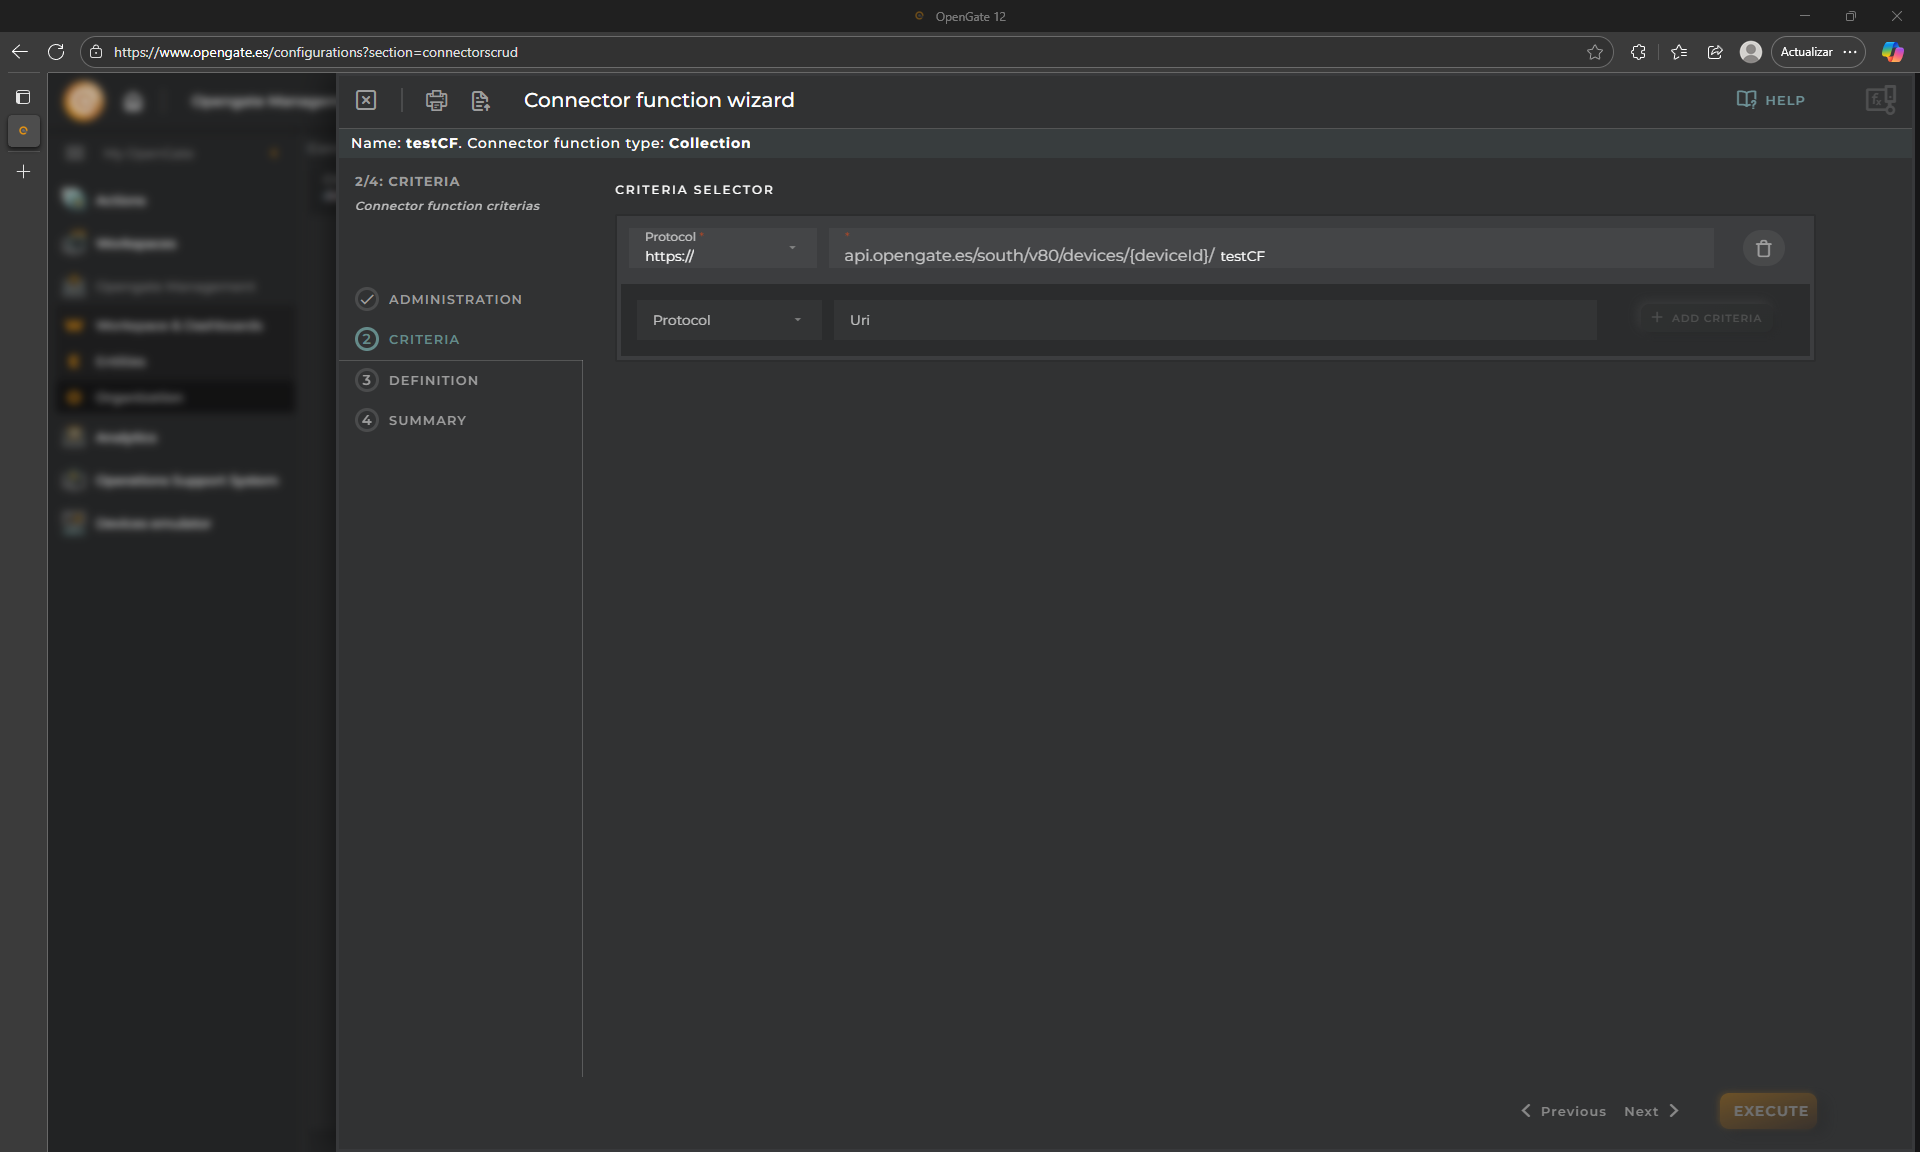
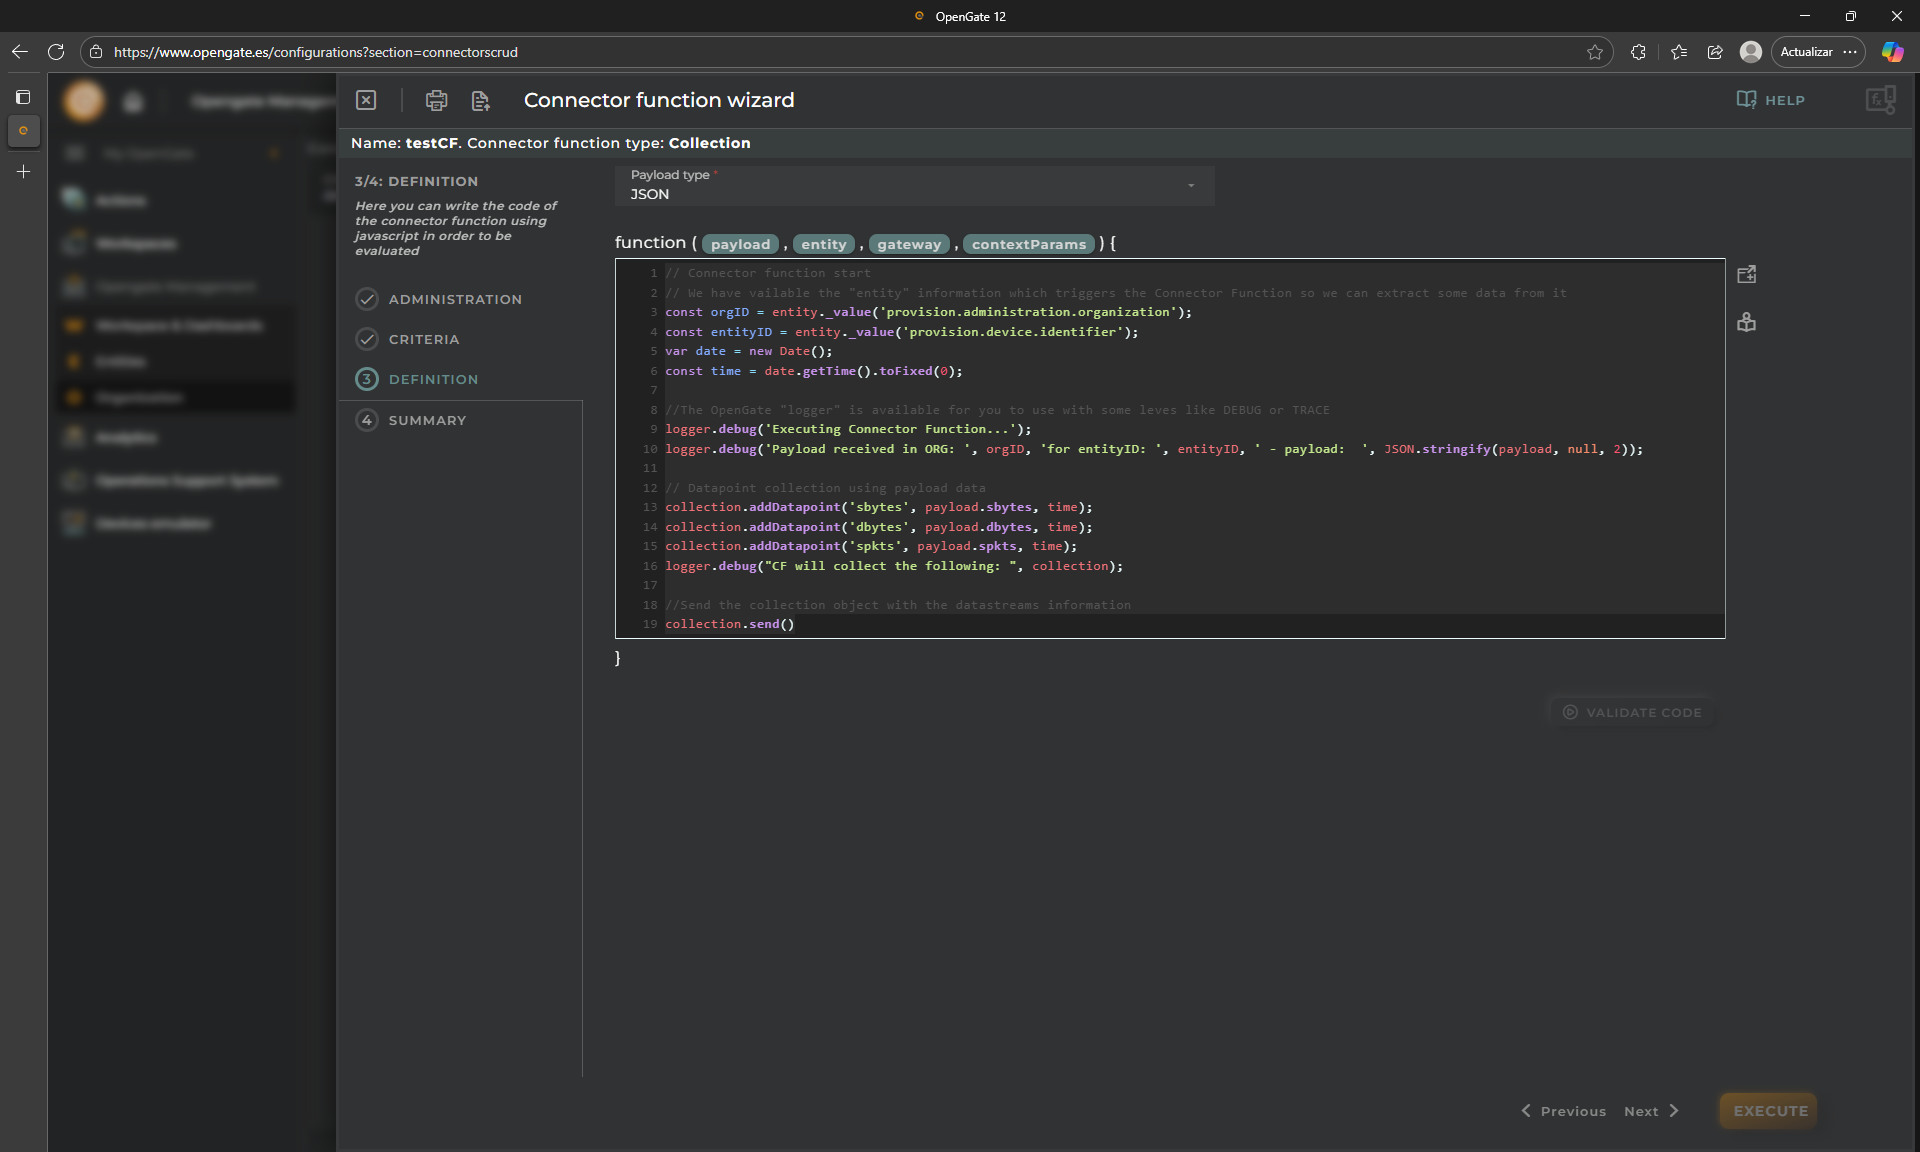
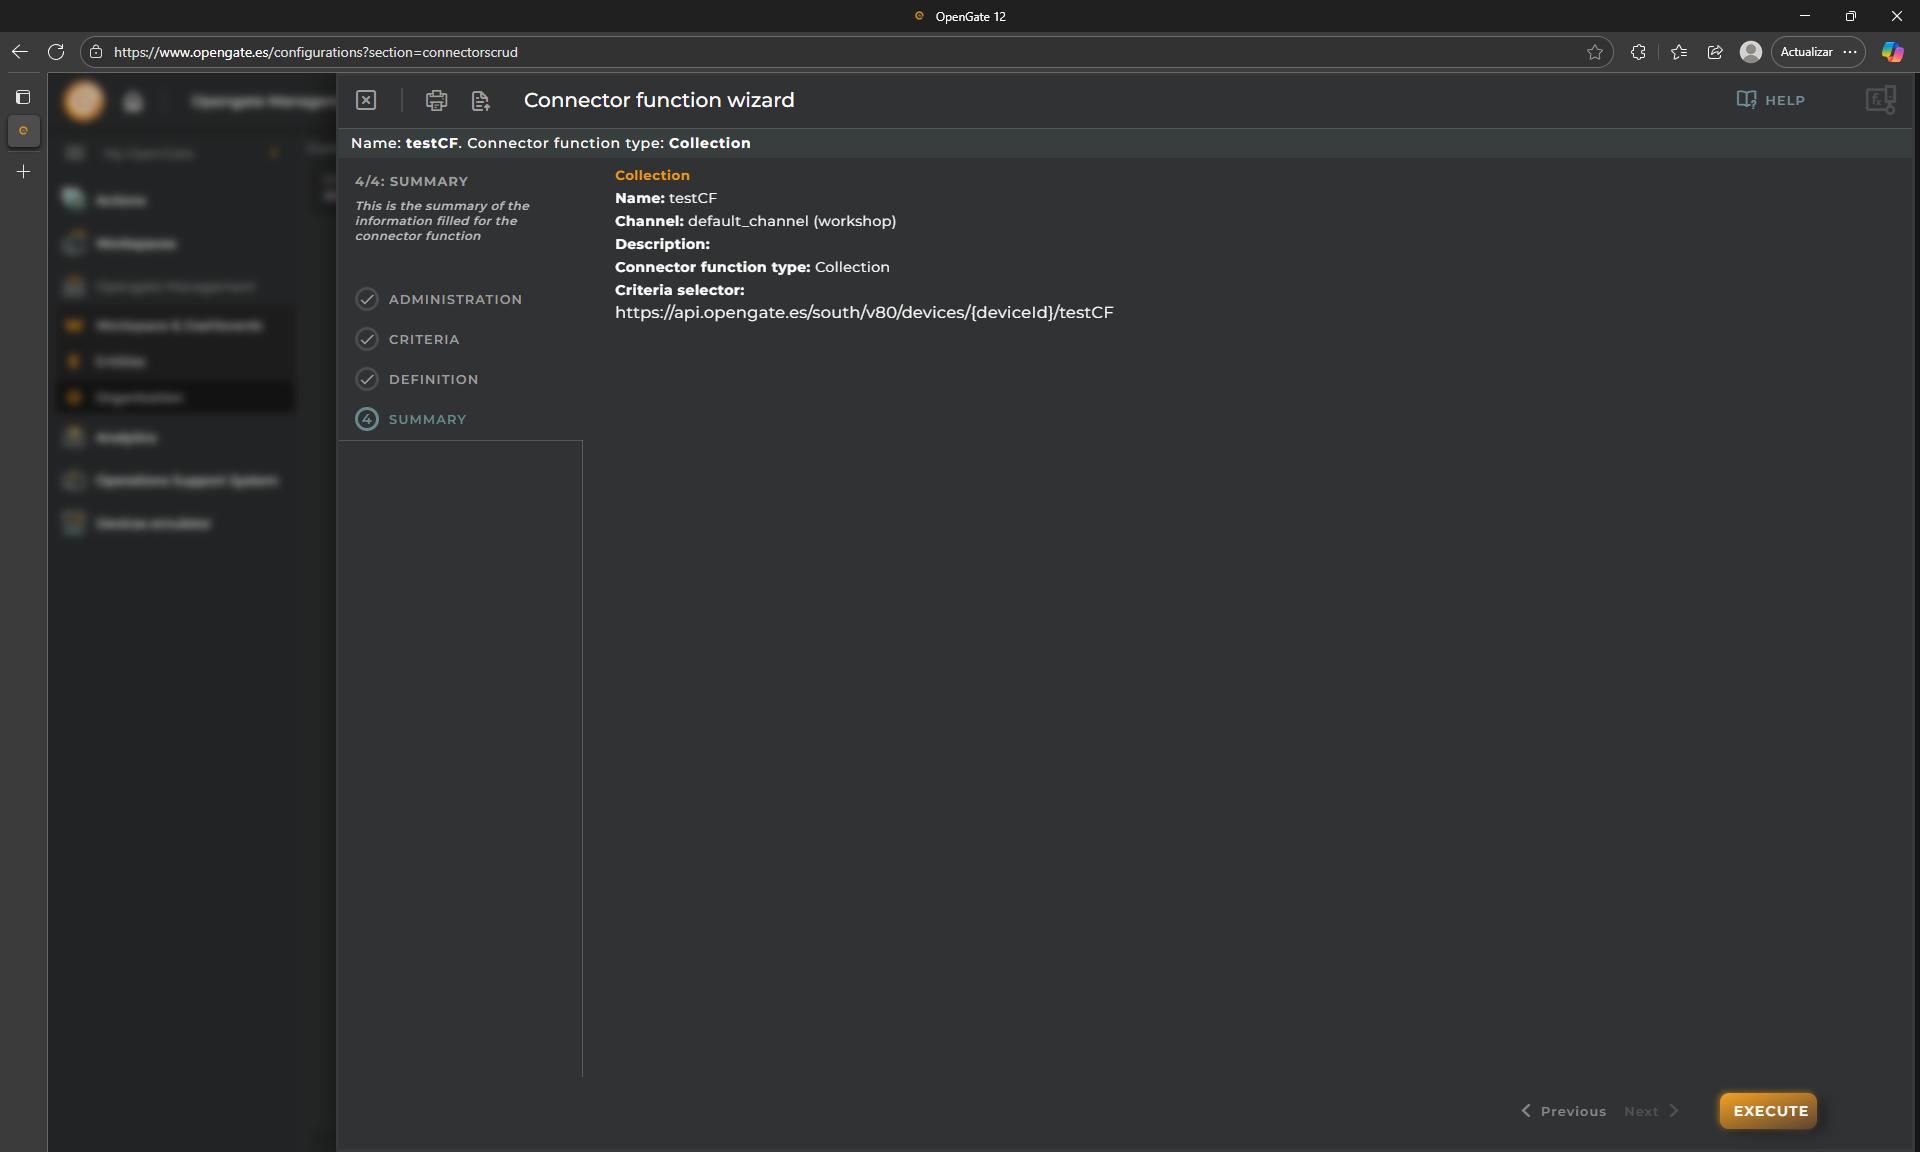
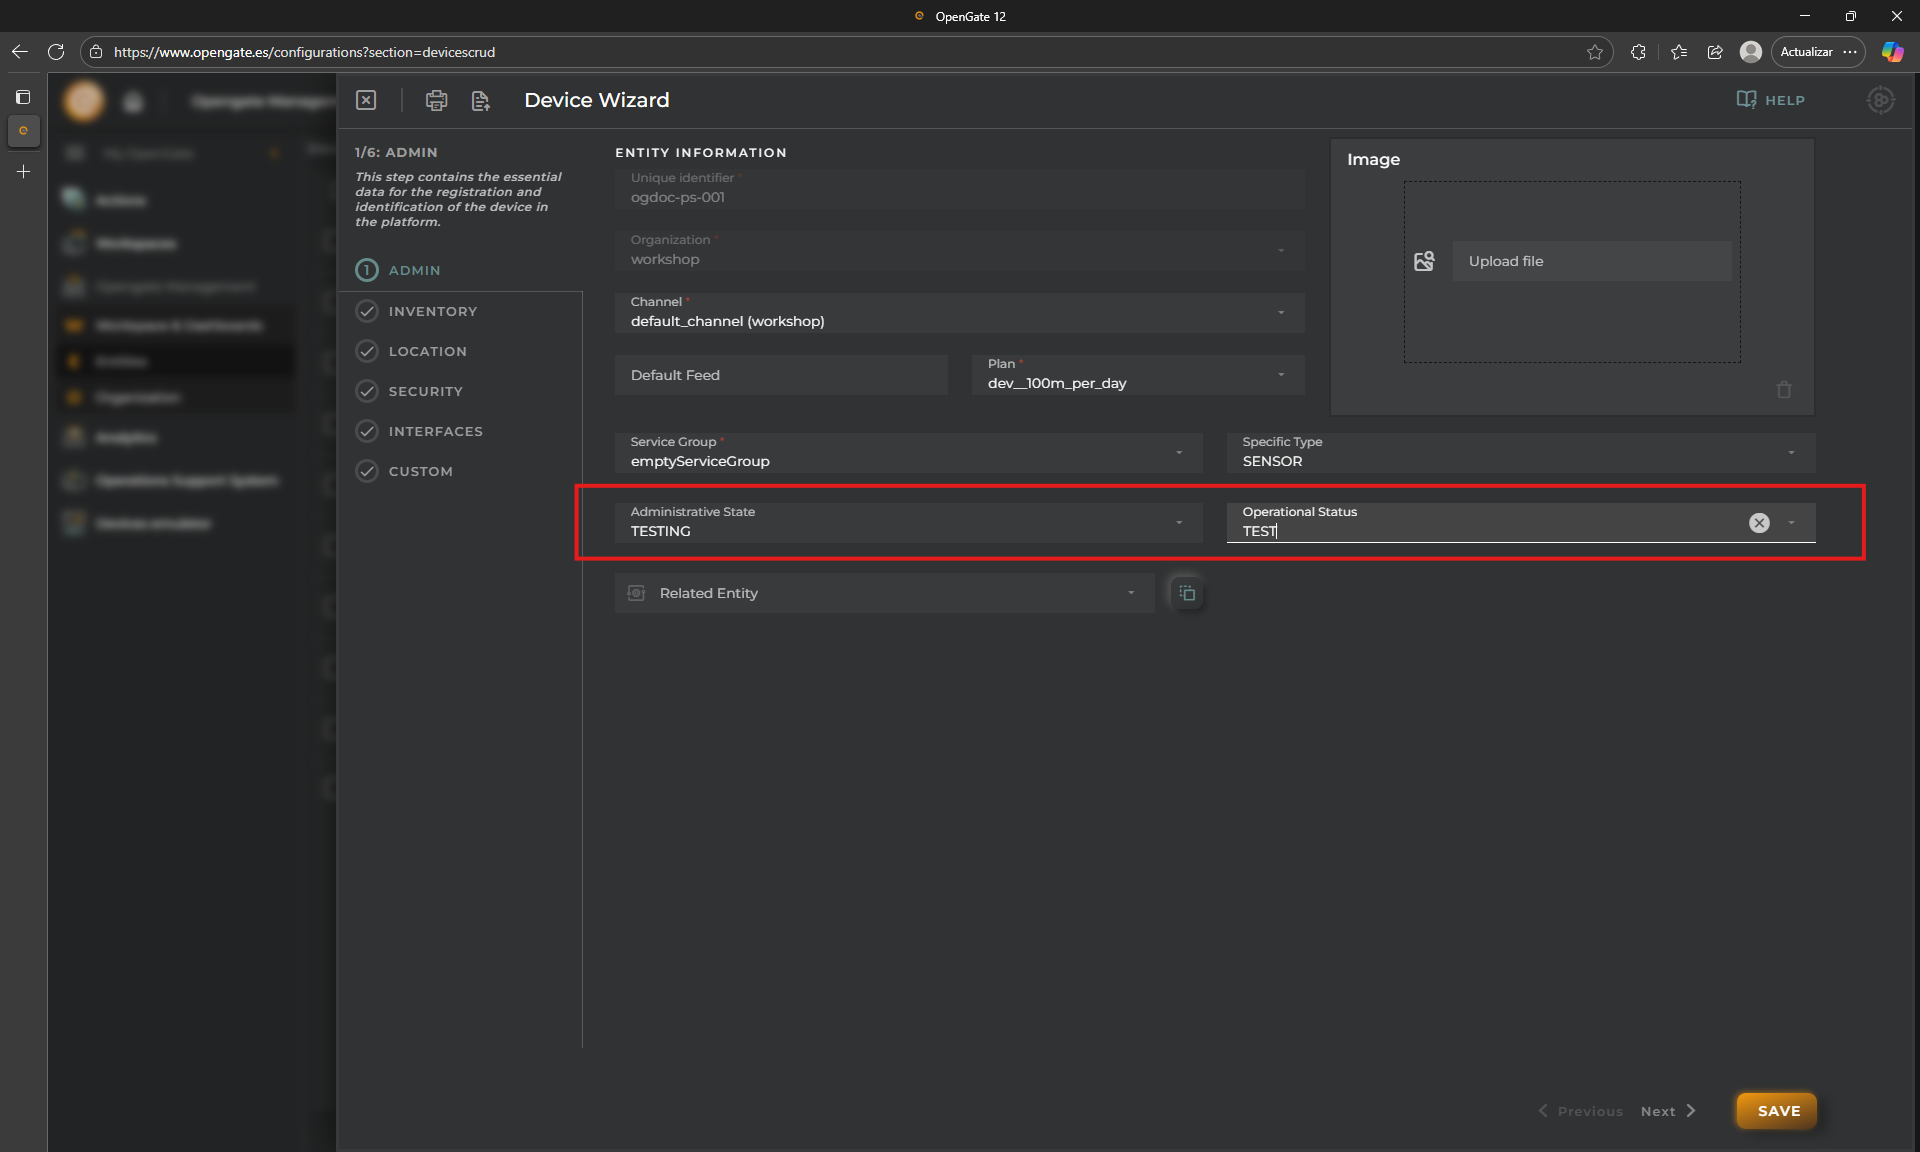
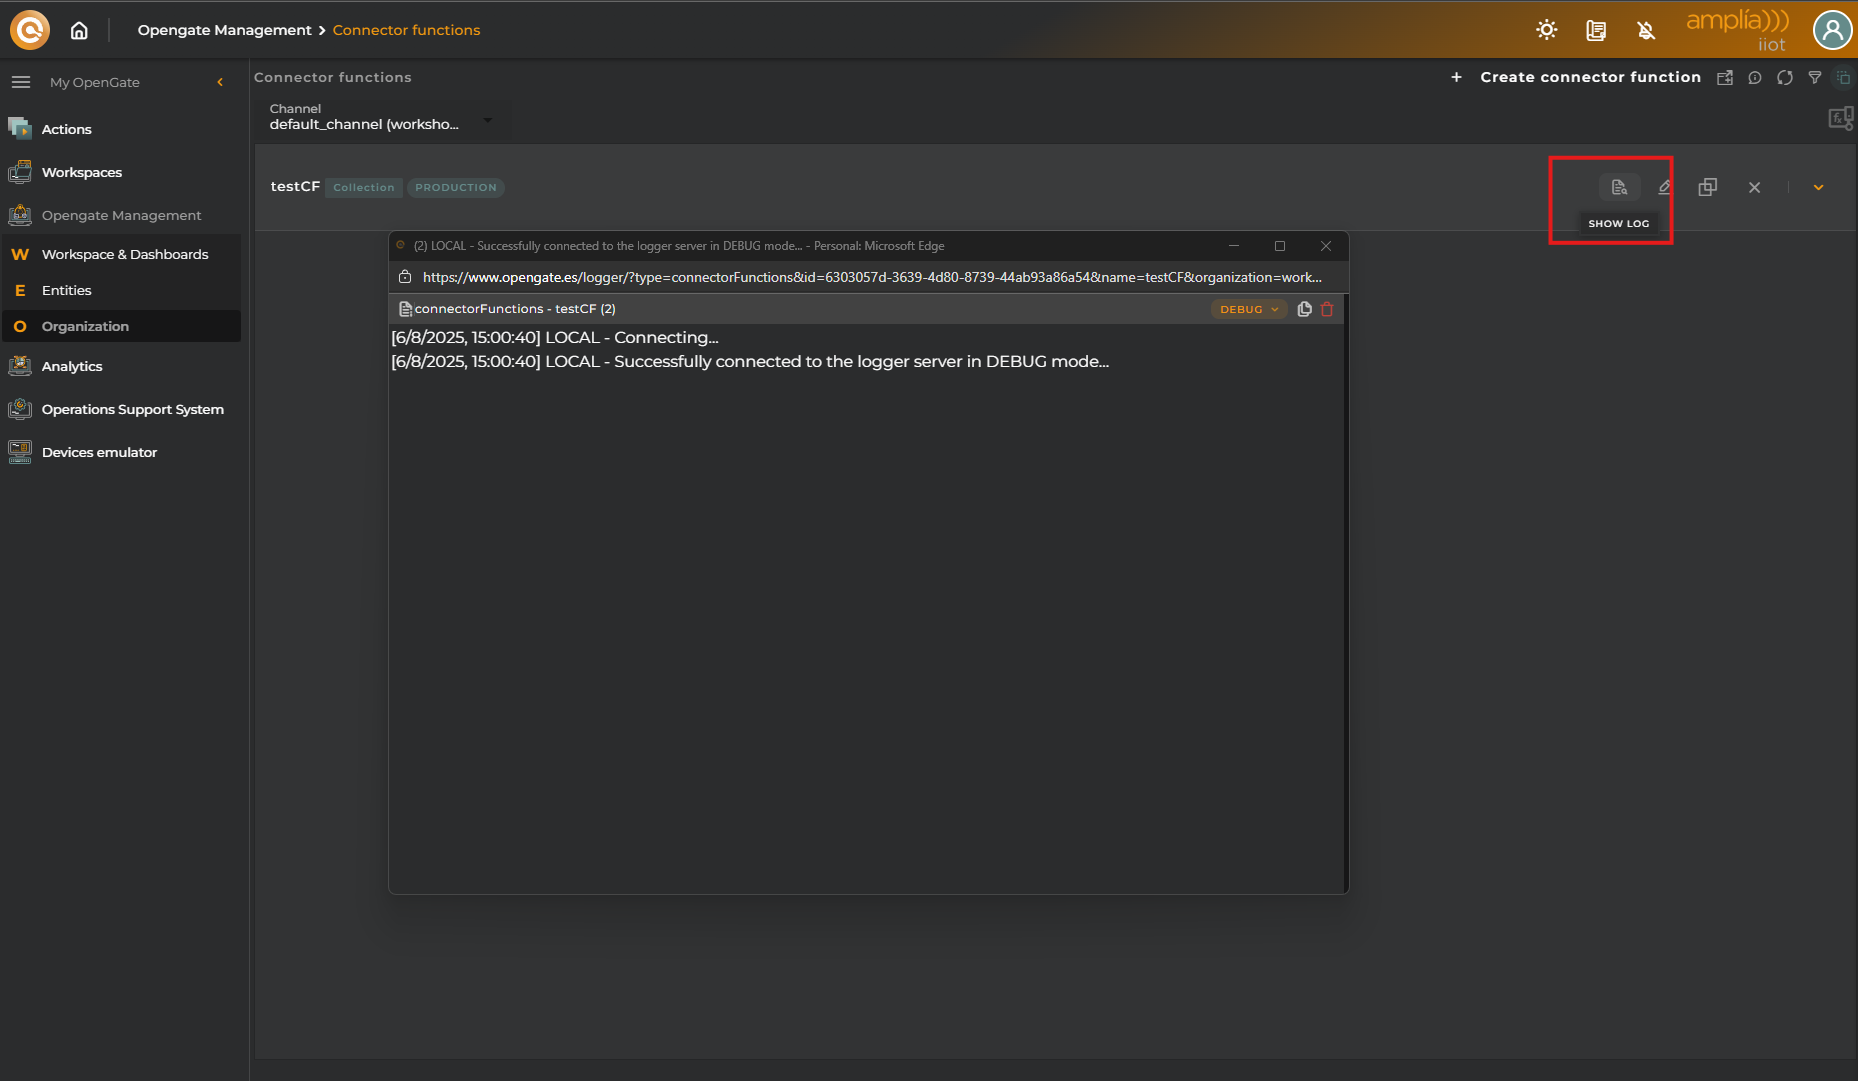
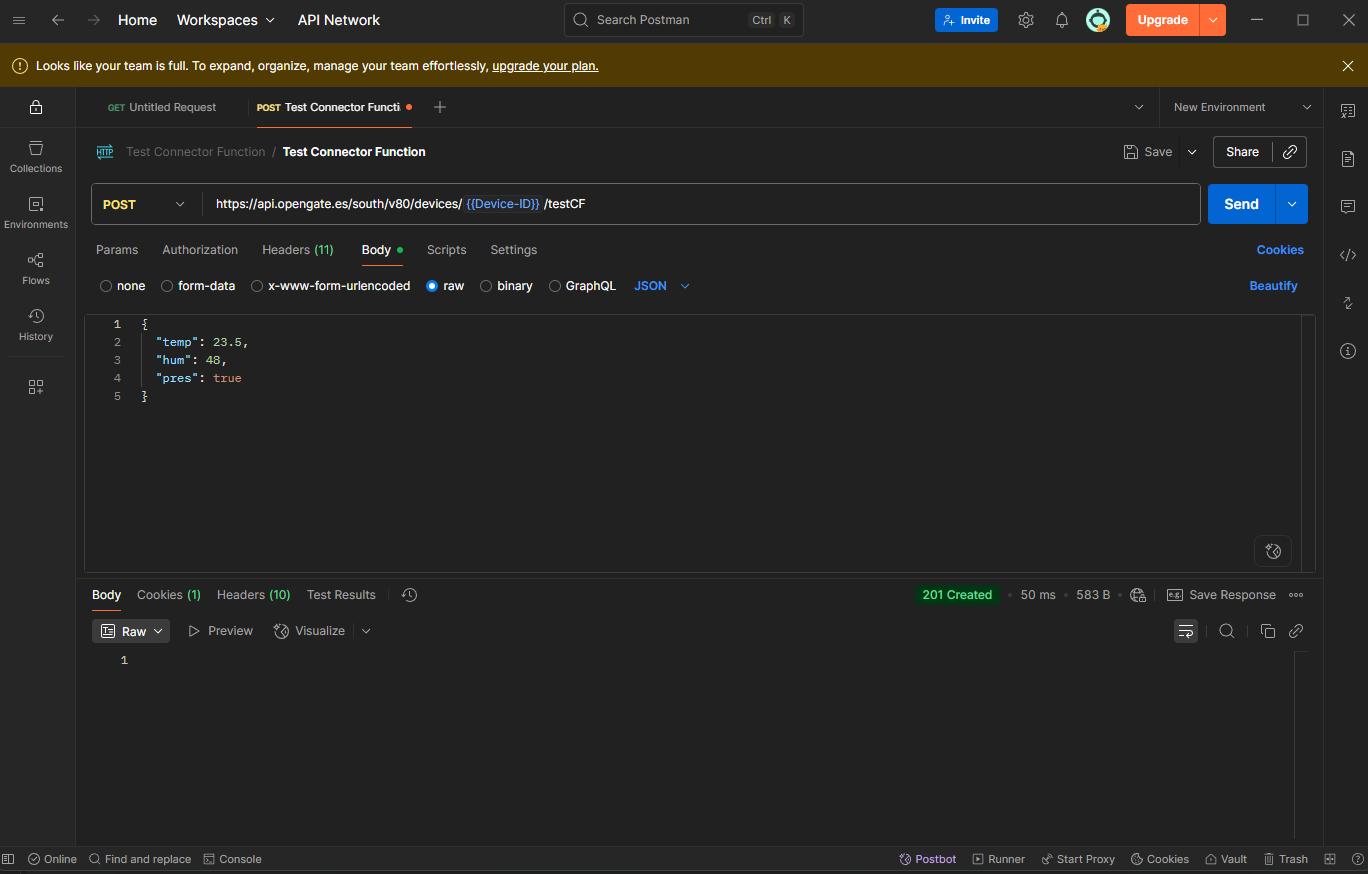
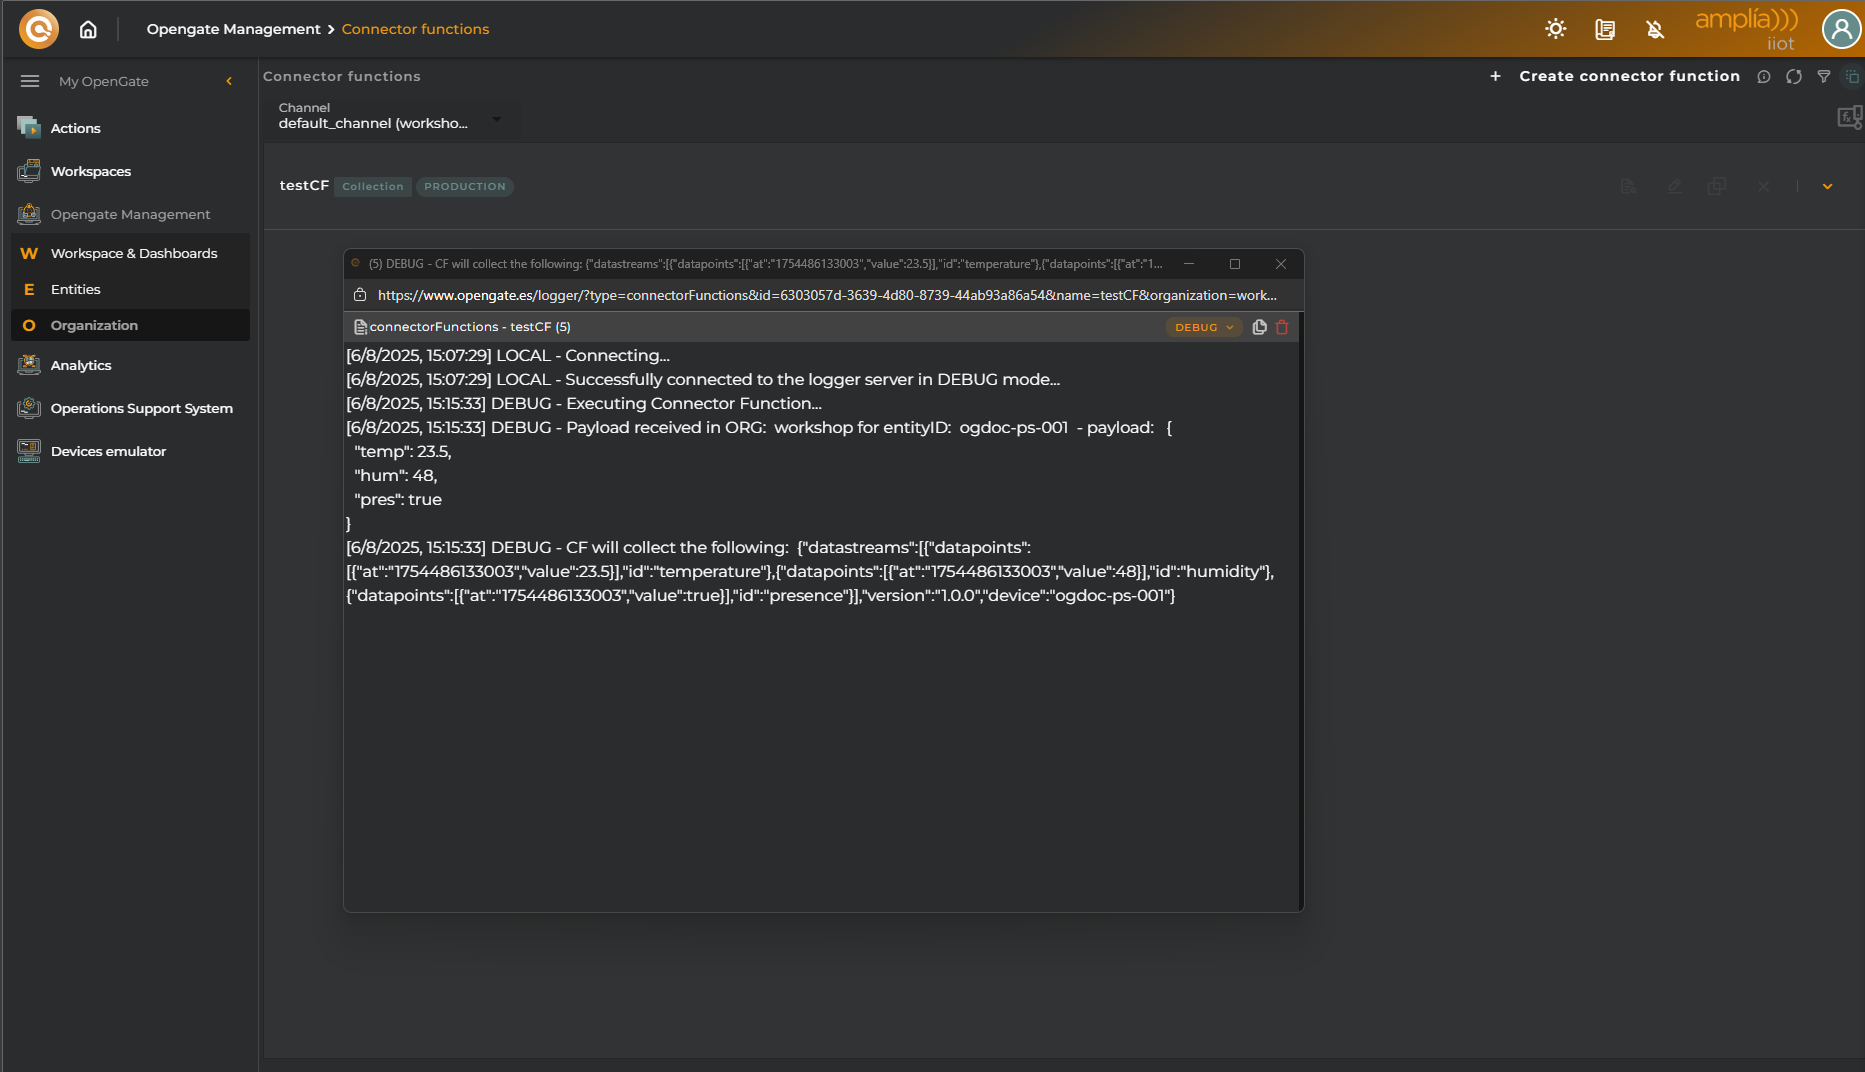
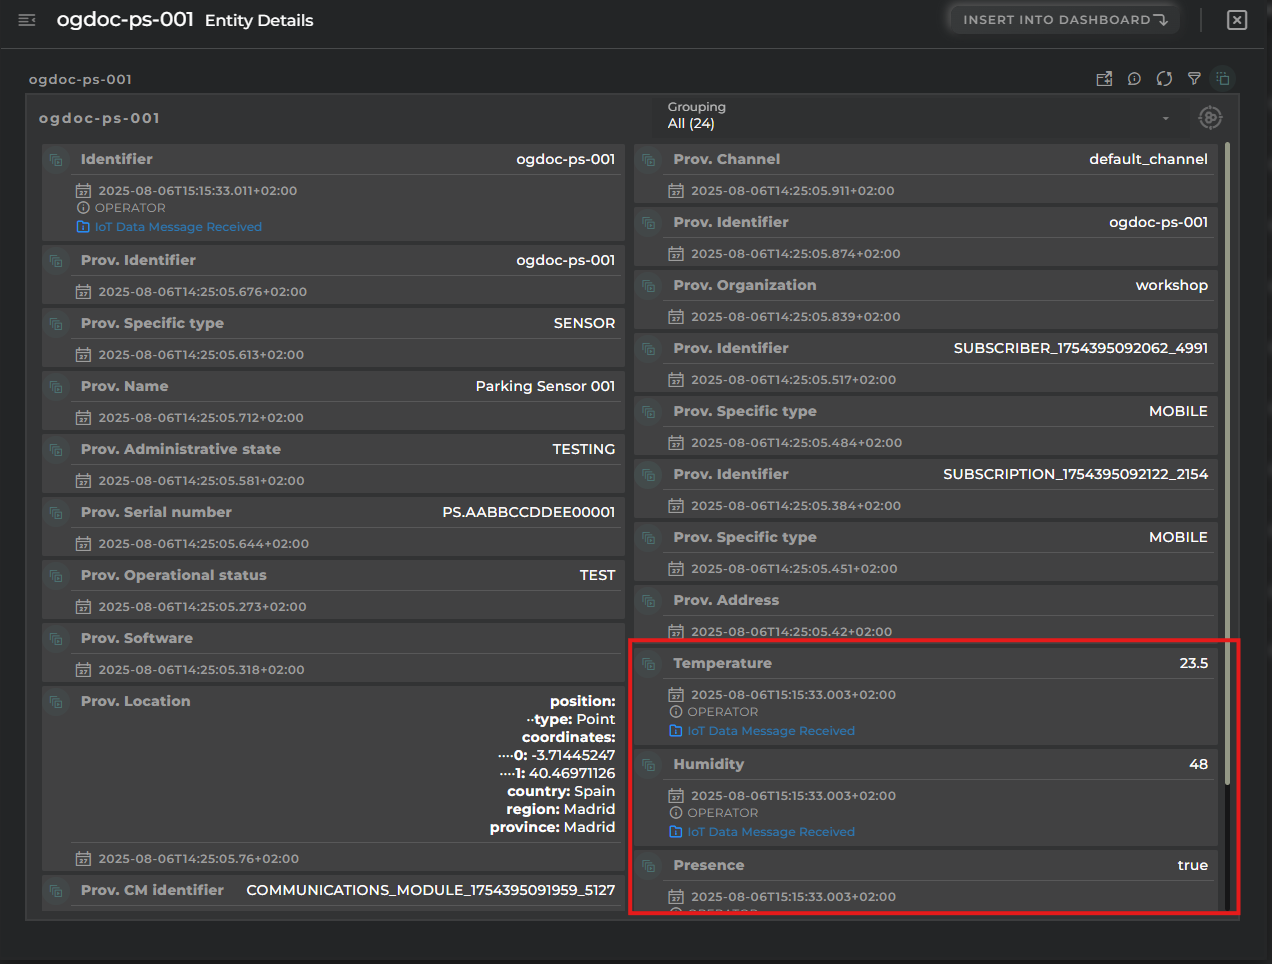
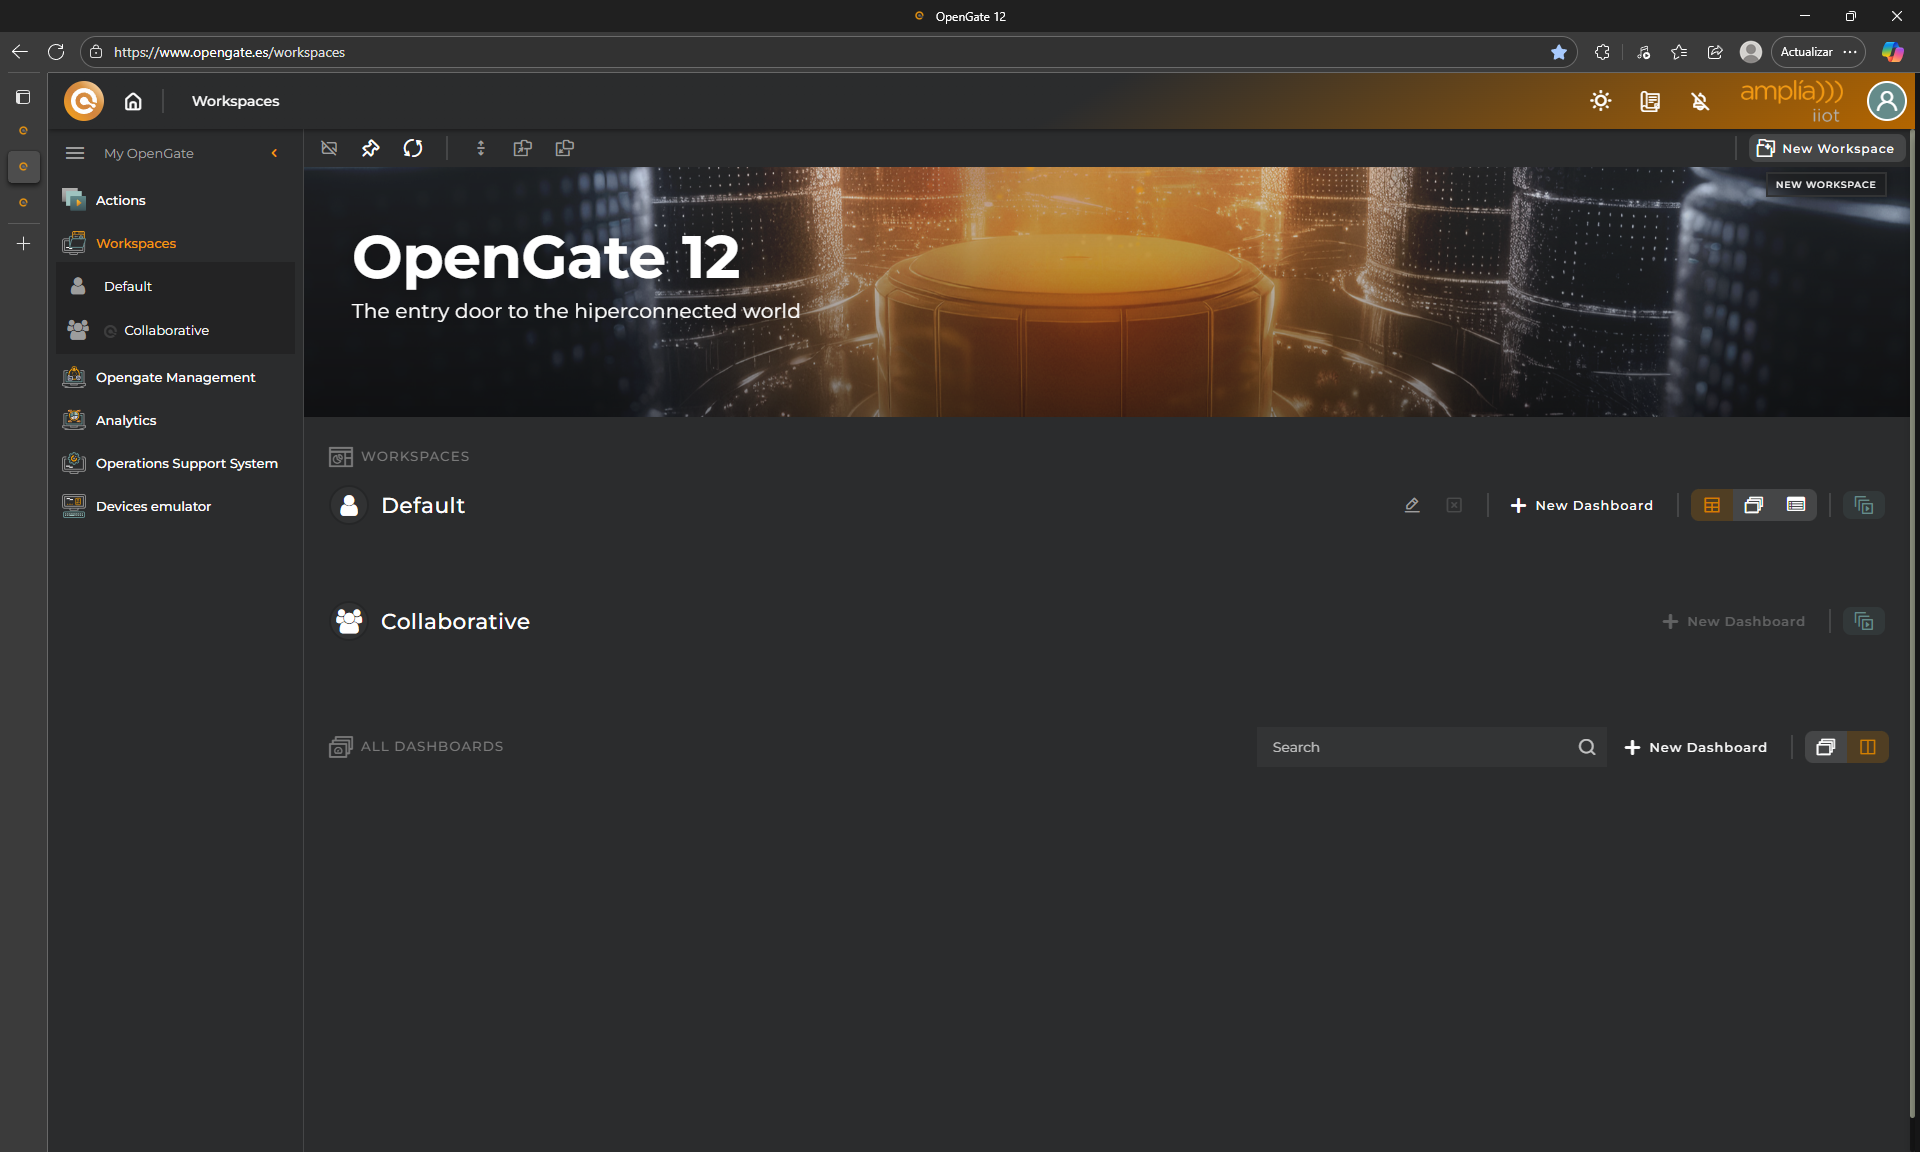
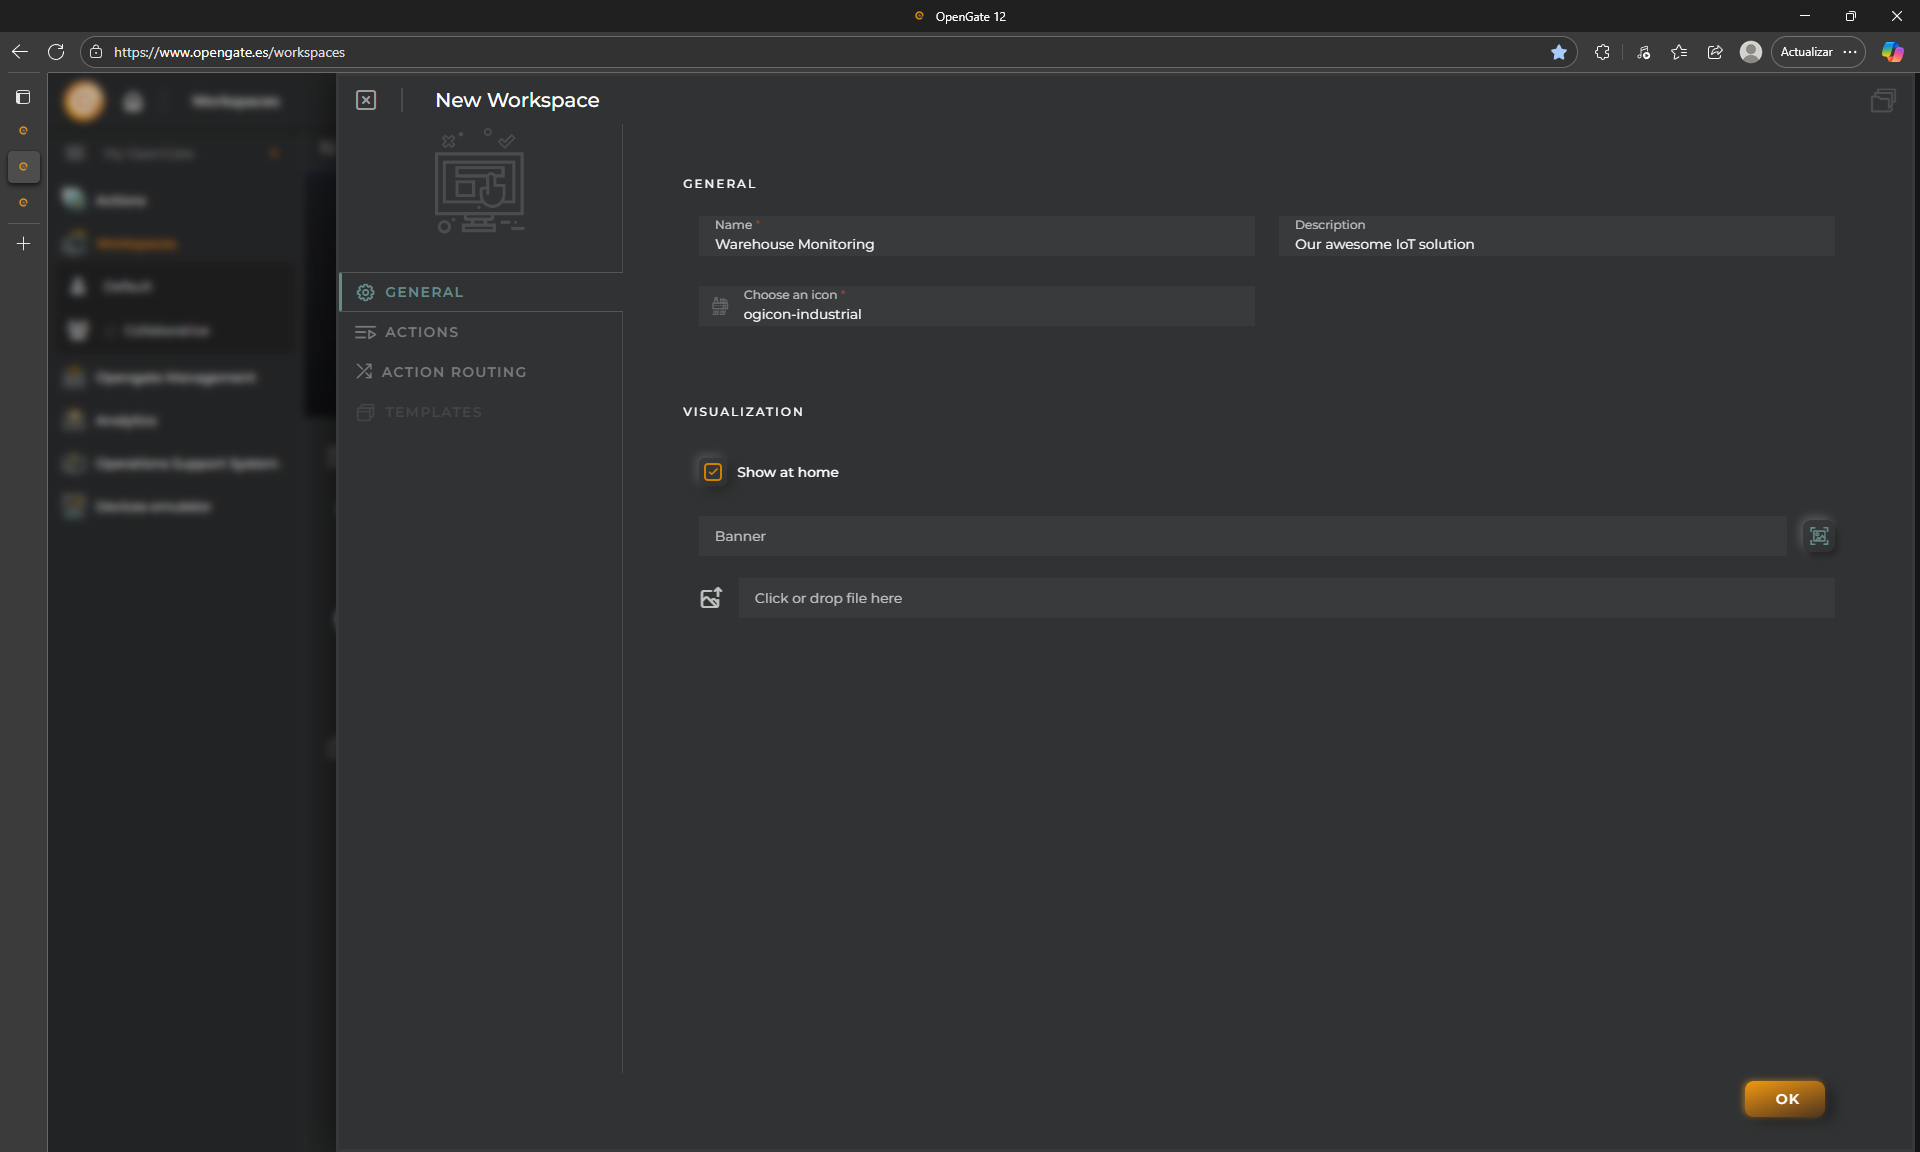
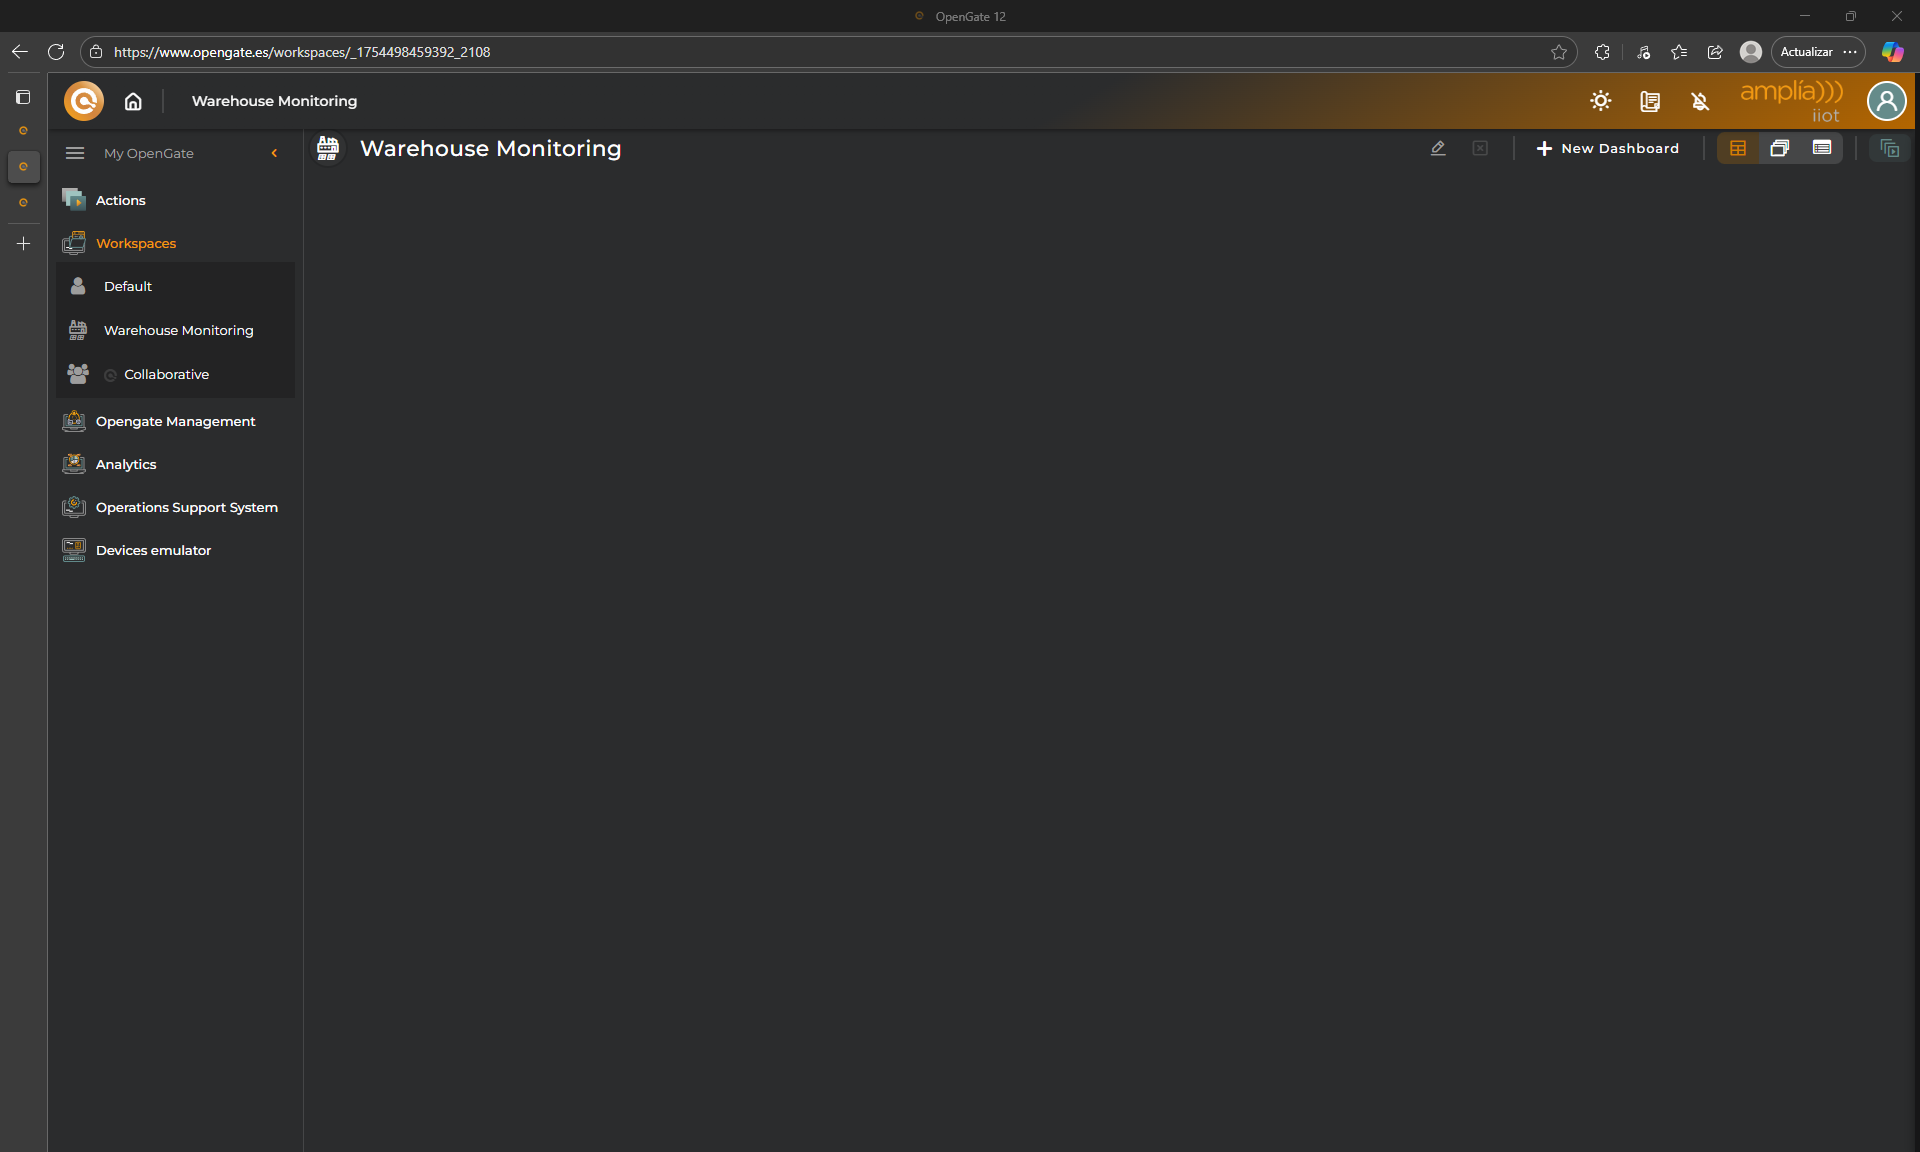
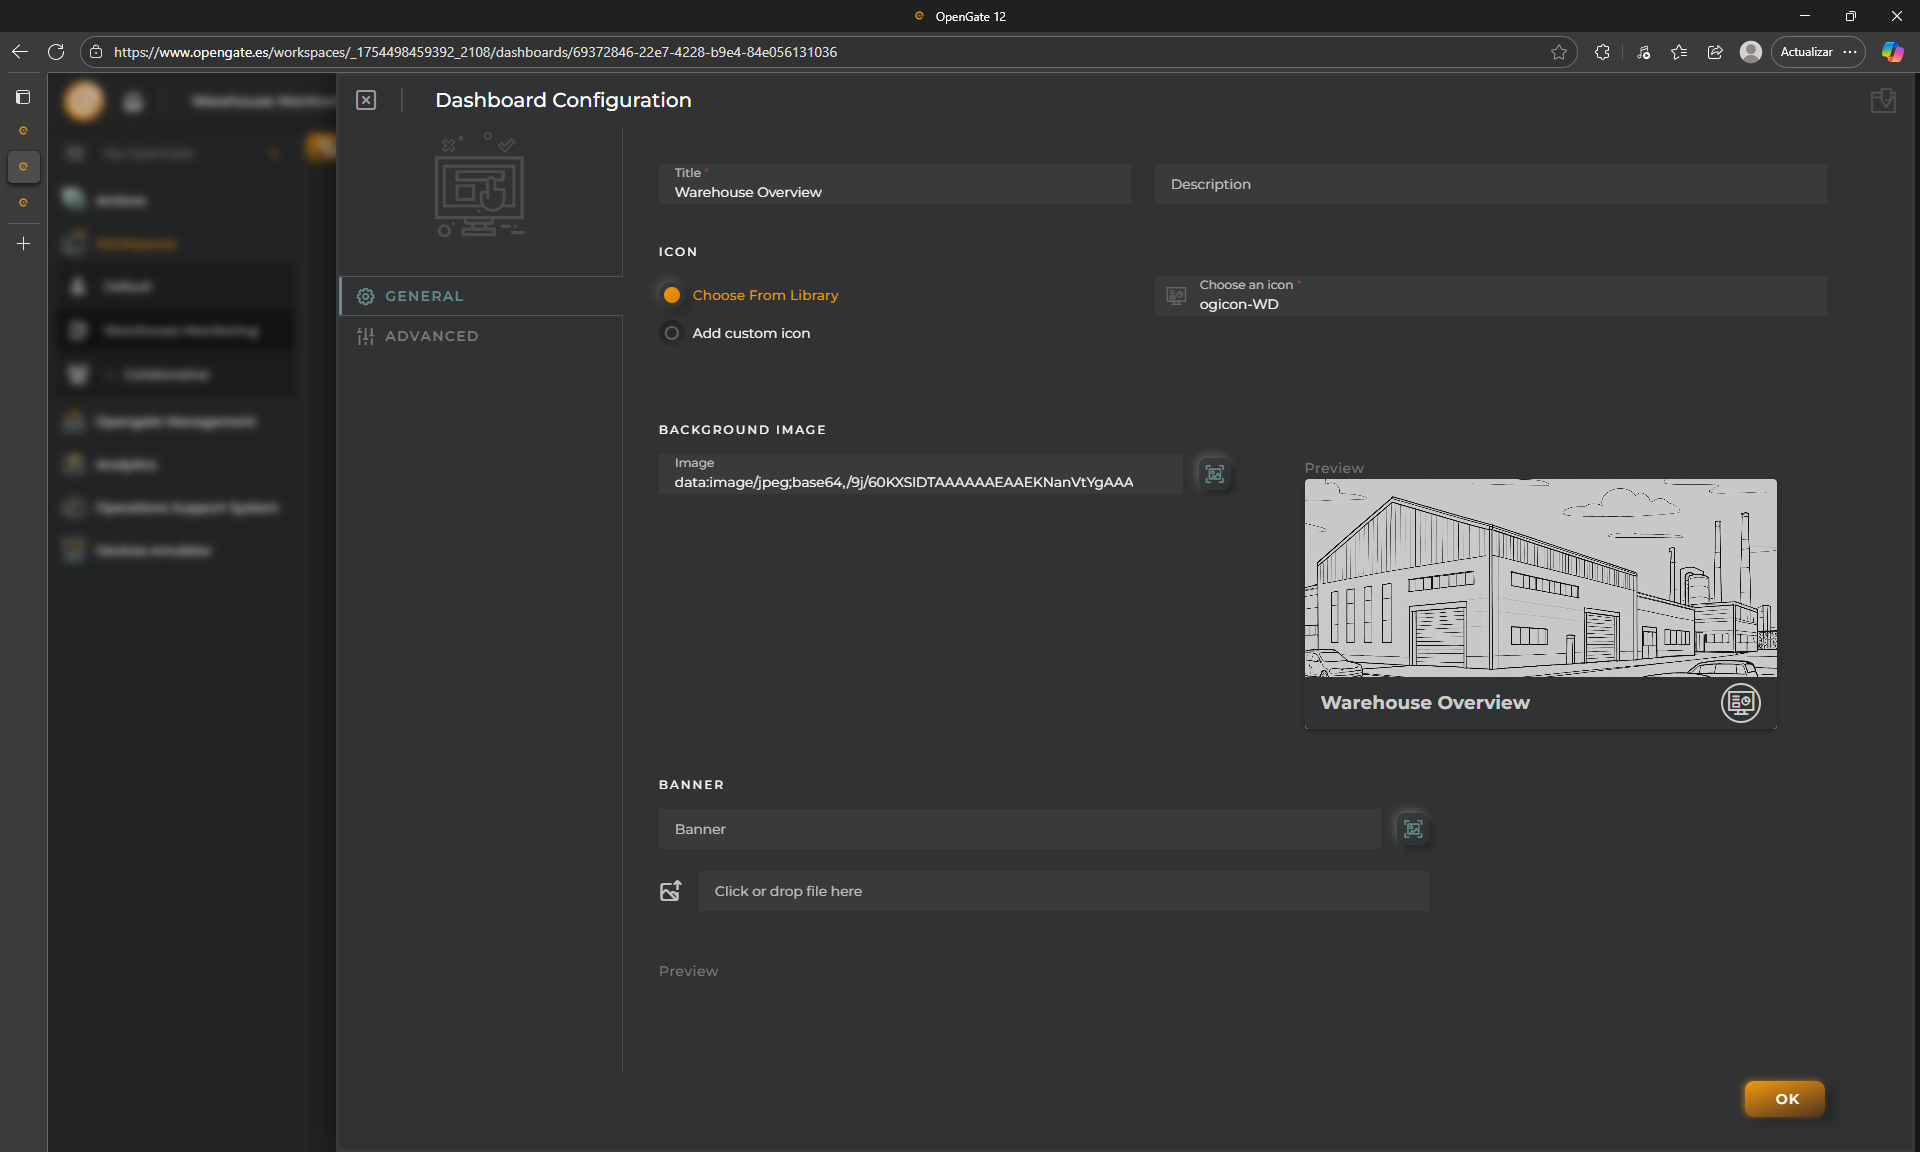
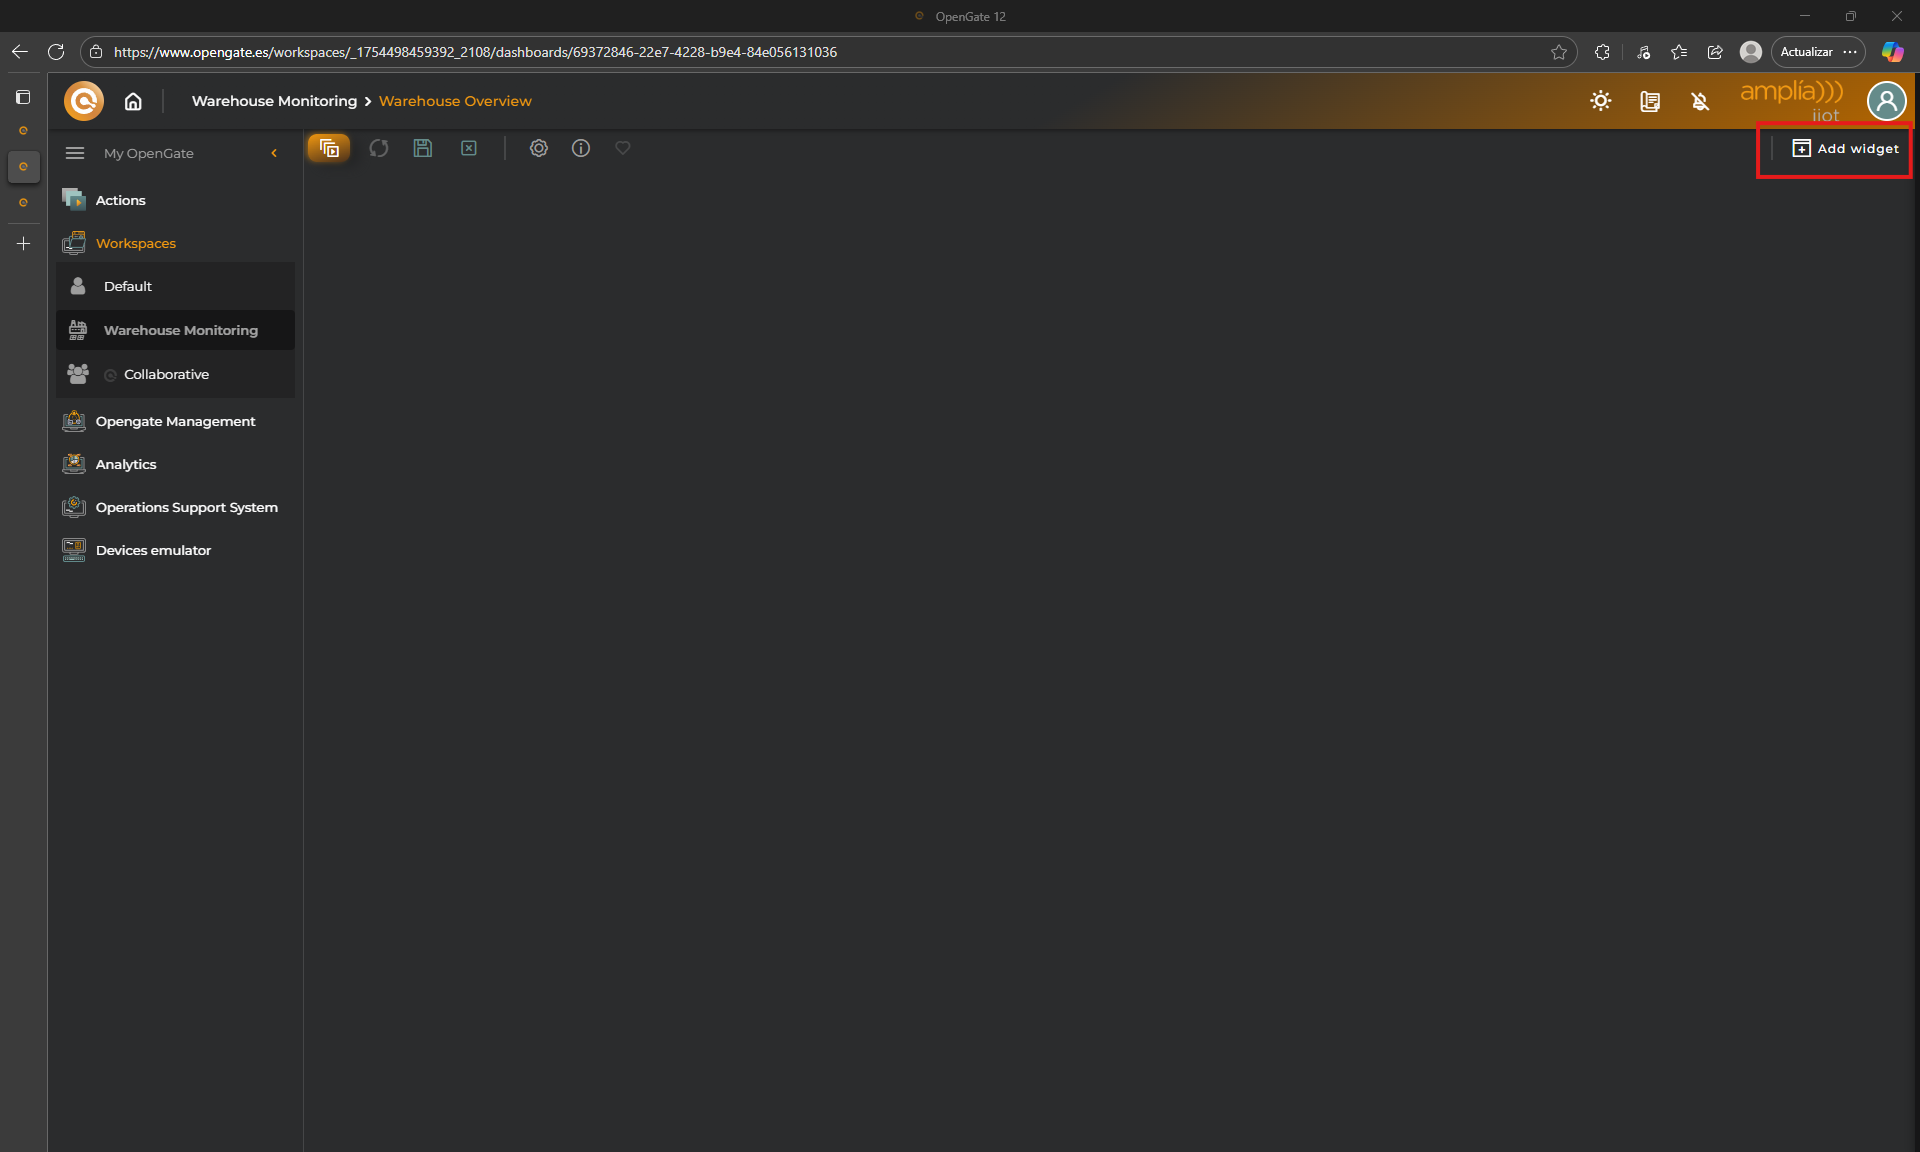
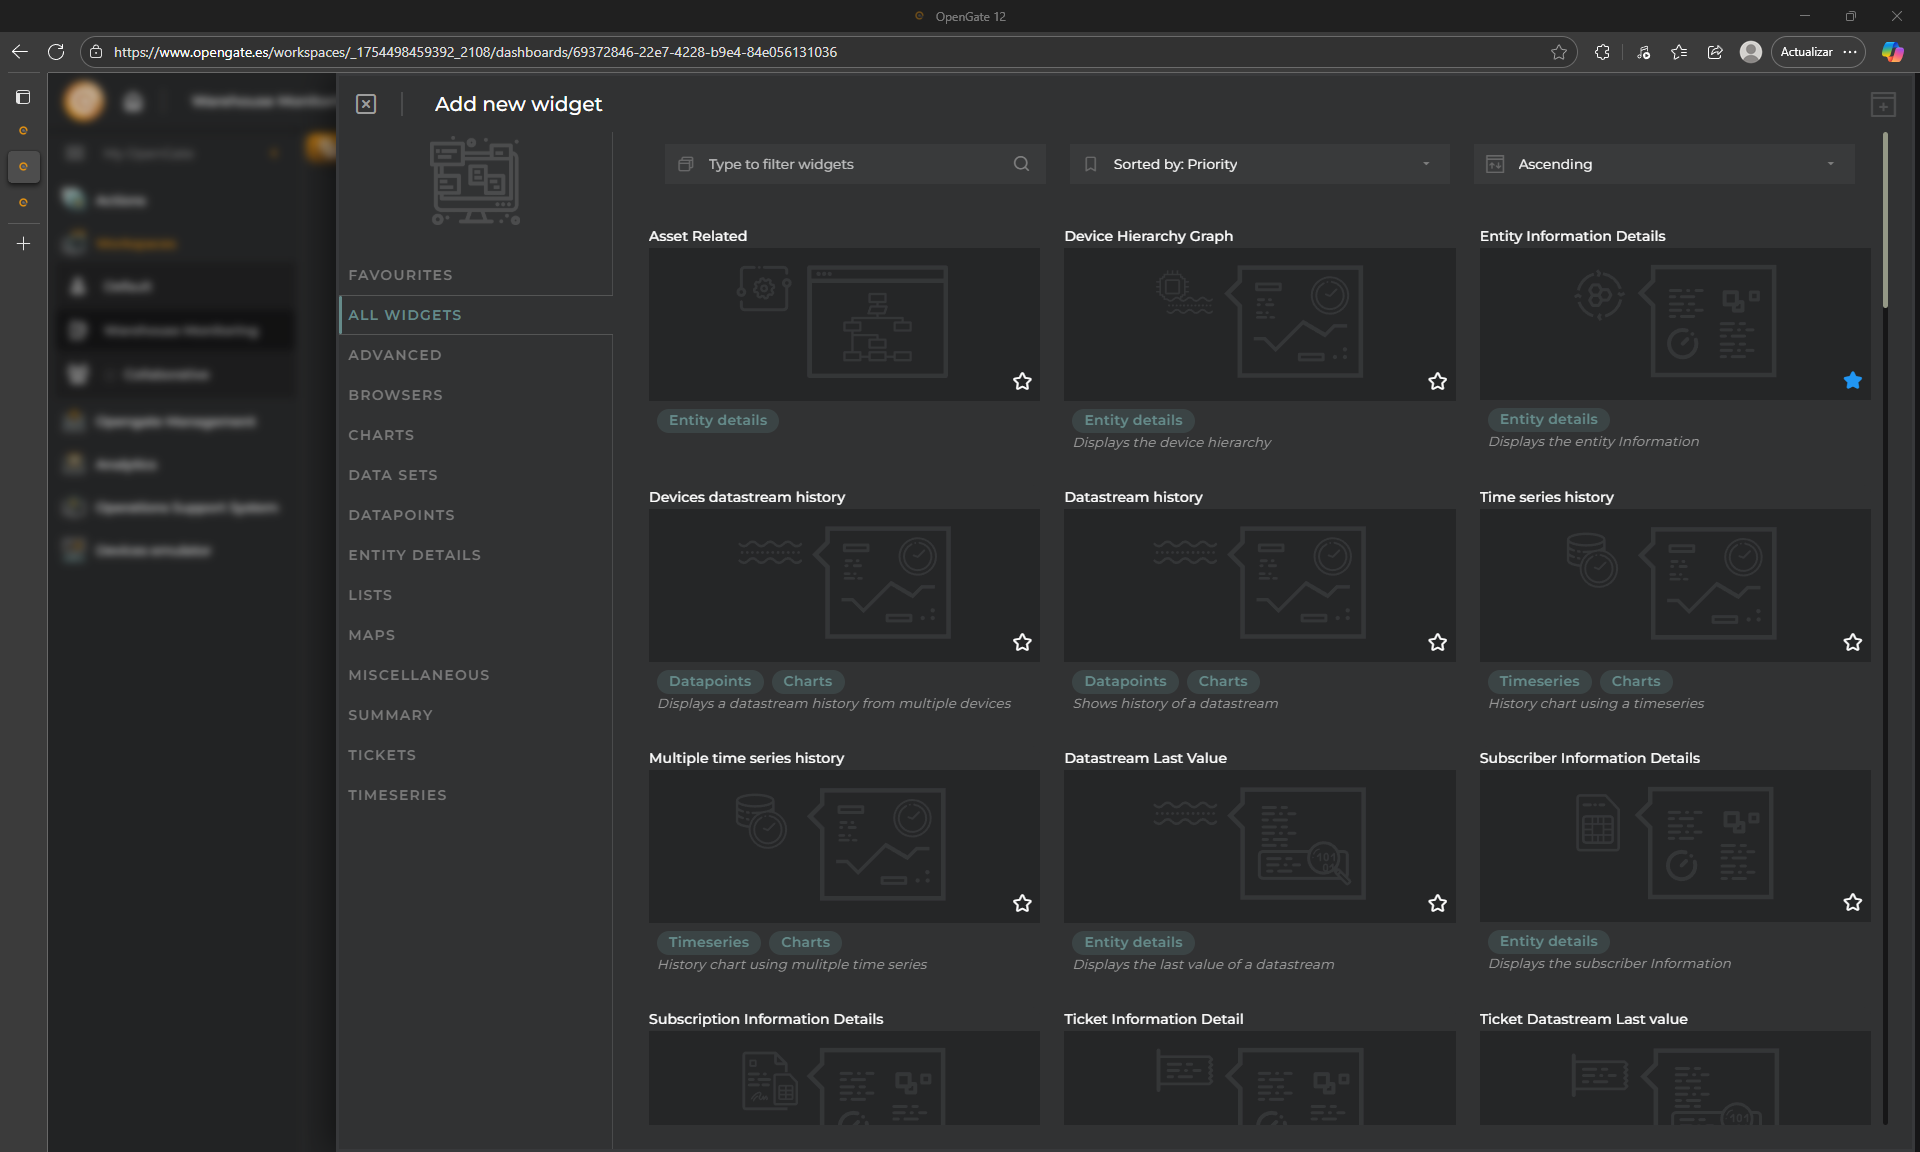
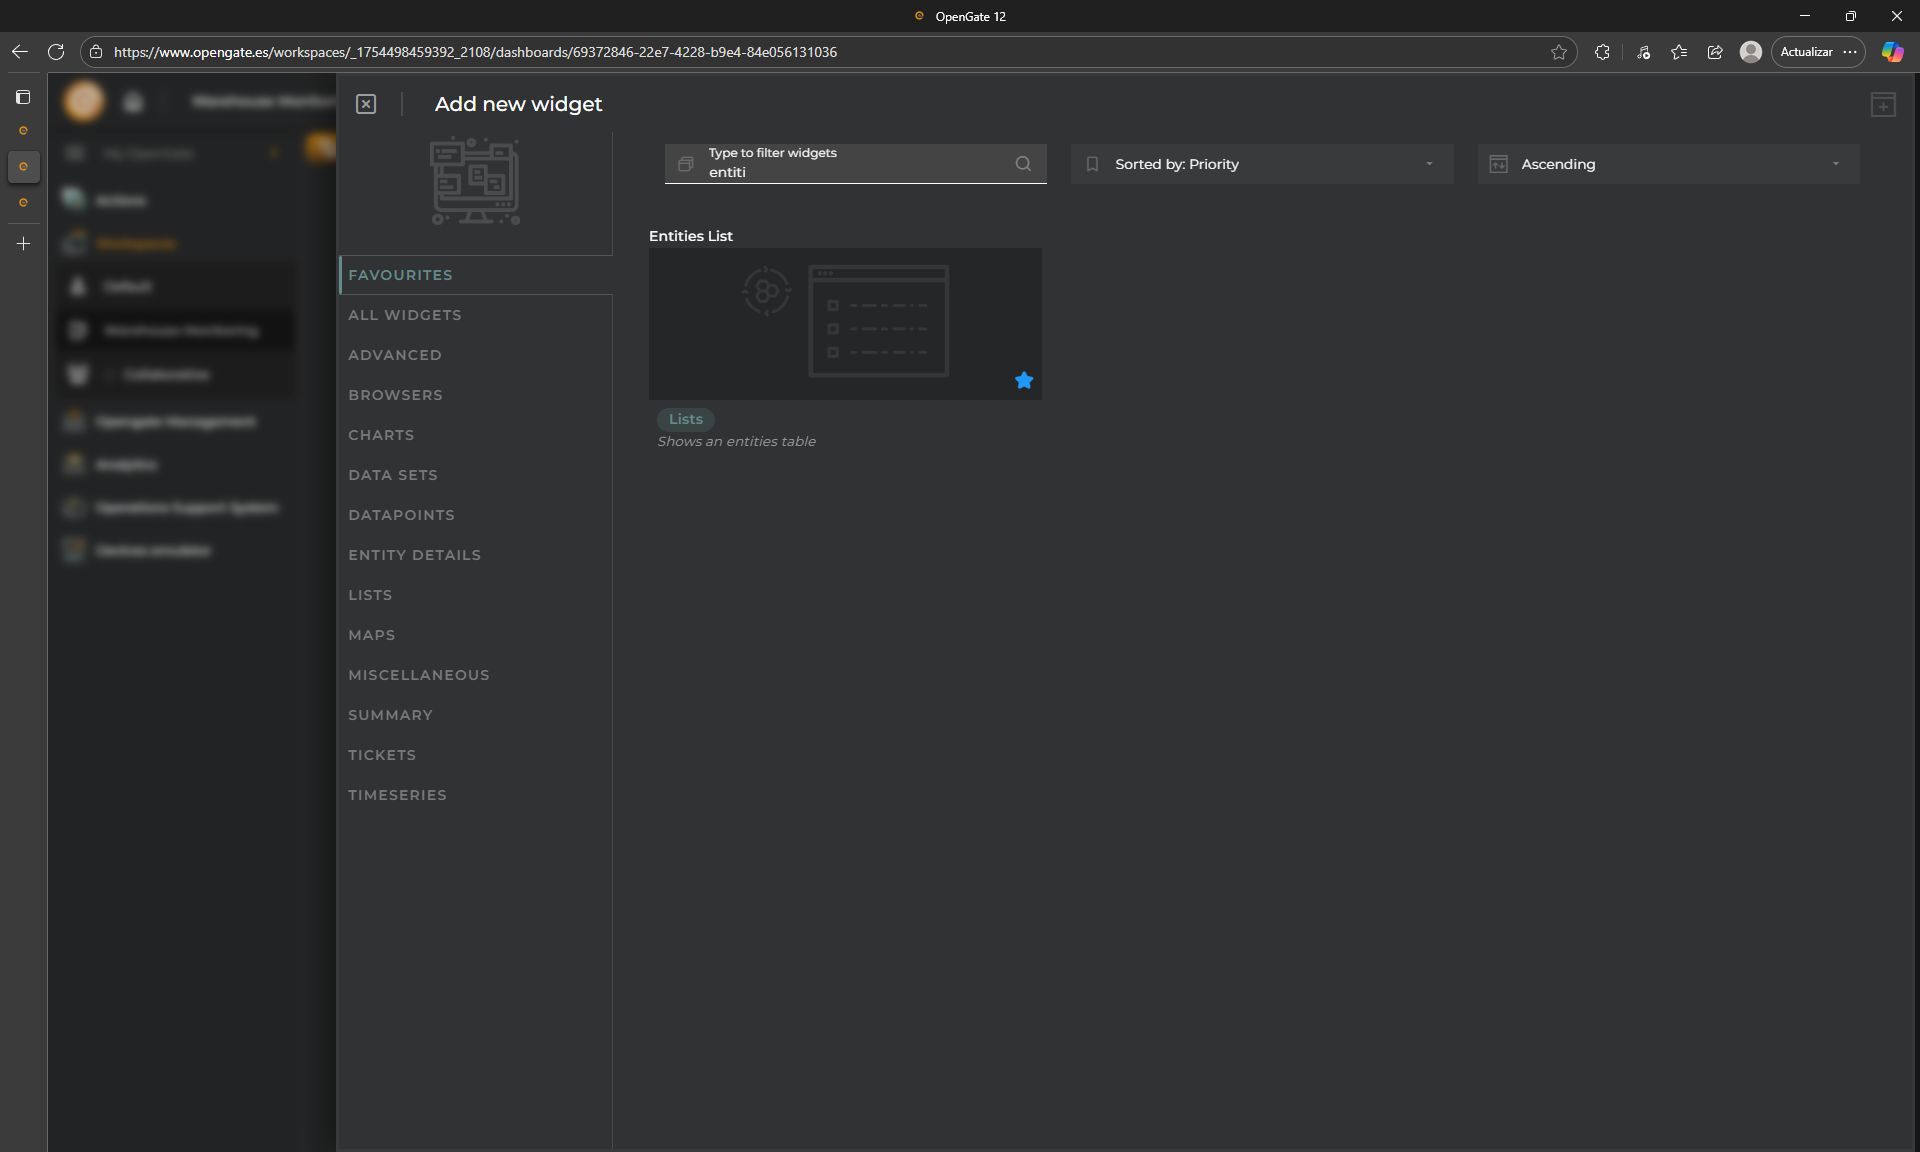
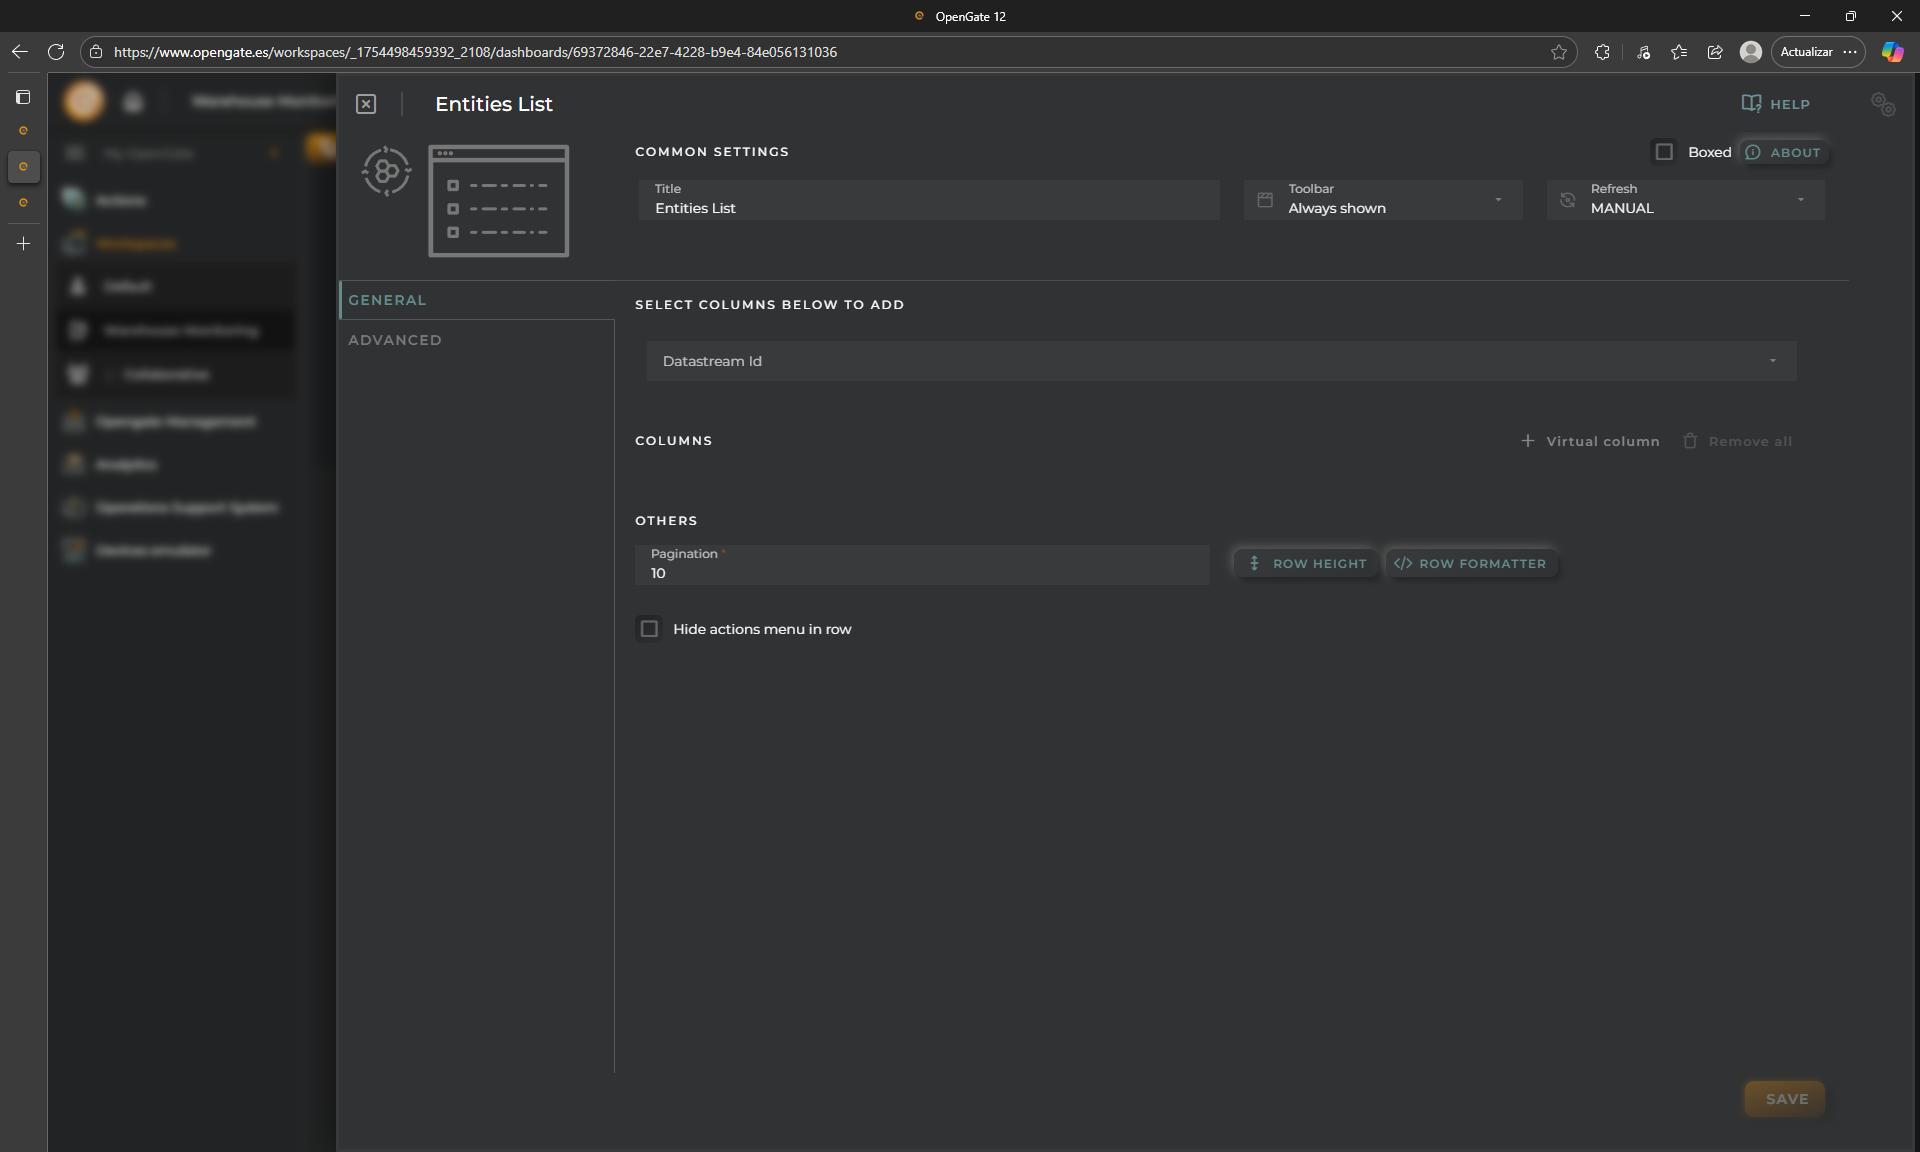
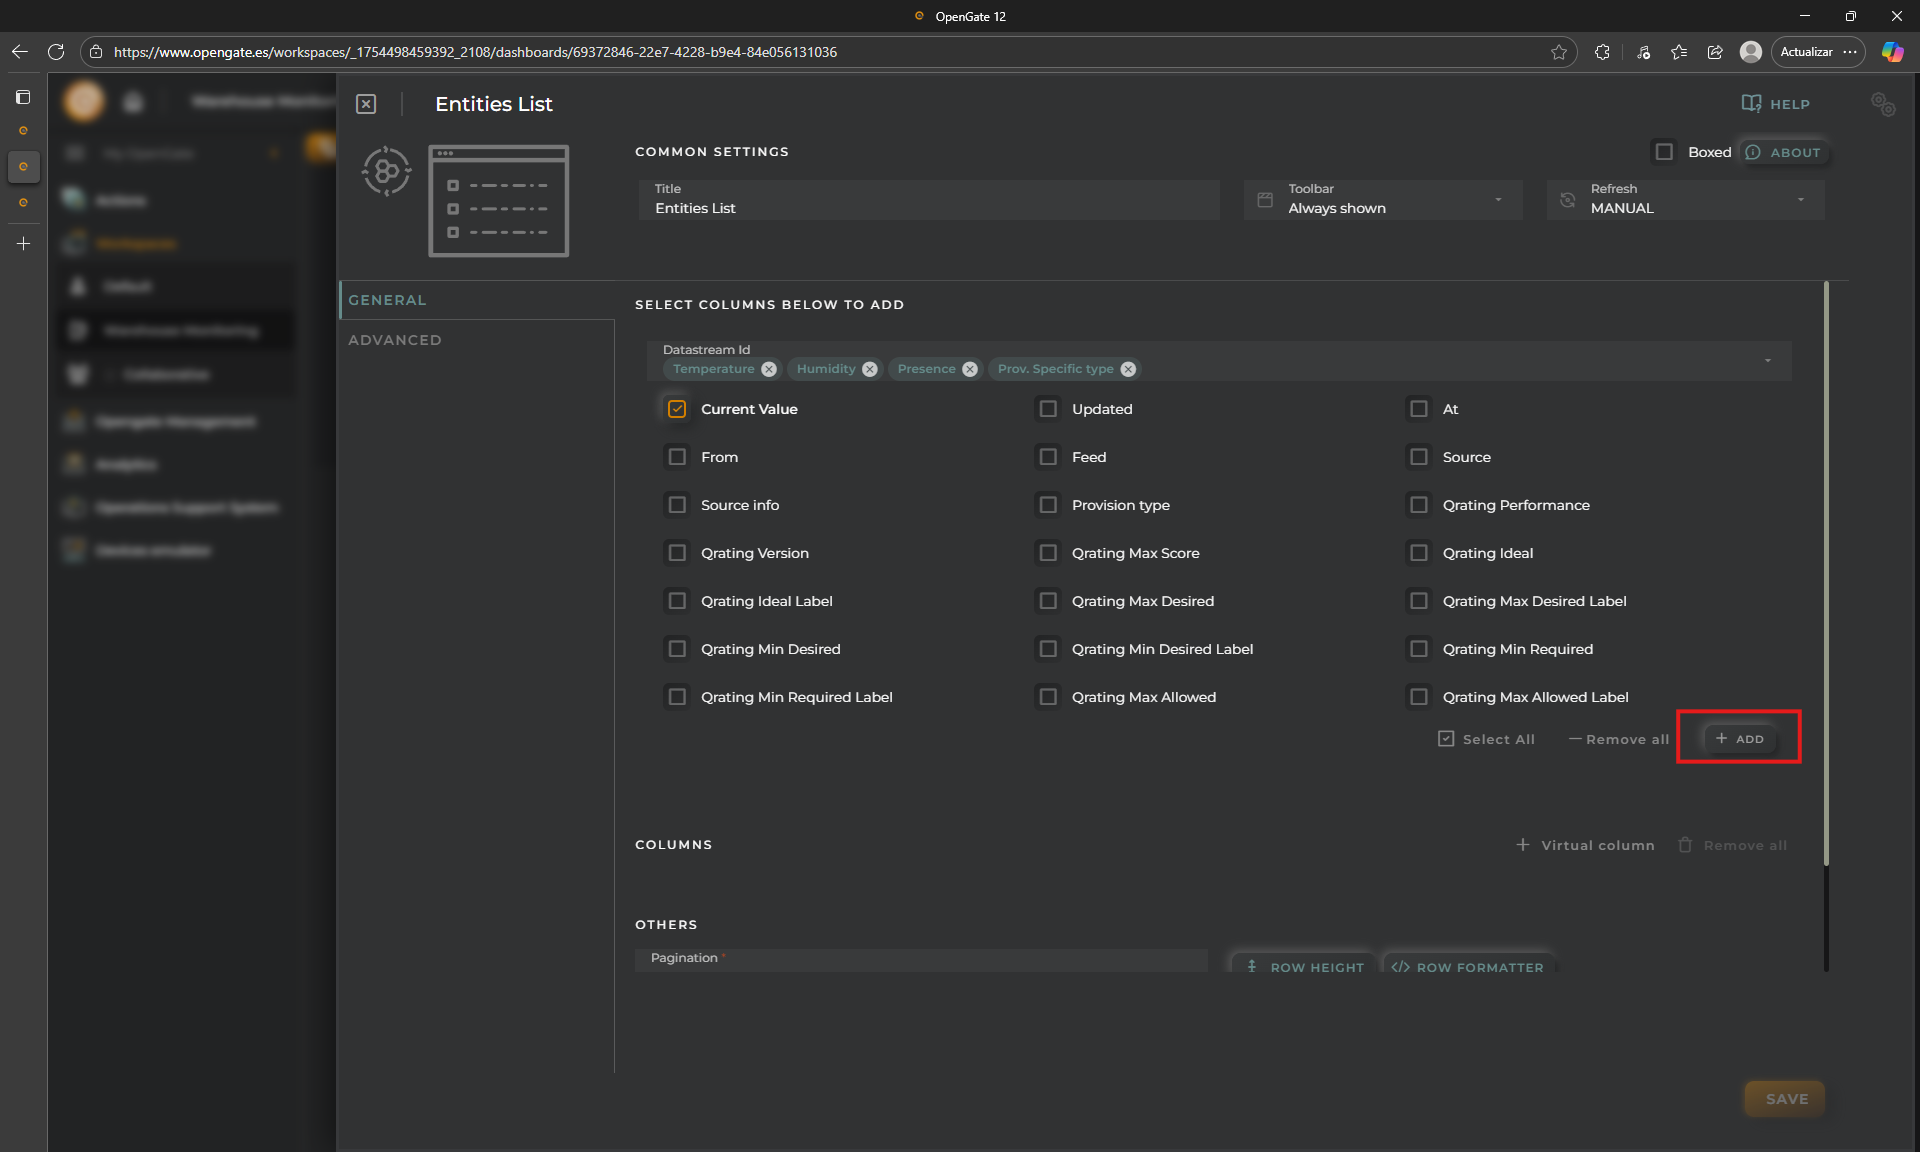
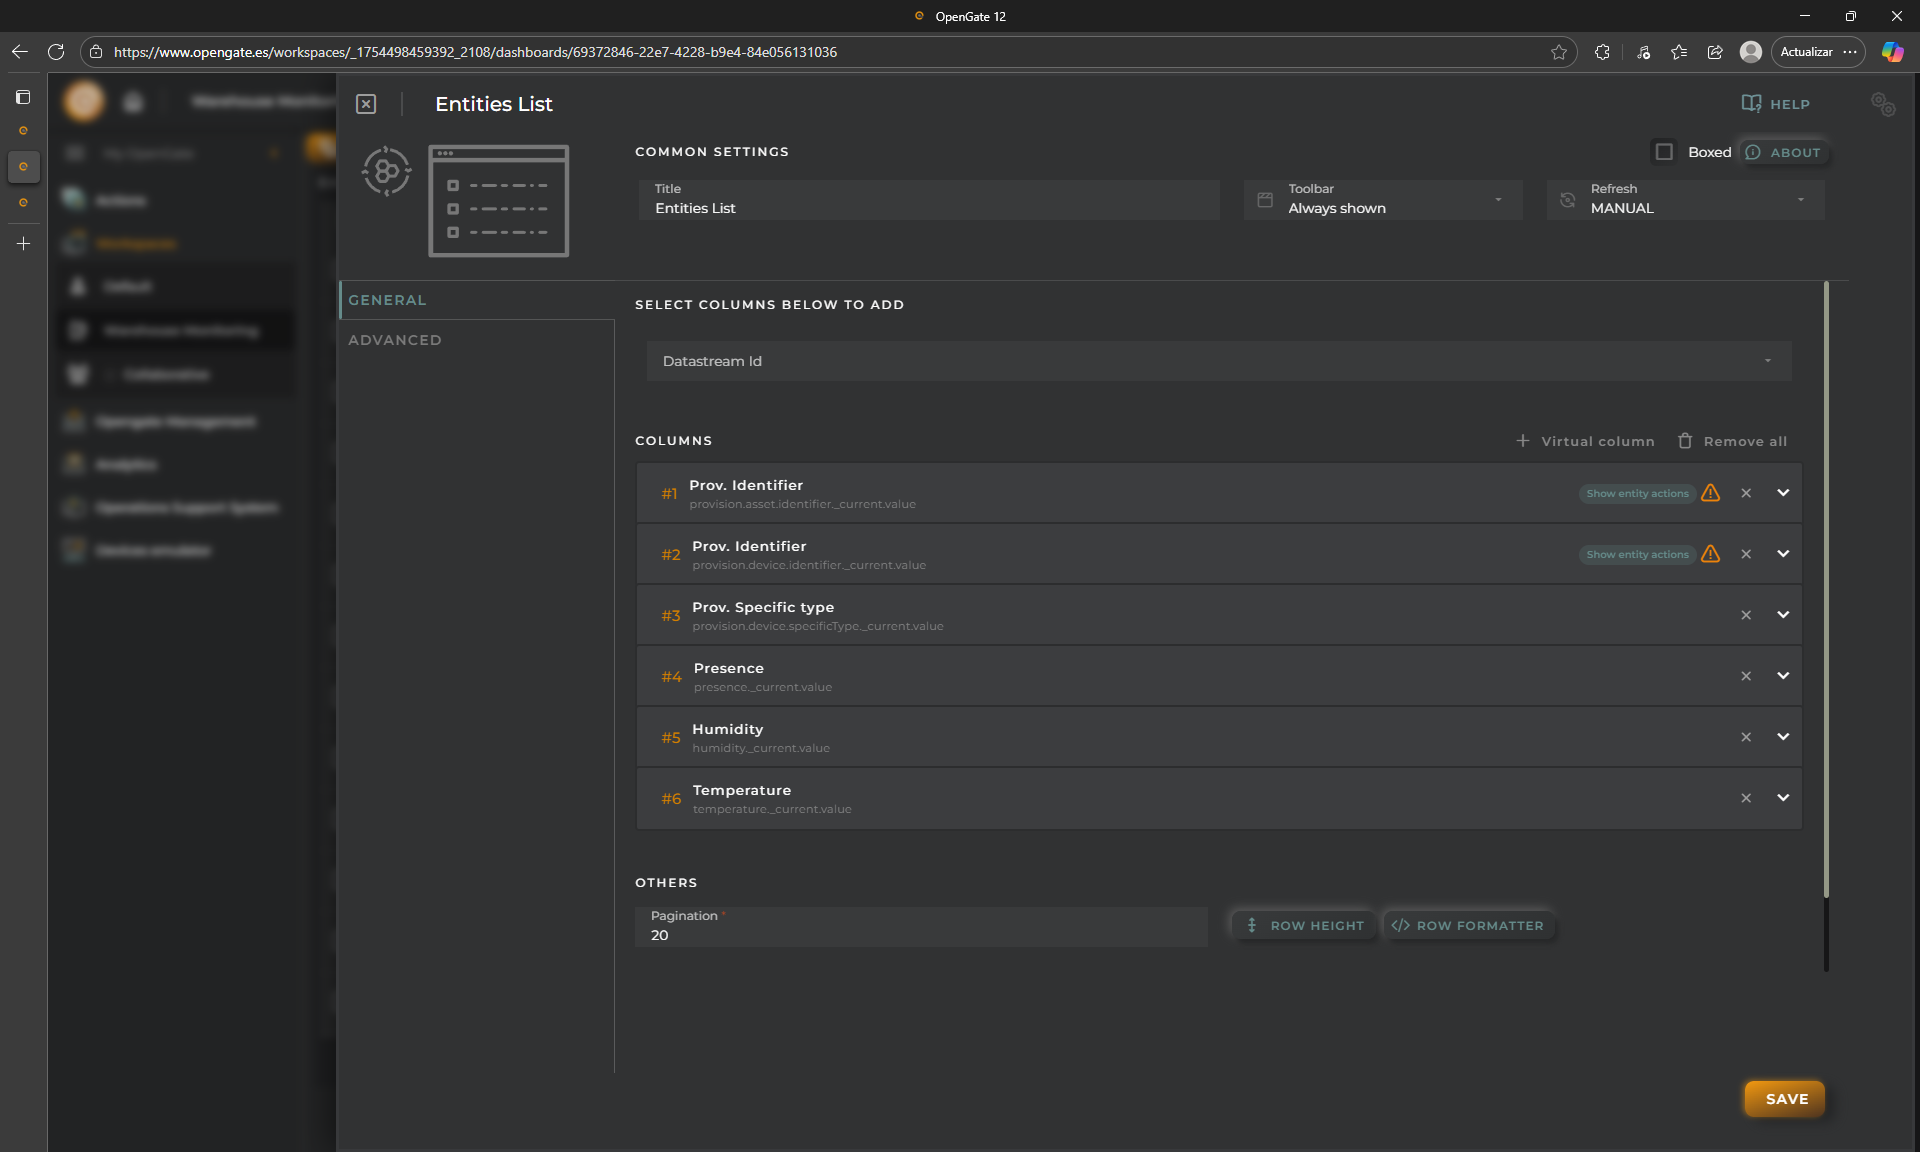
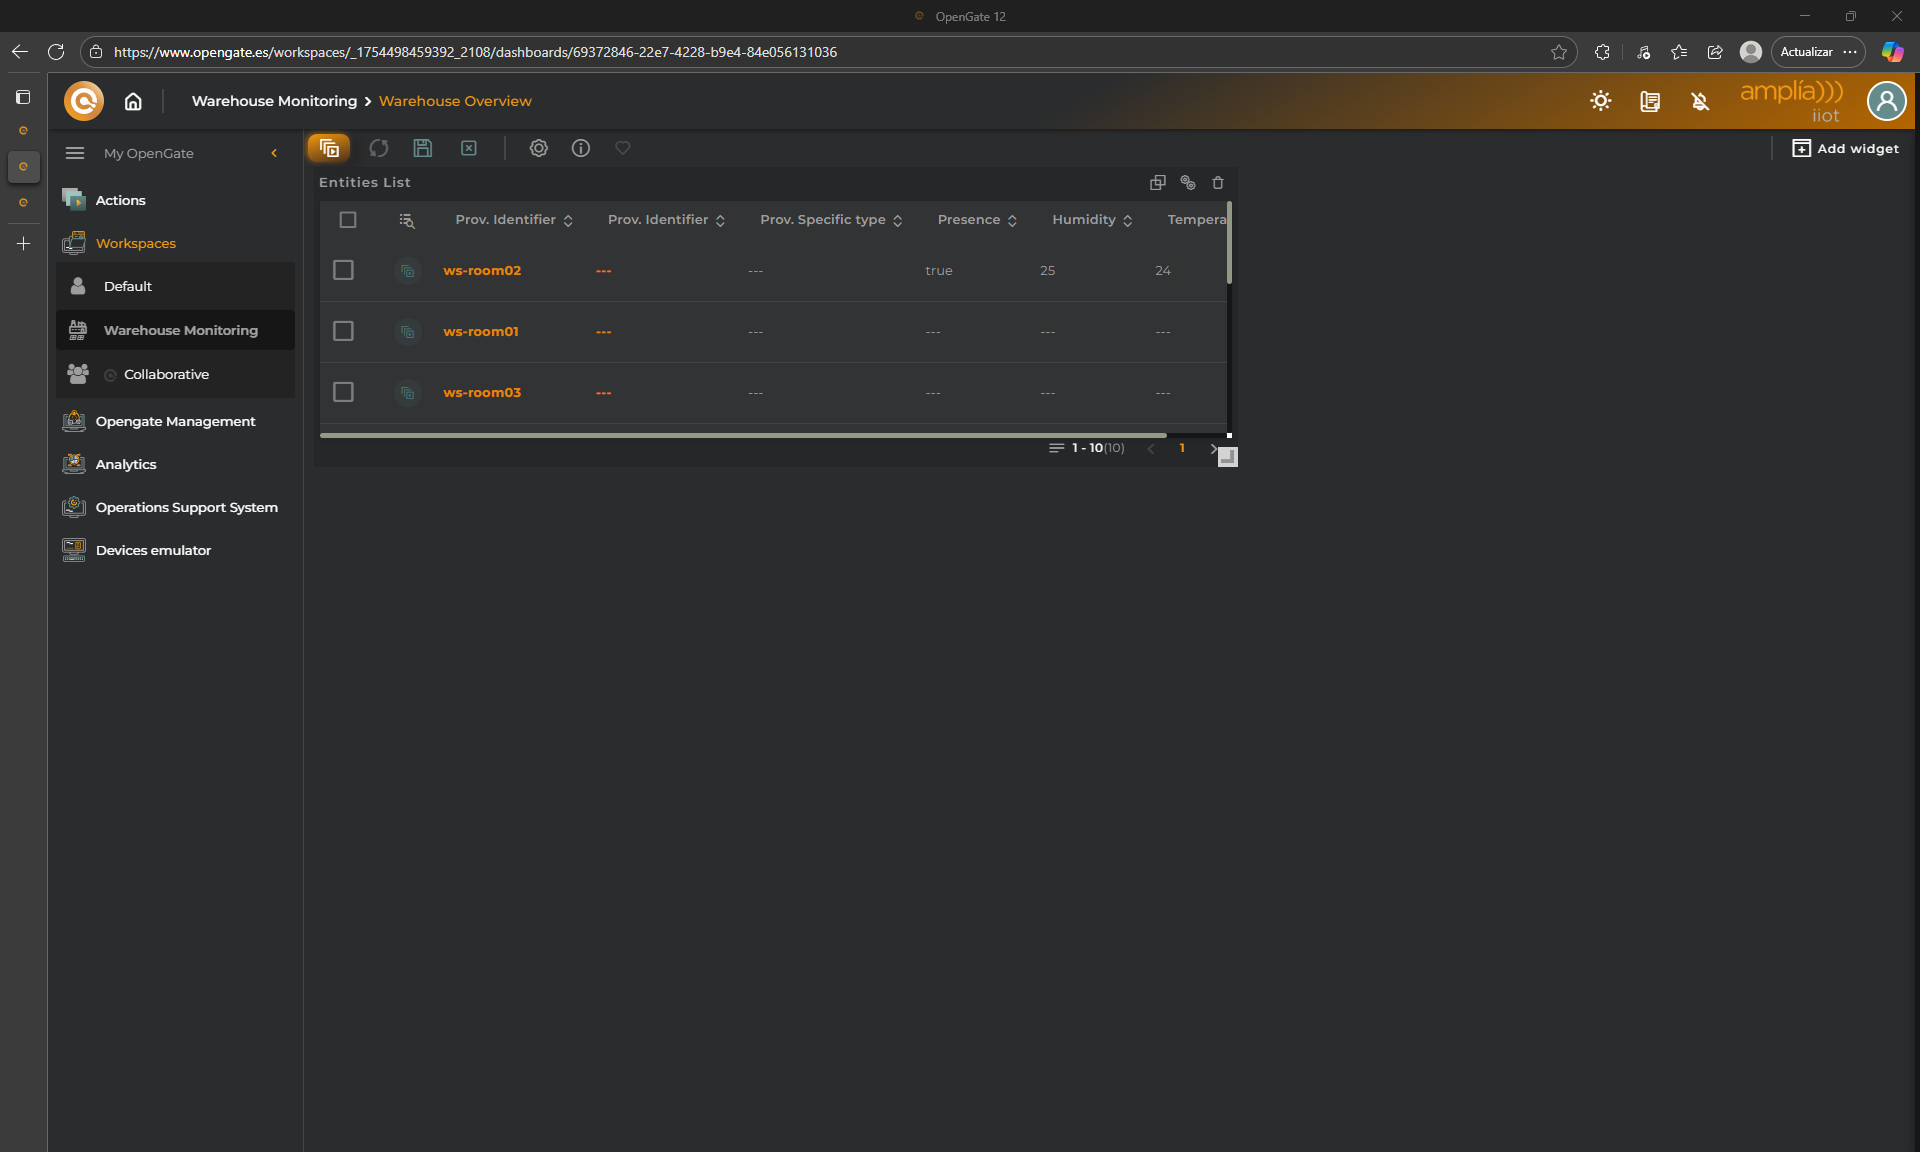
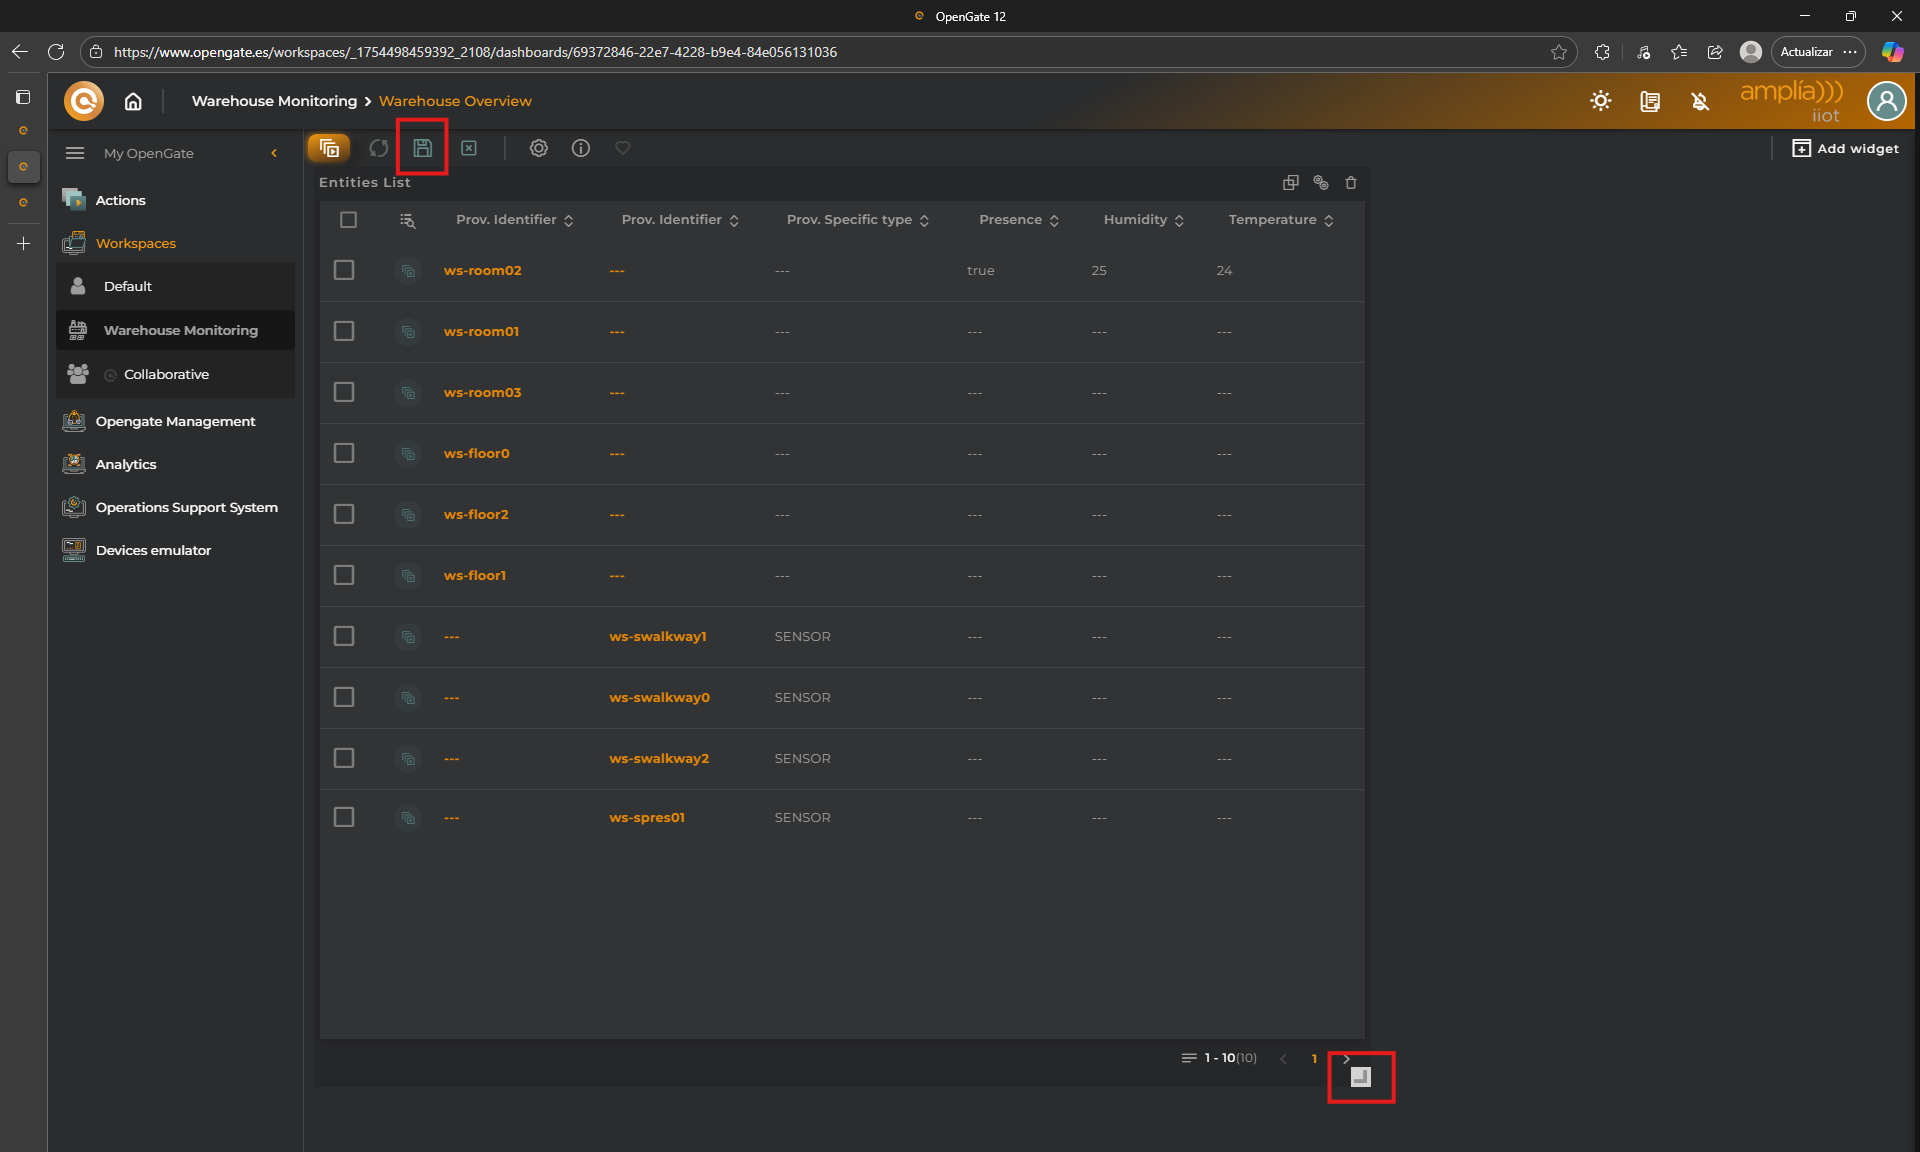
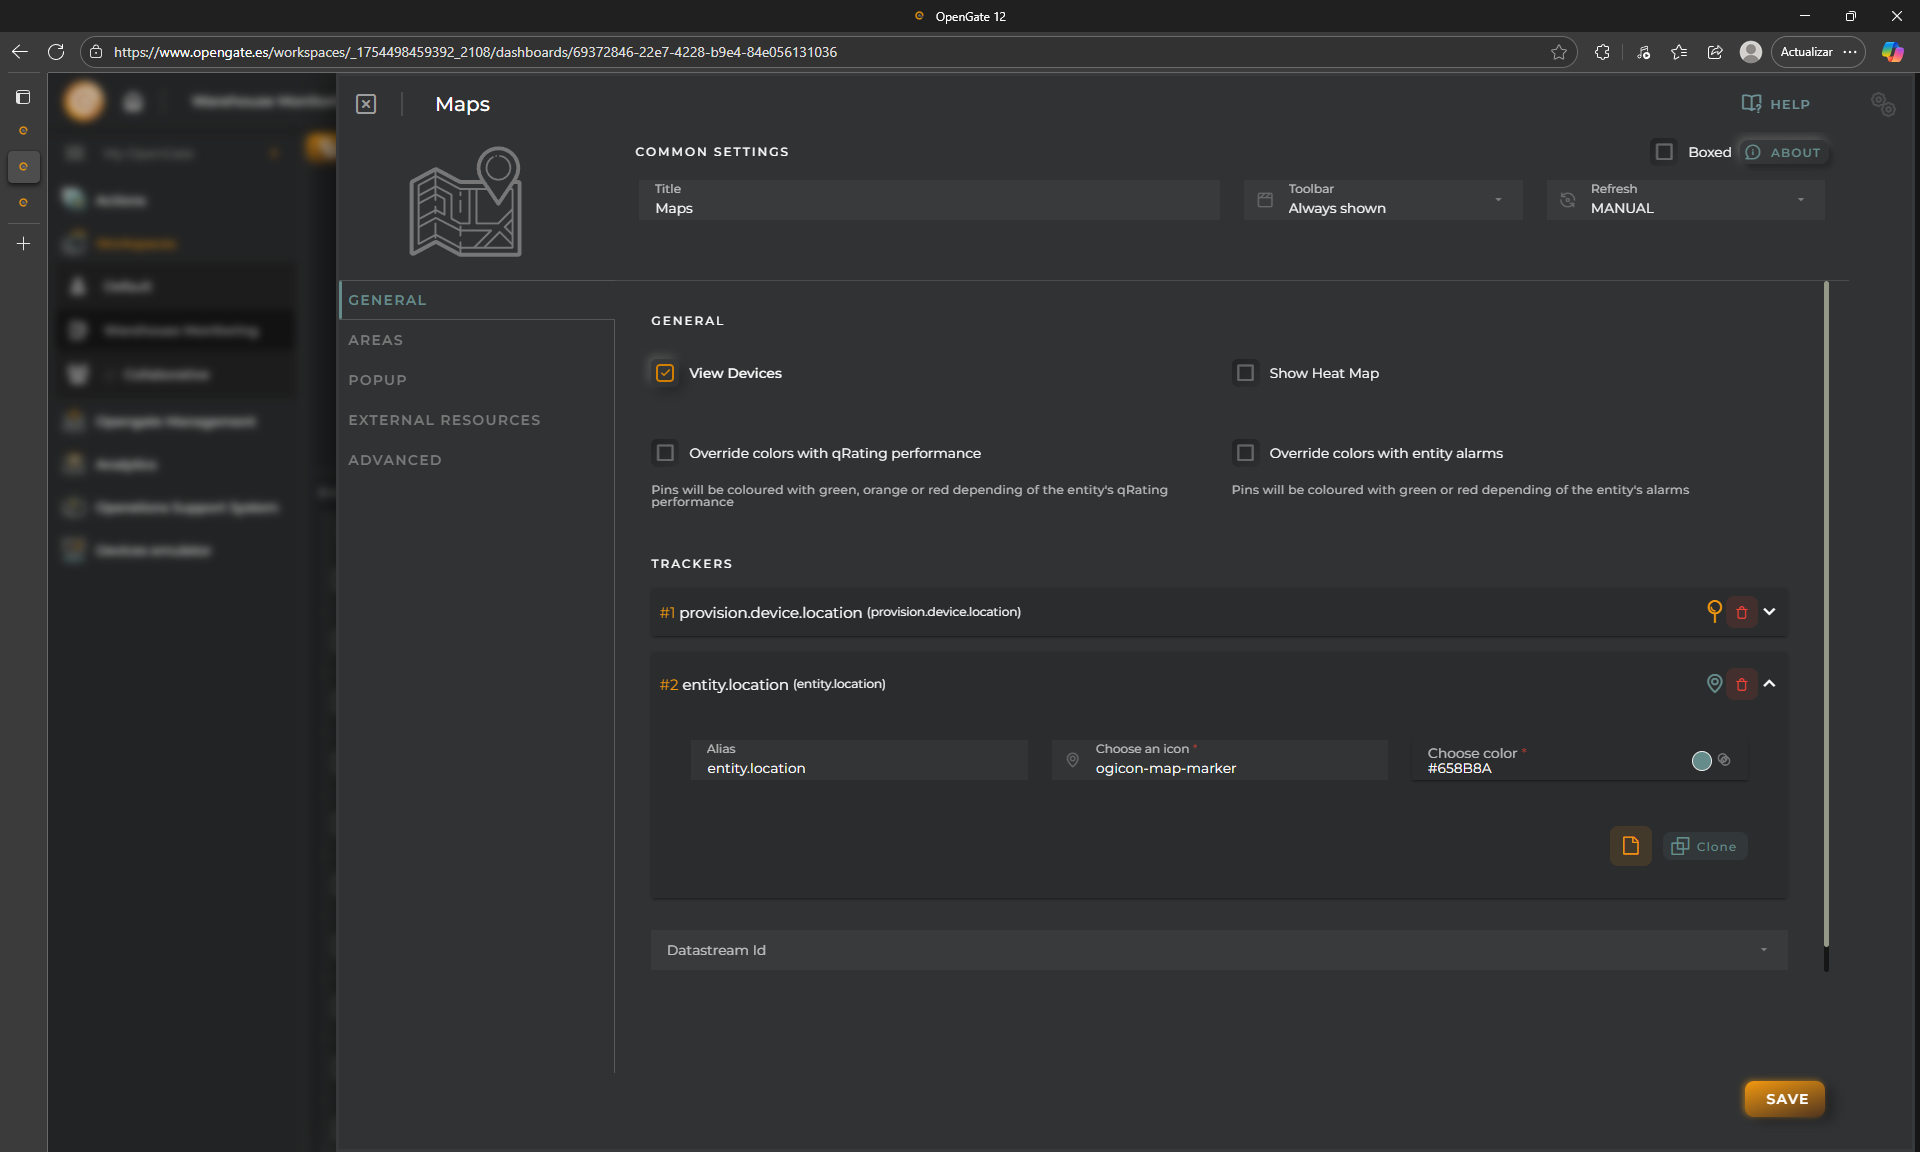
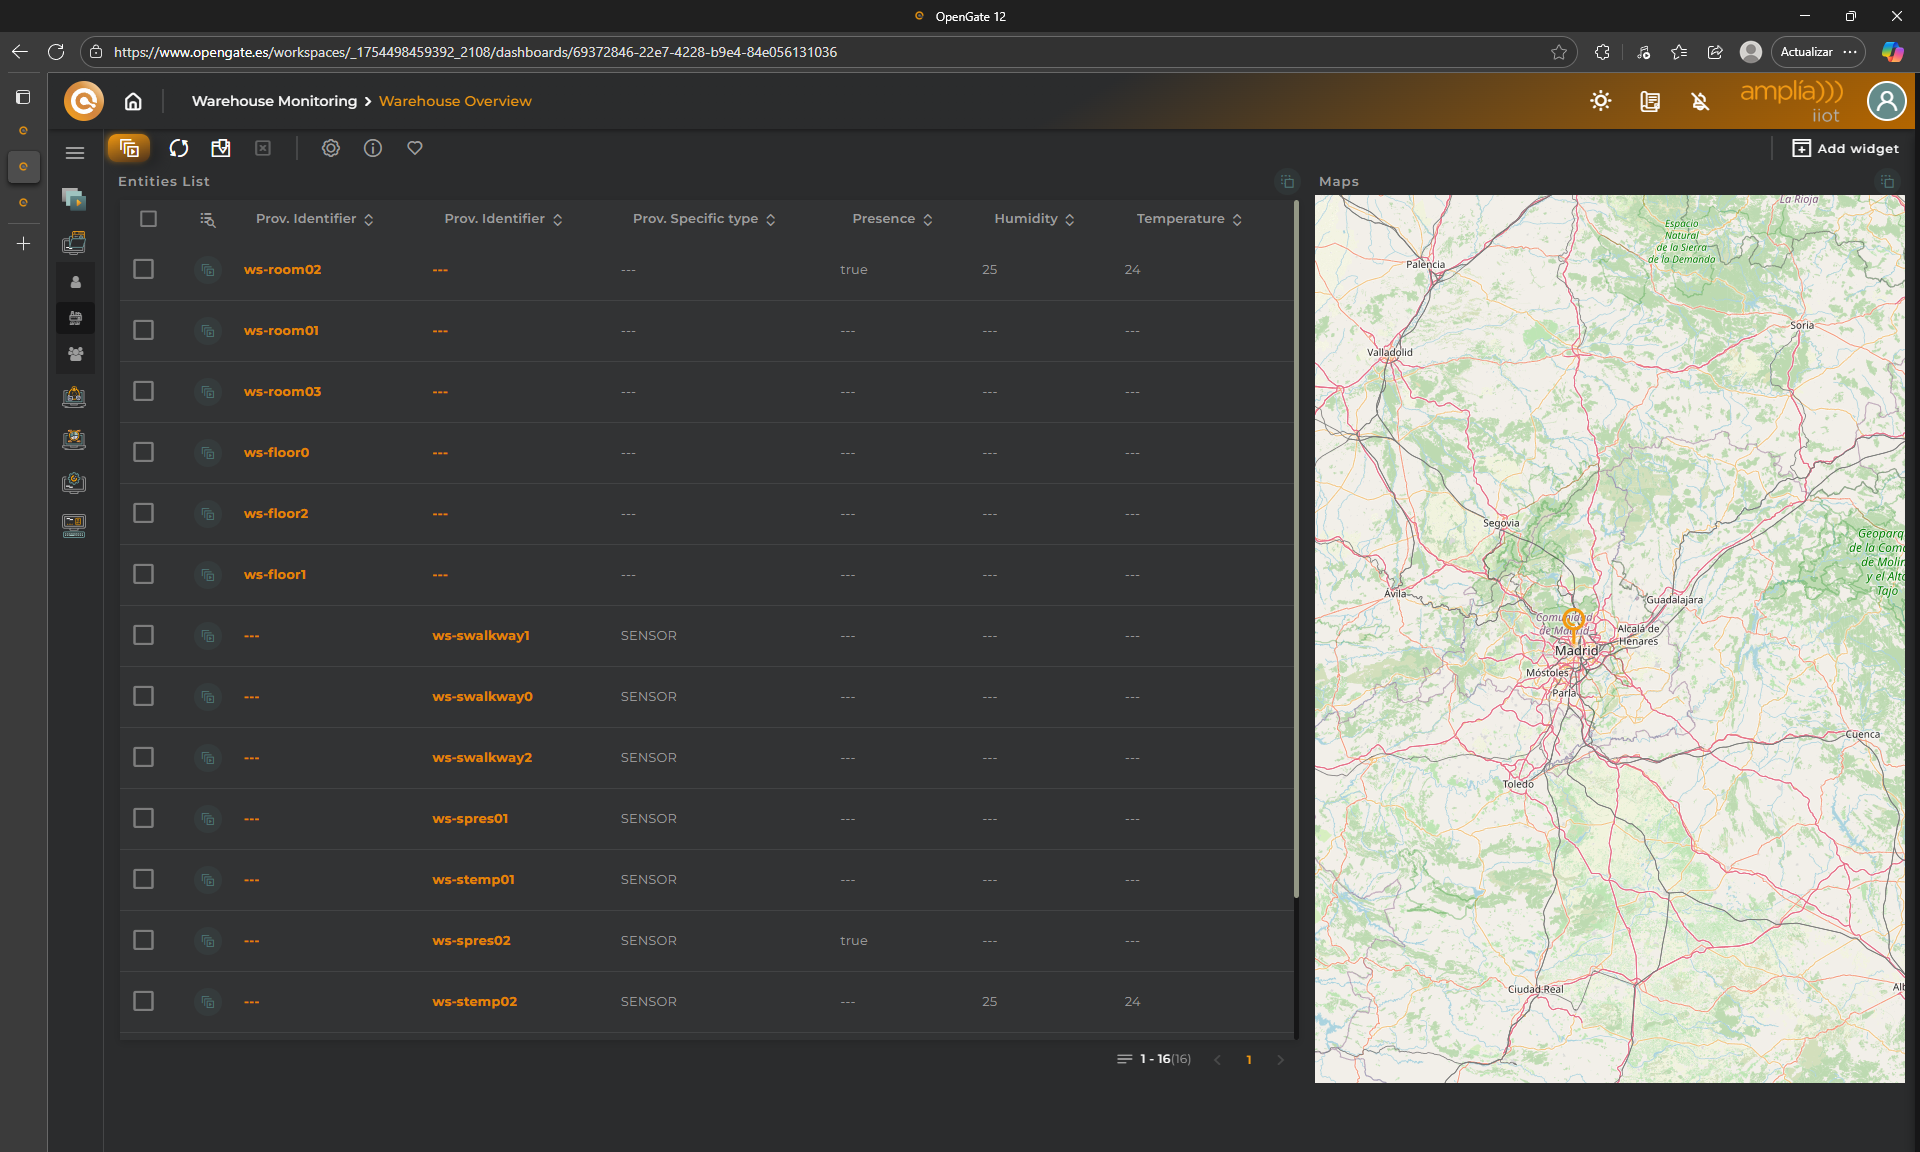
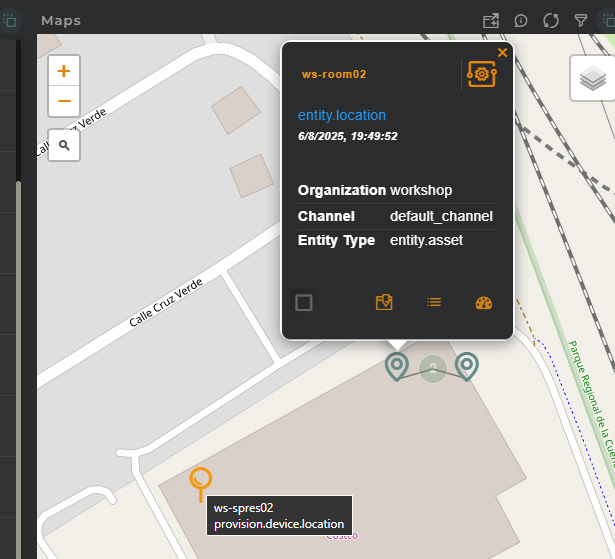
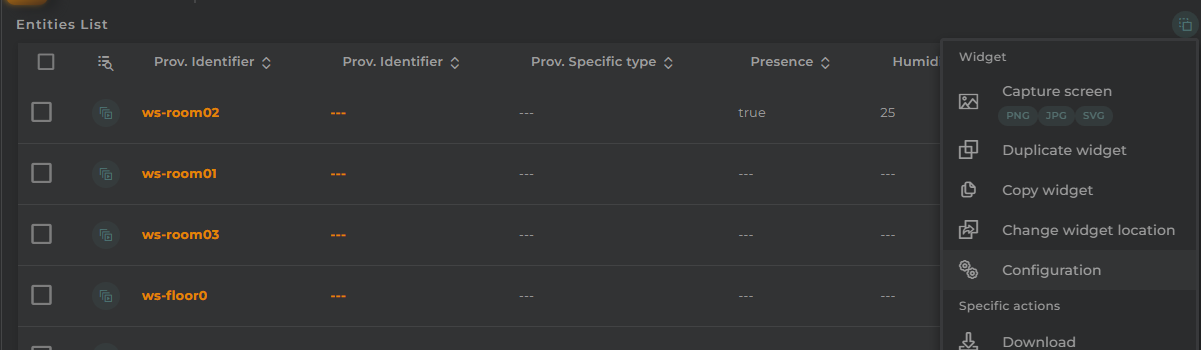
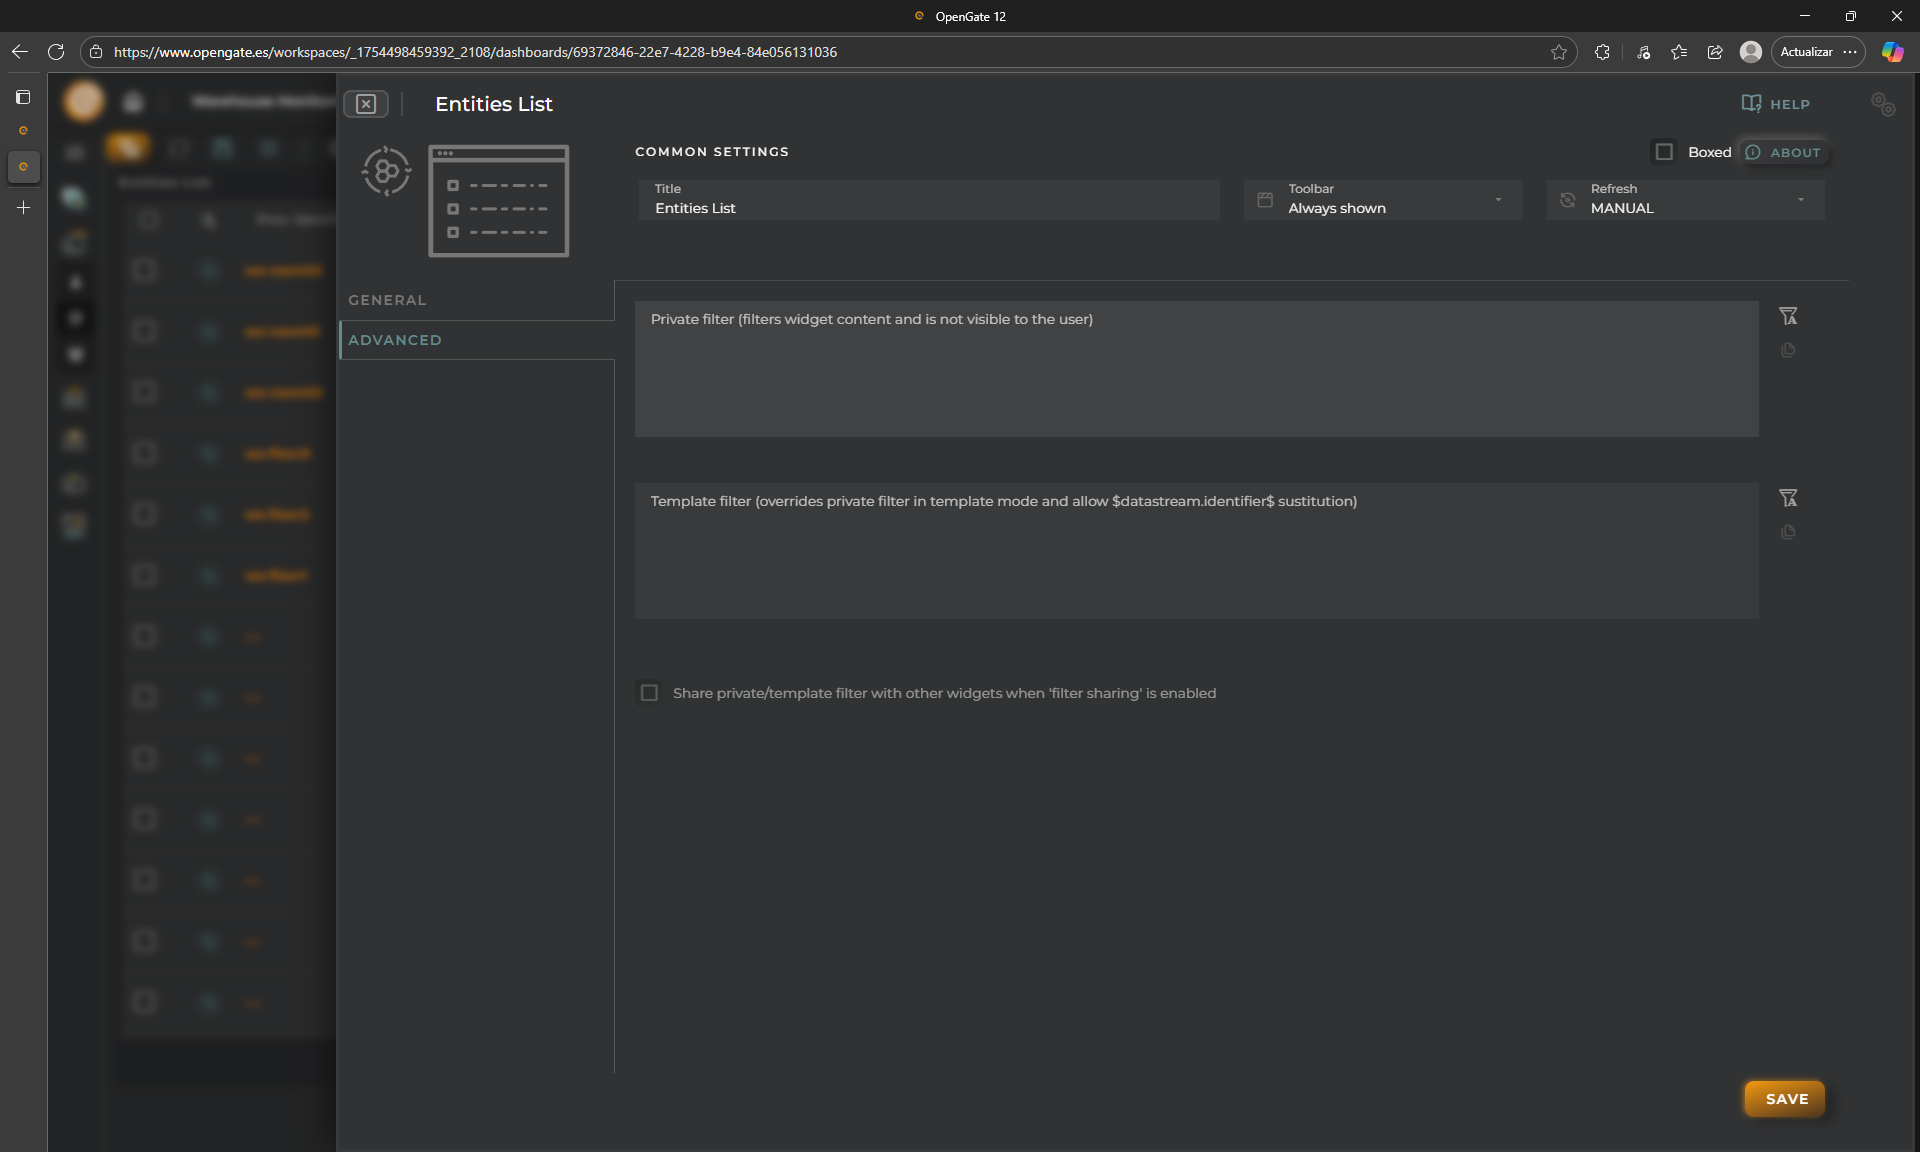
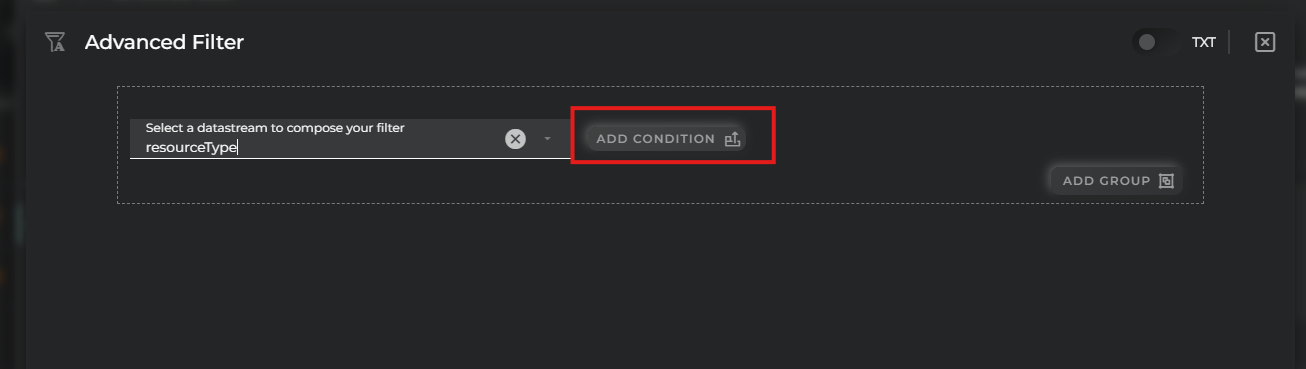
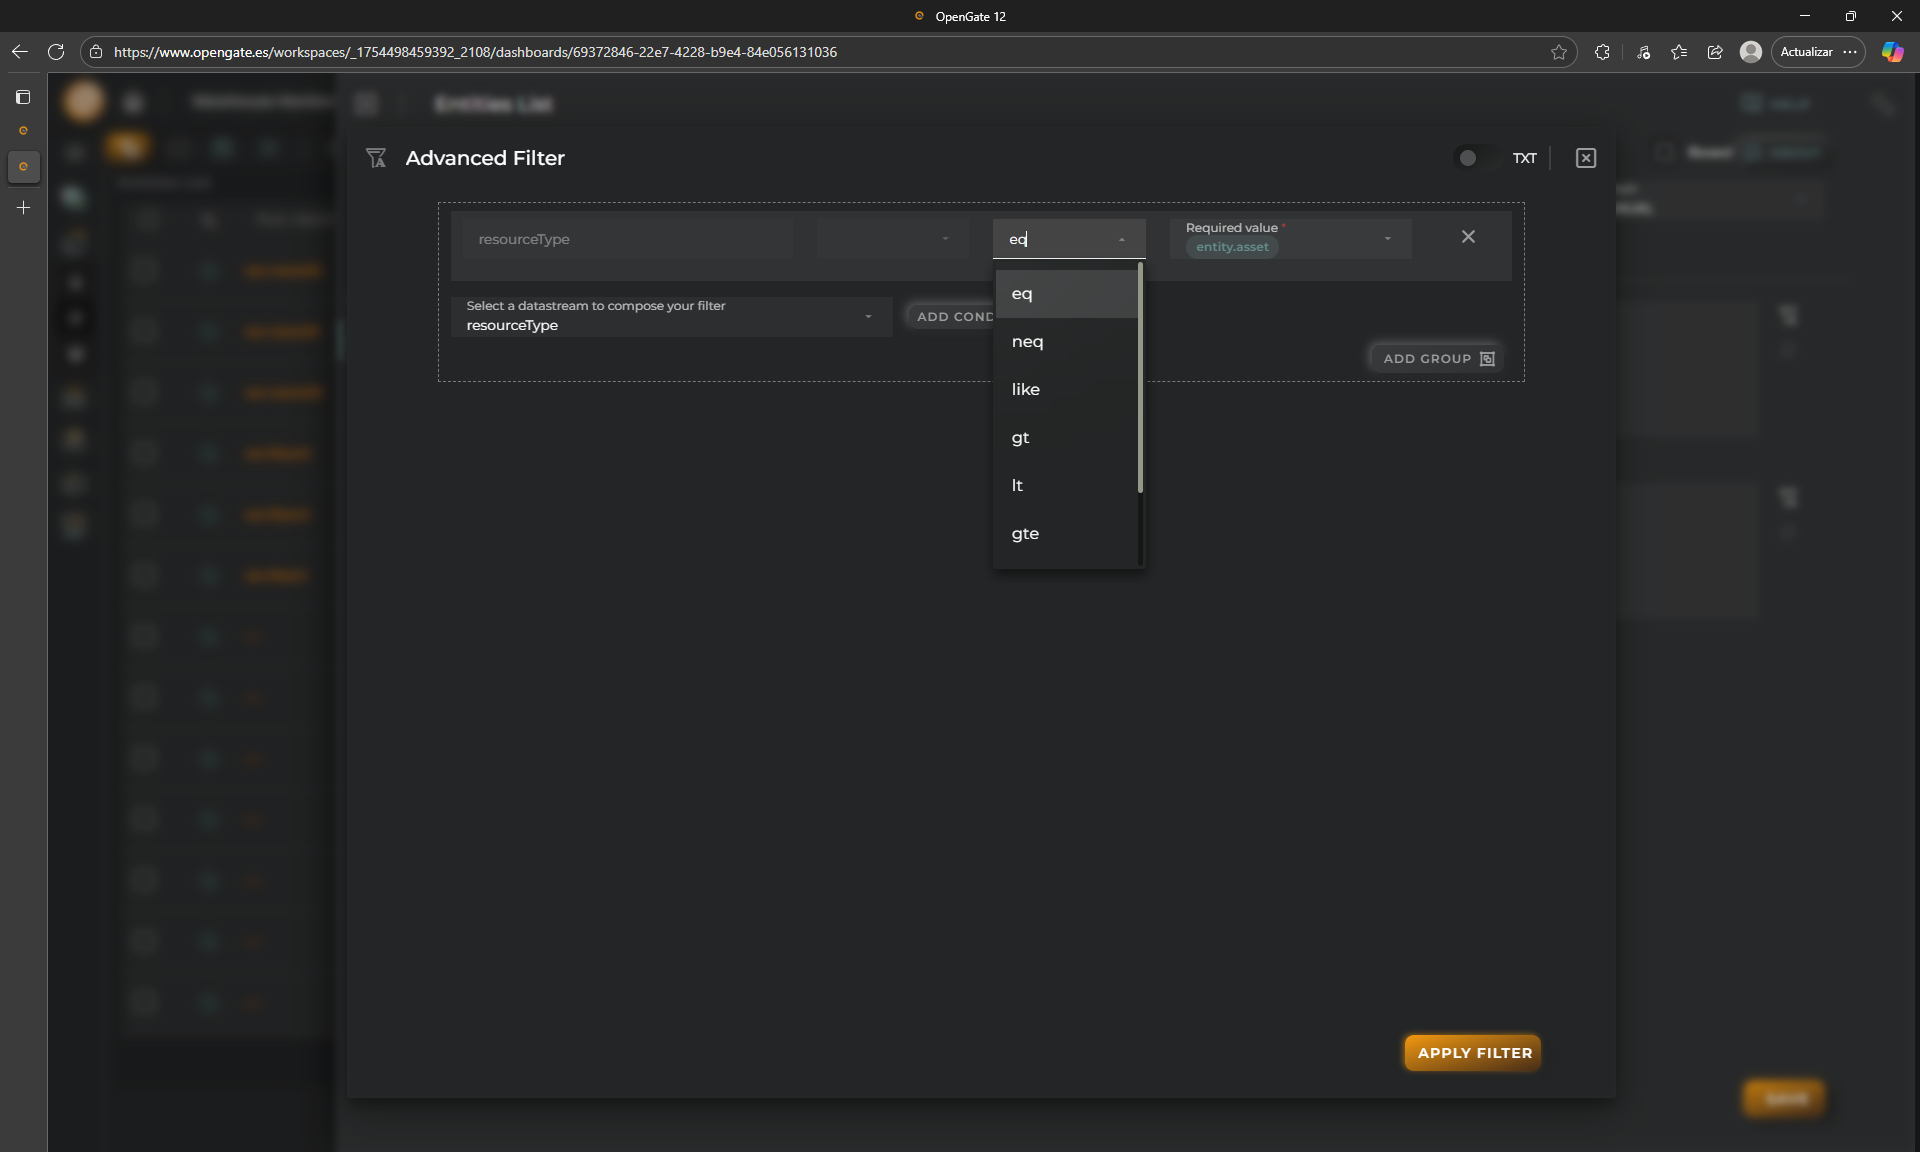
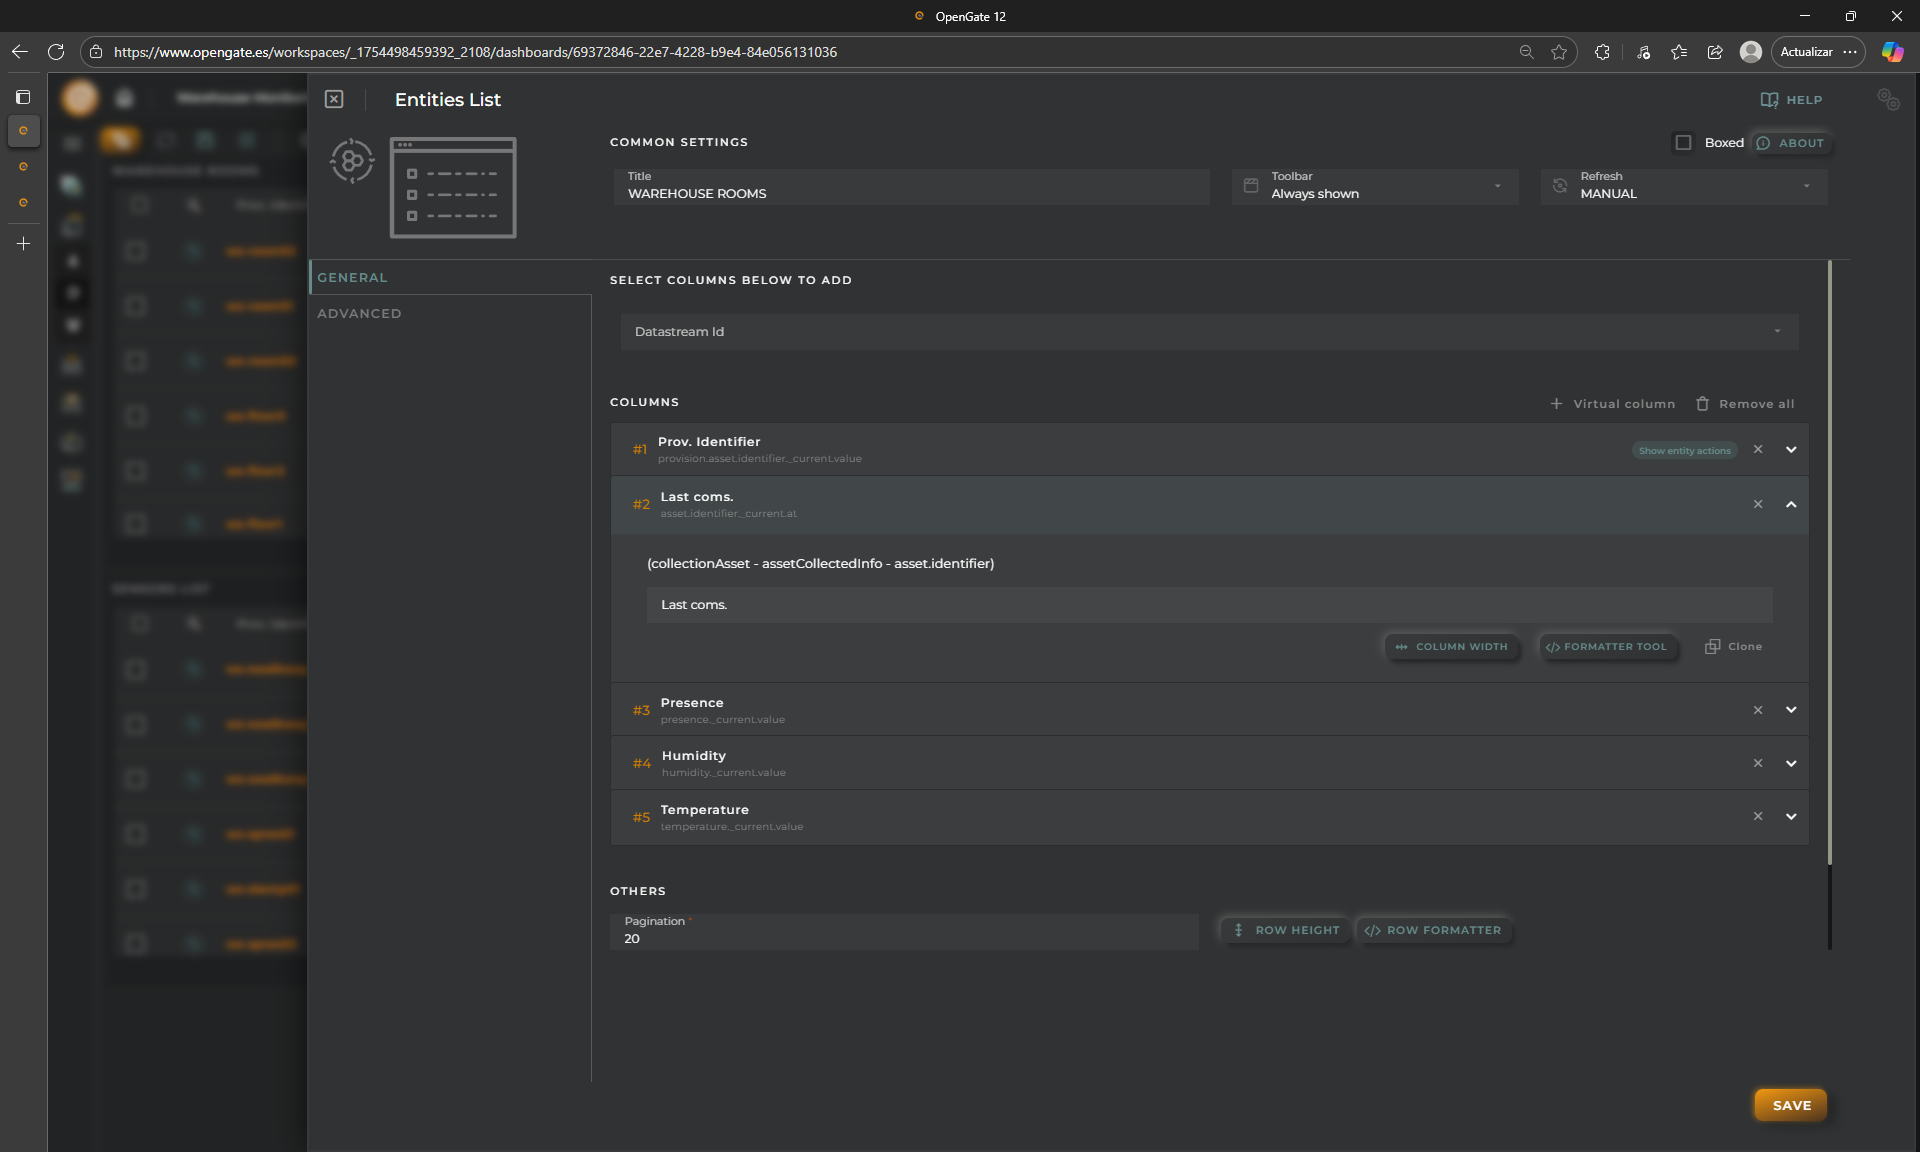
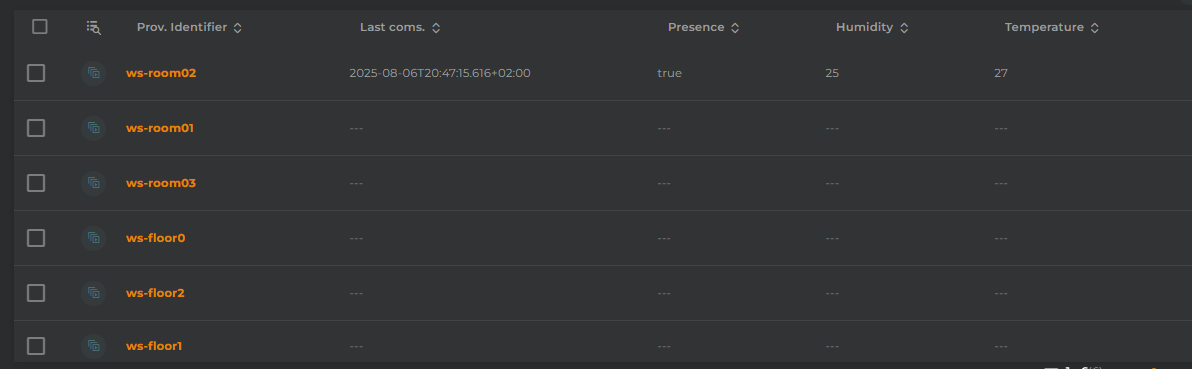
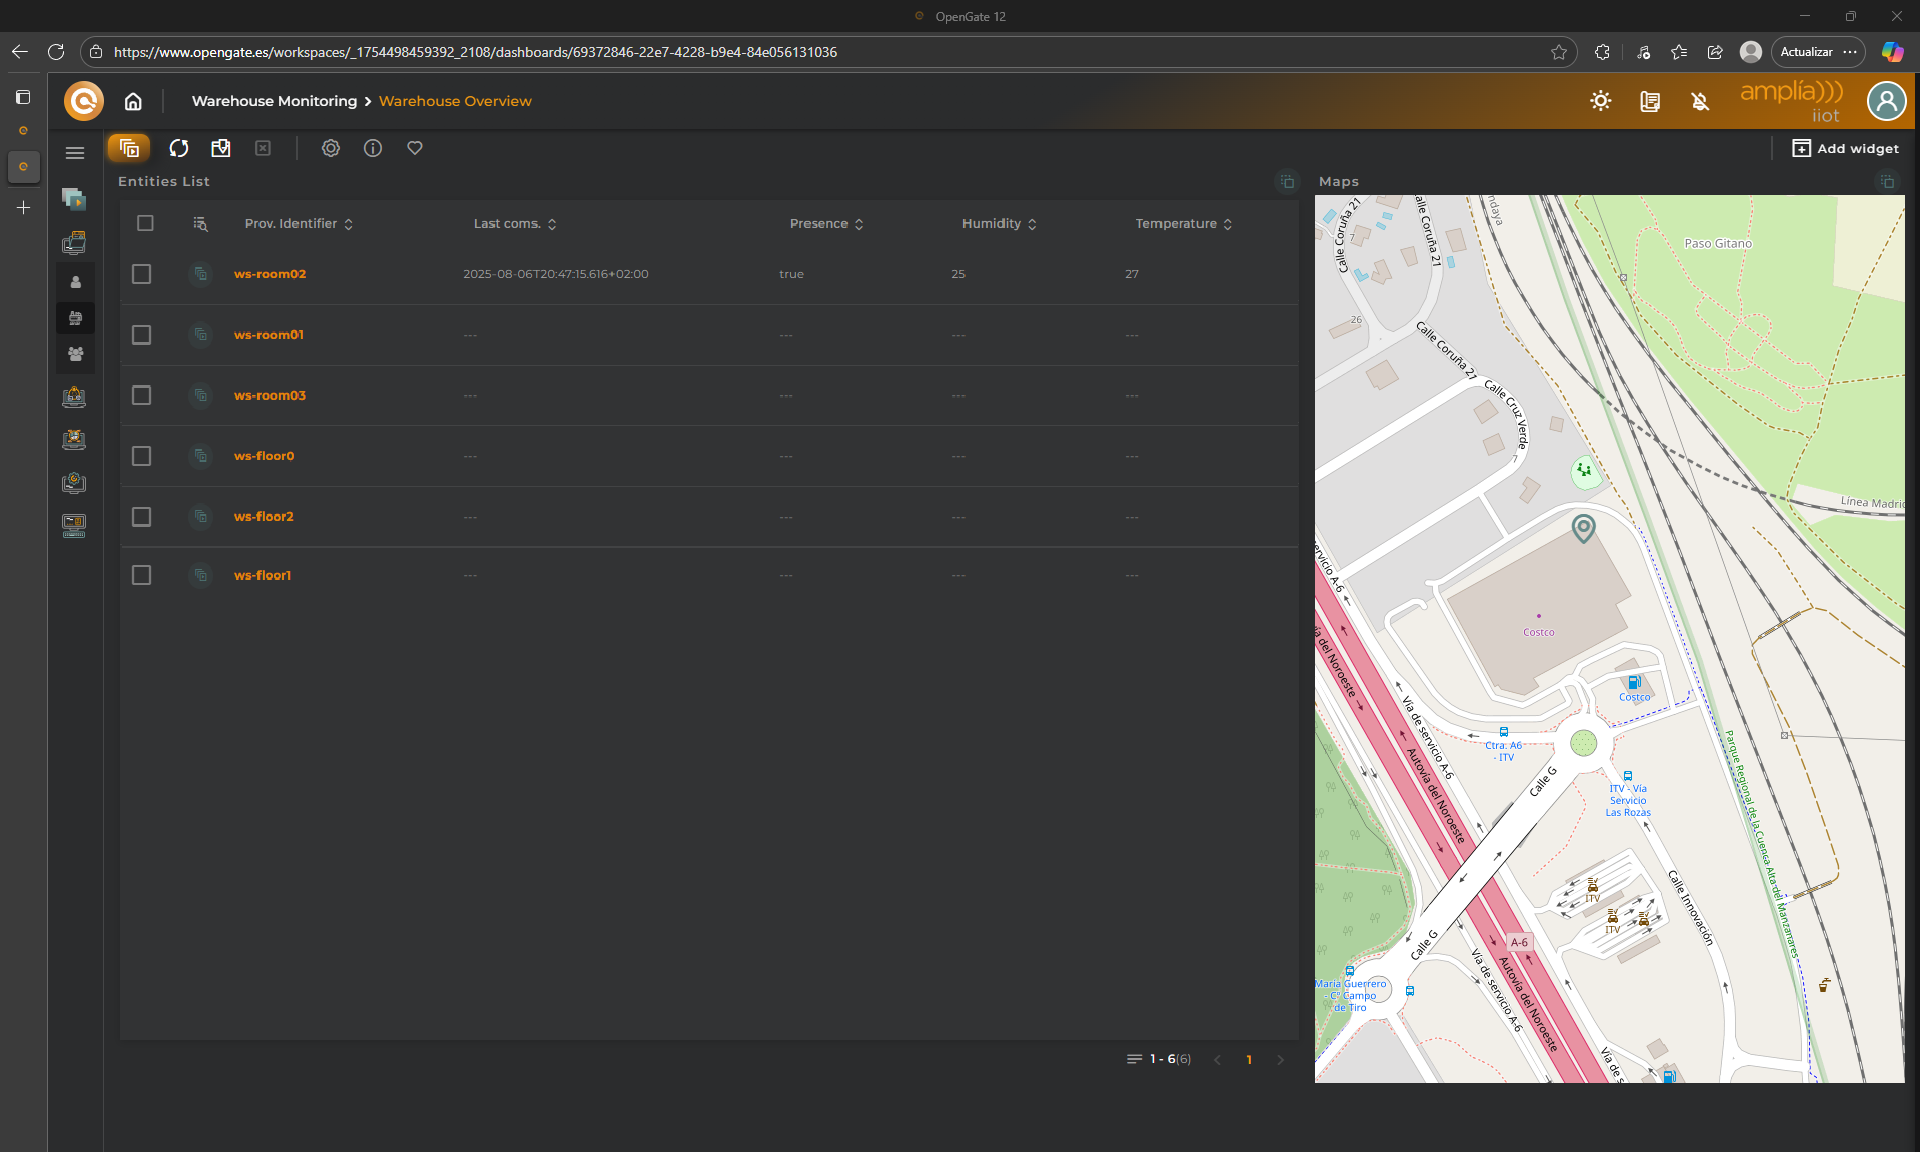
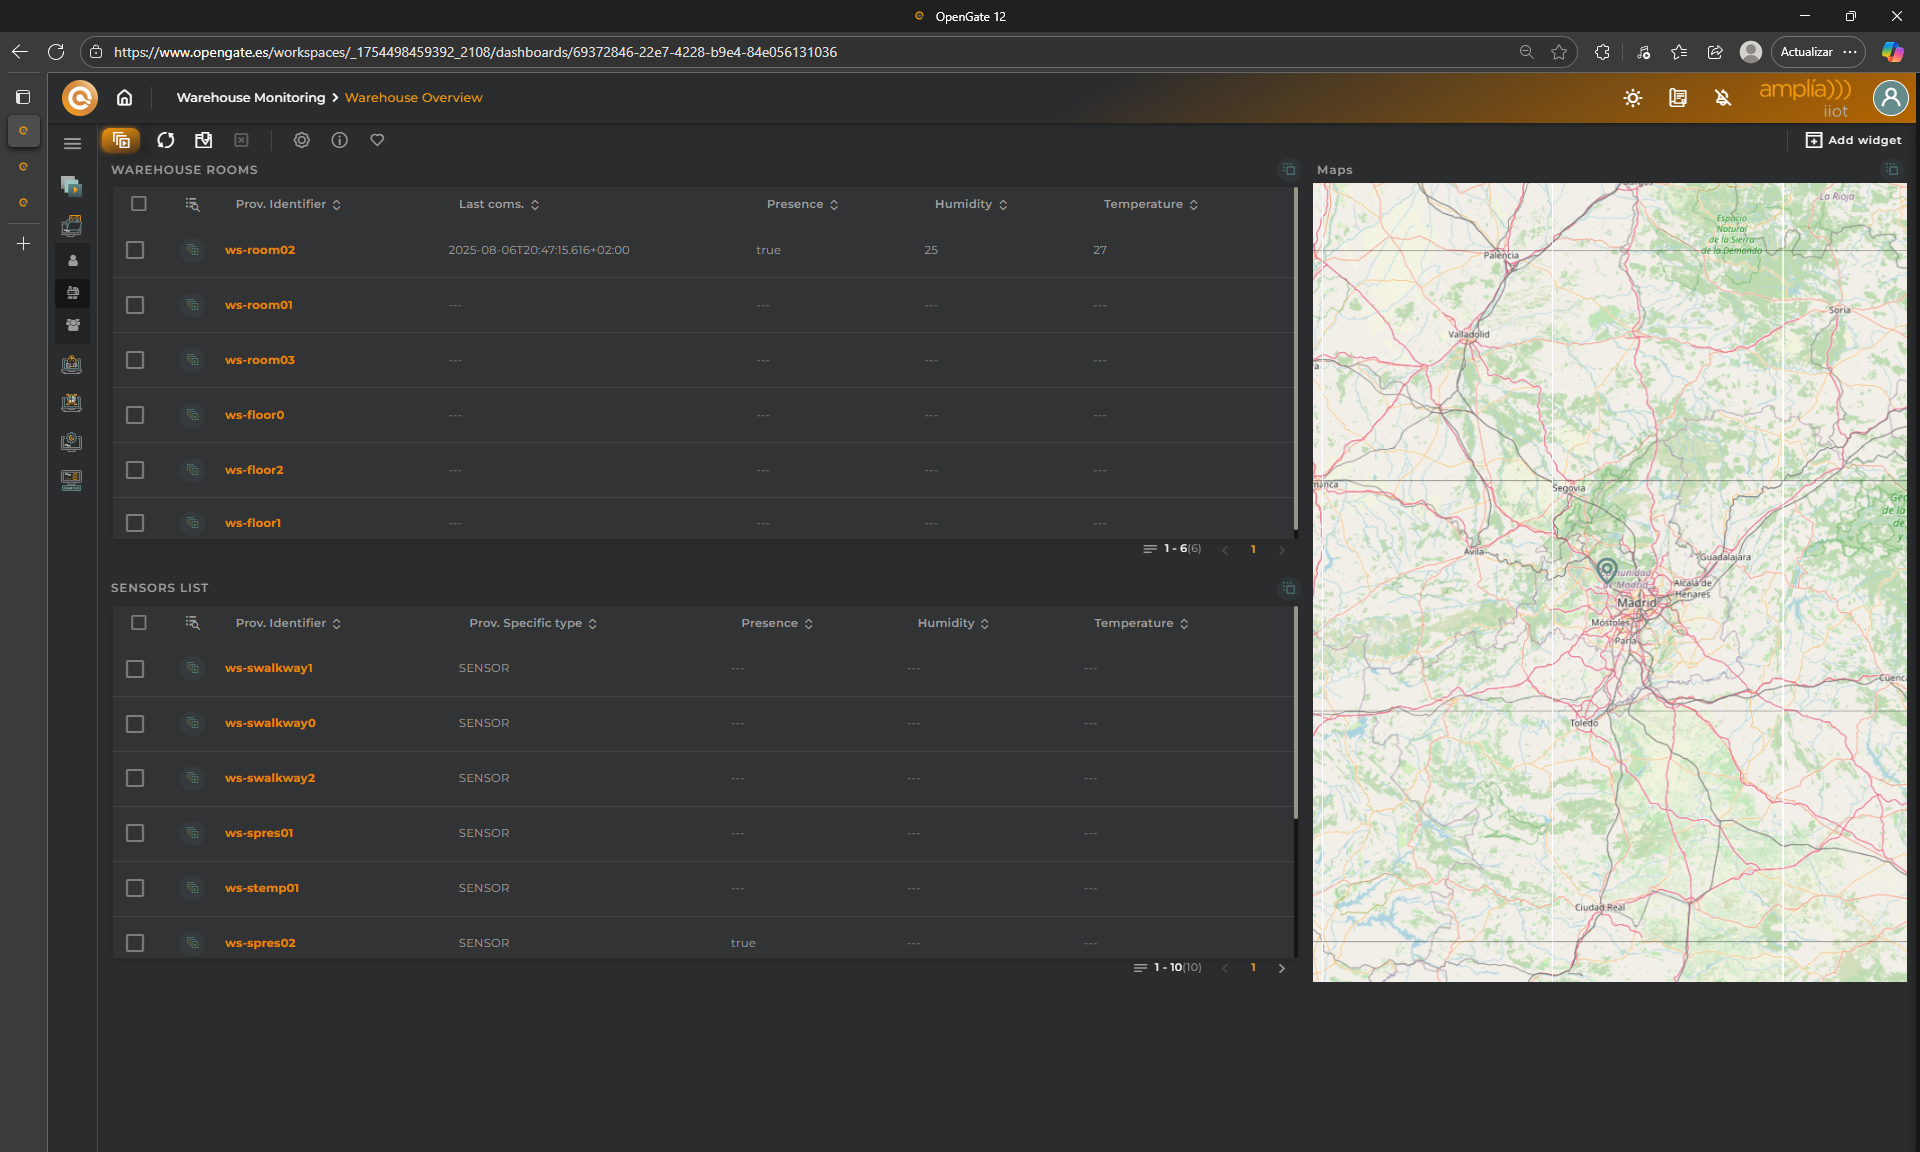
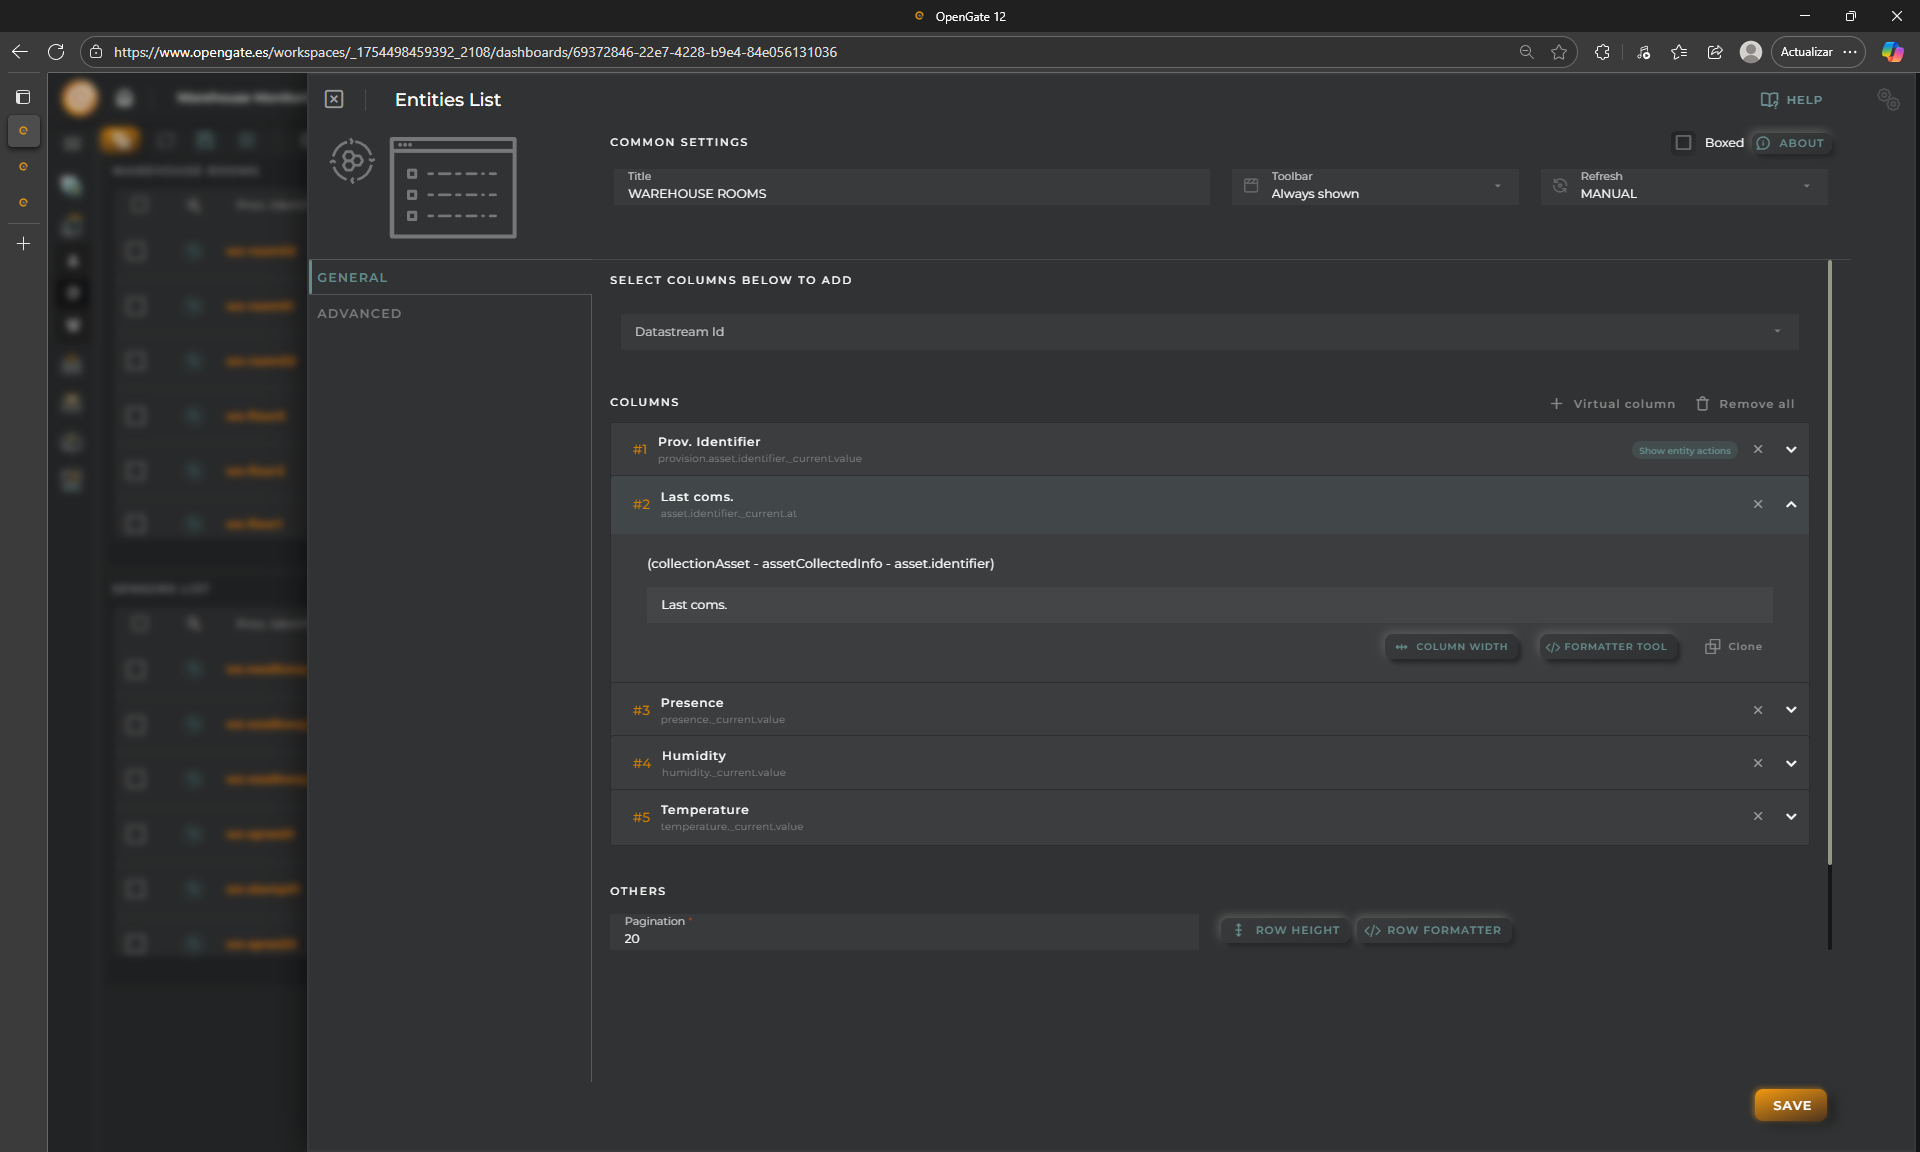
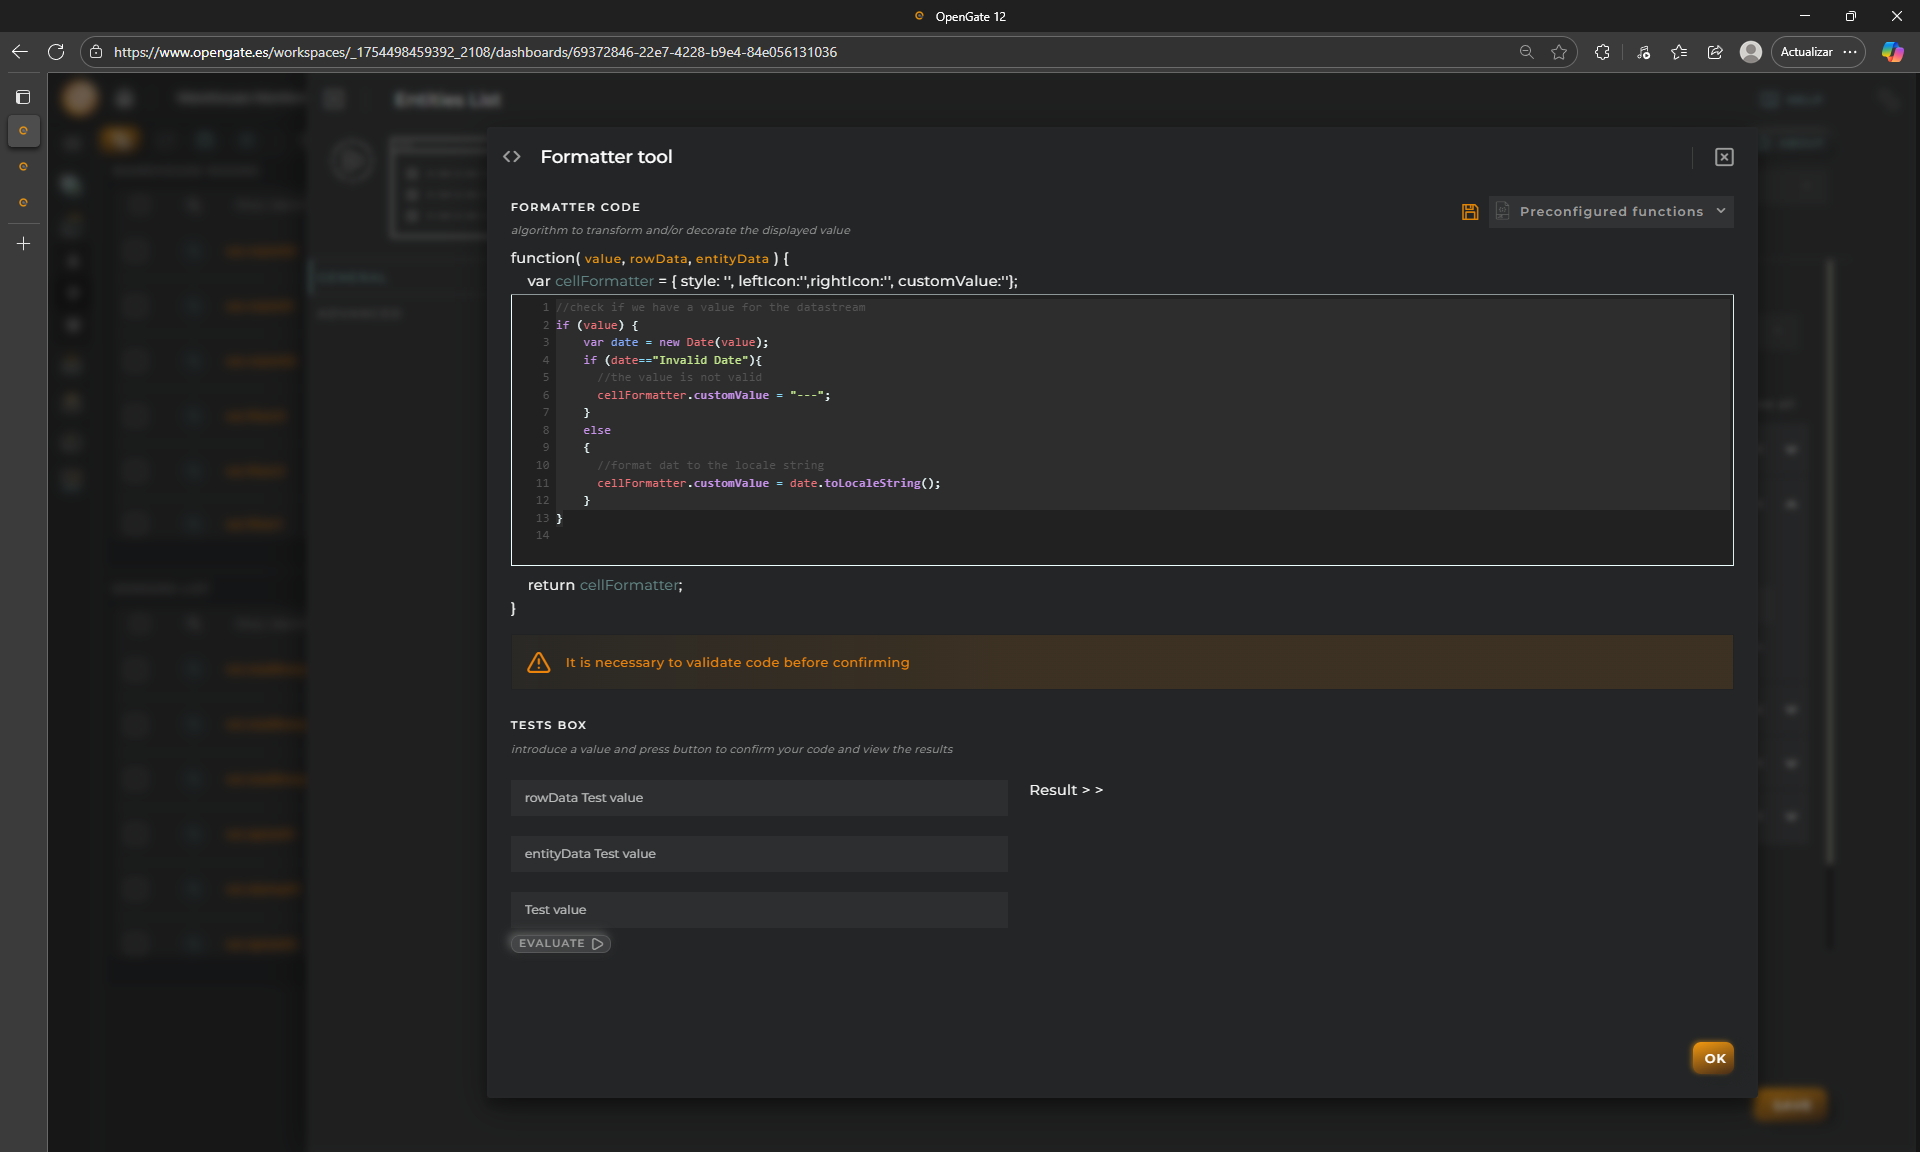
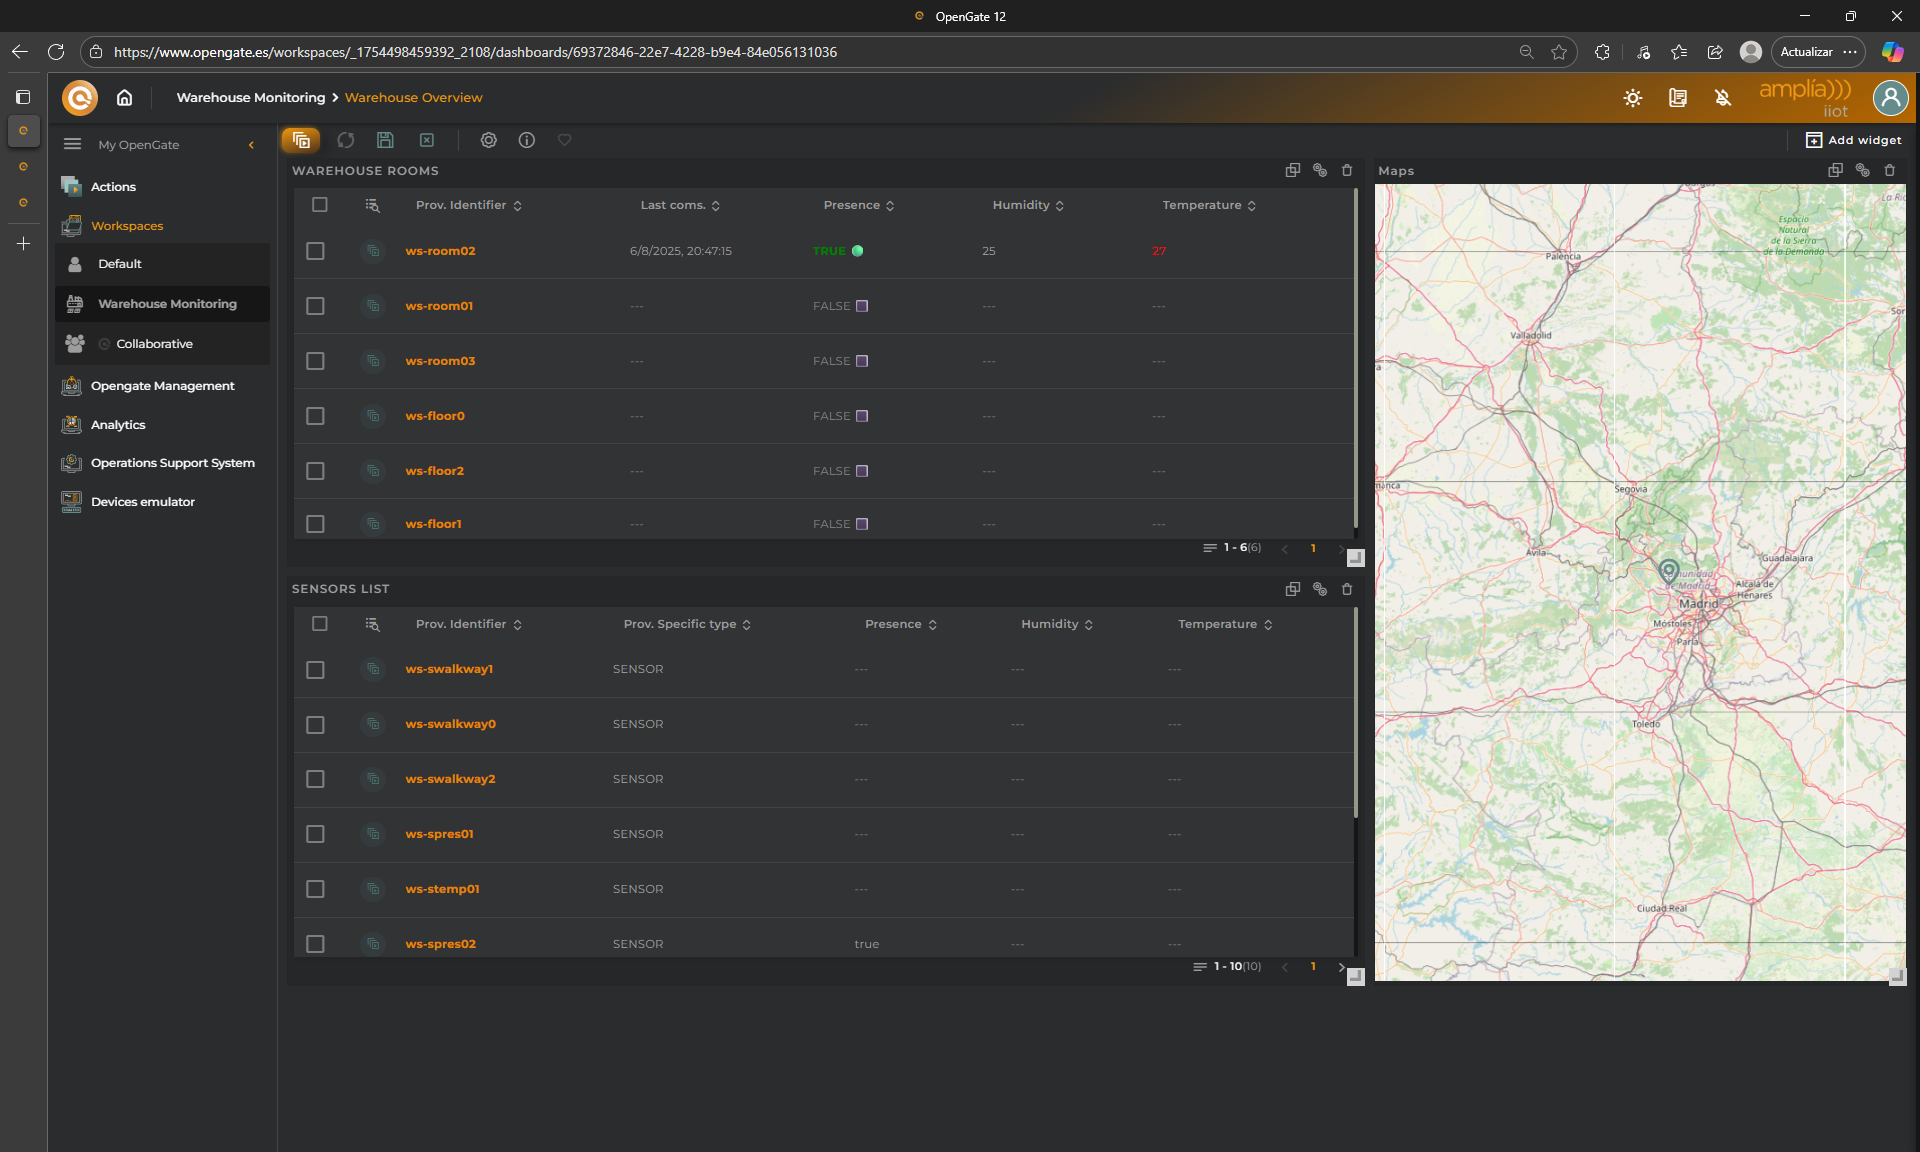
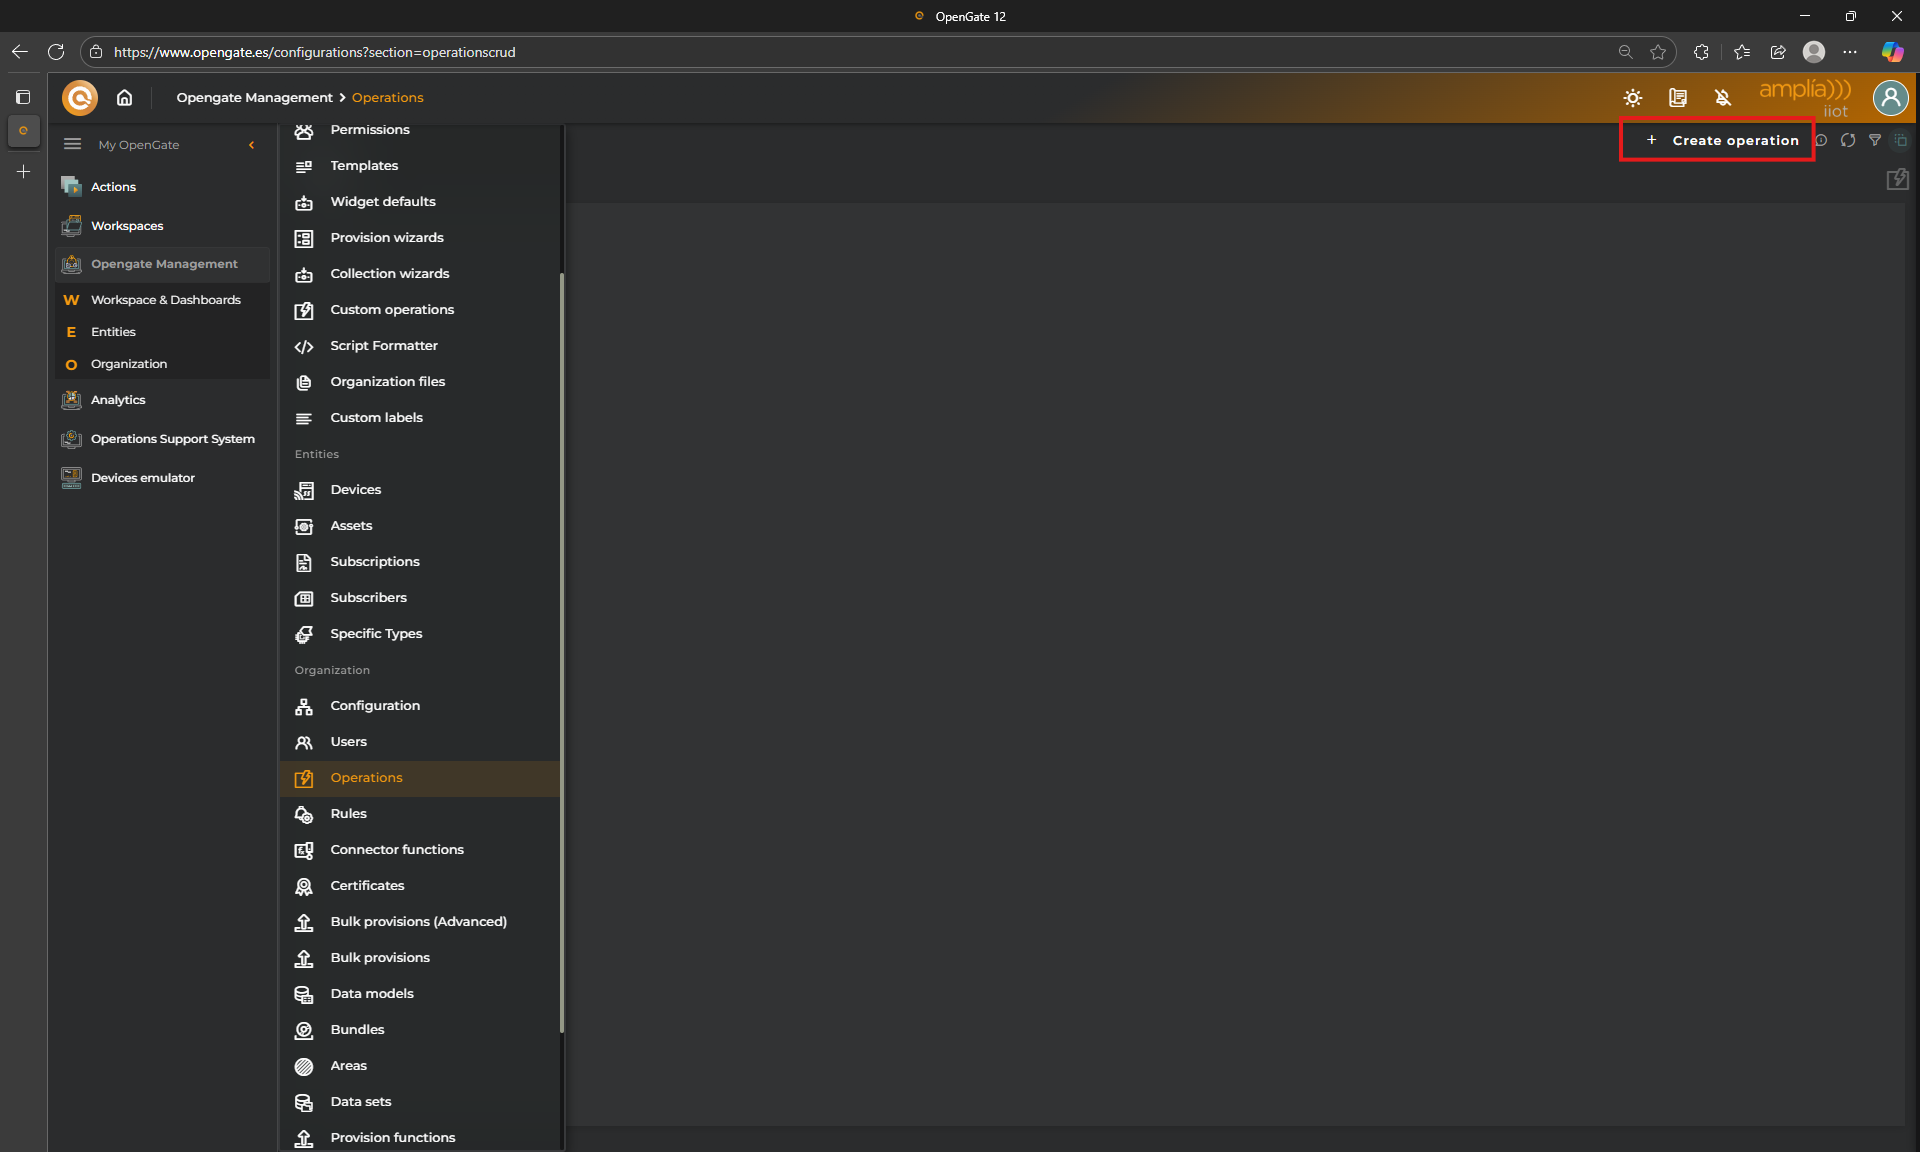
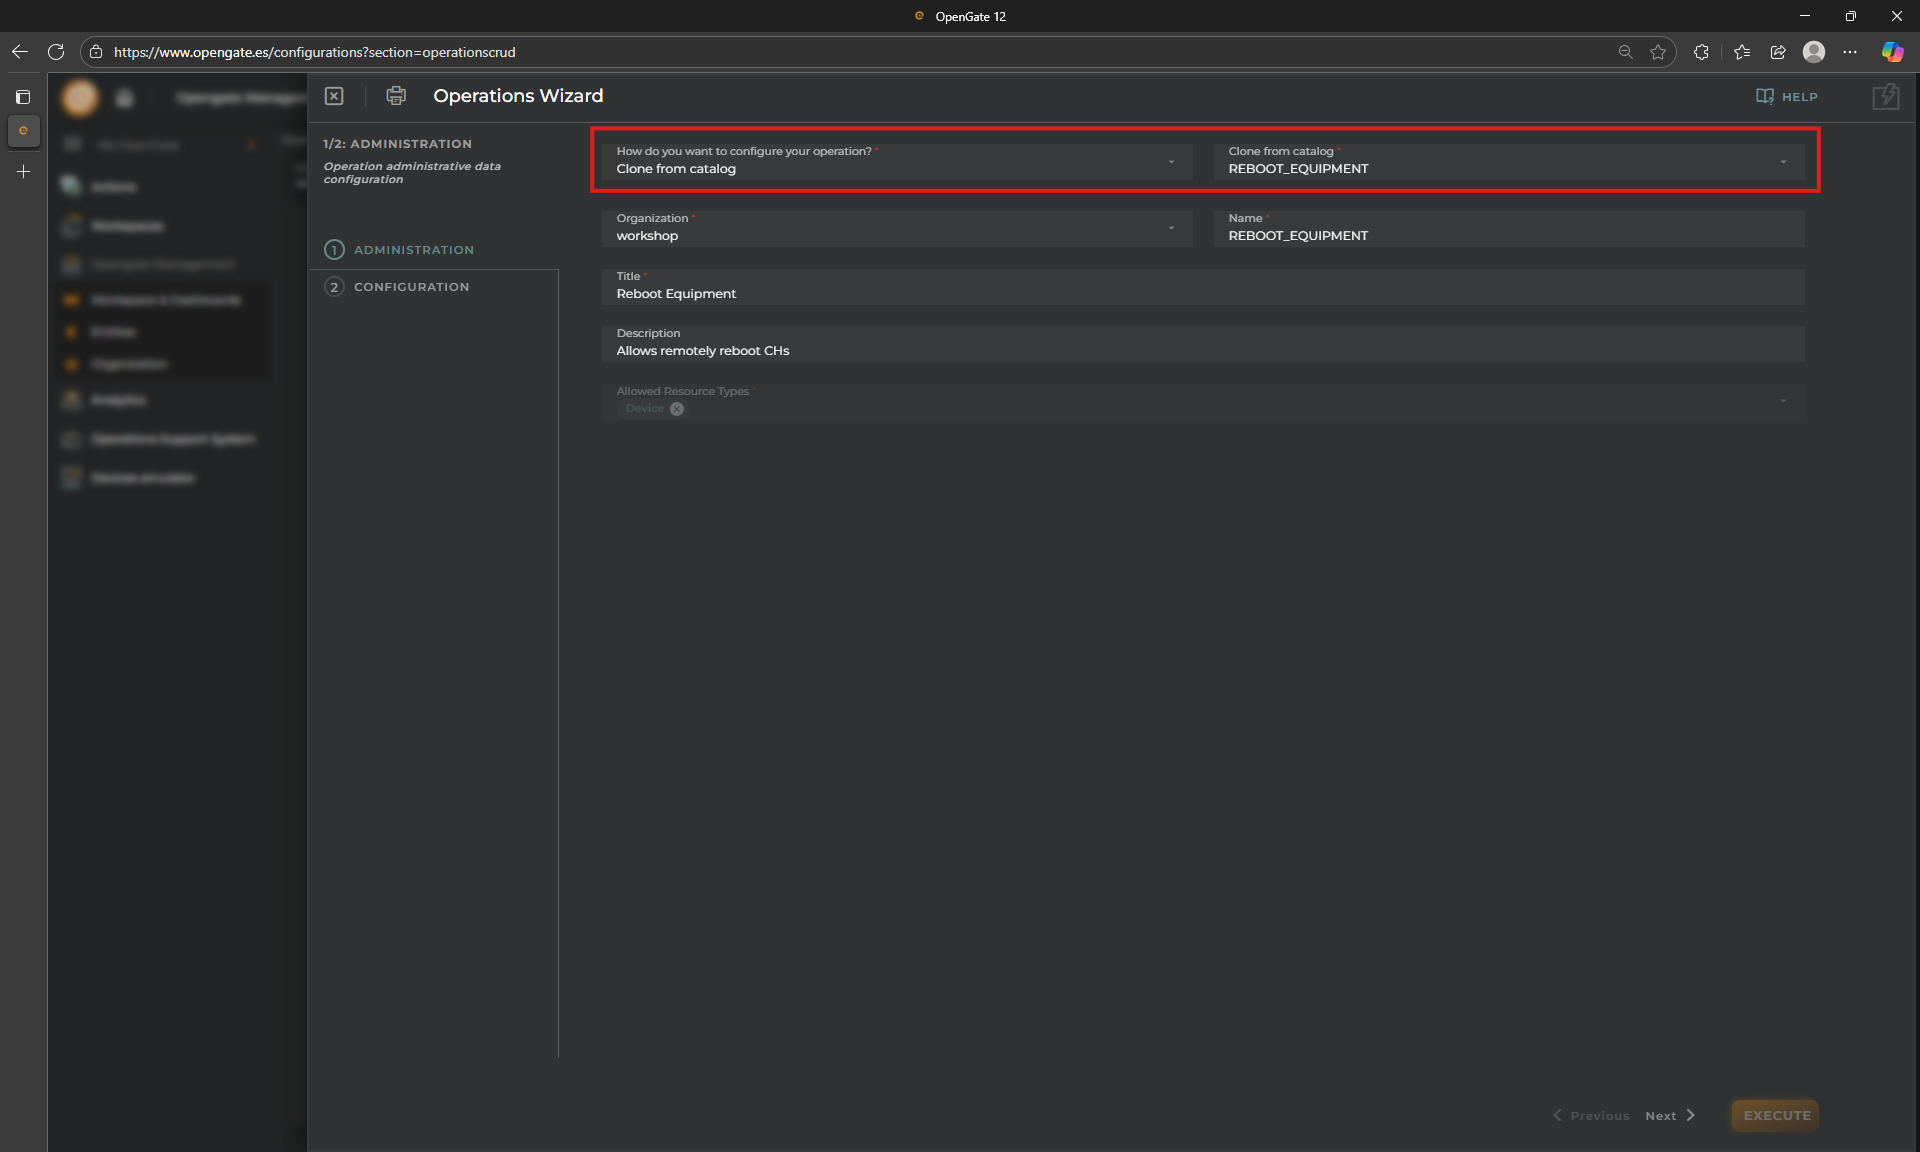
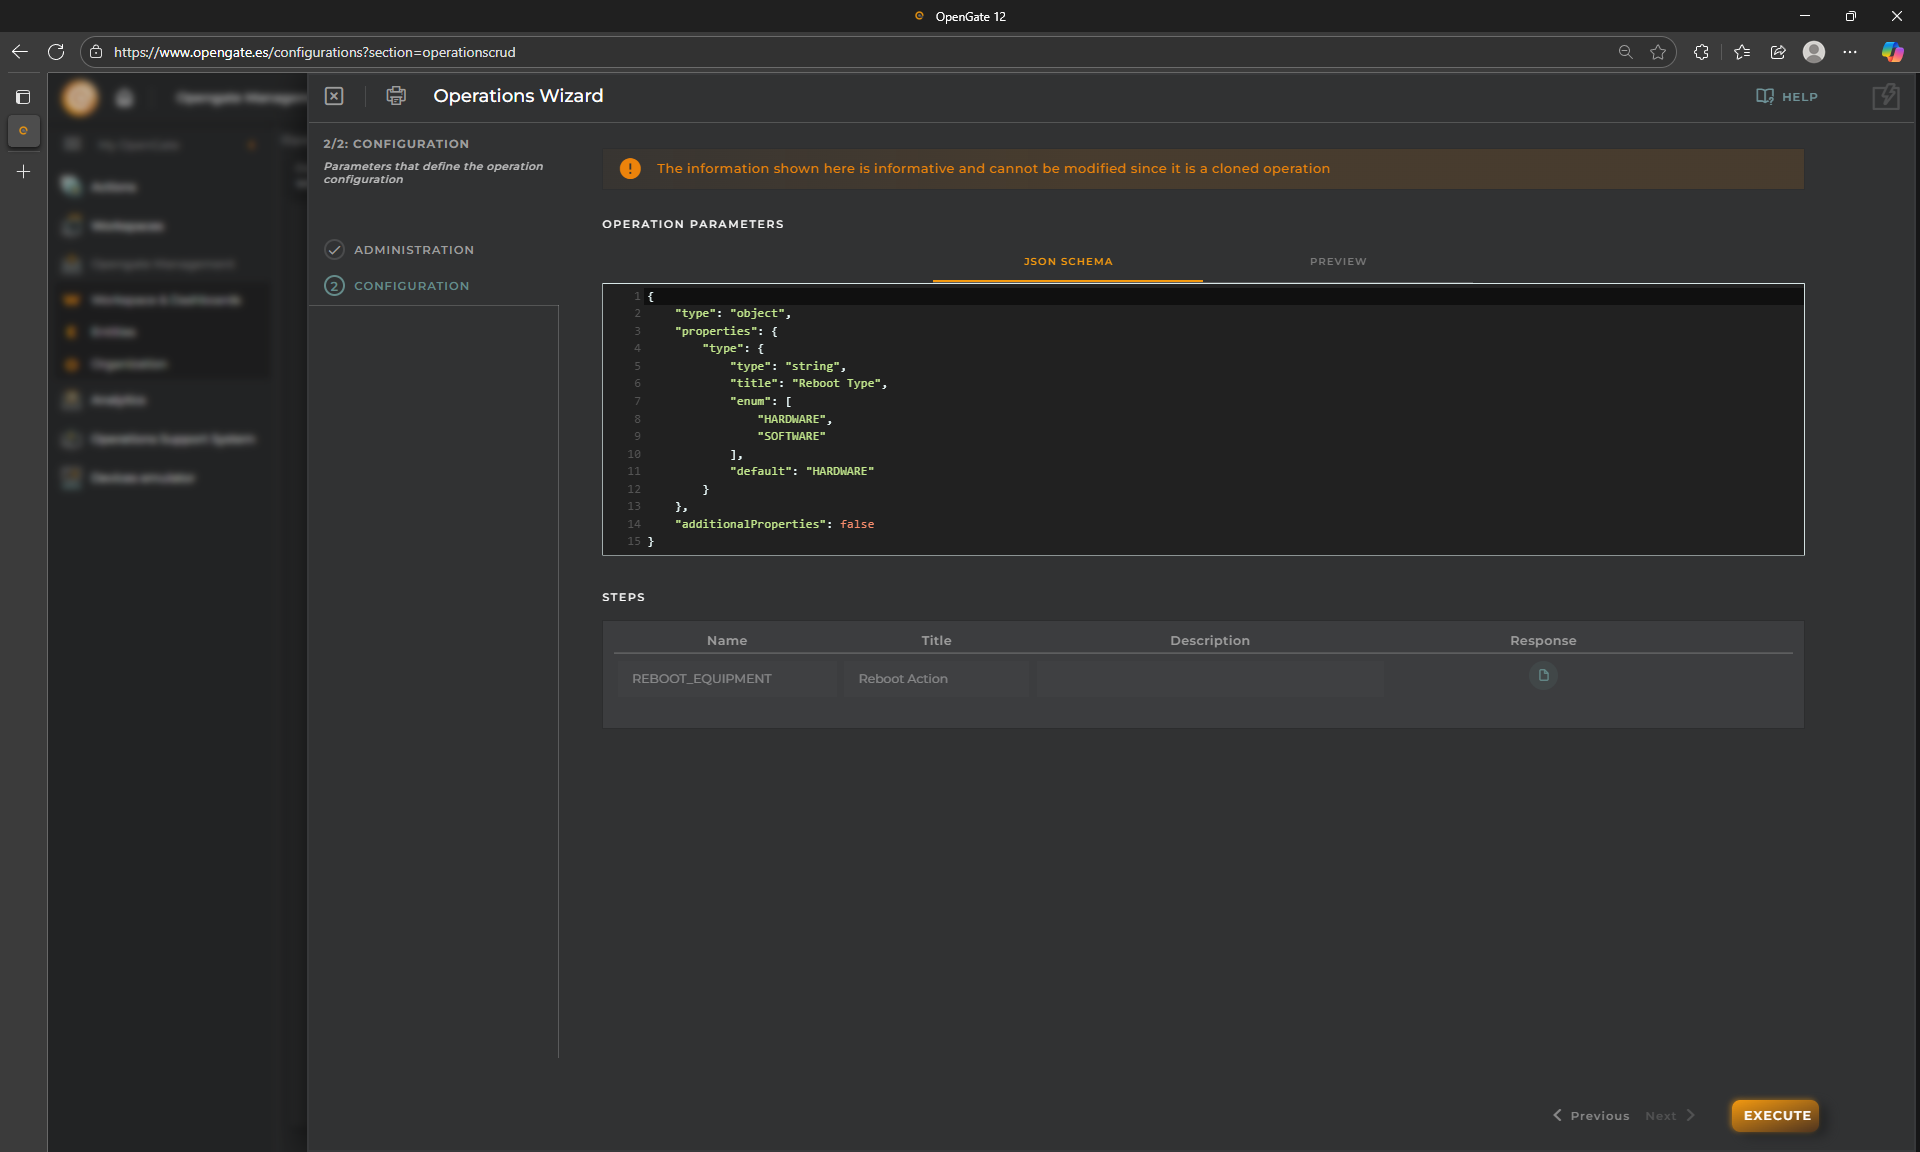
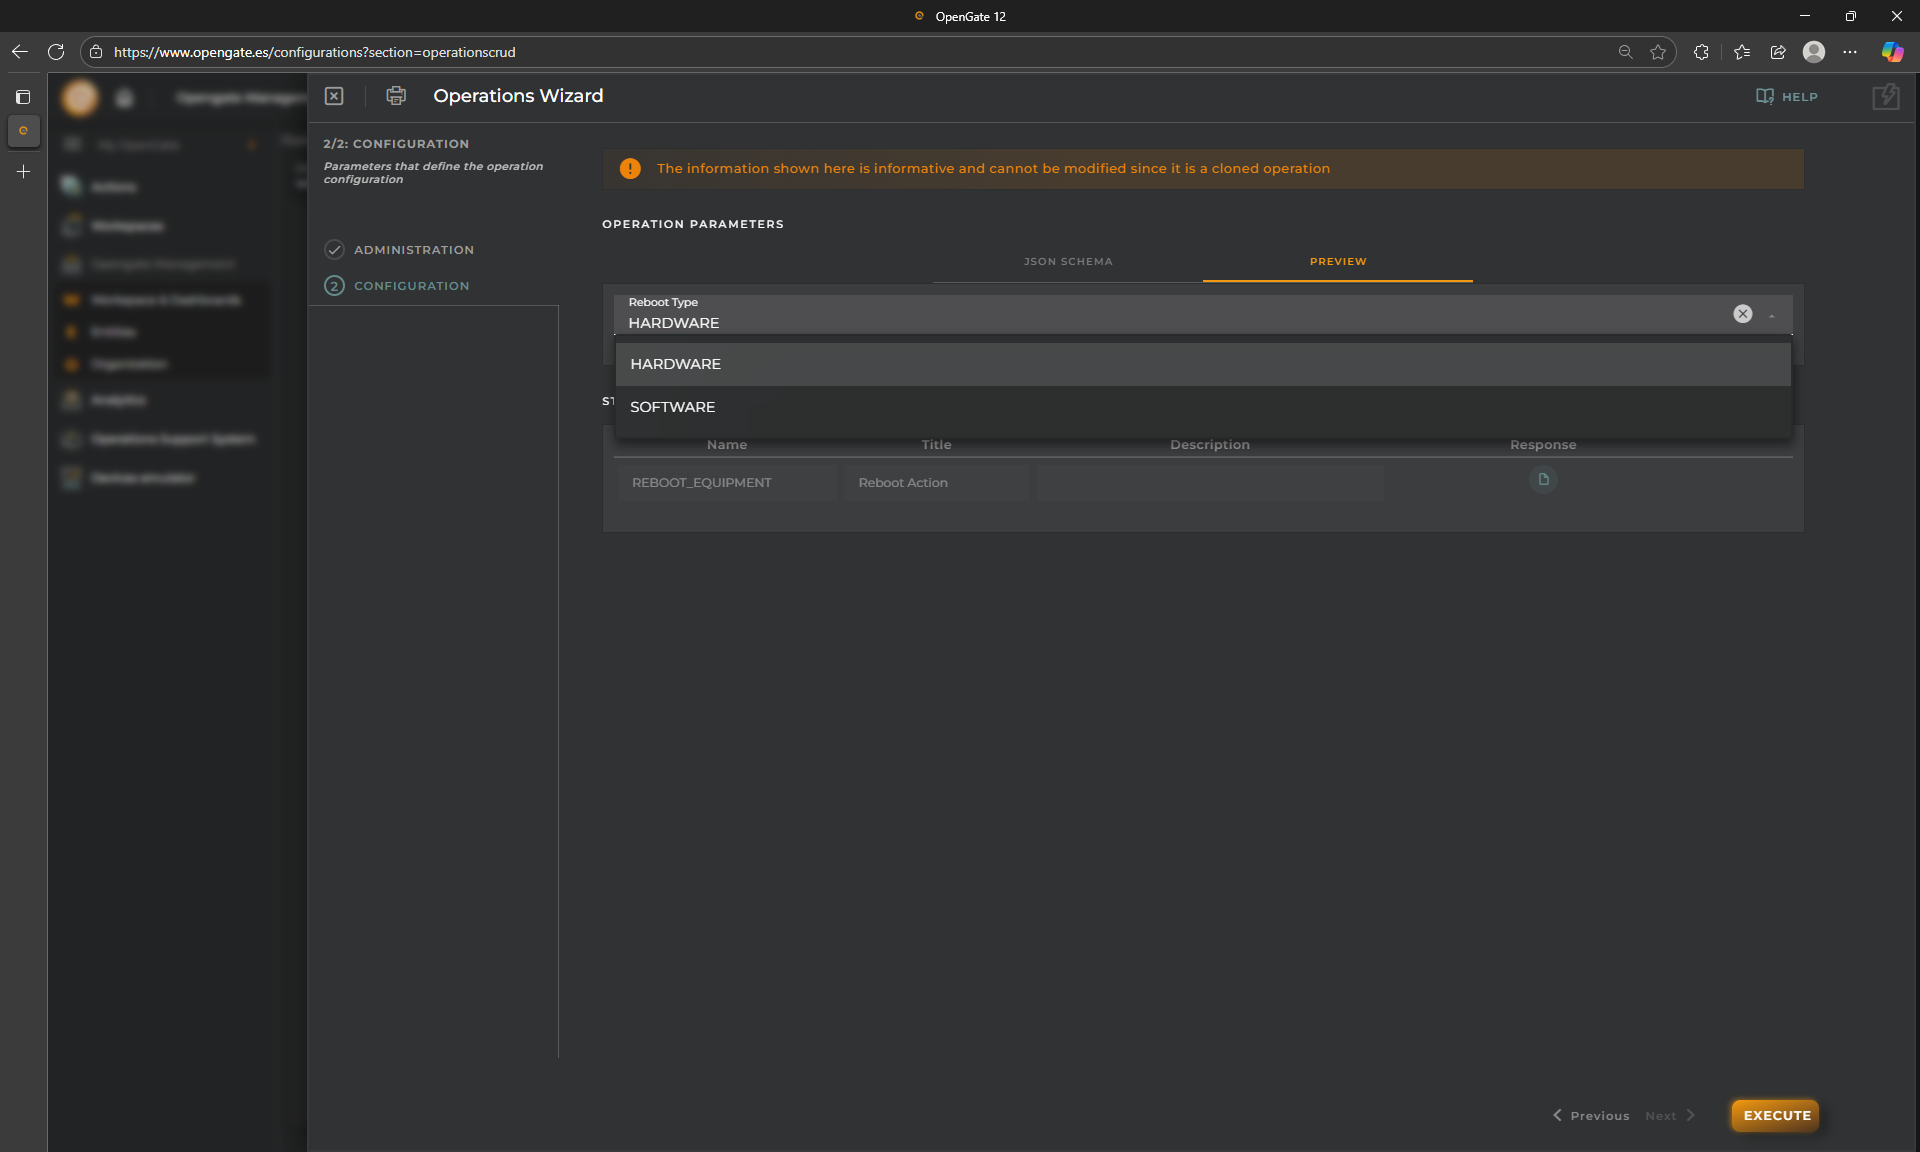
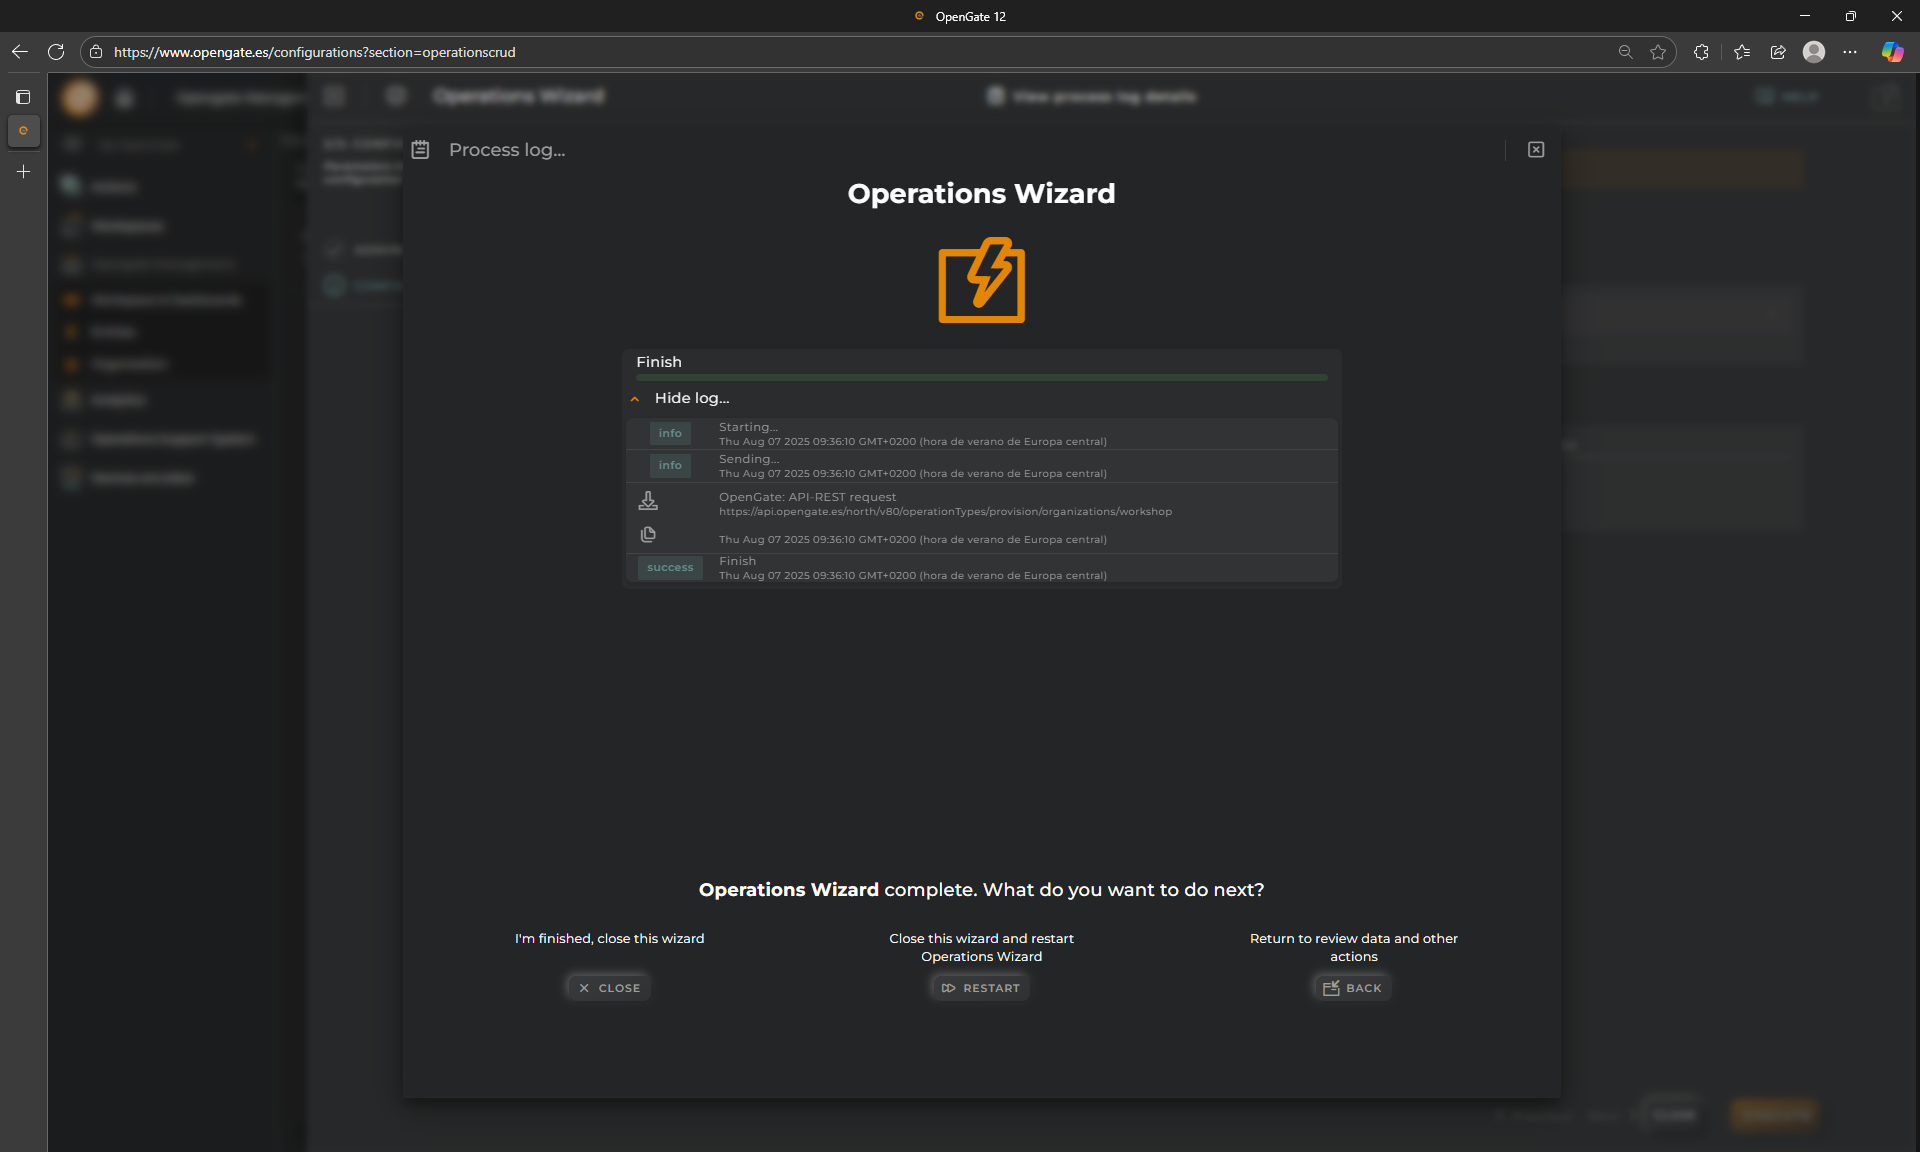
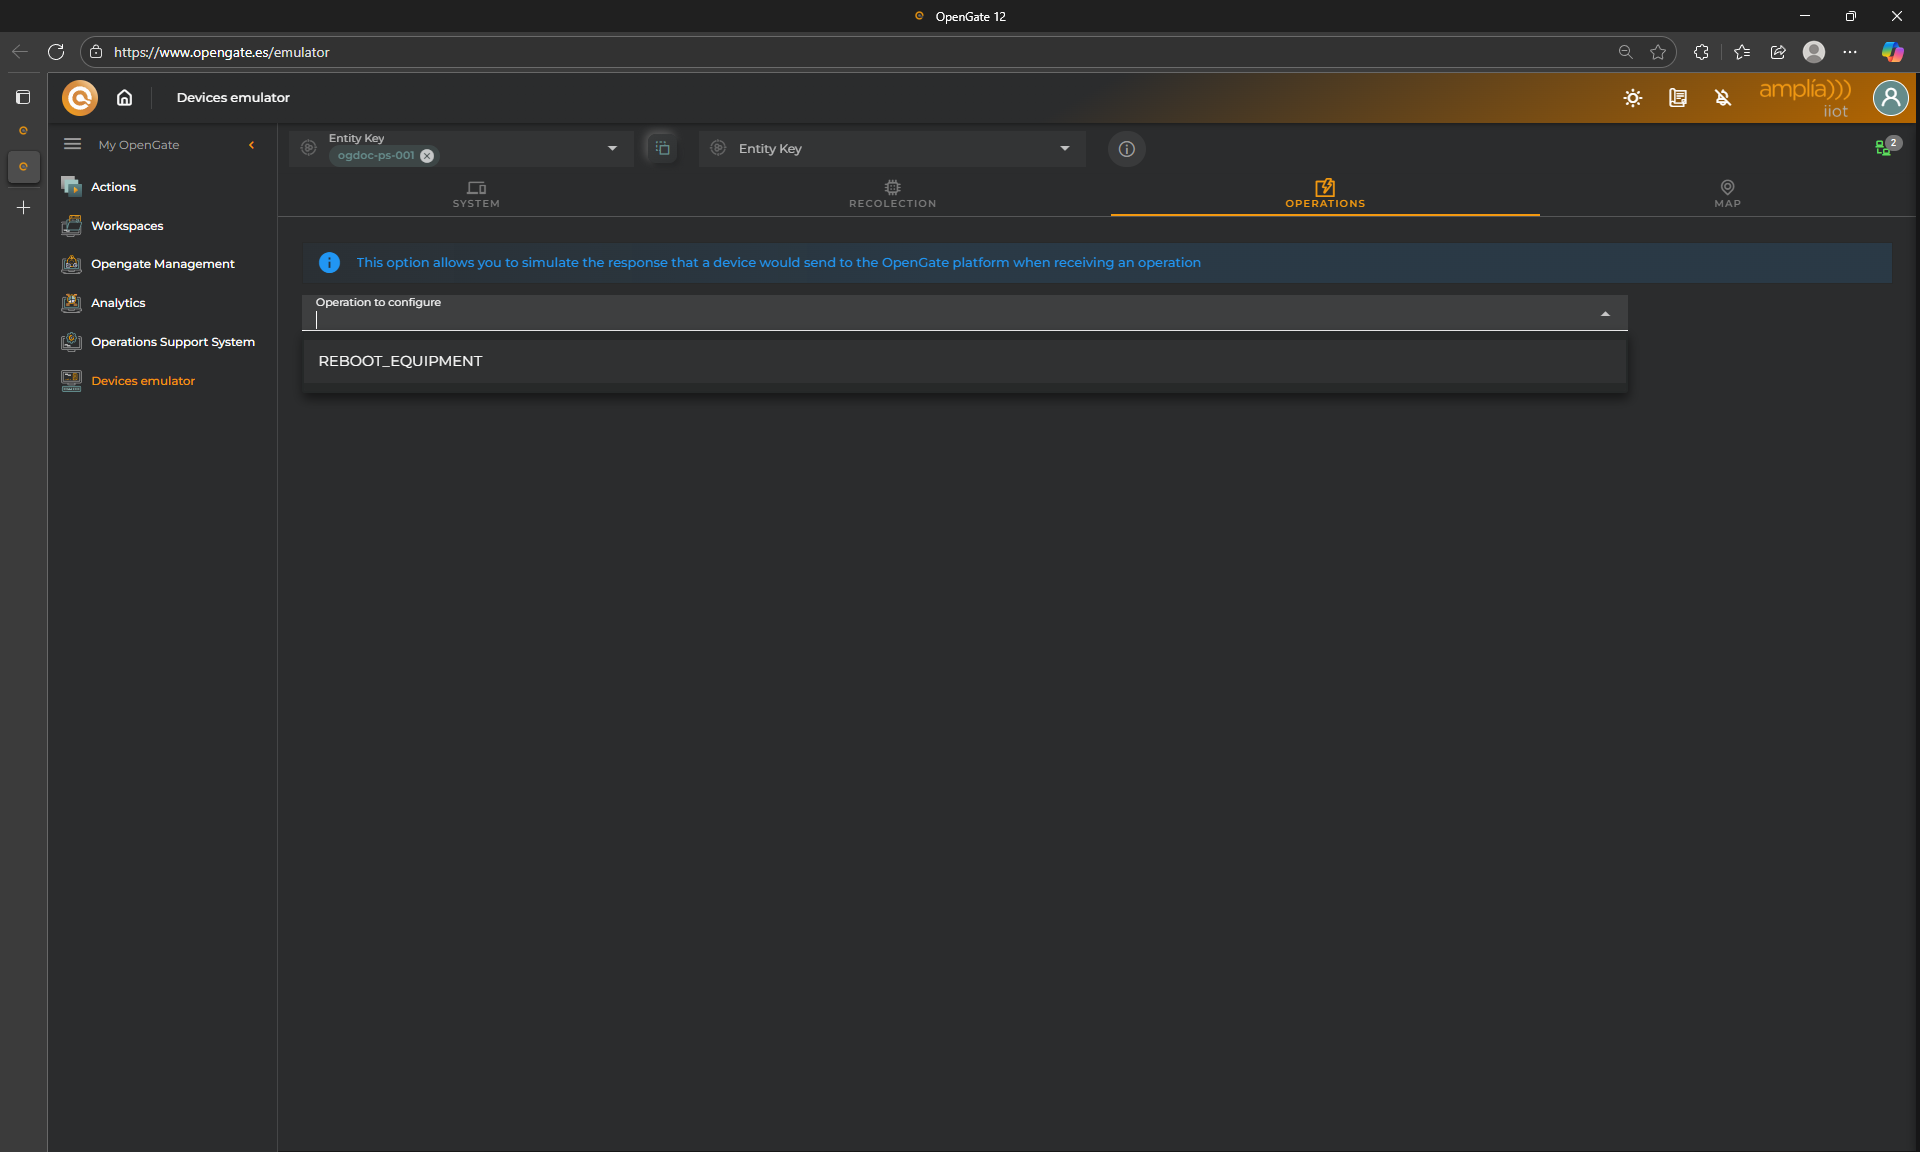
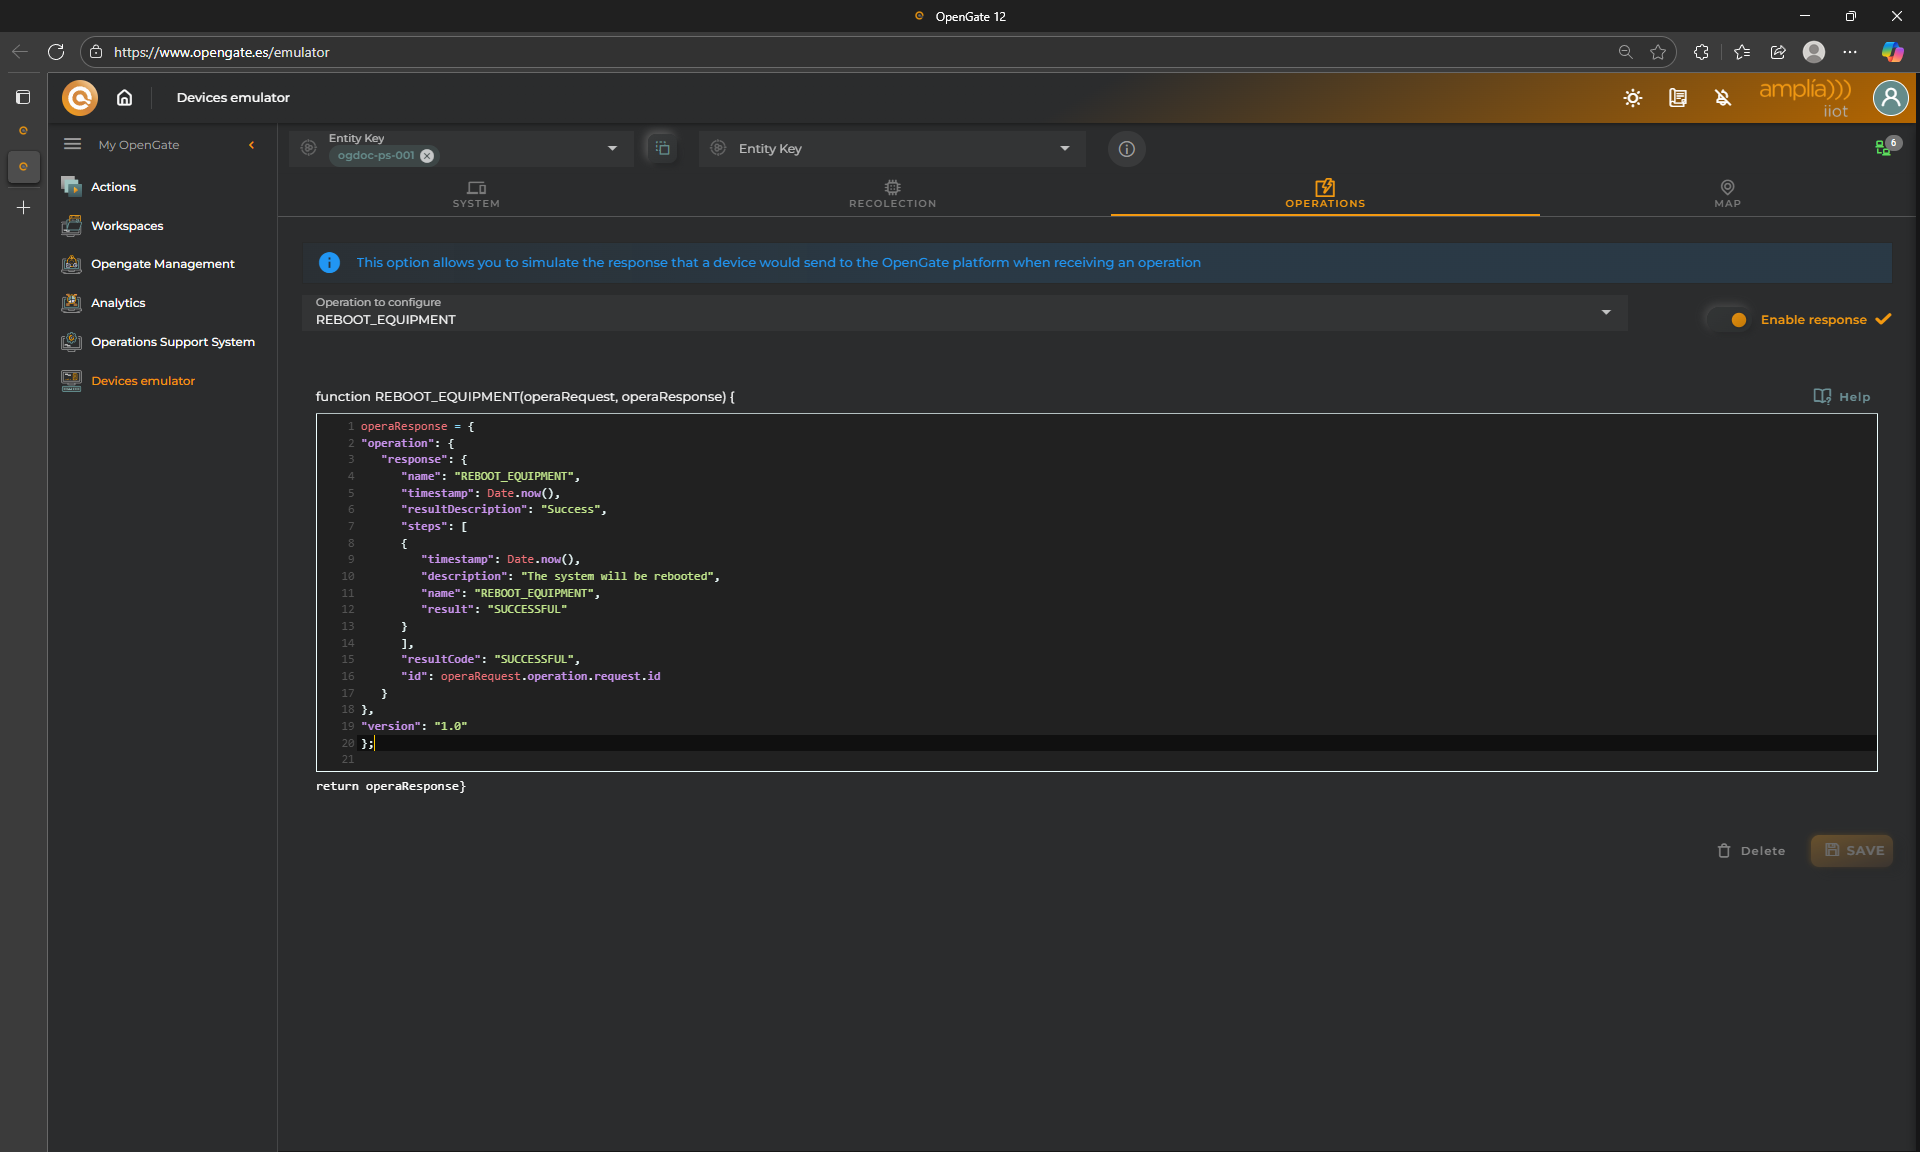
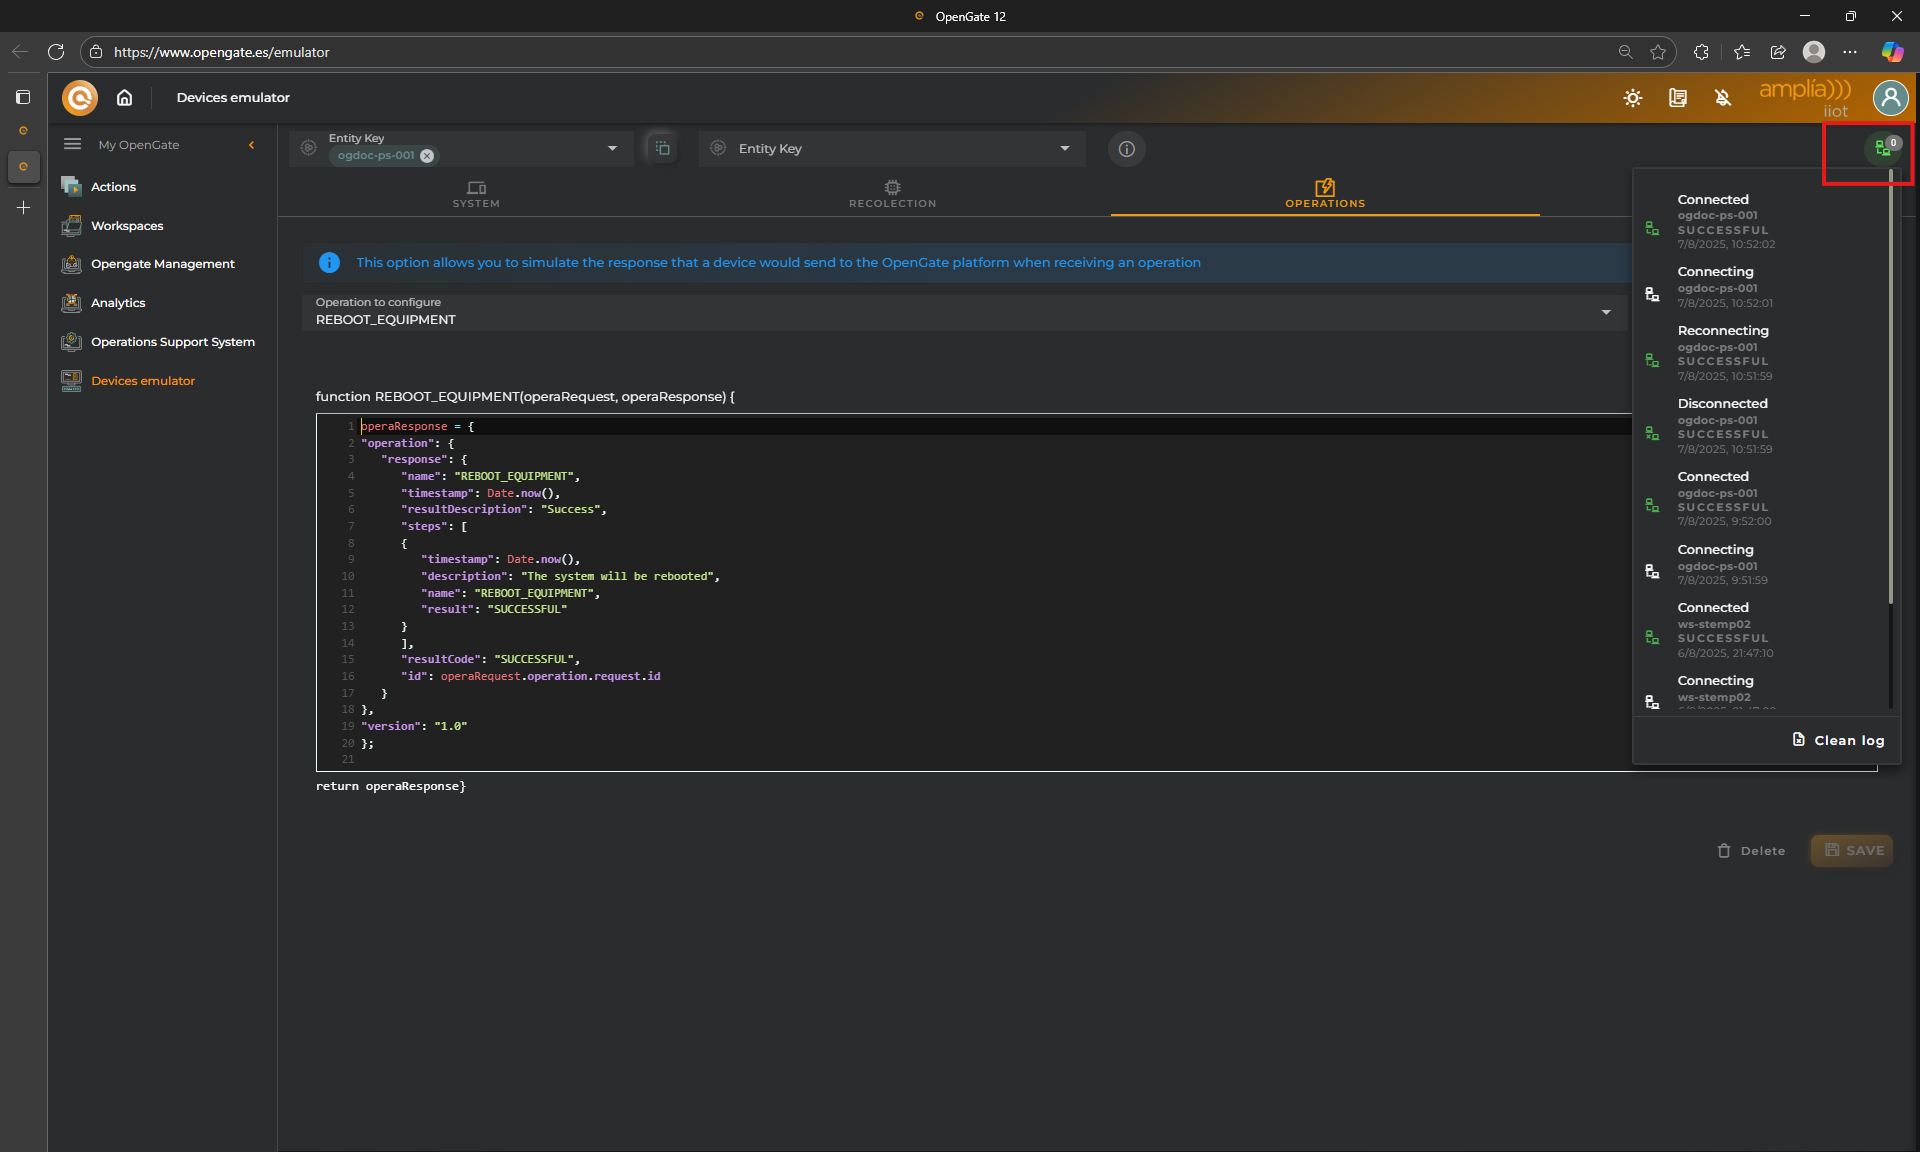
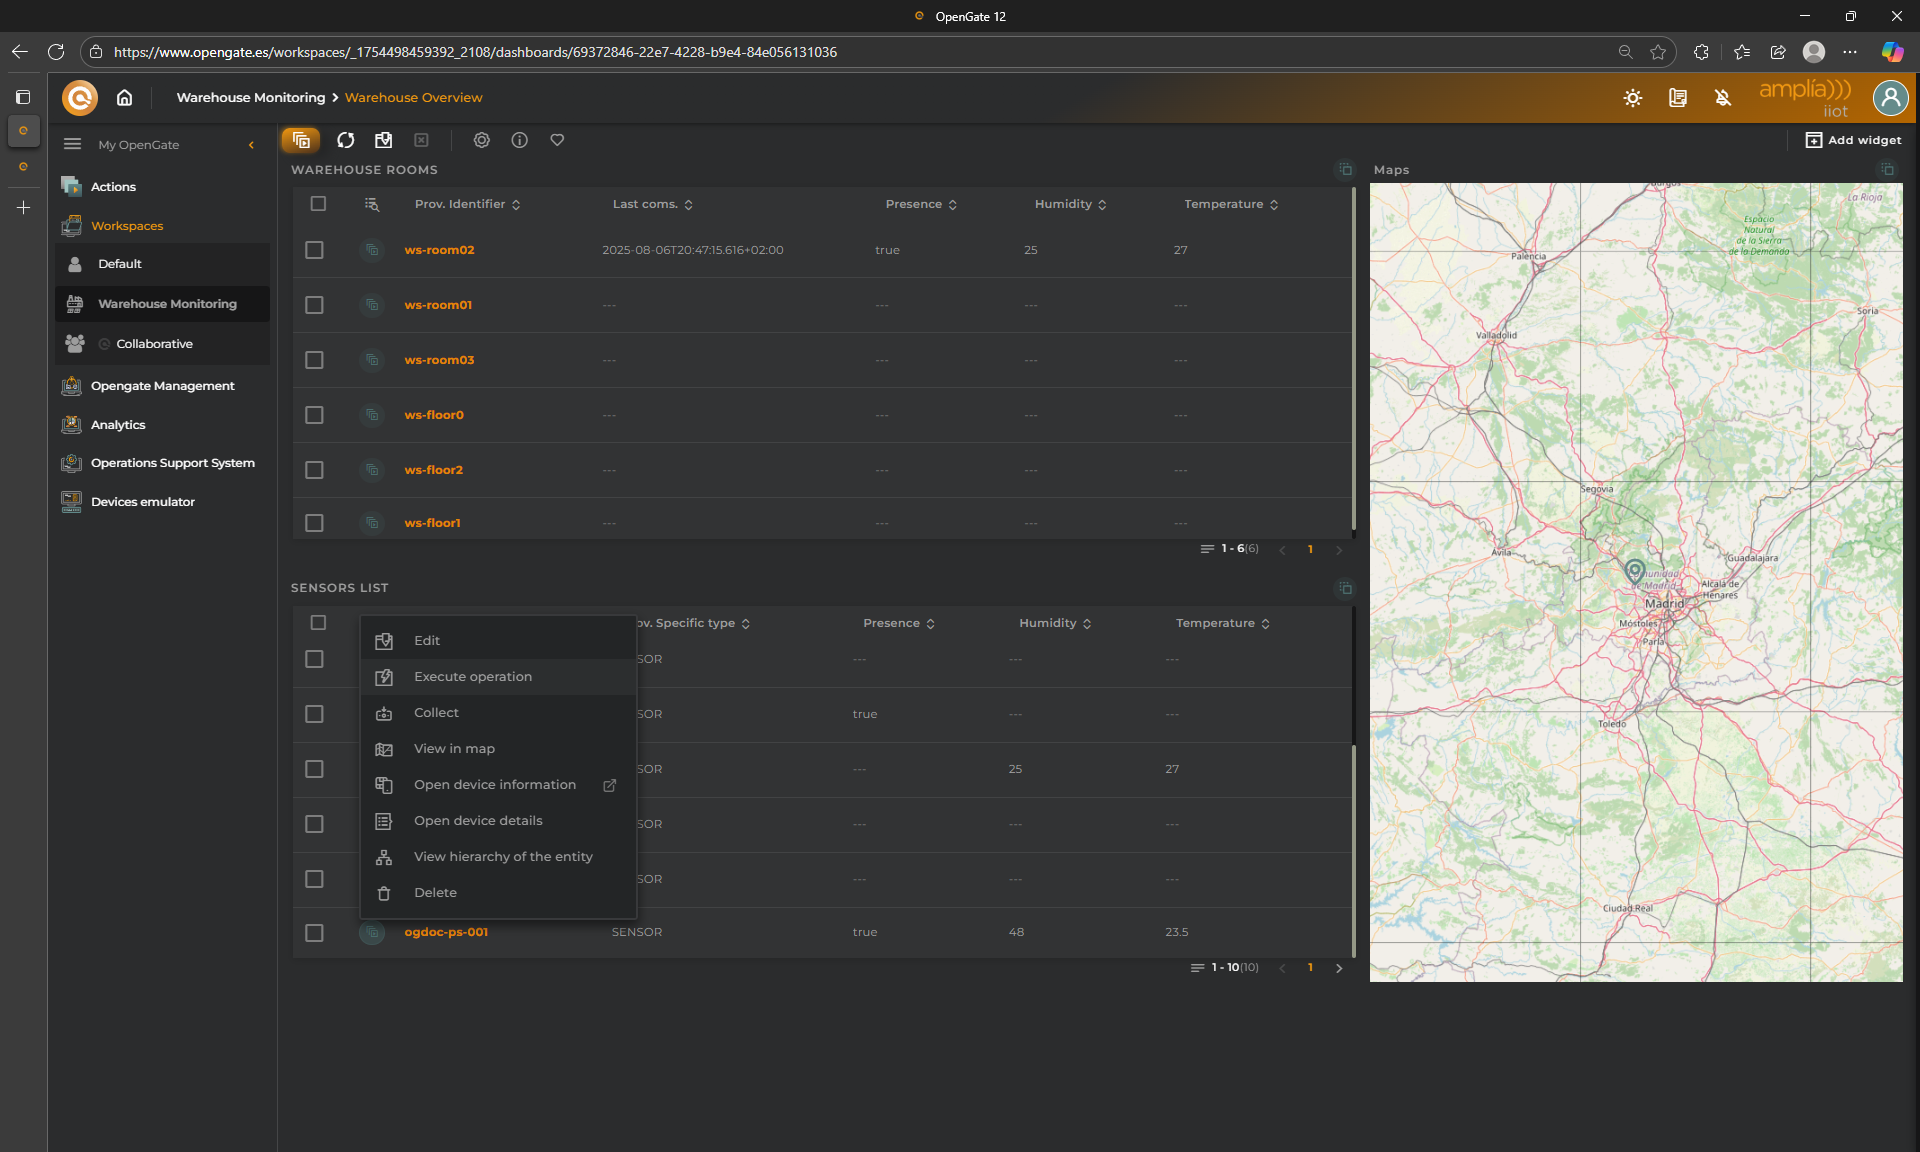
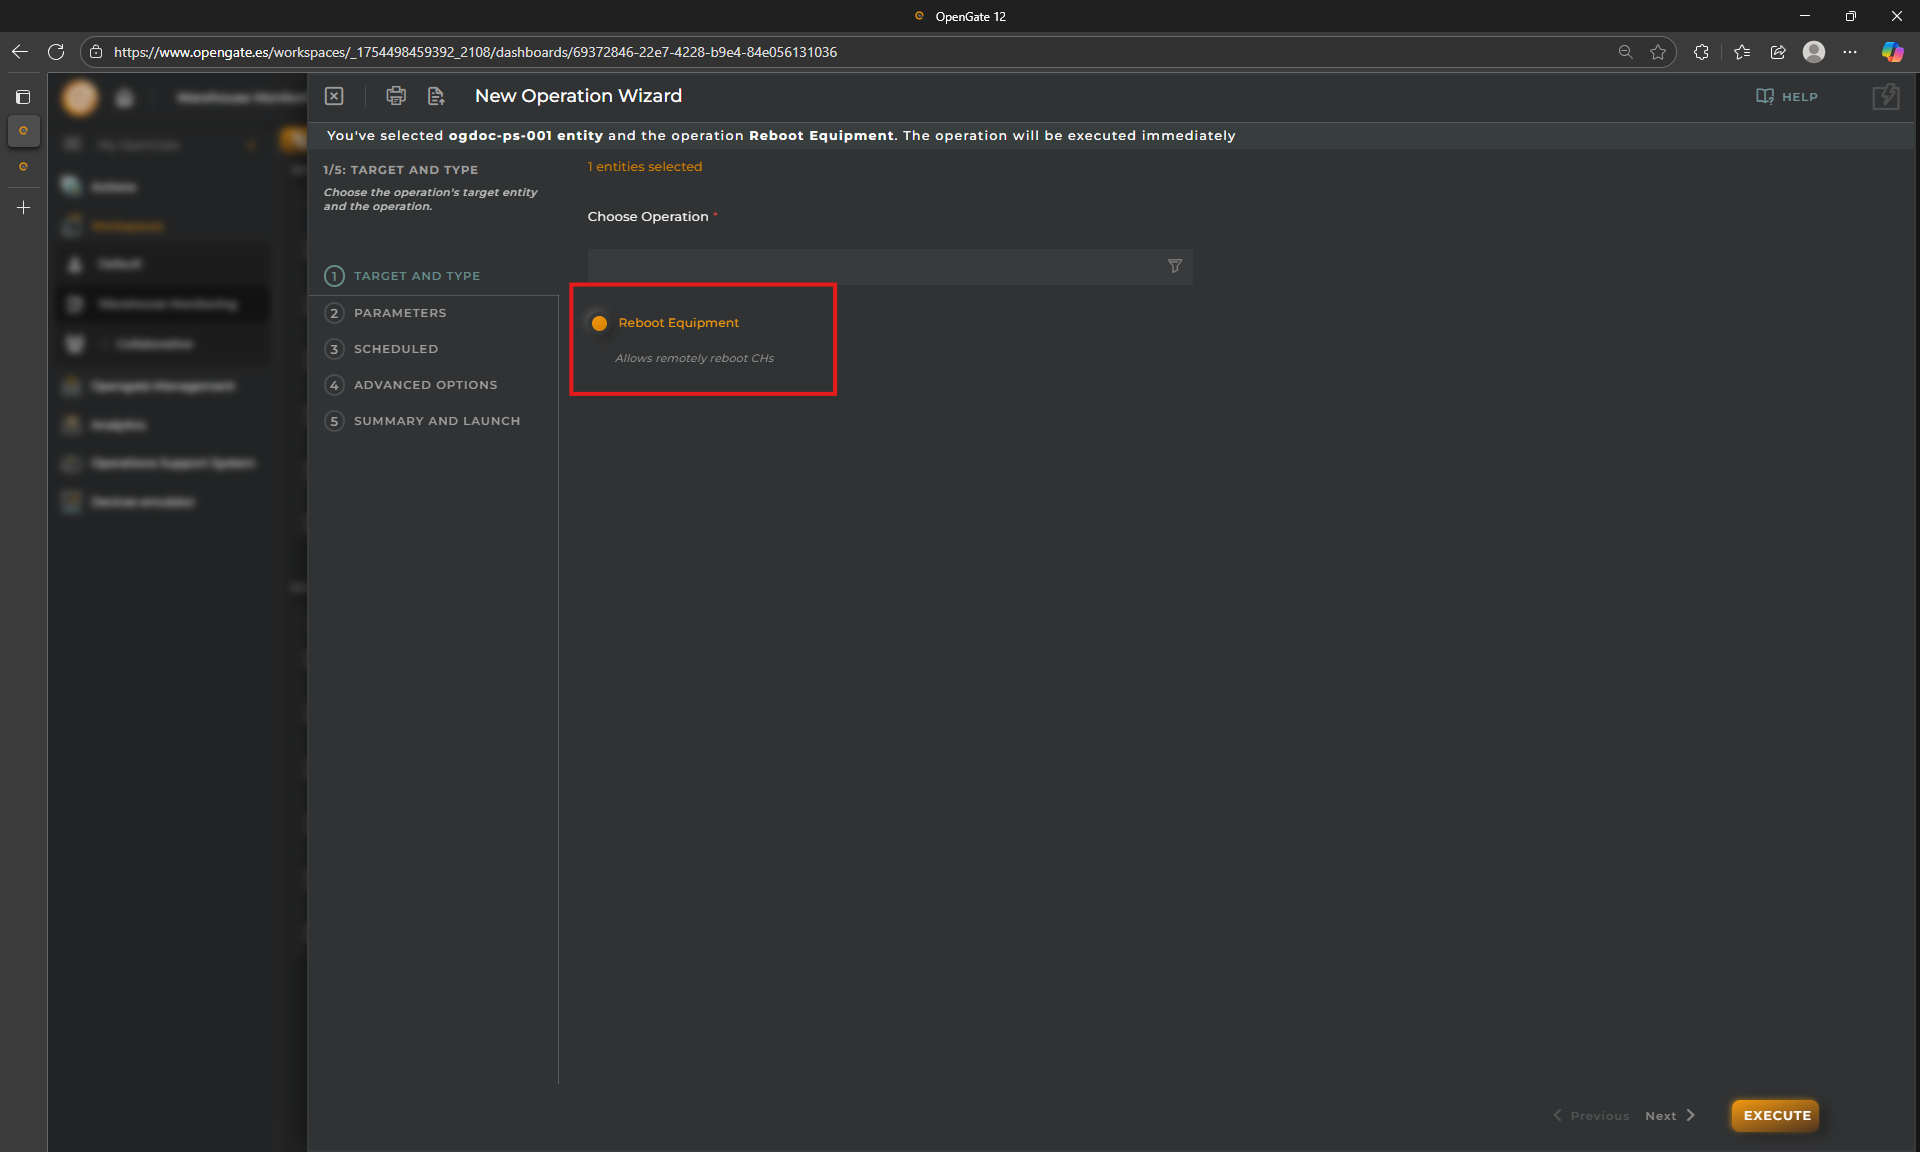
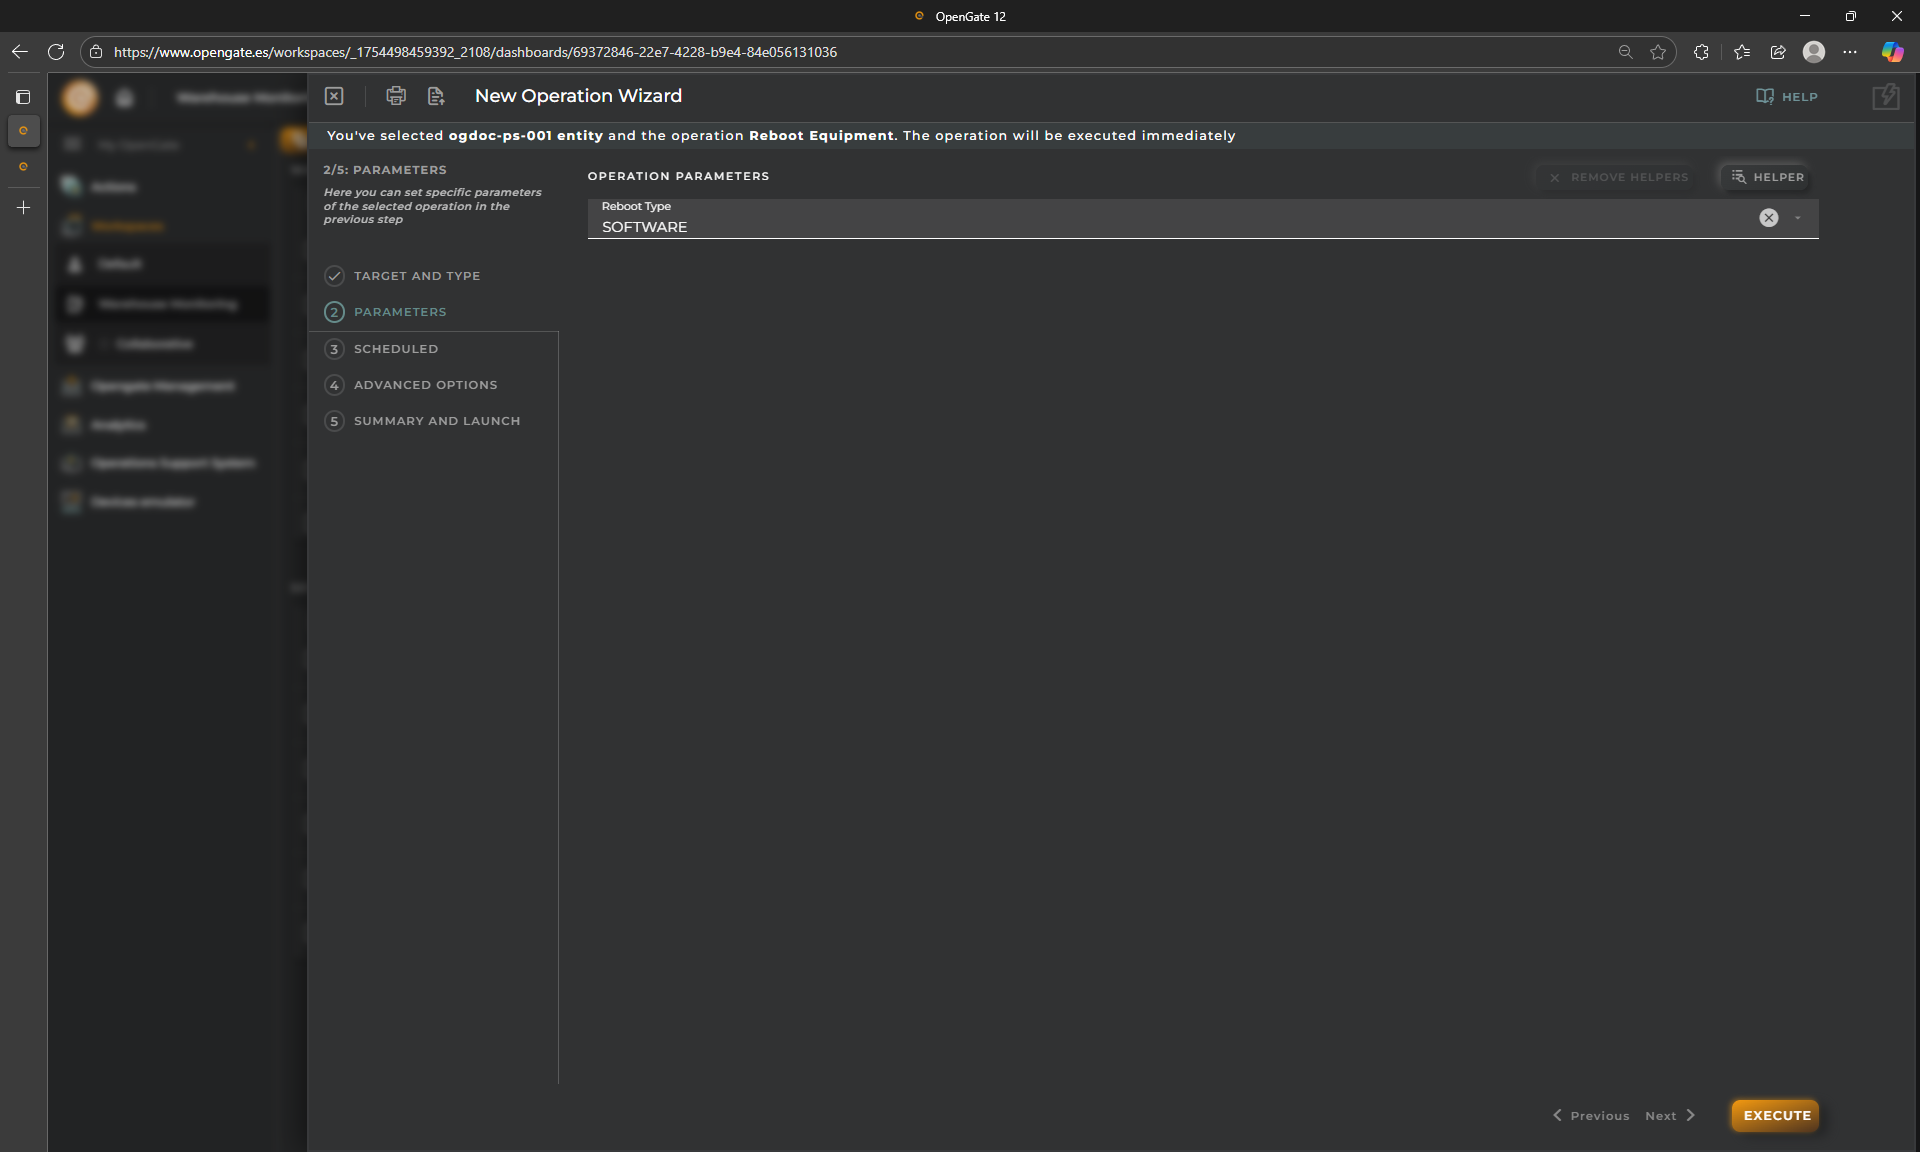
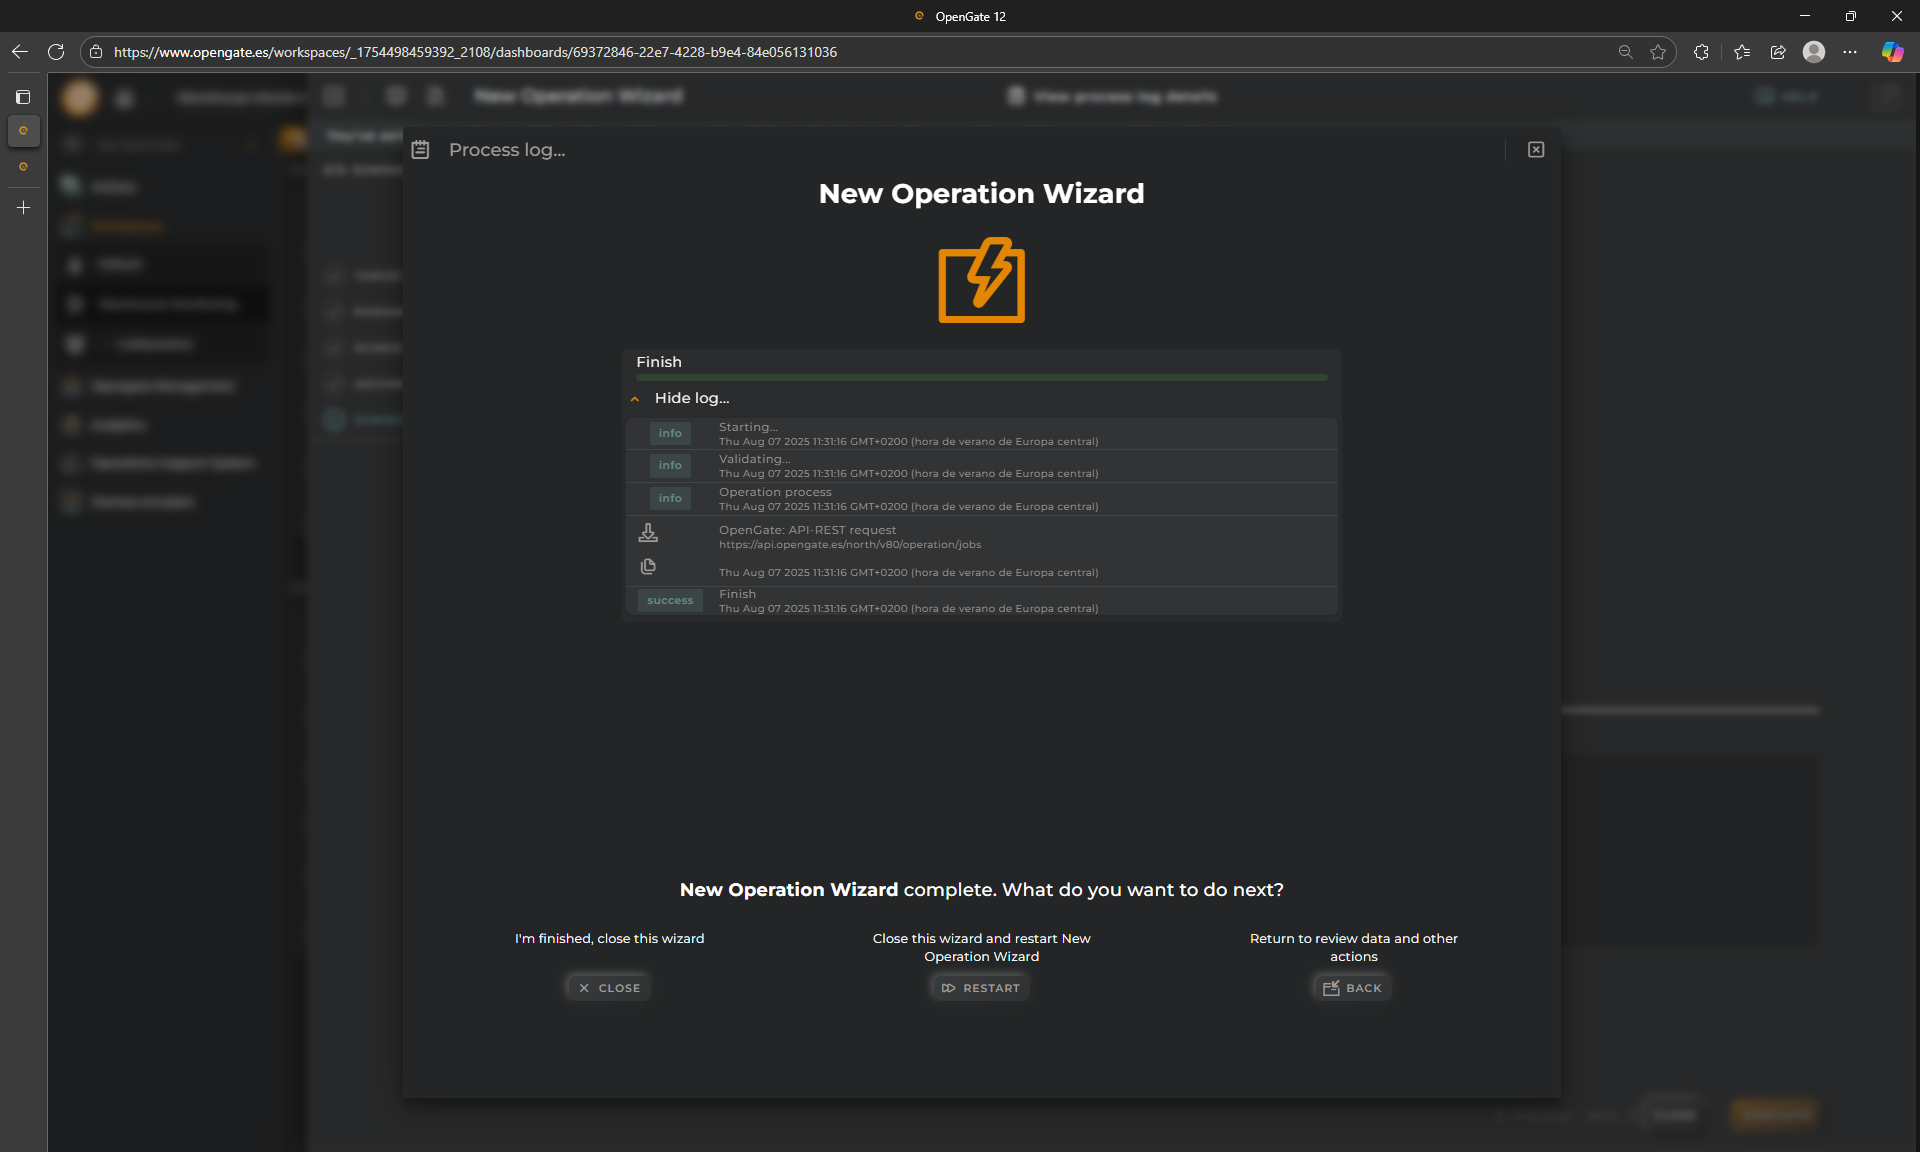

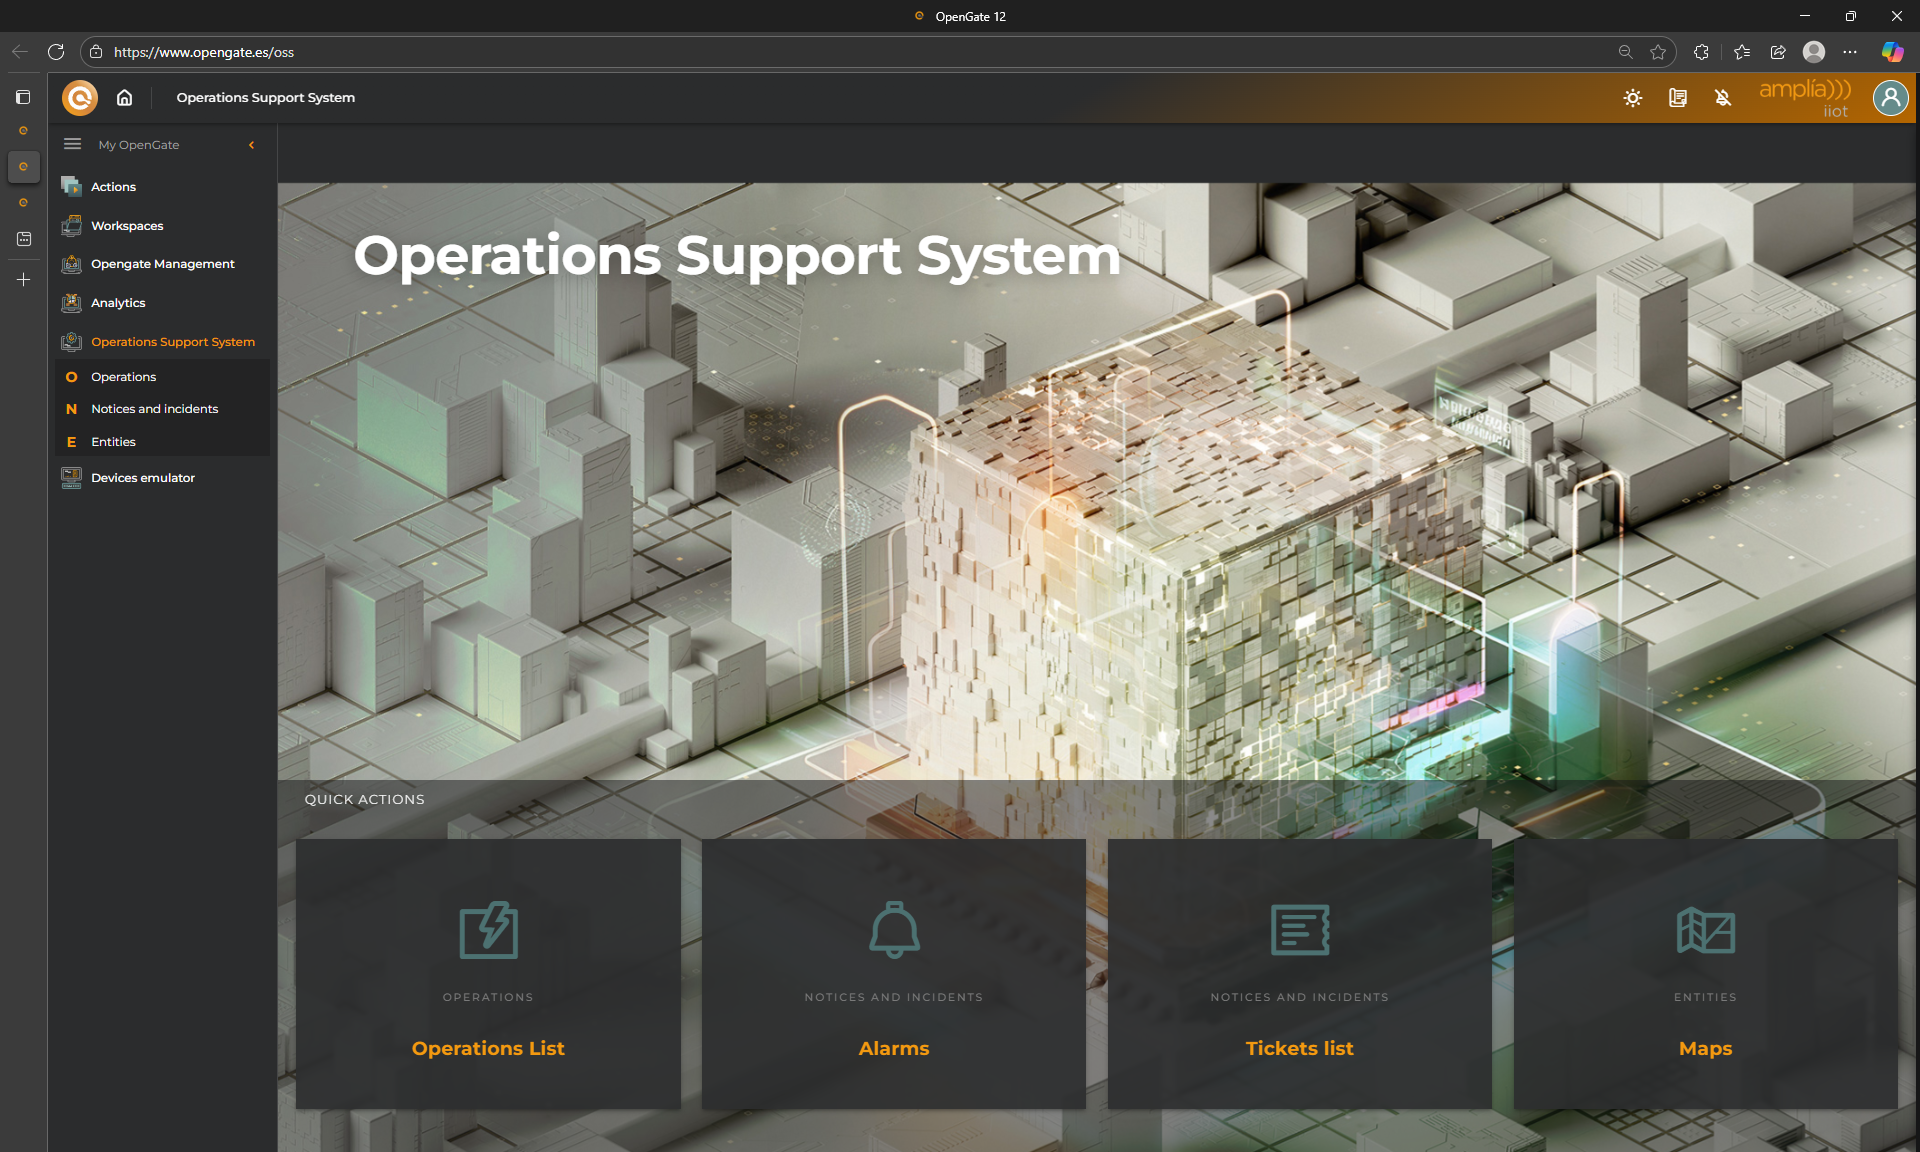
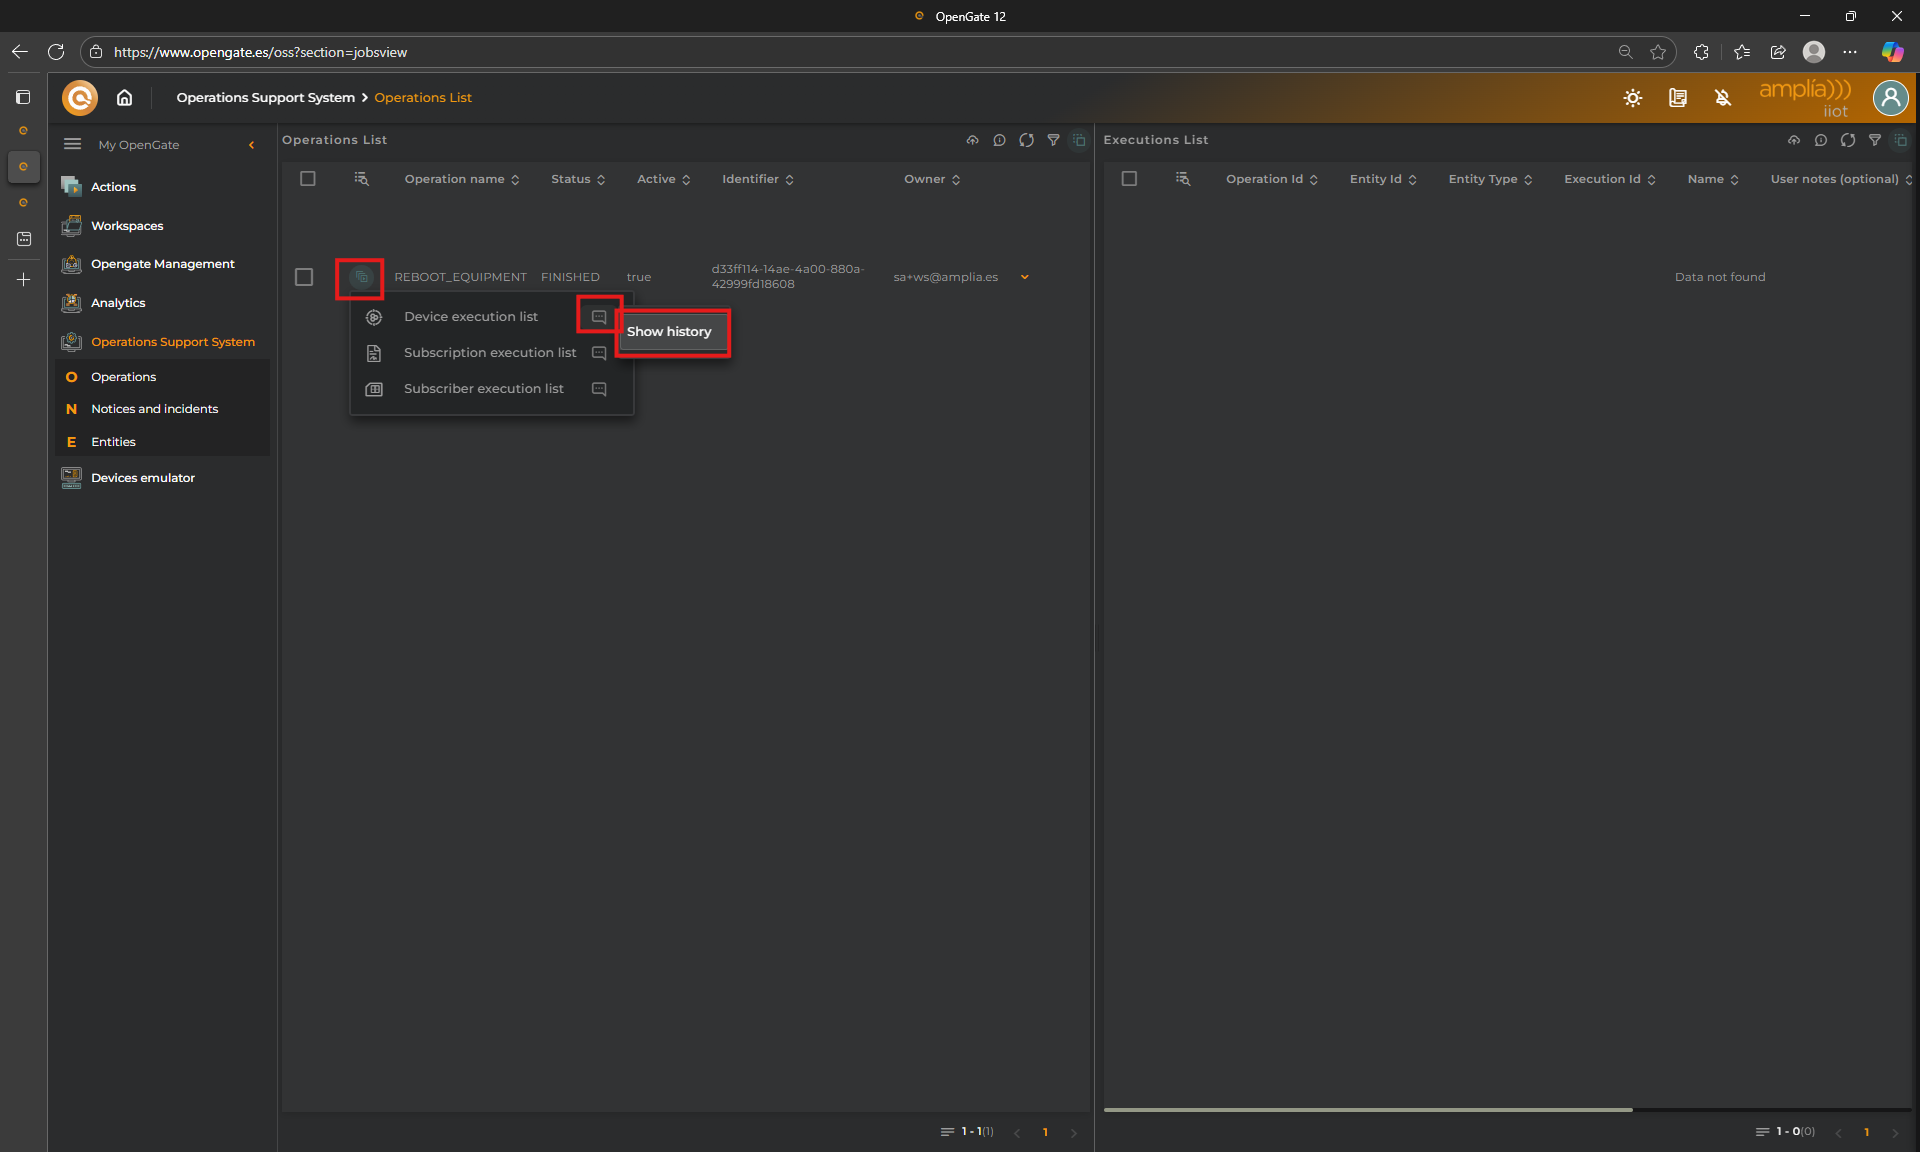
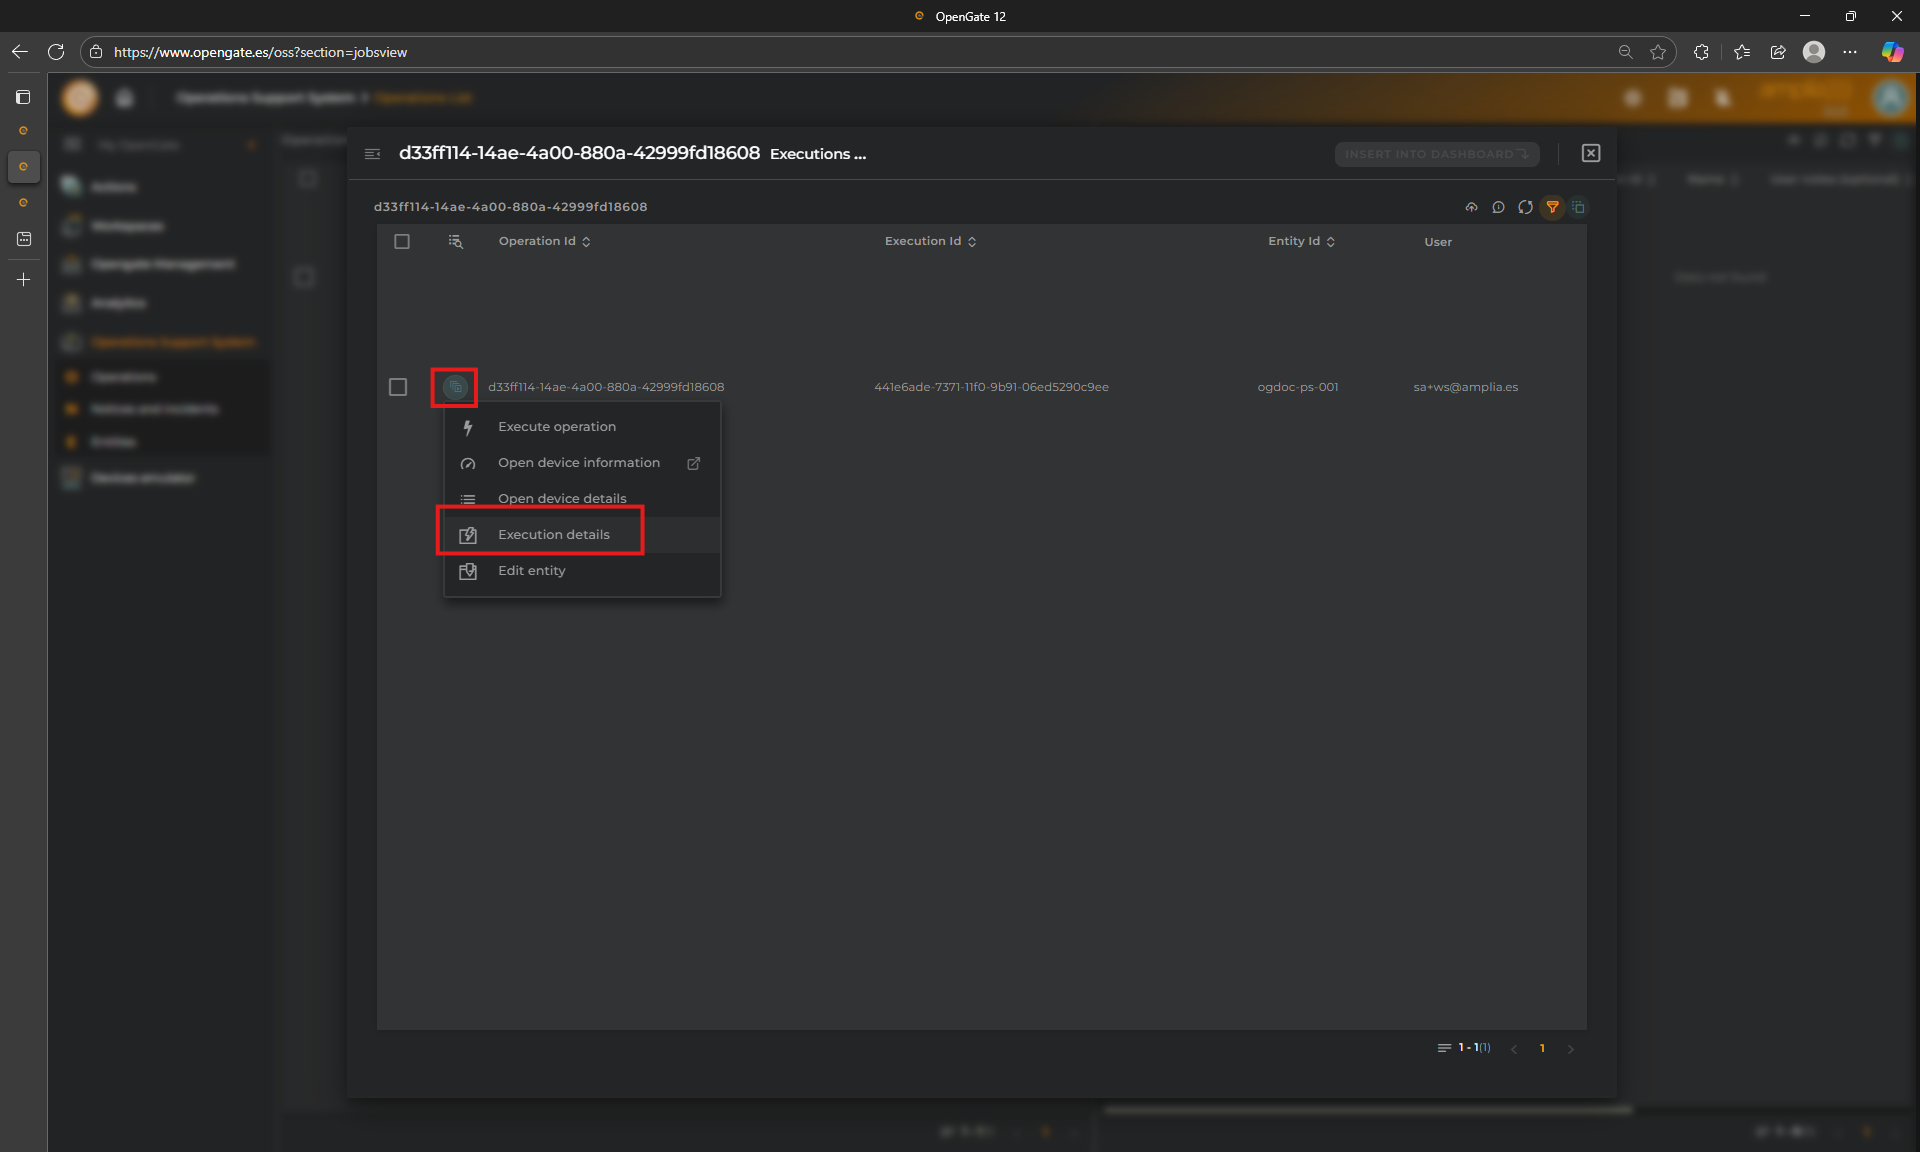
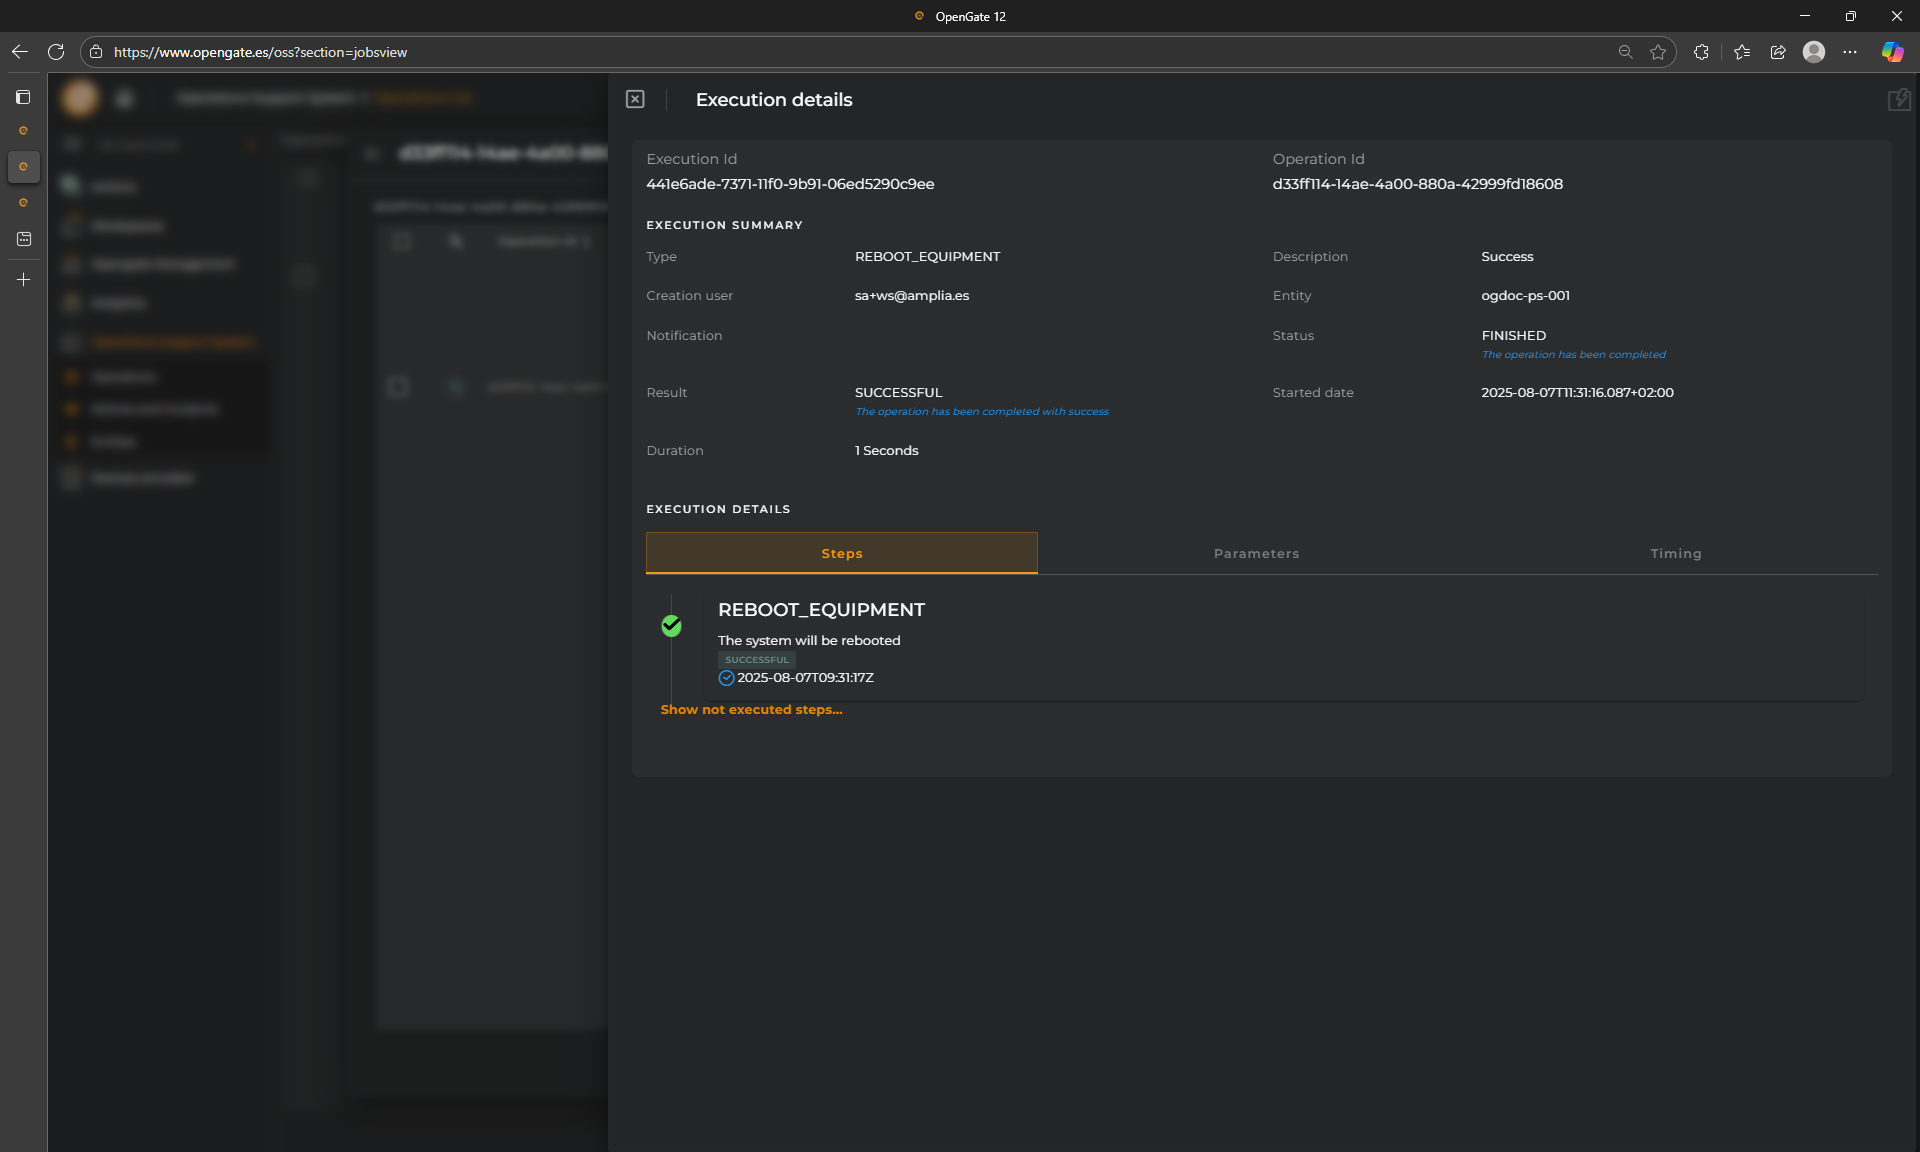
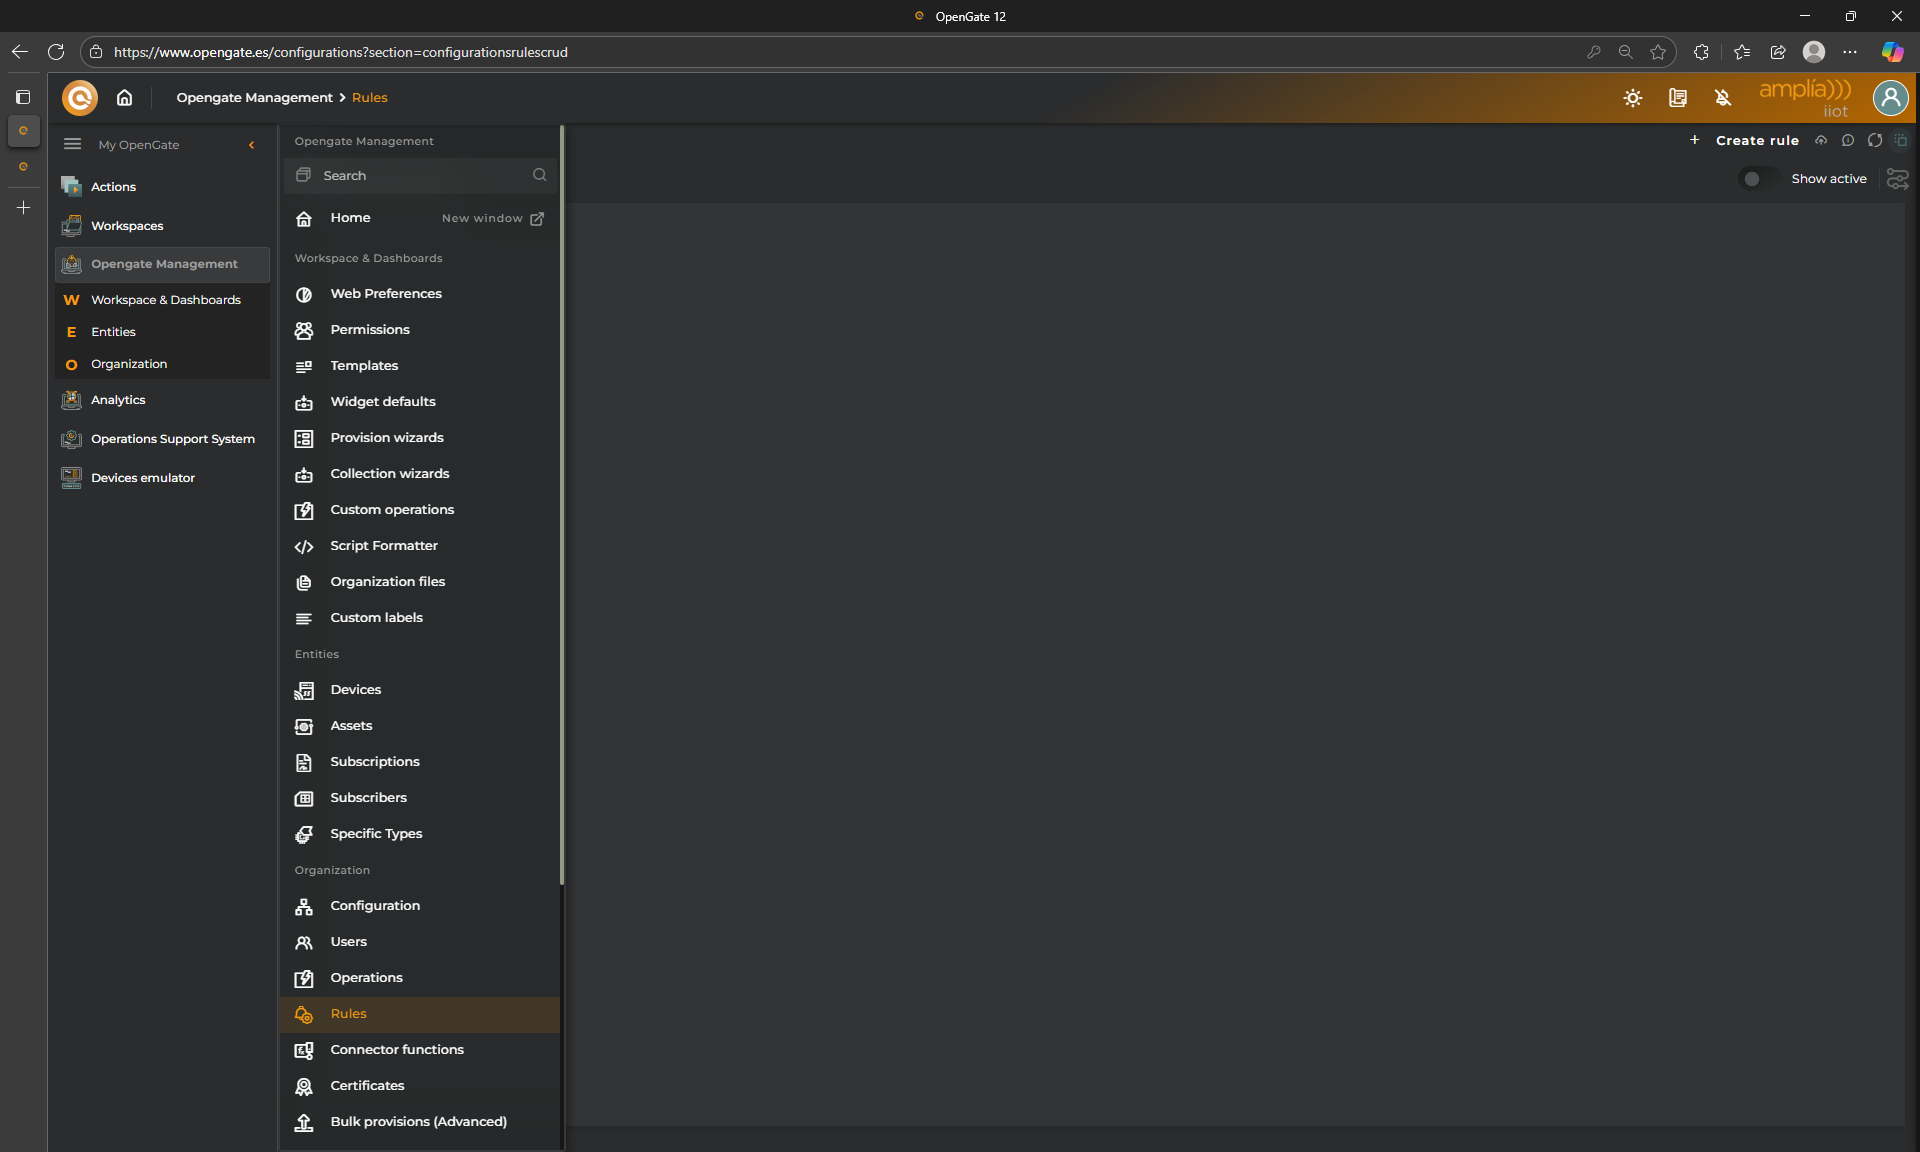
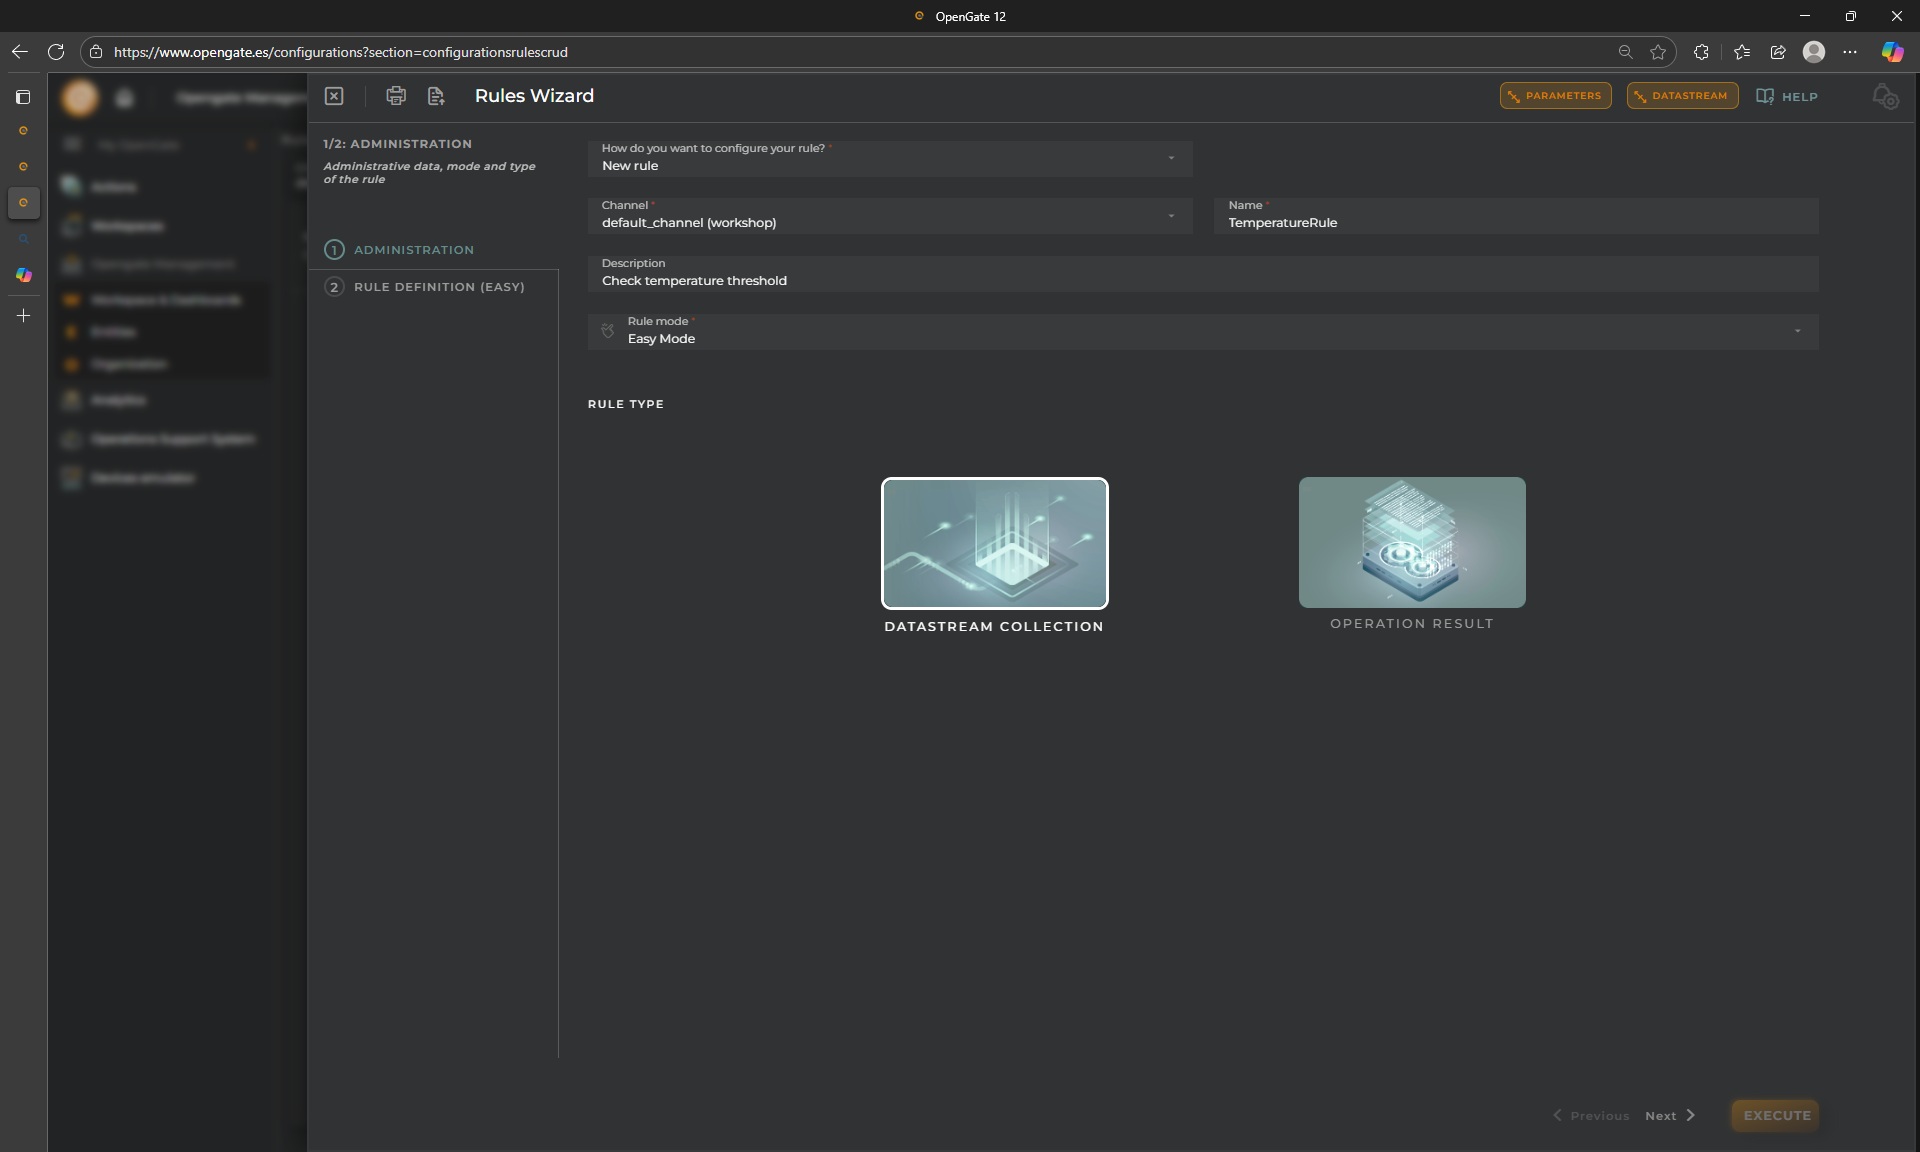

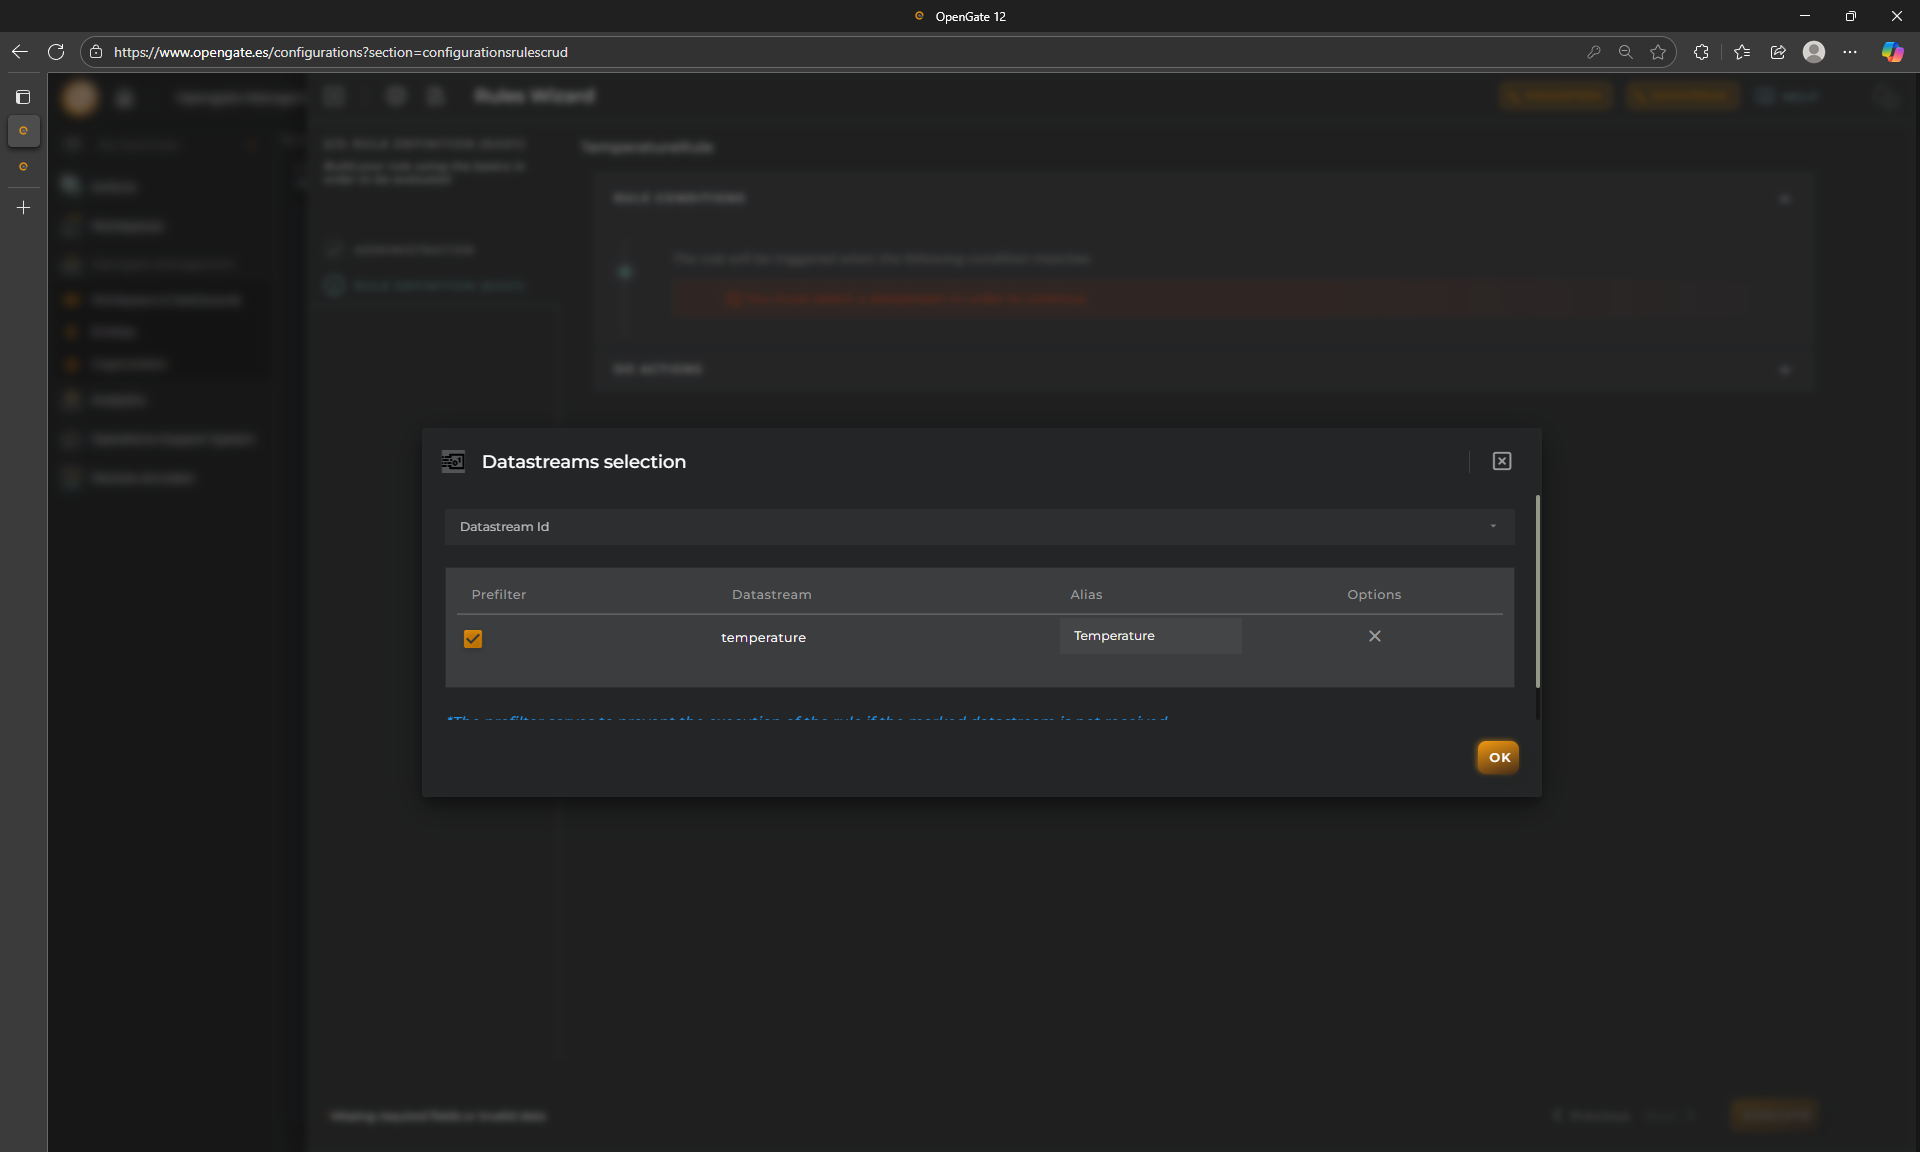
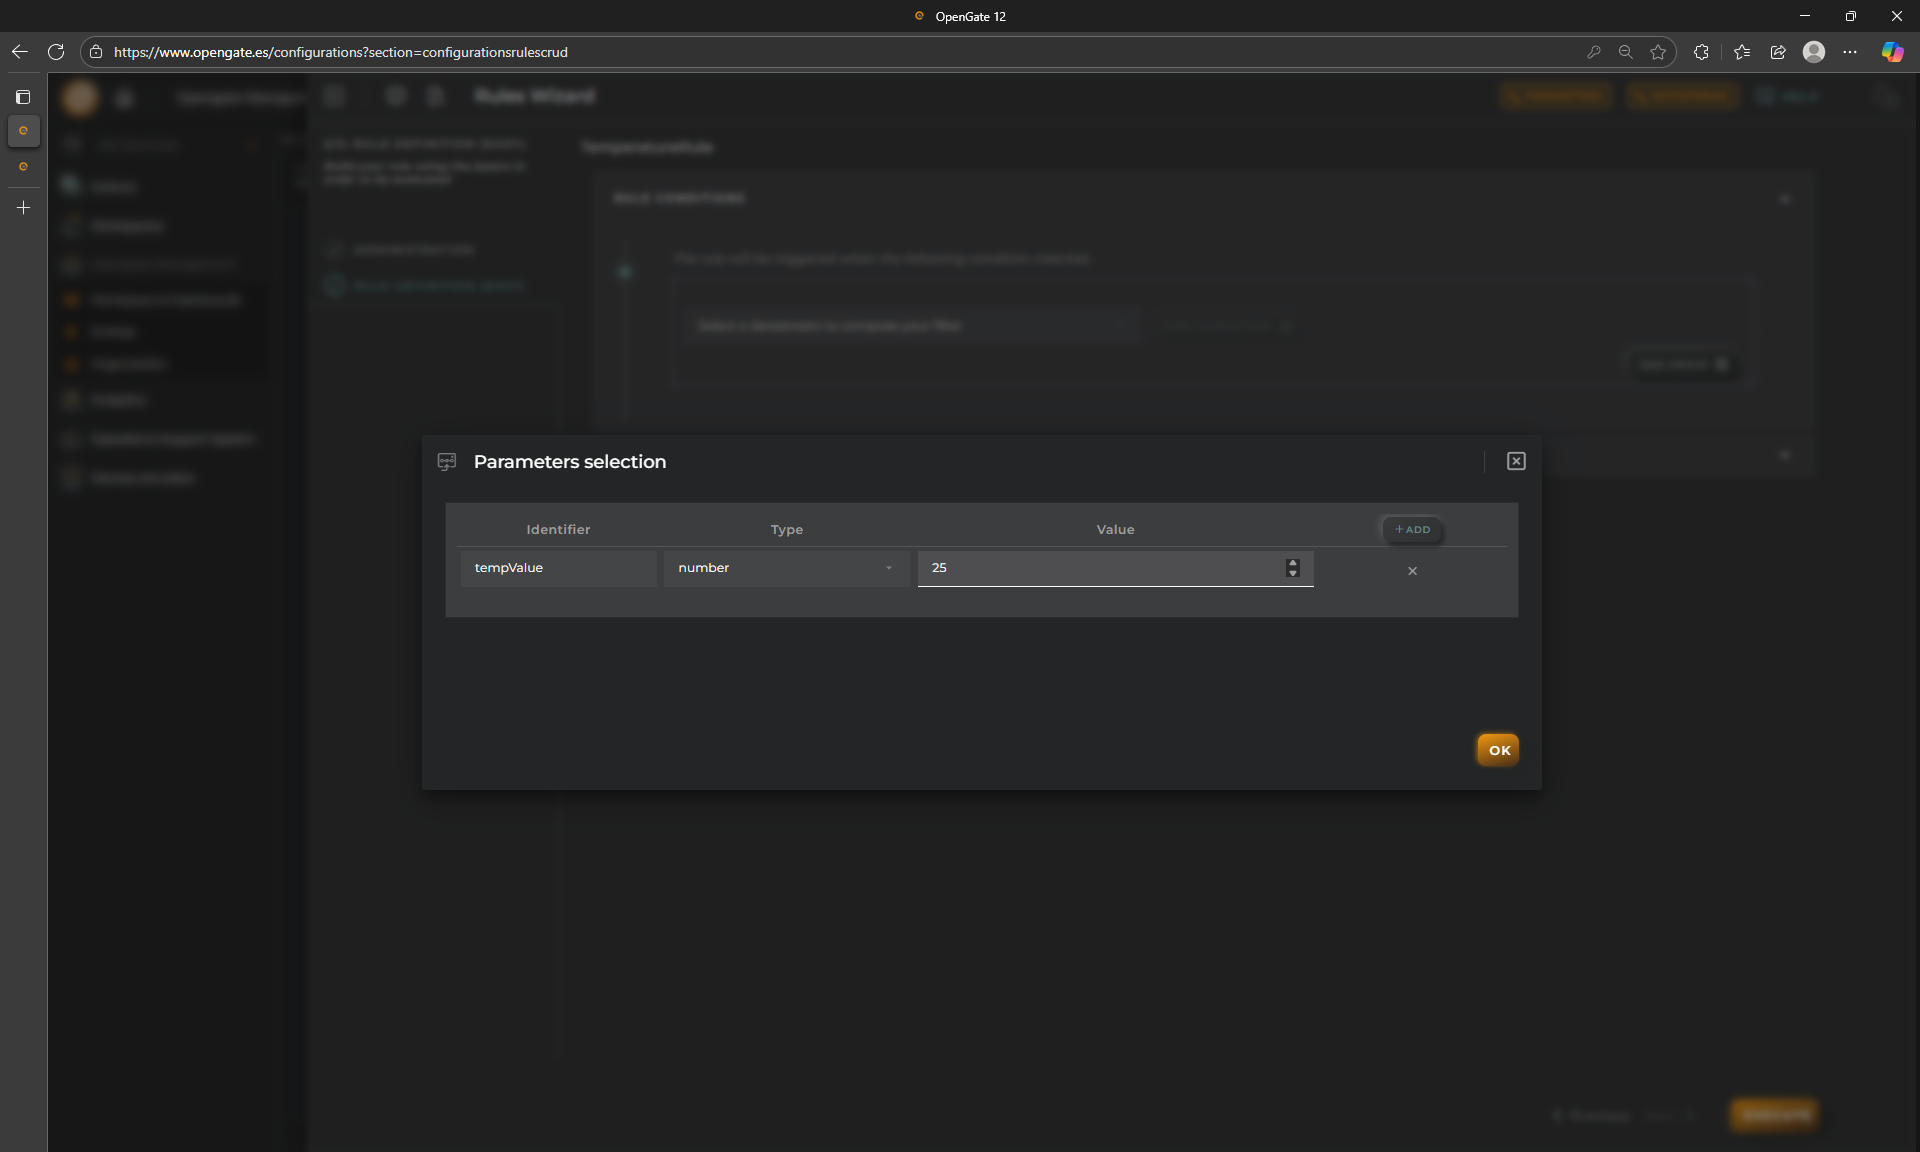
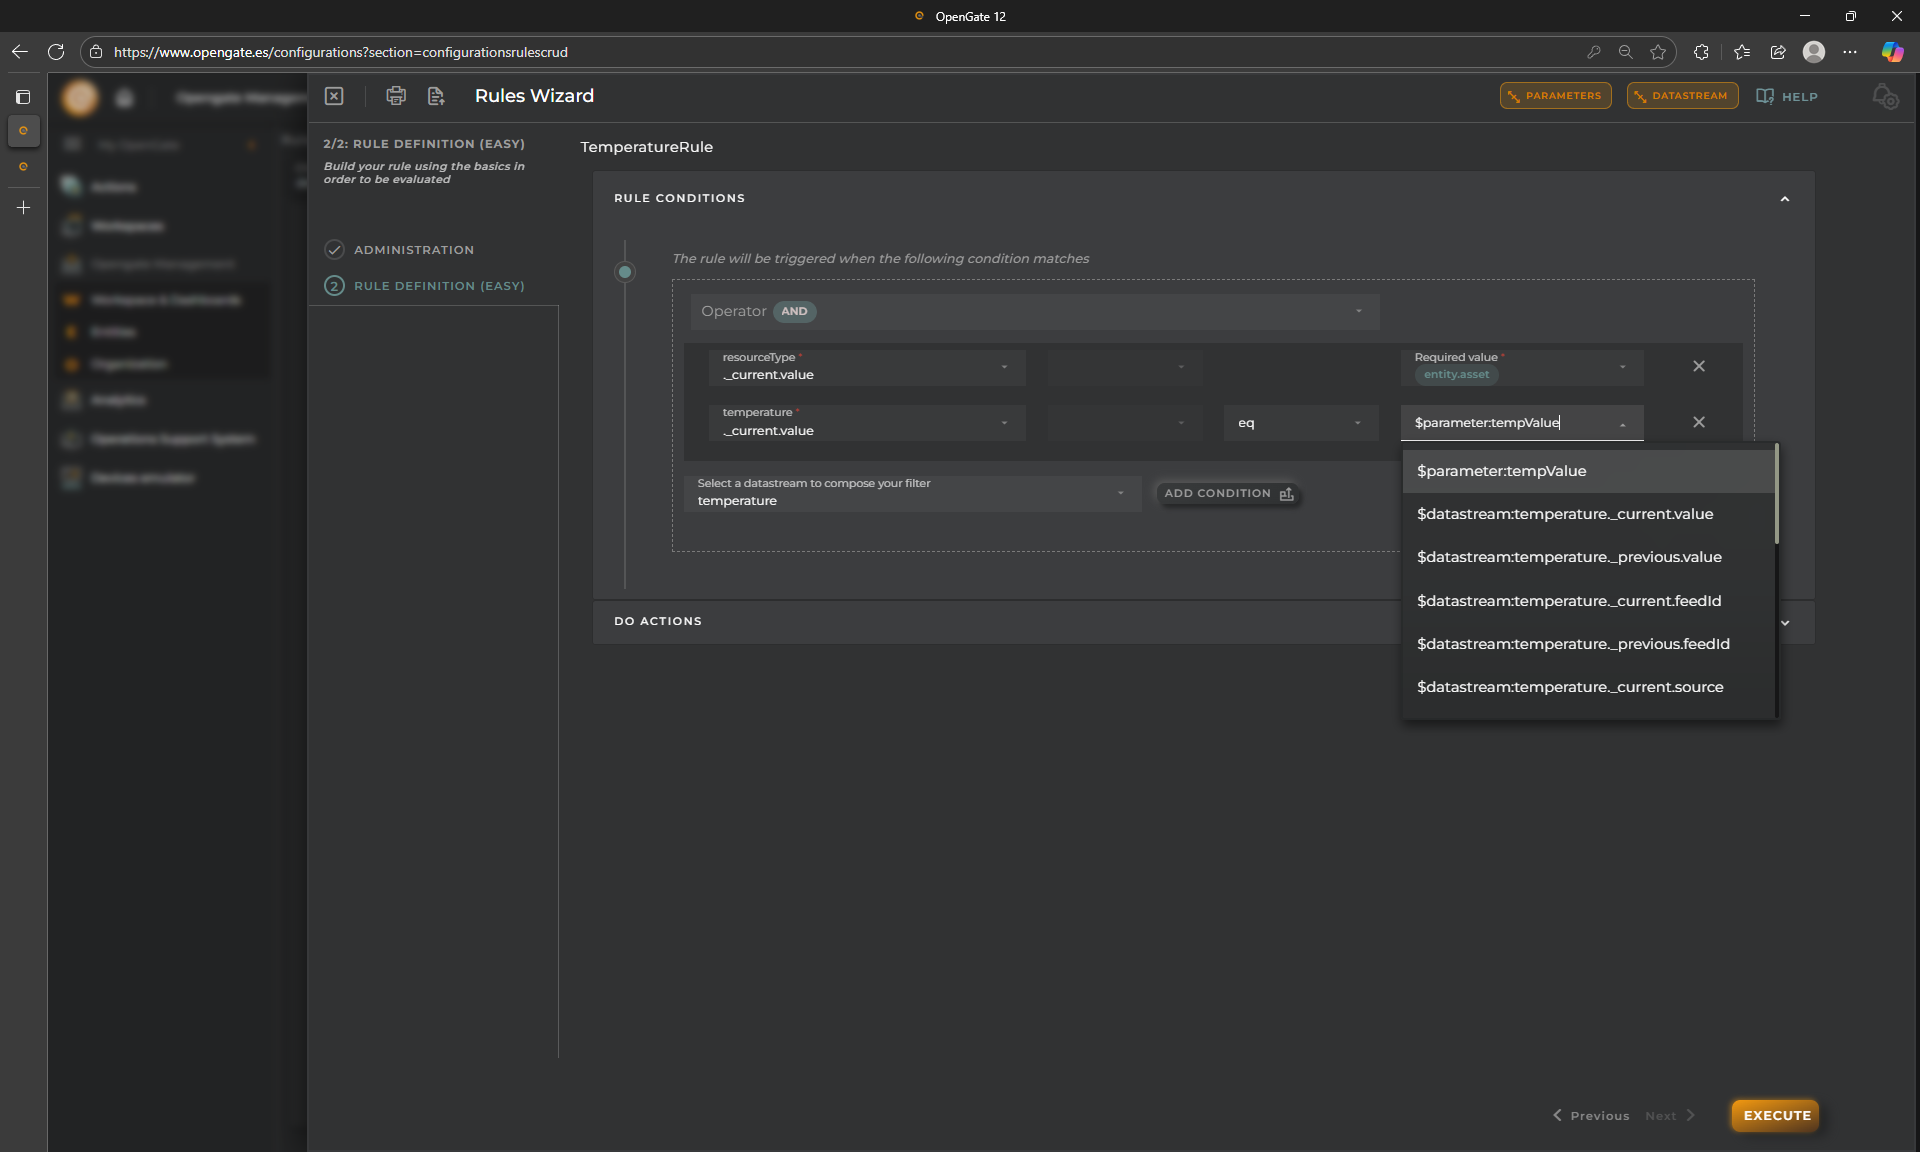
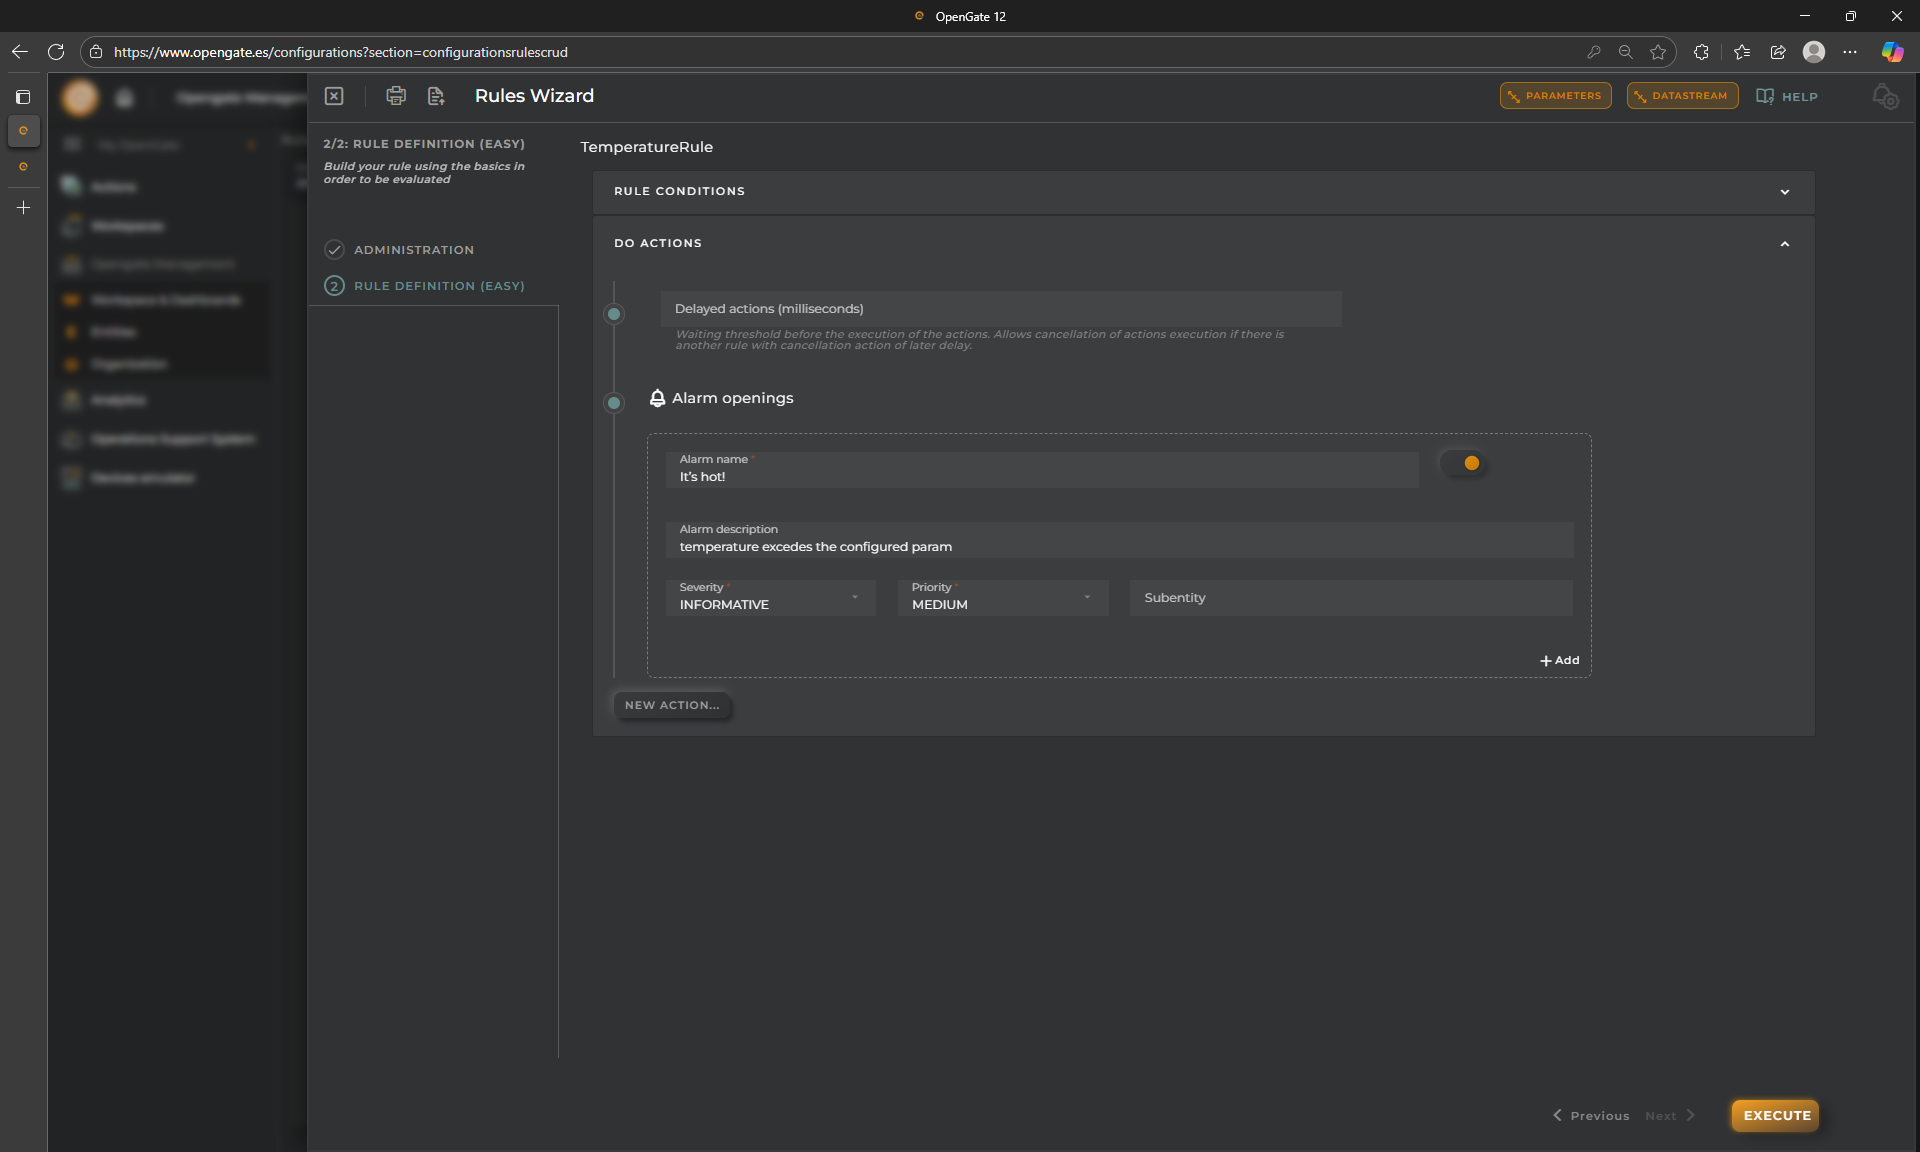
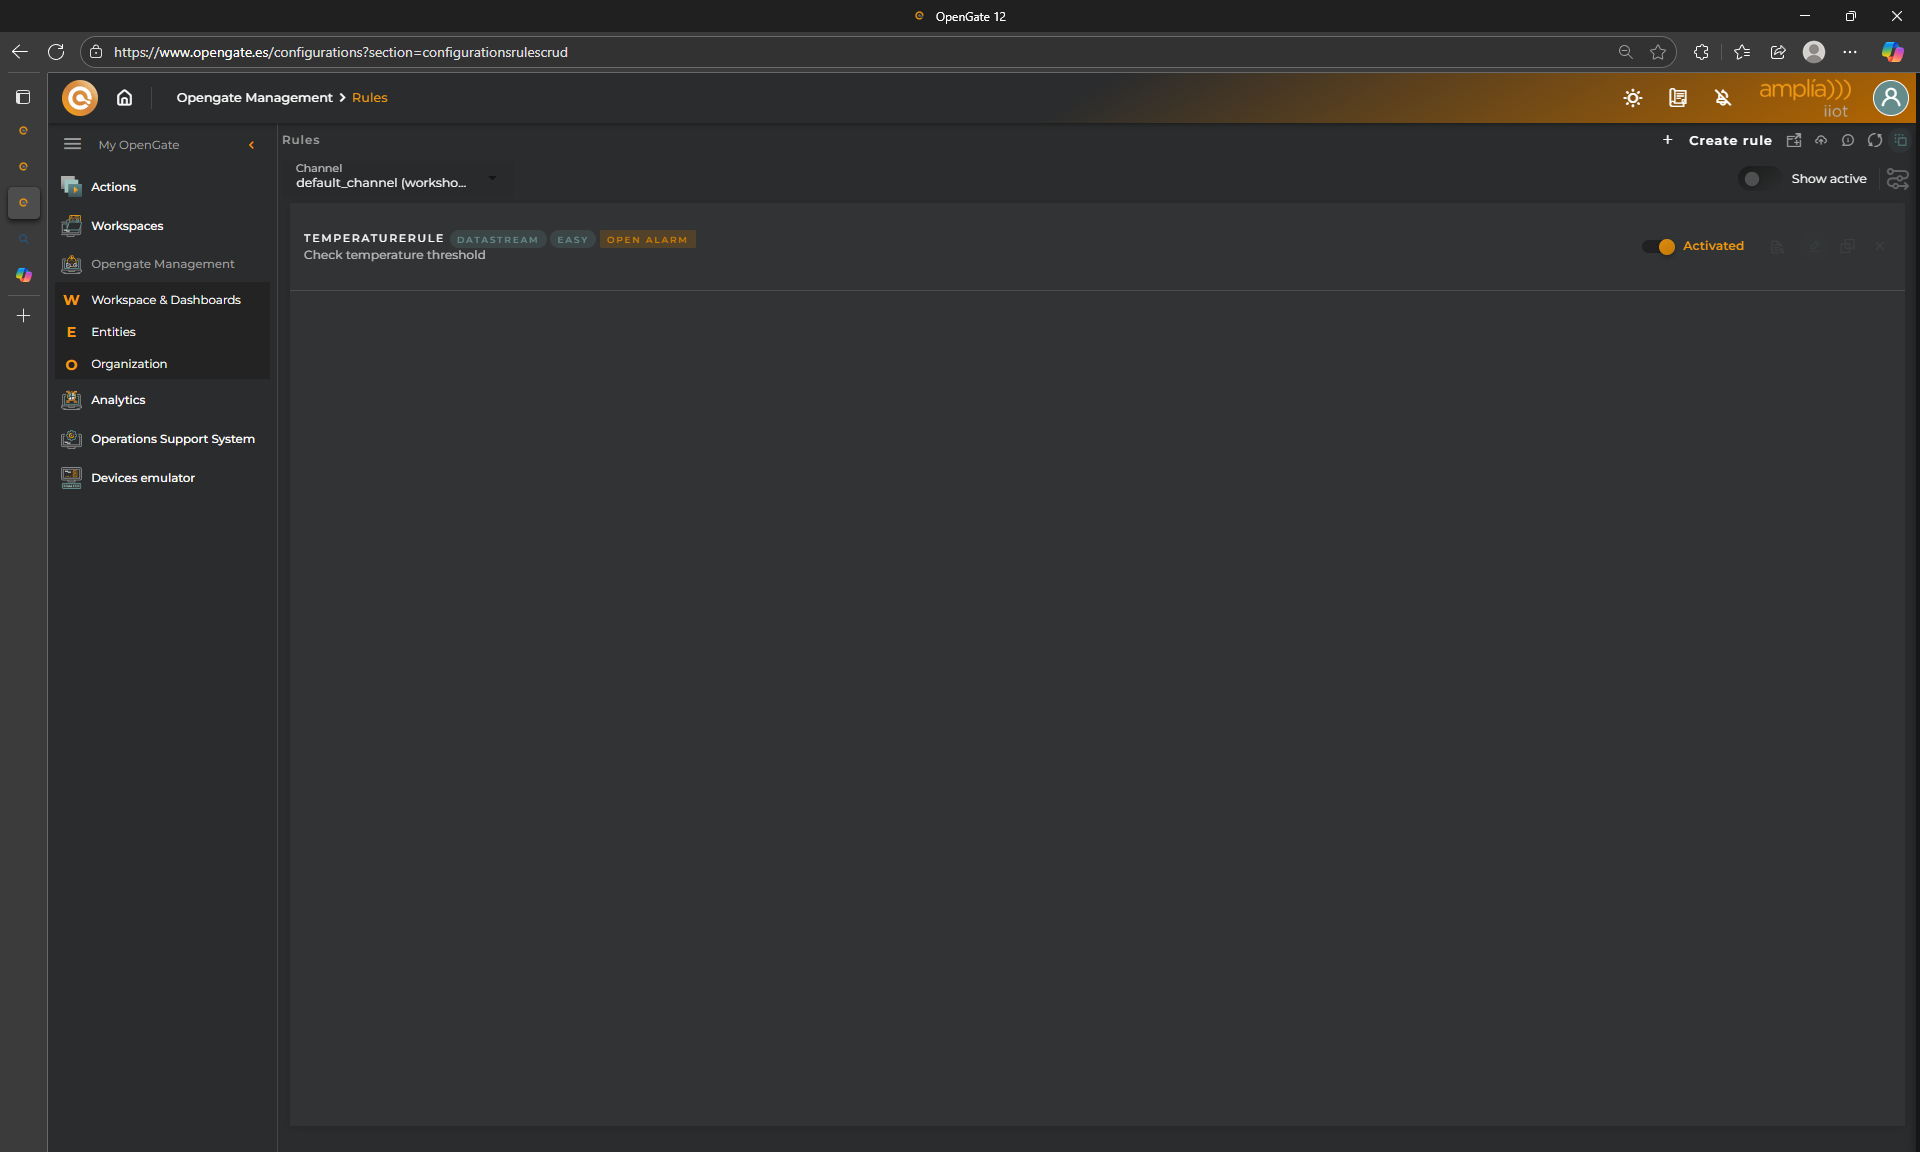
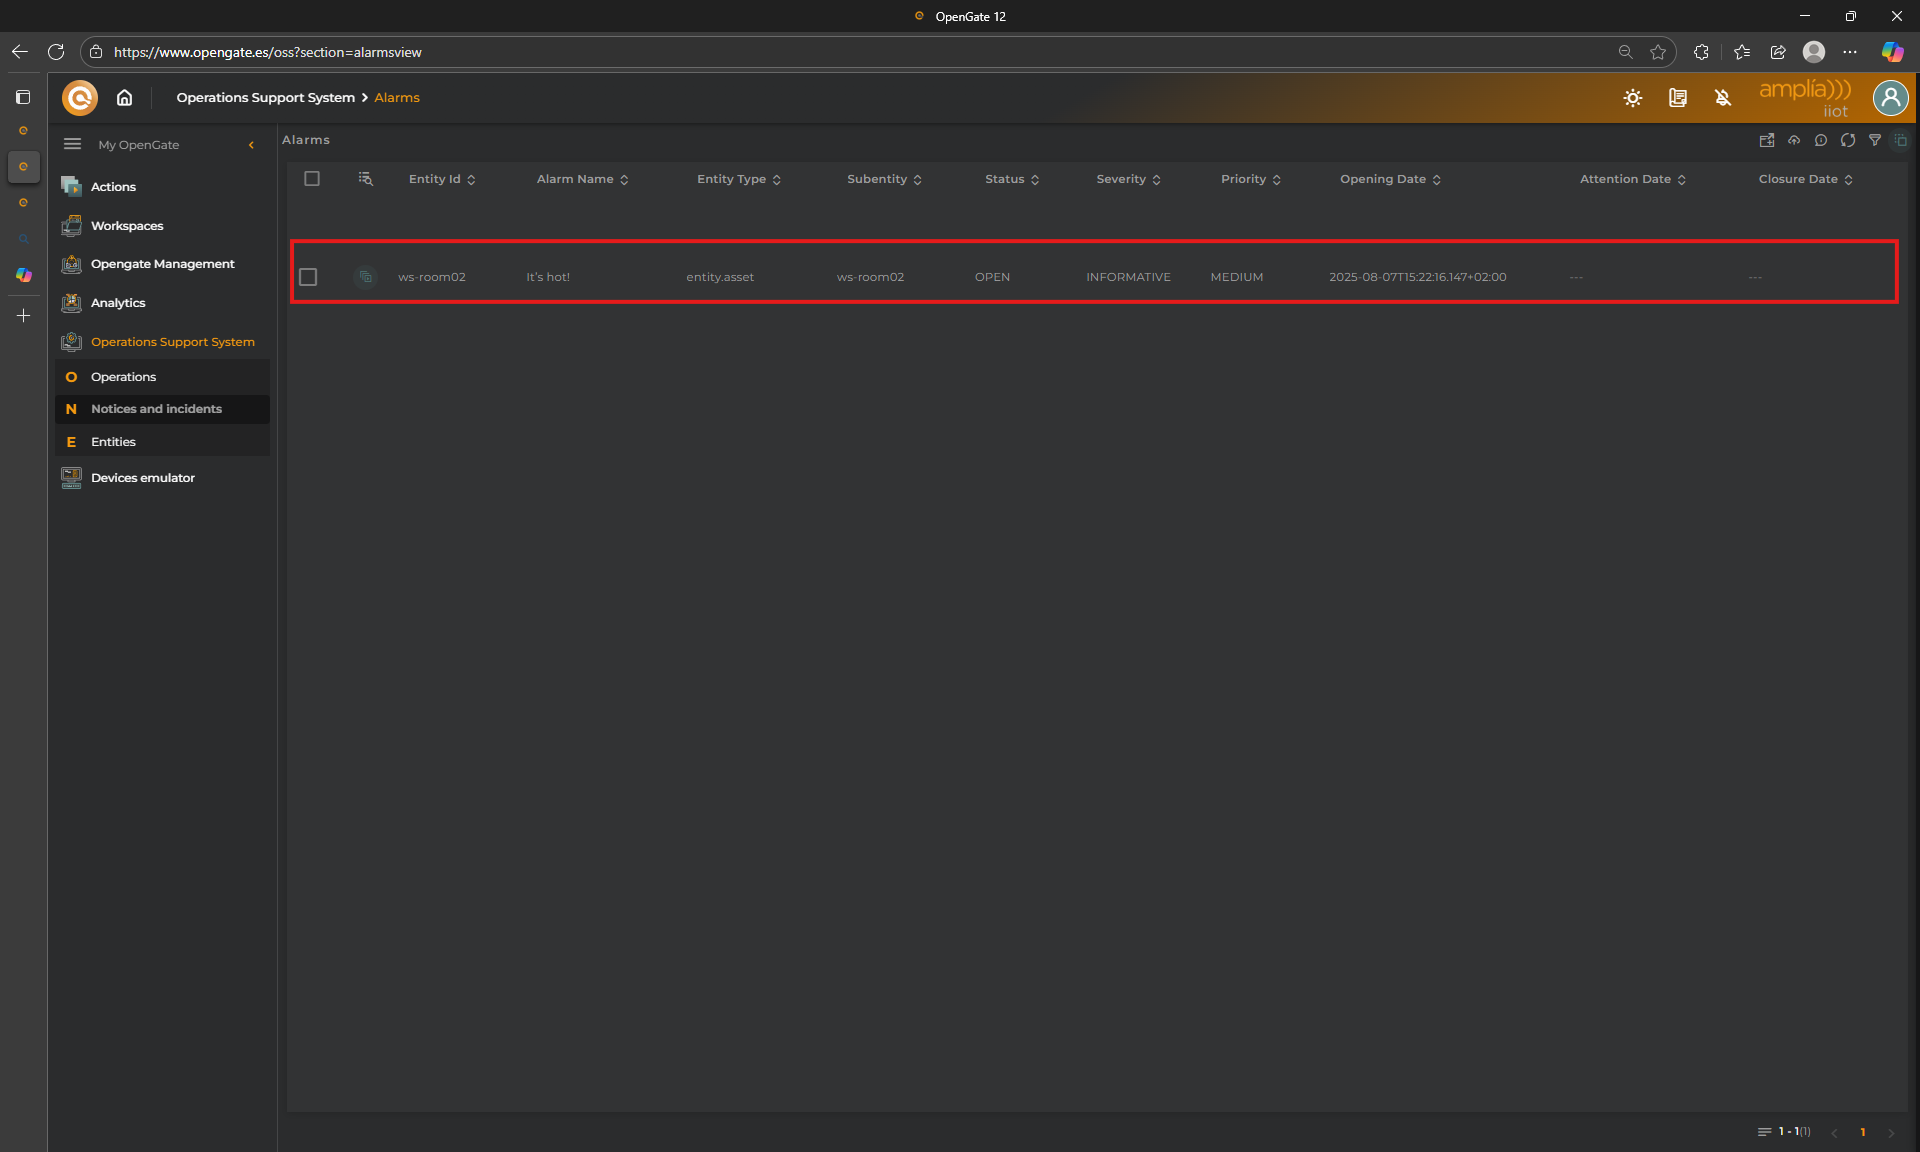
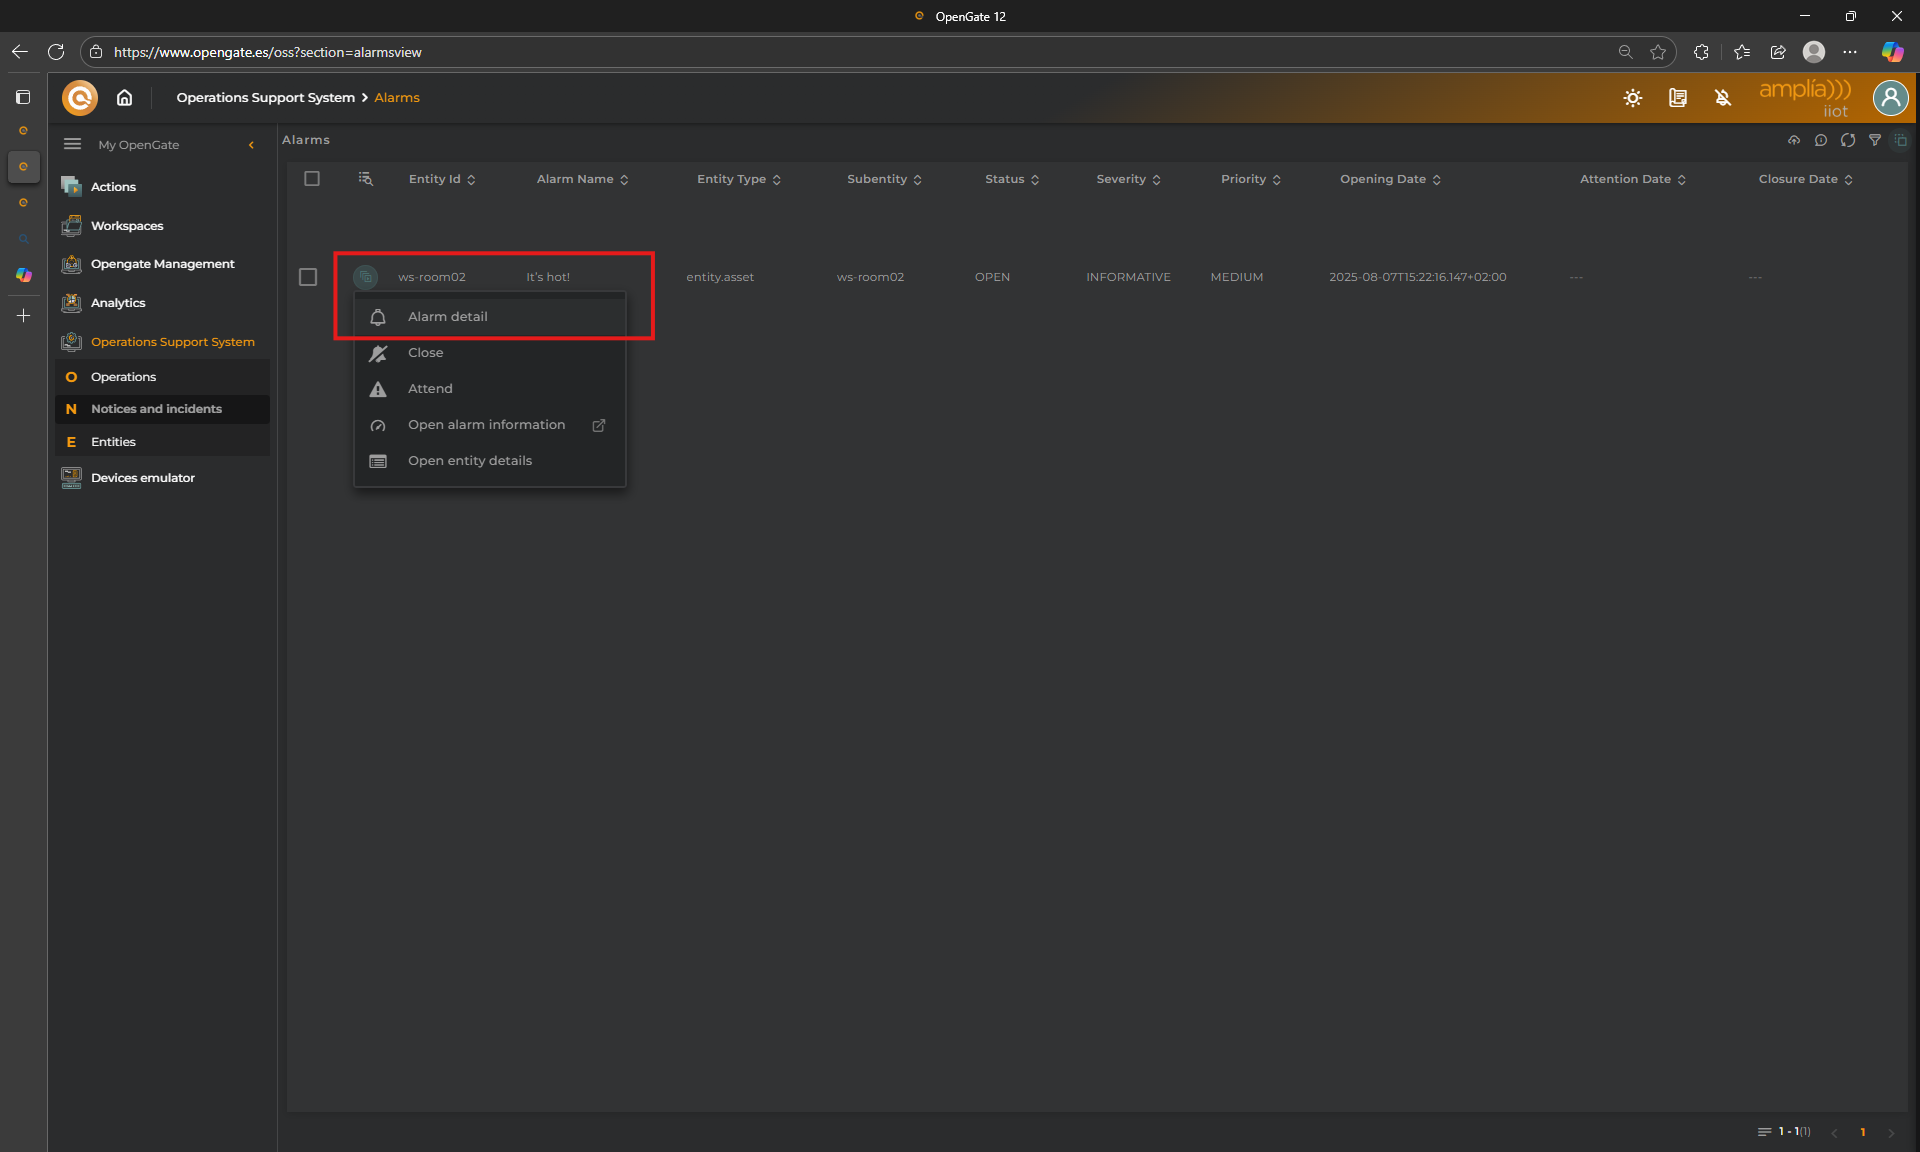
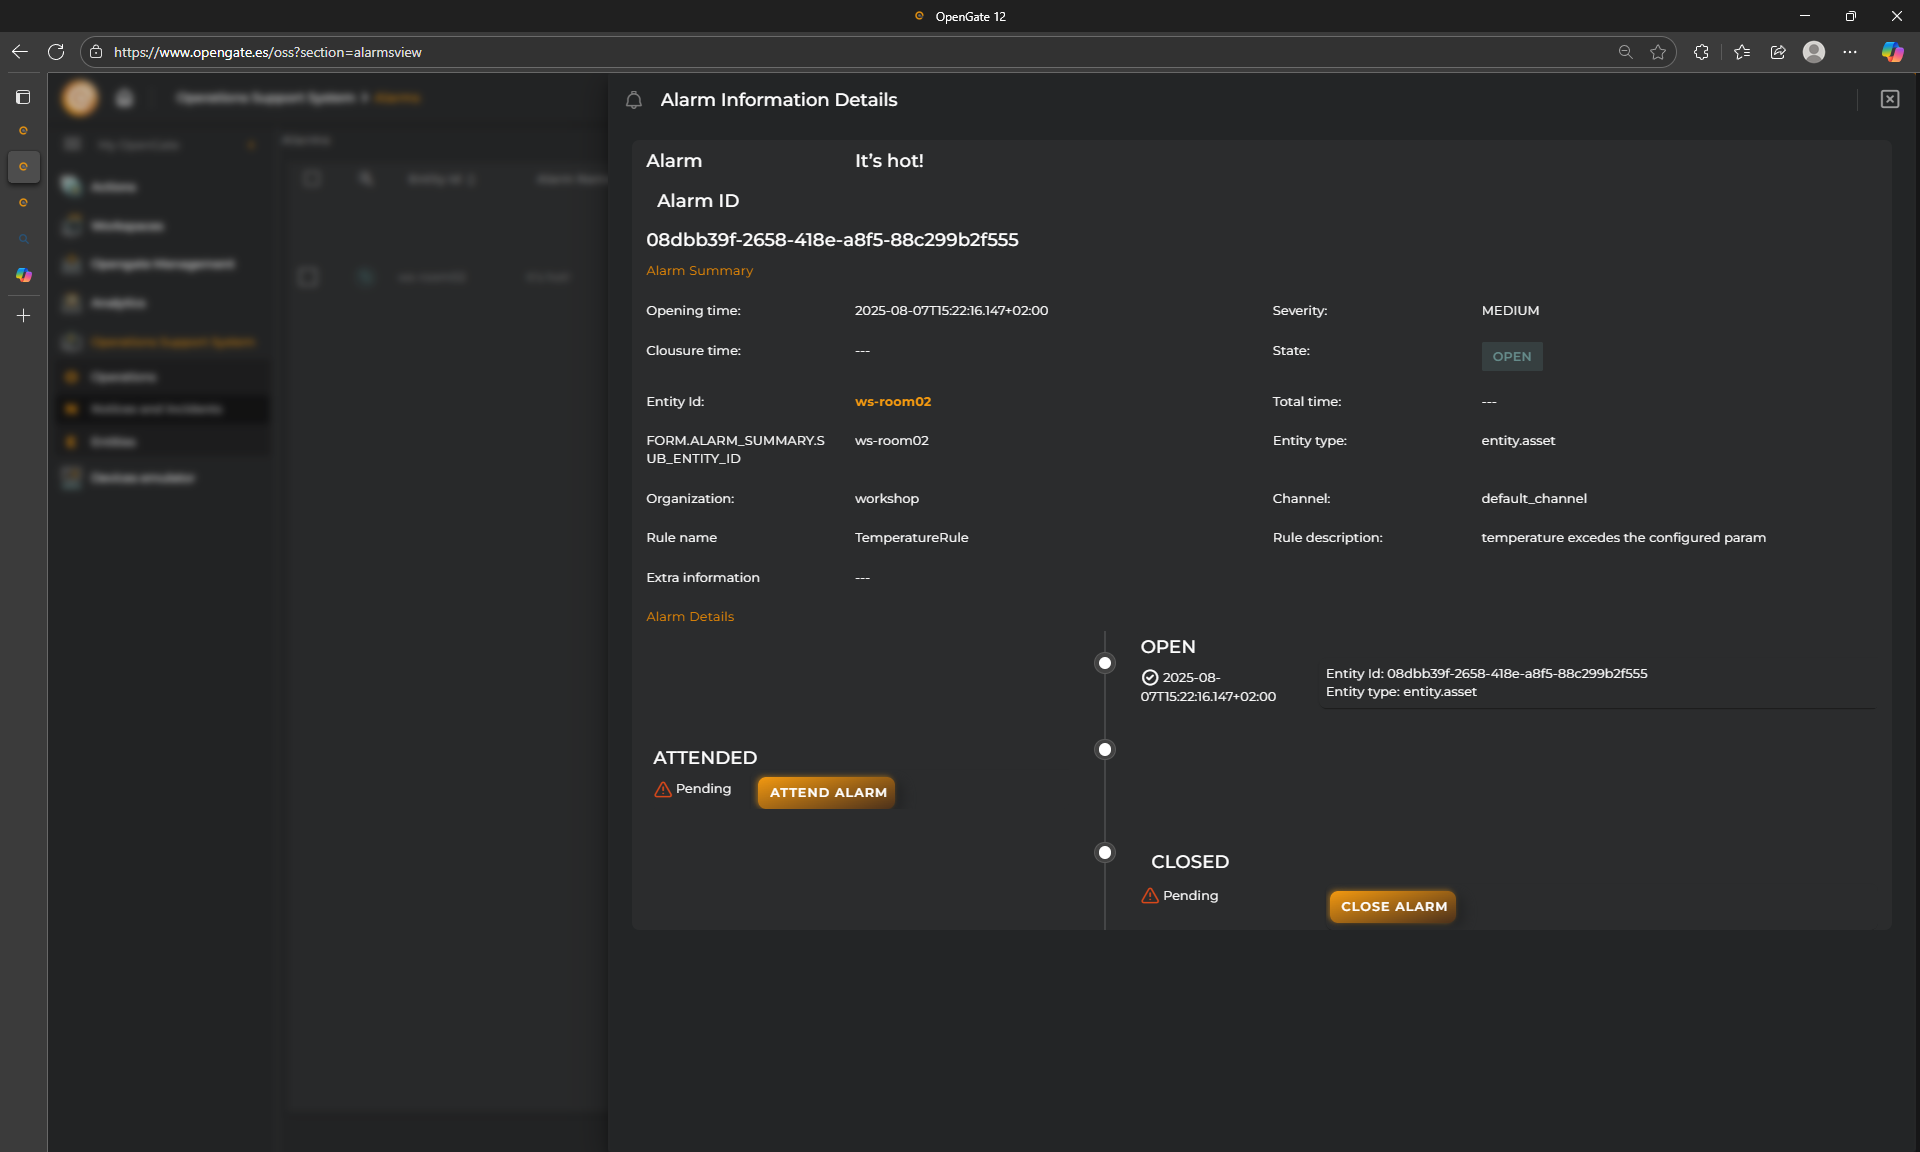
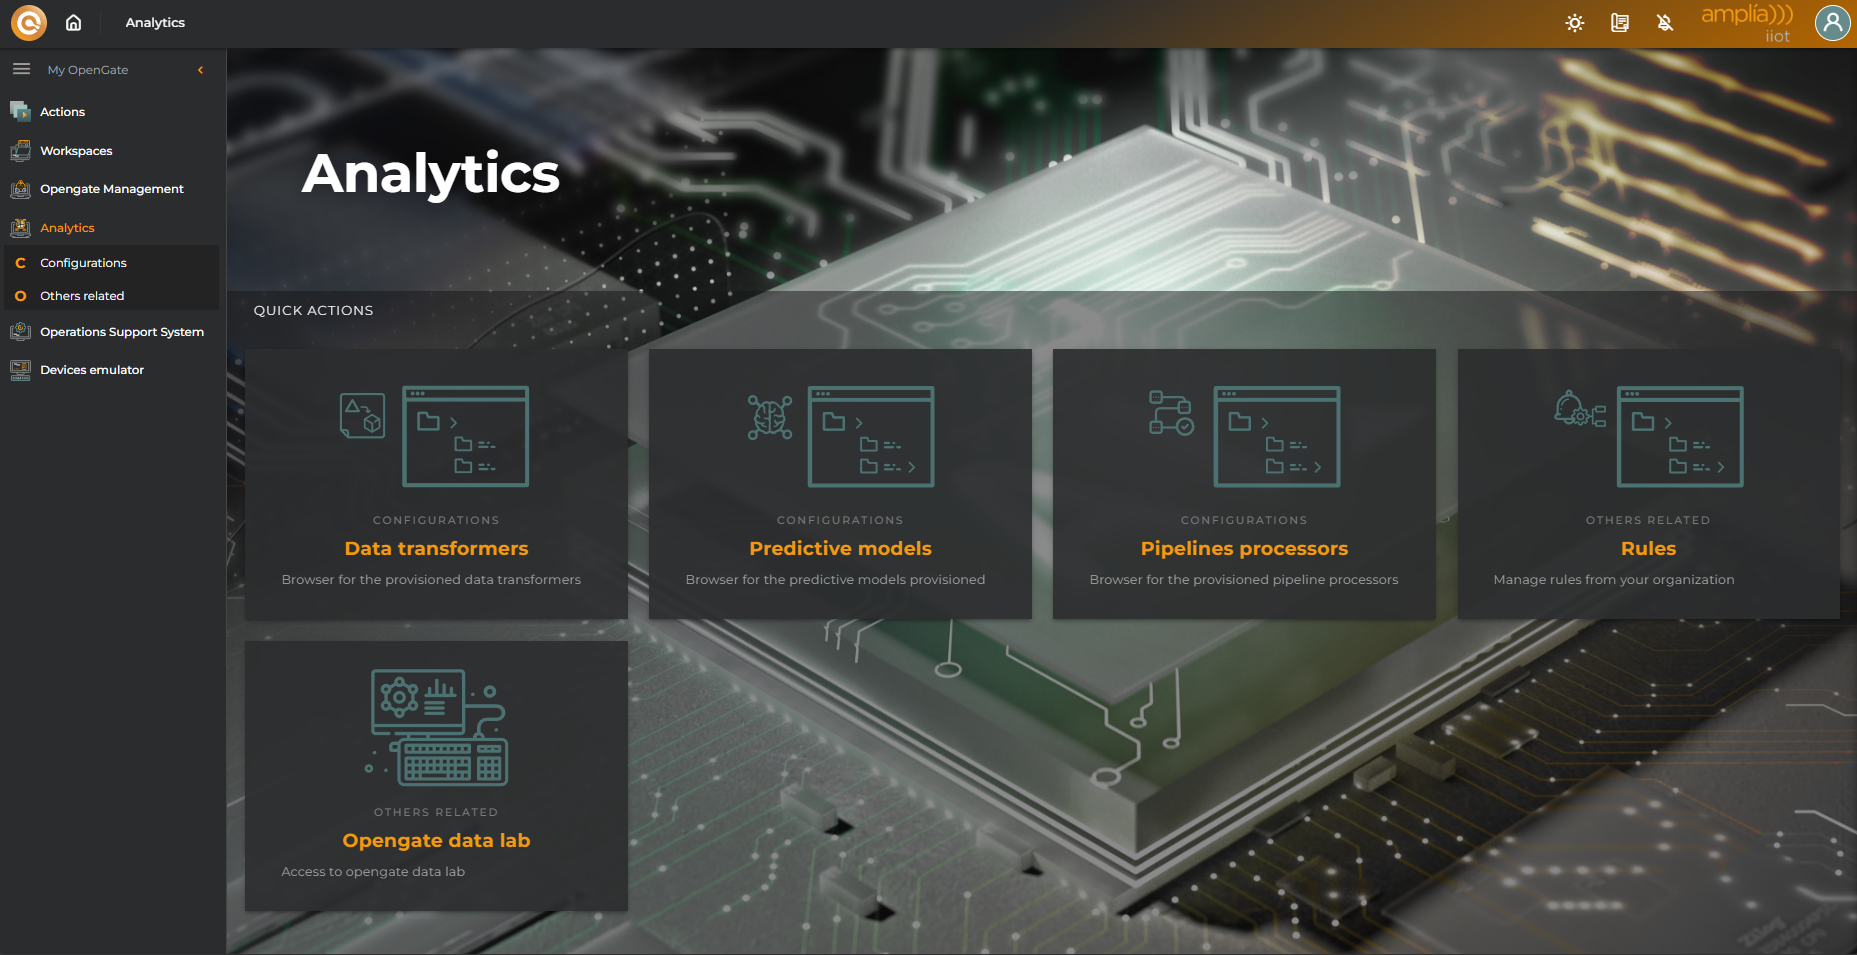
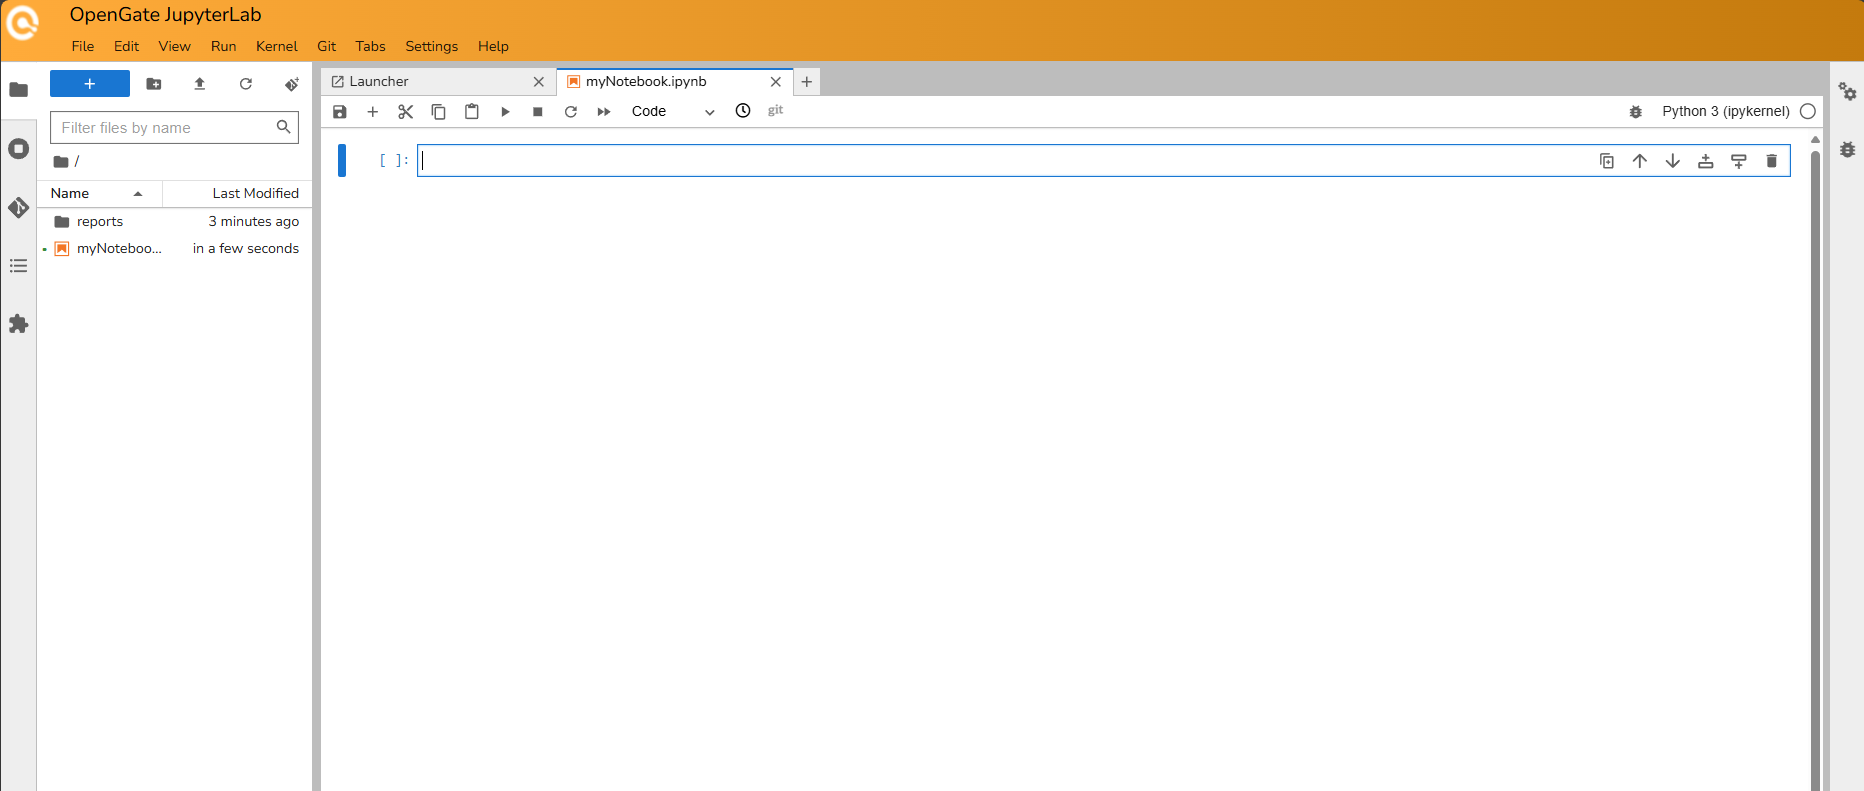
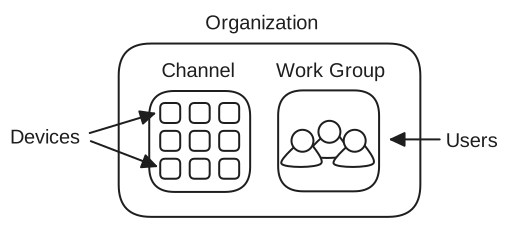
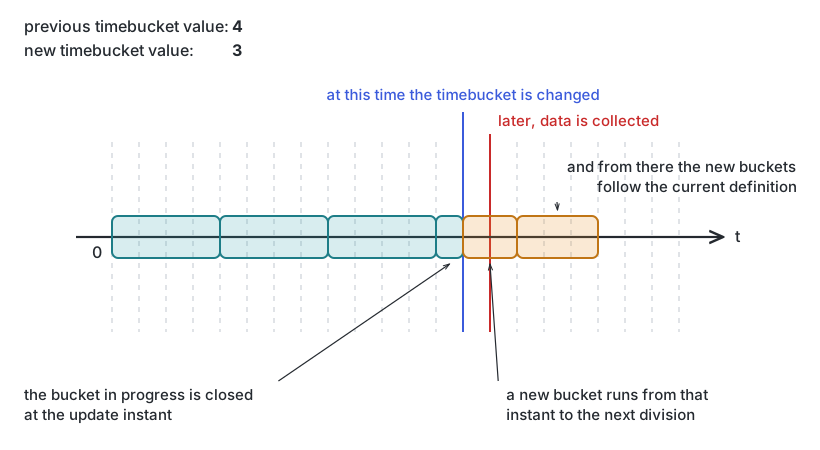 Changing the time bucket to a lower value
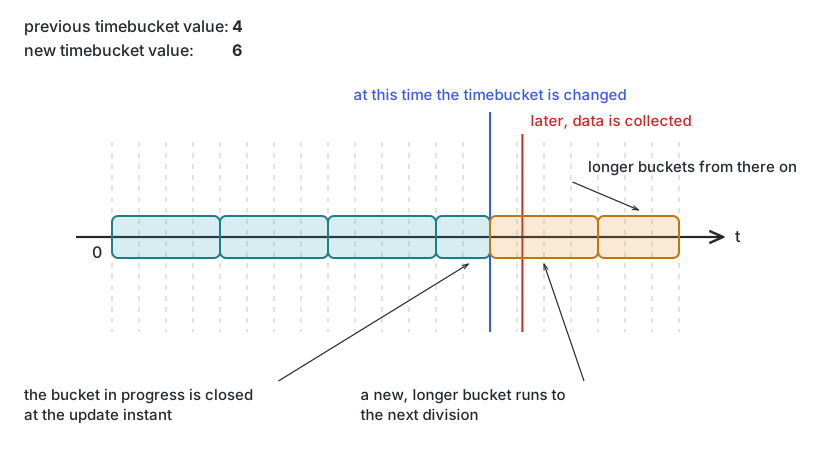 Changing the time bucket to a bigger value
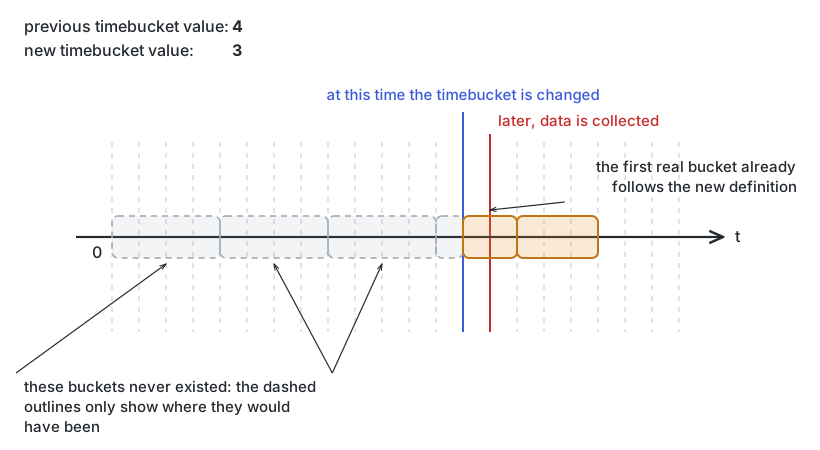 Changing the time bucket before the first data collection of a device
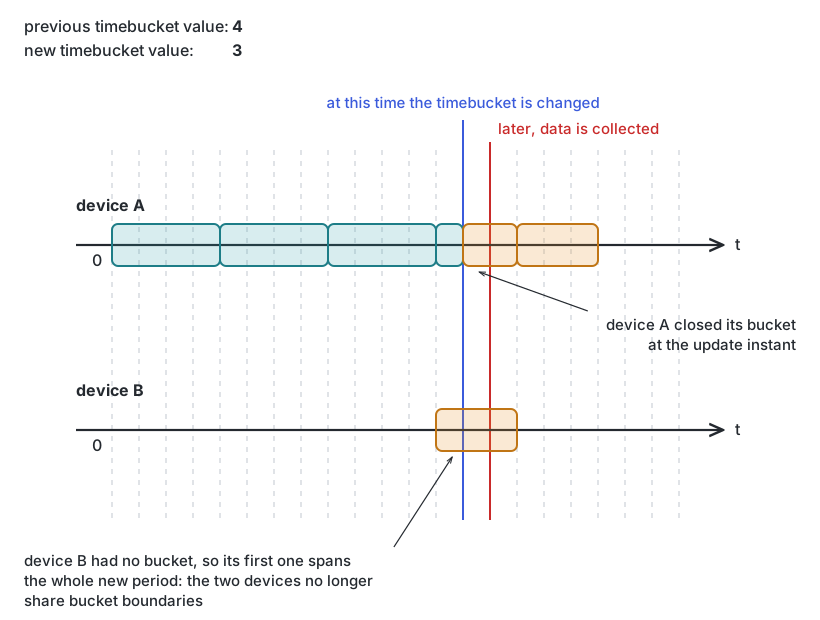 Two devices with different buckets after changing the time bucket
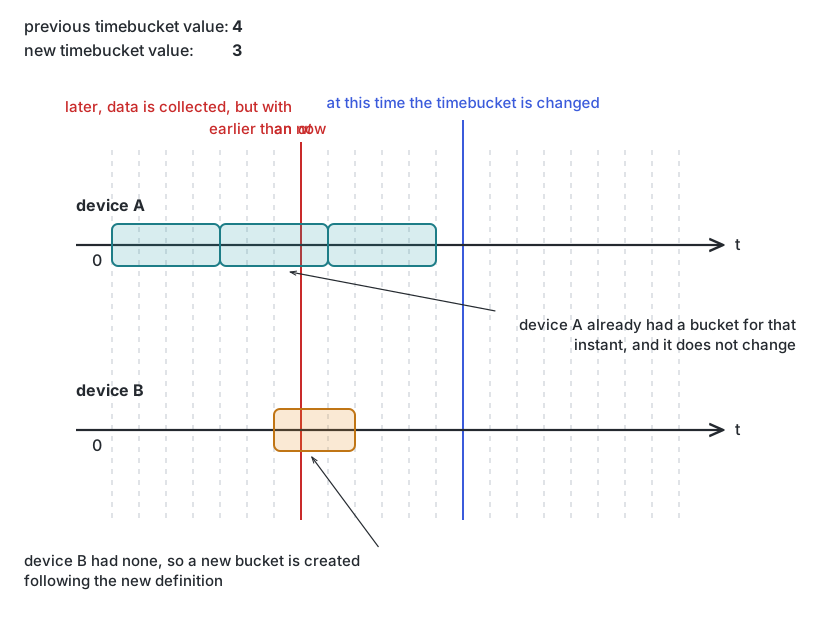 Two devices with different buckets in the past after changing the time bucket
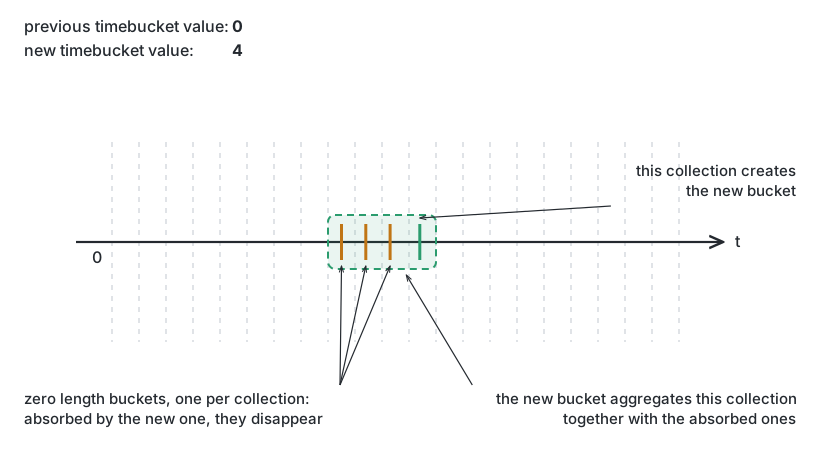 Changing the time bucket from zero to a higher value


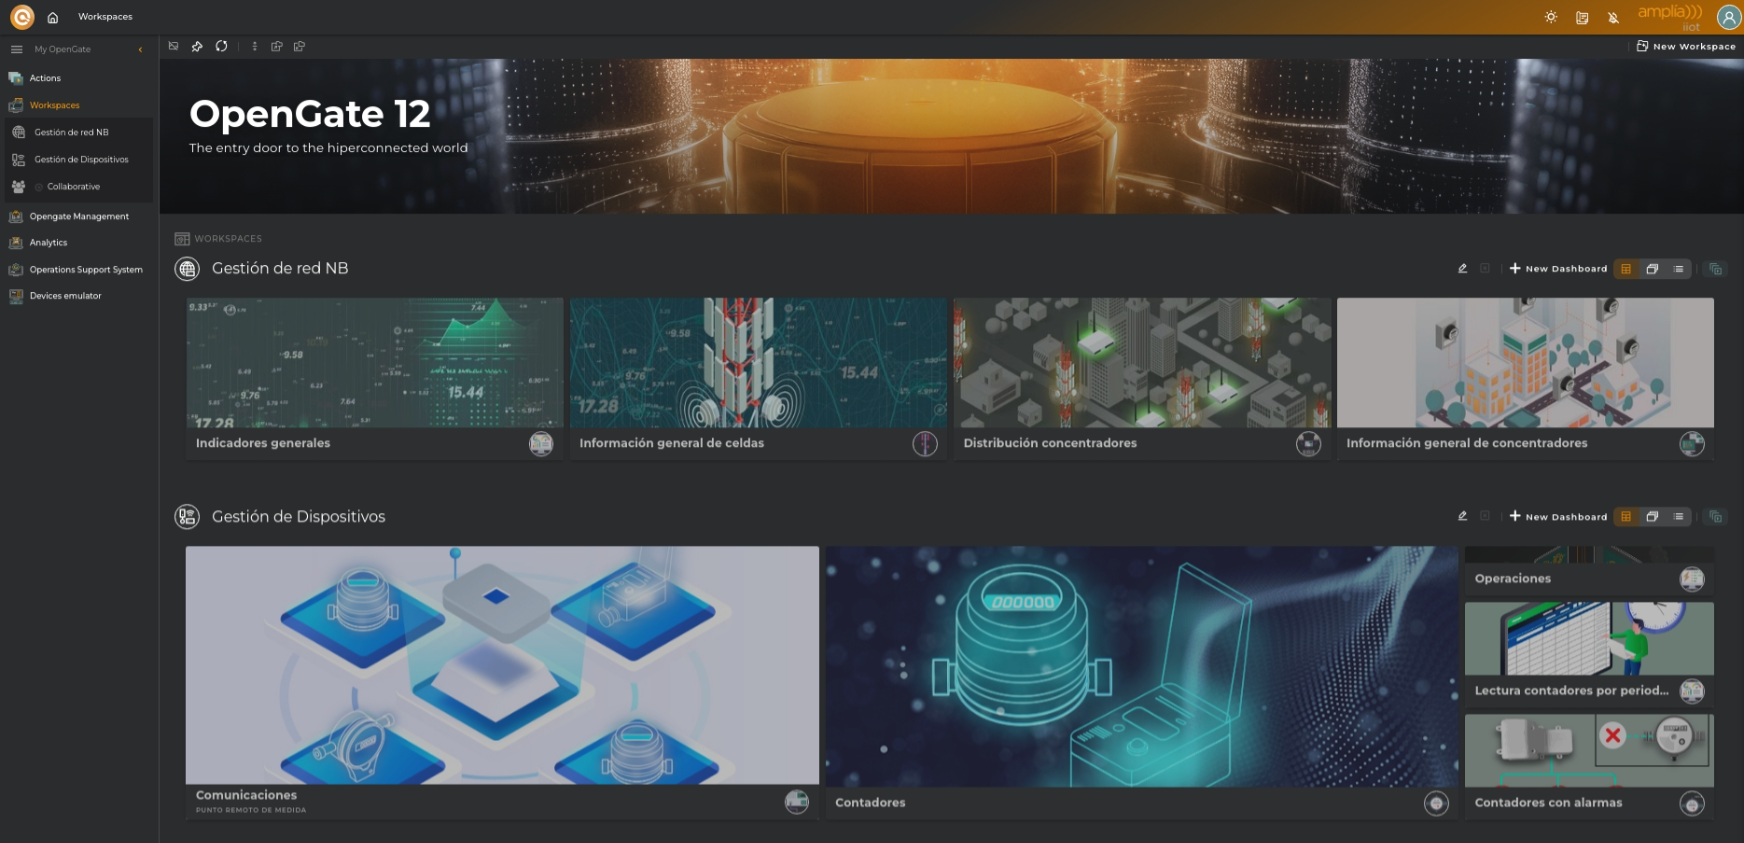

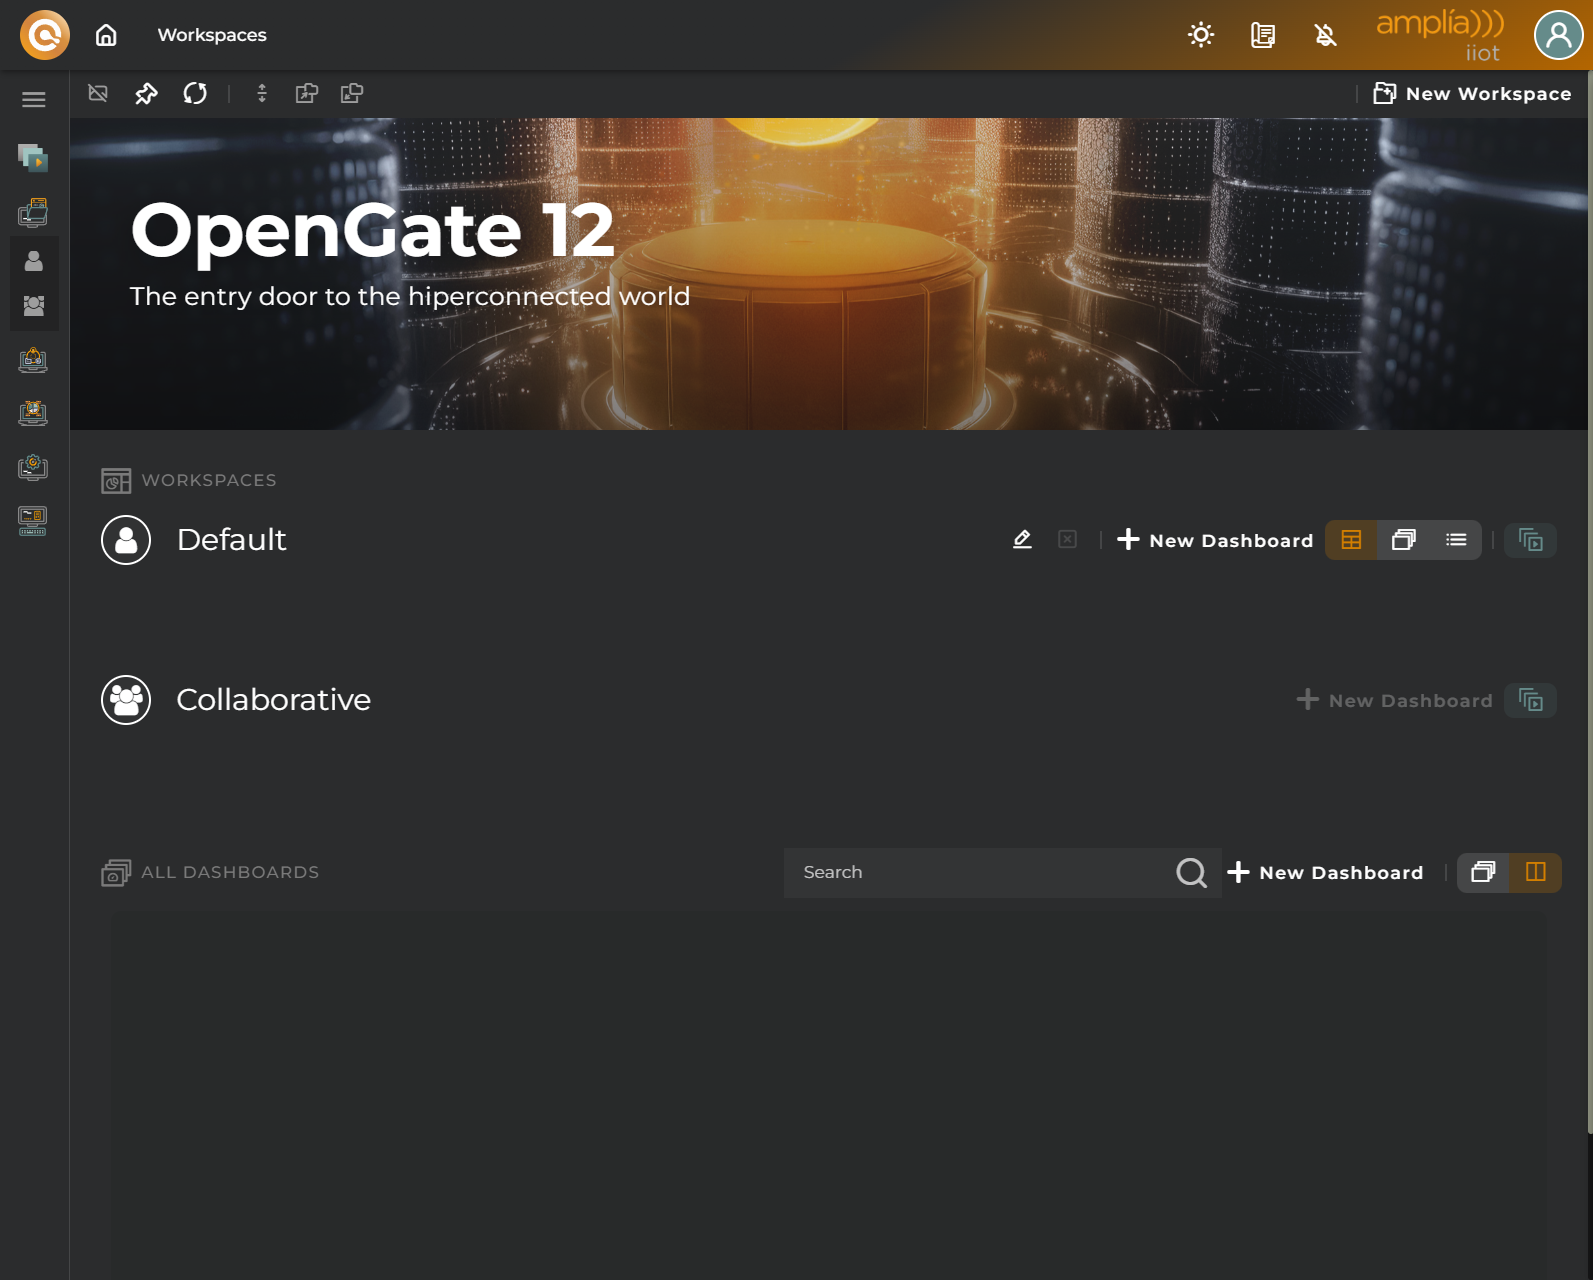


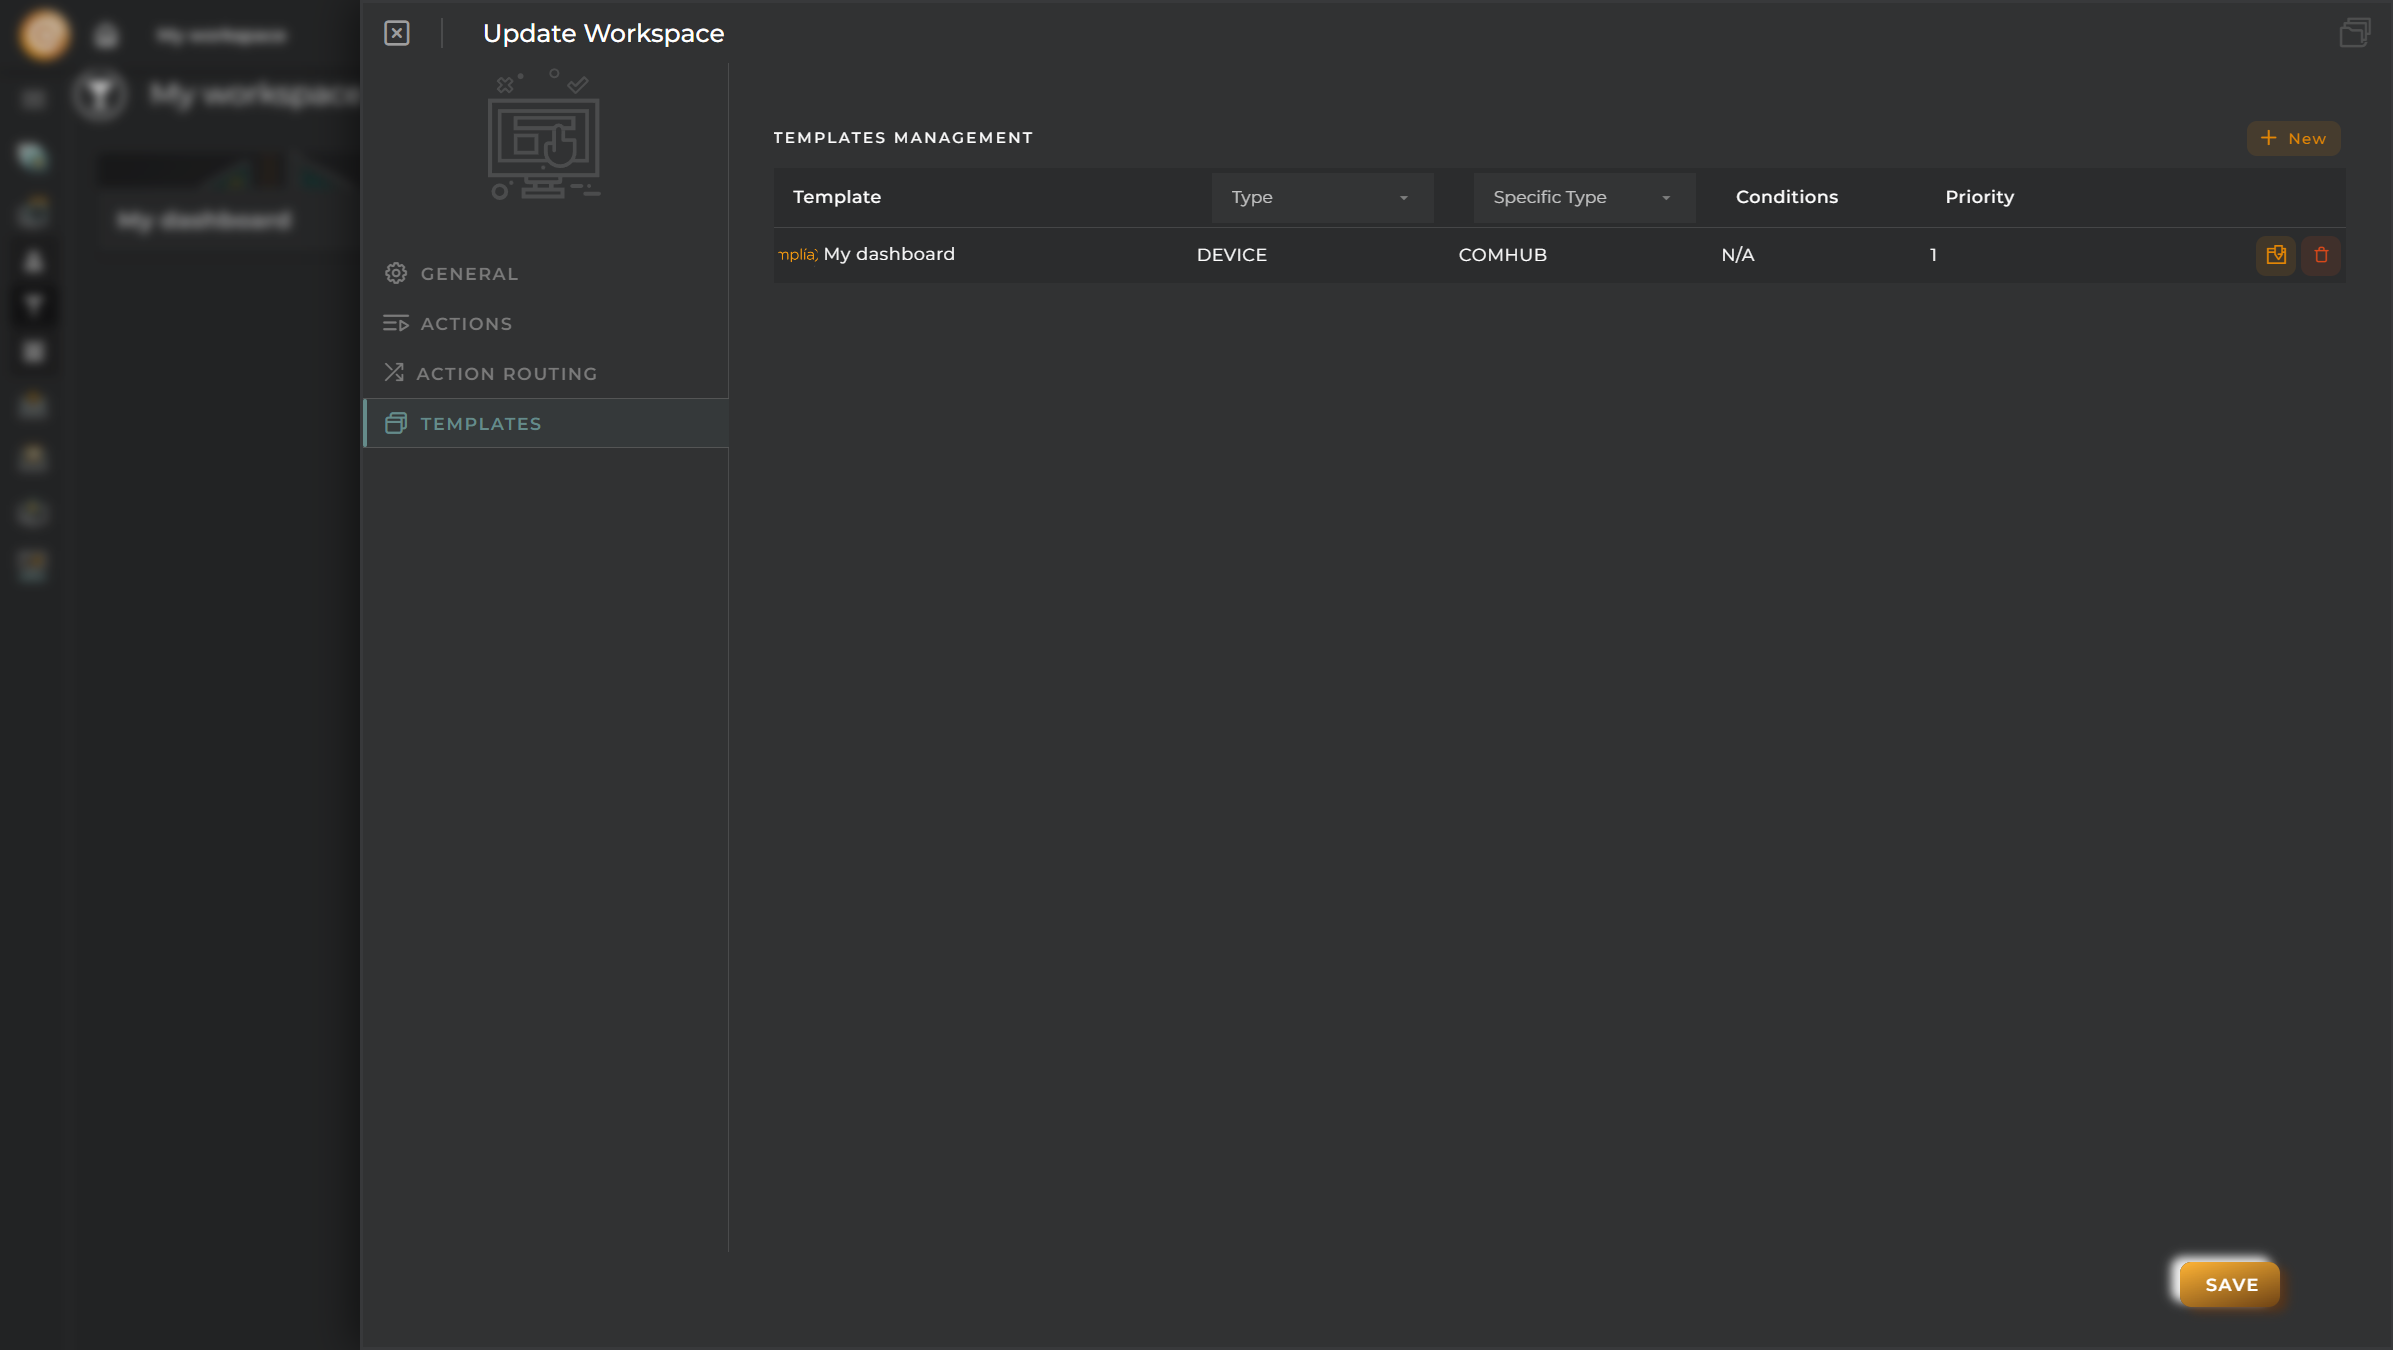
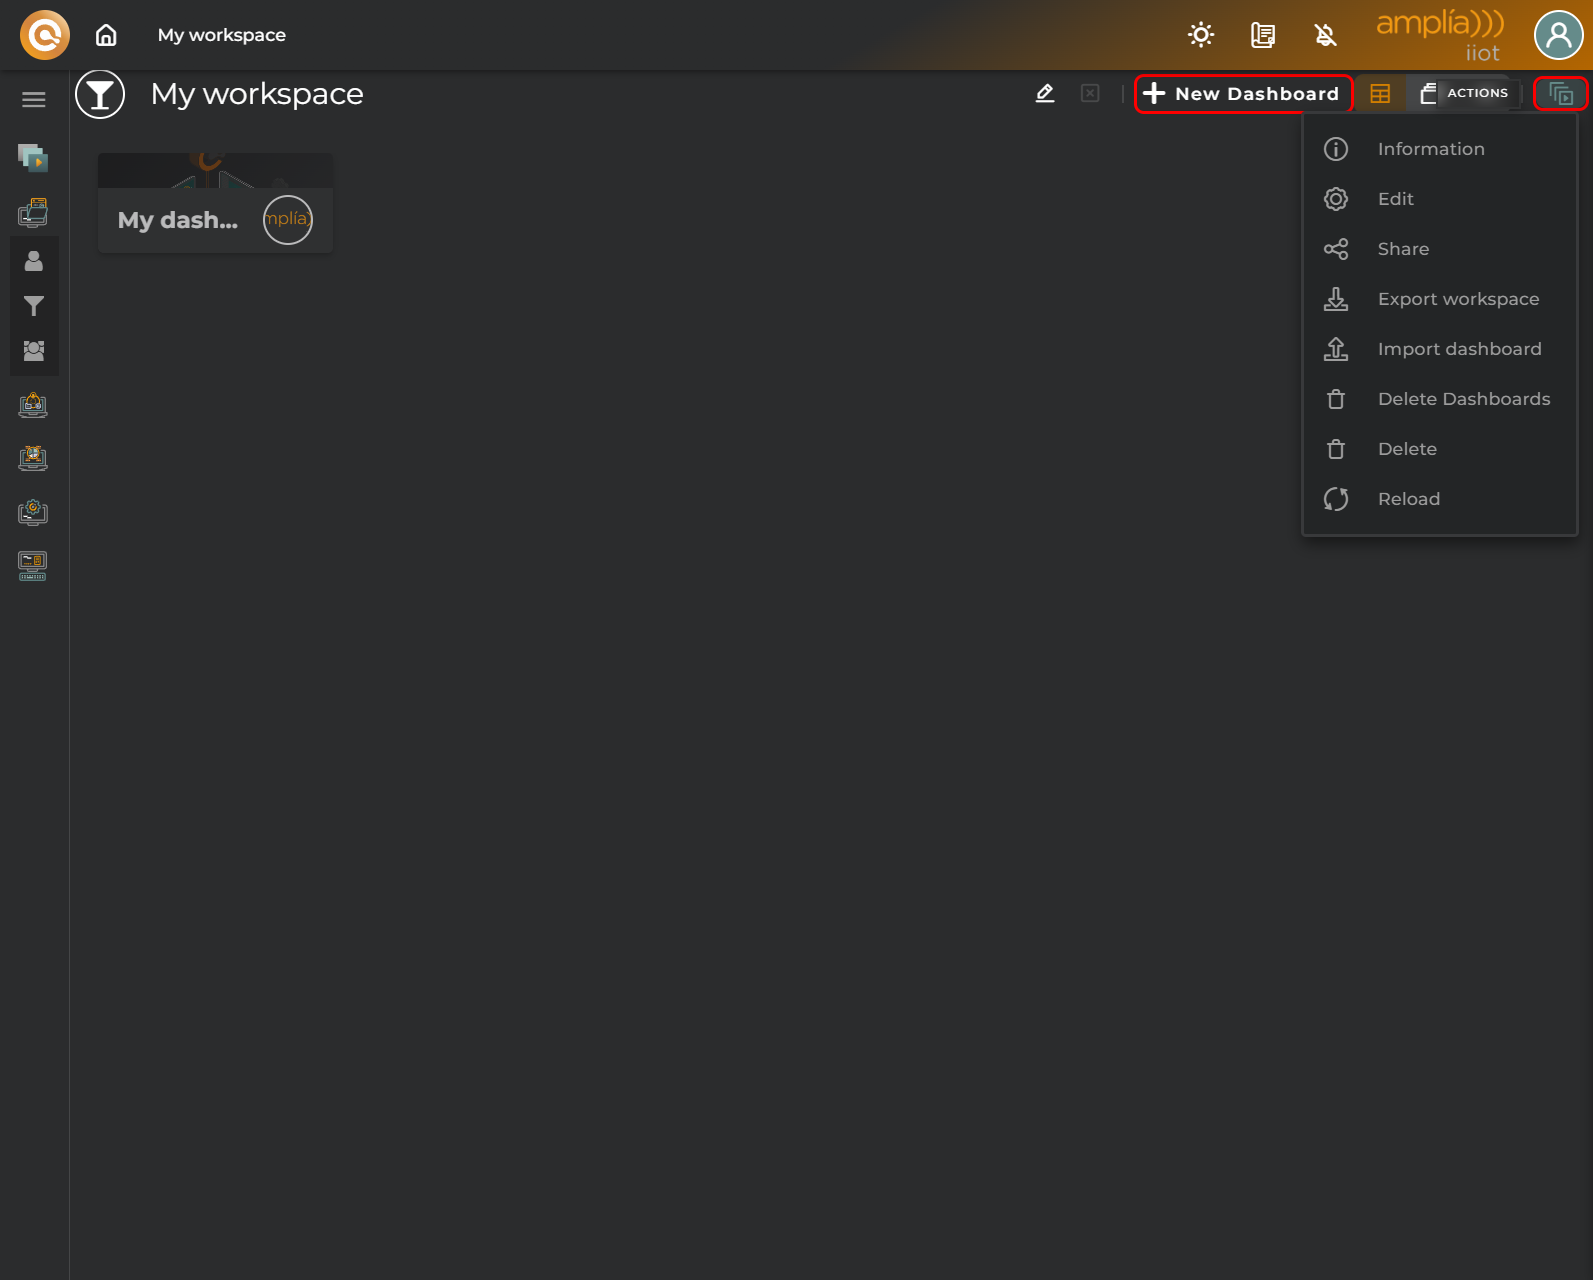


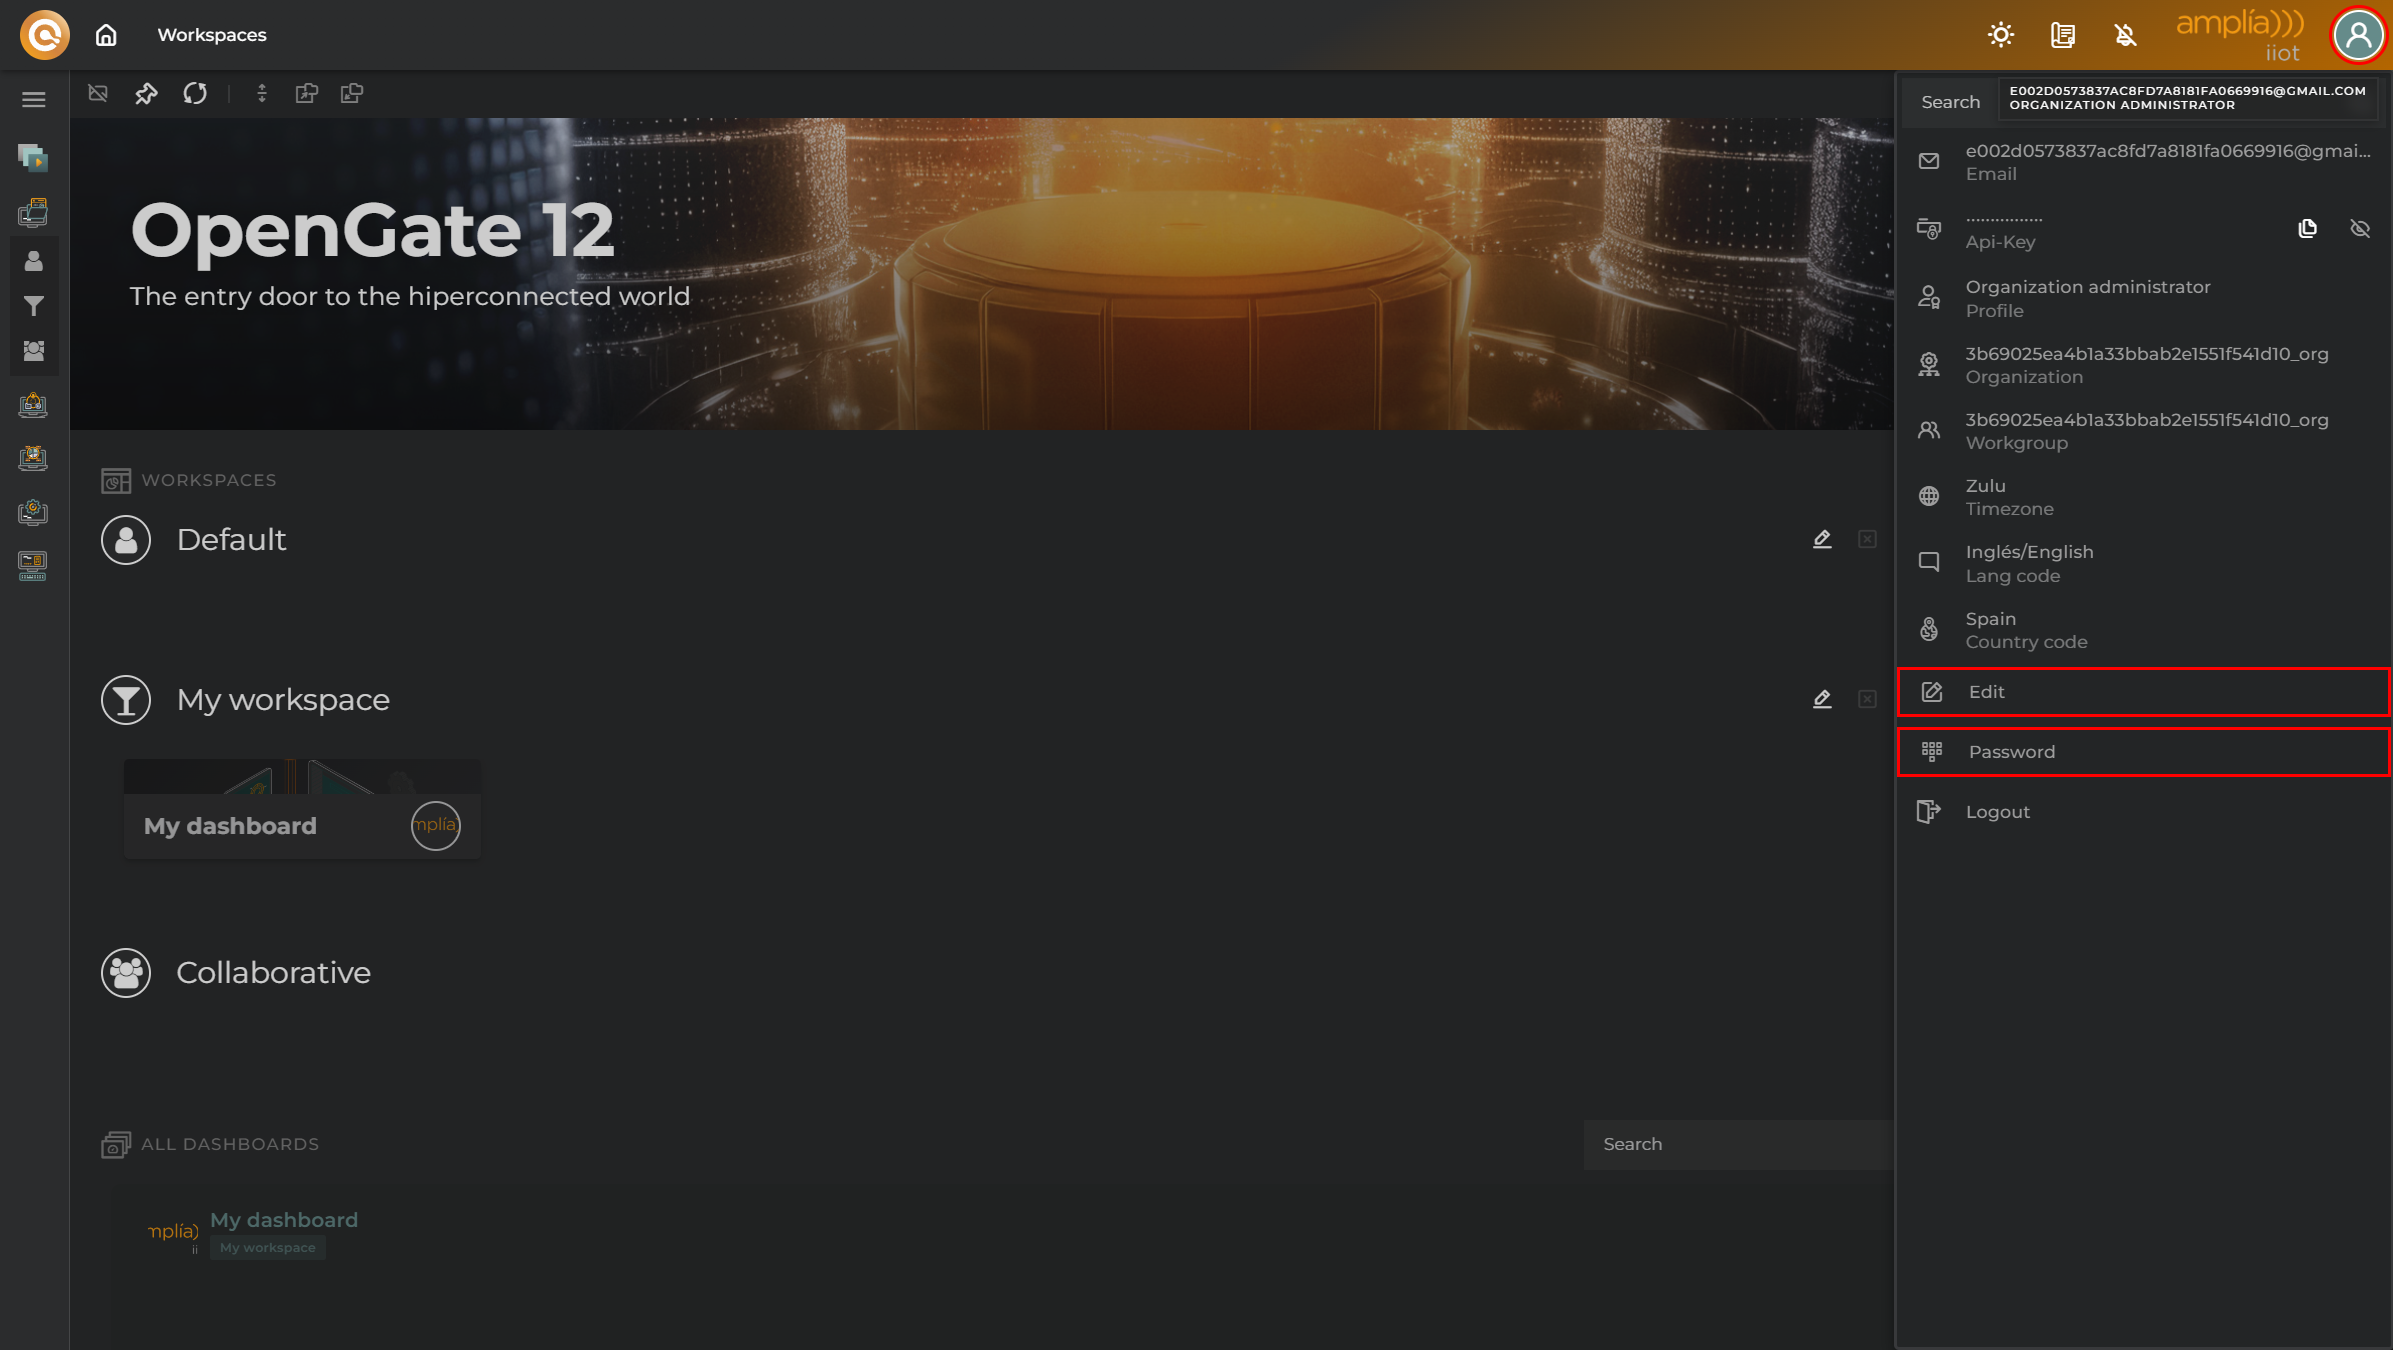


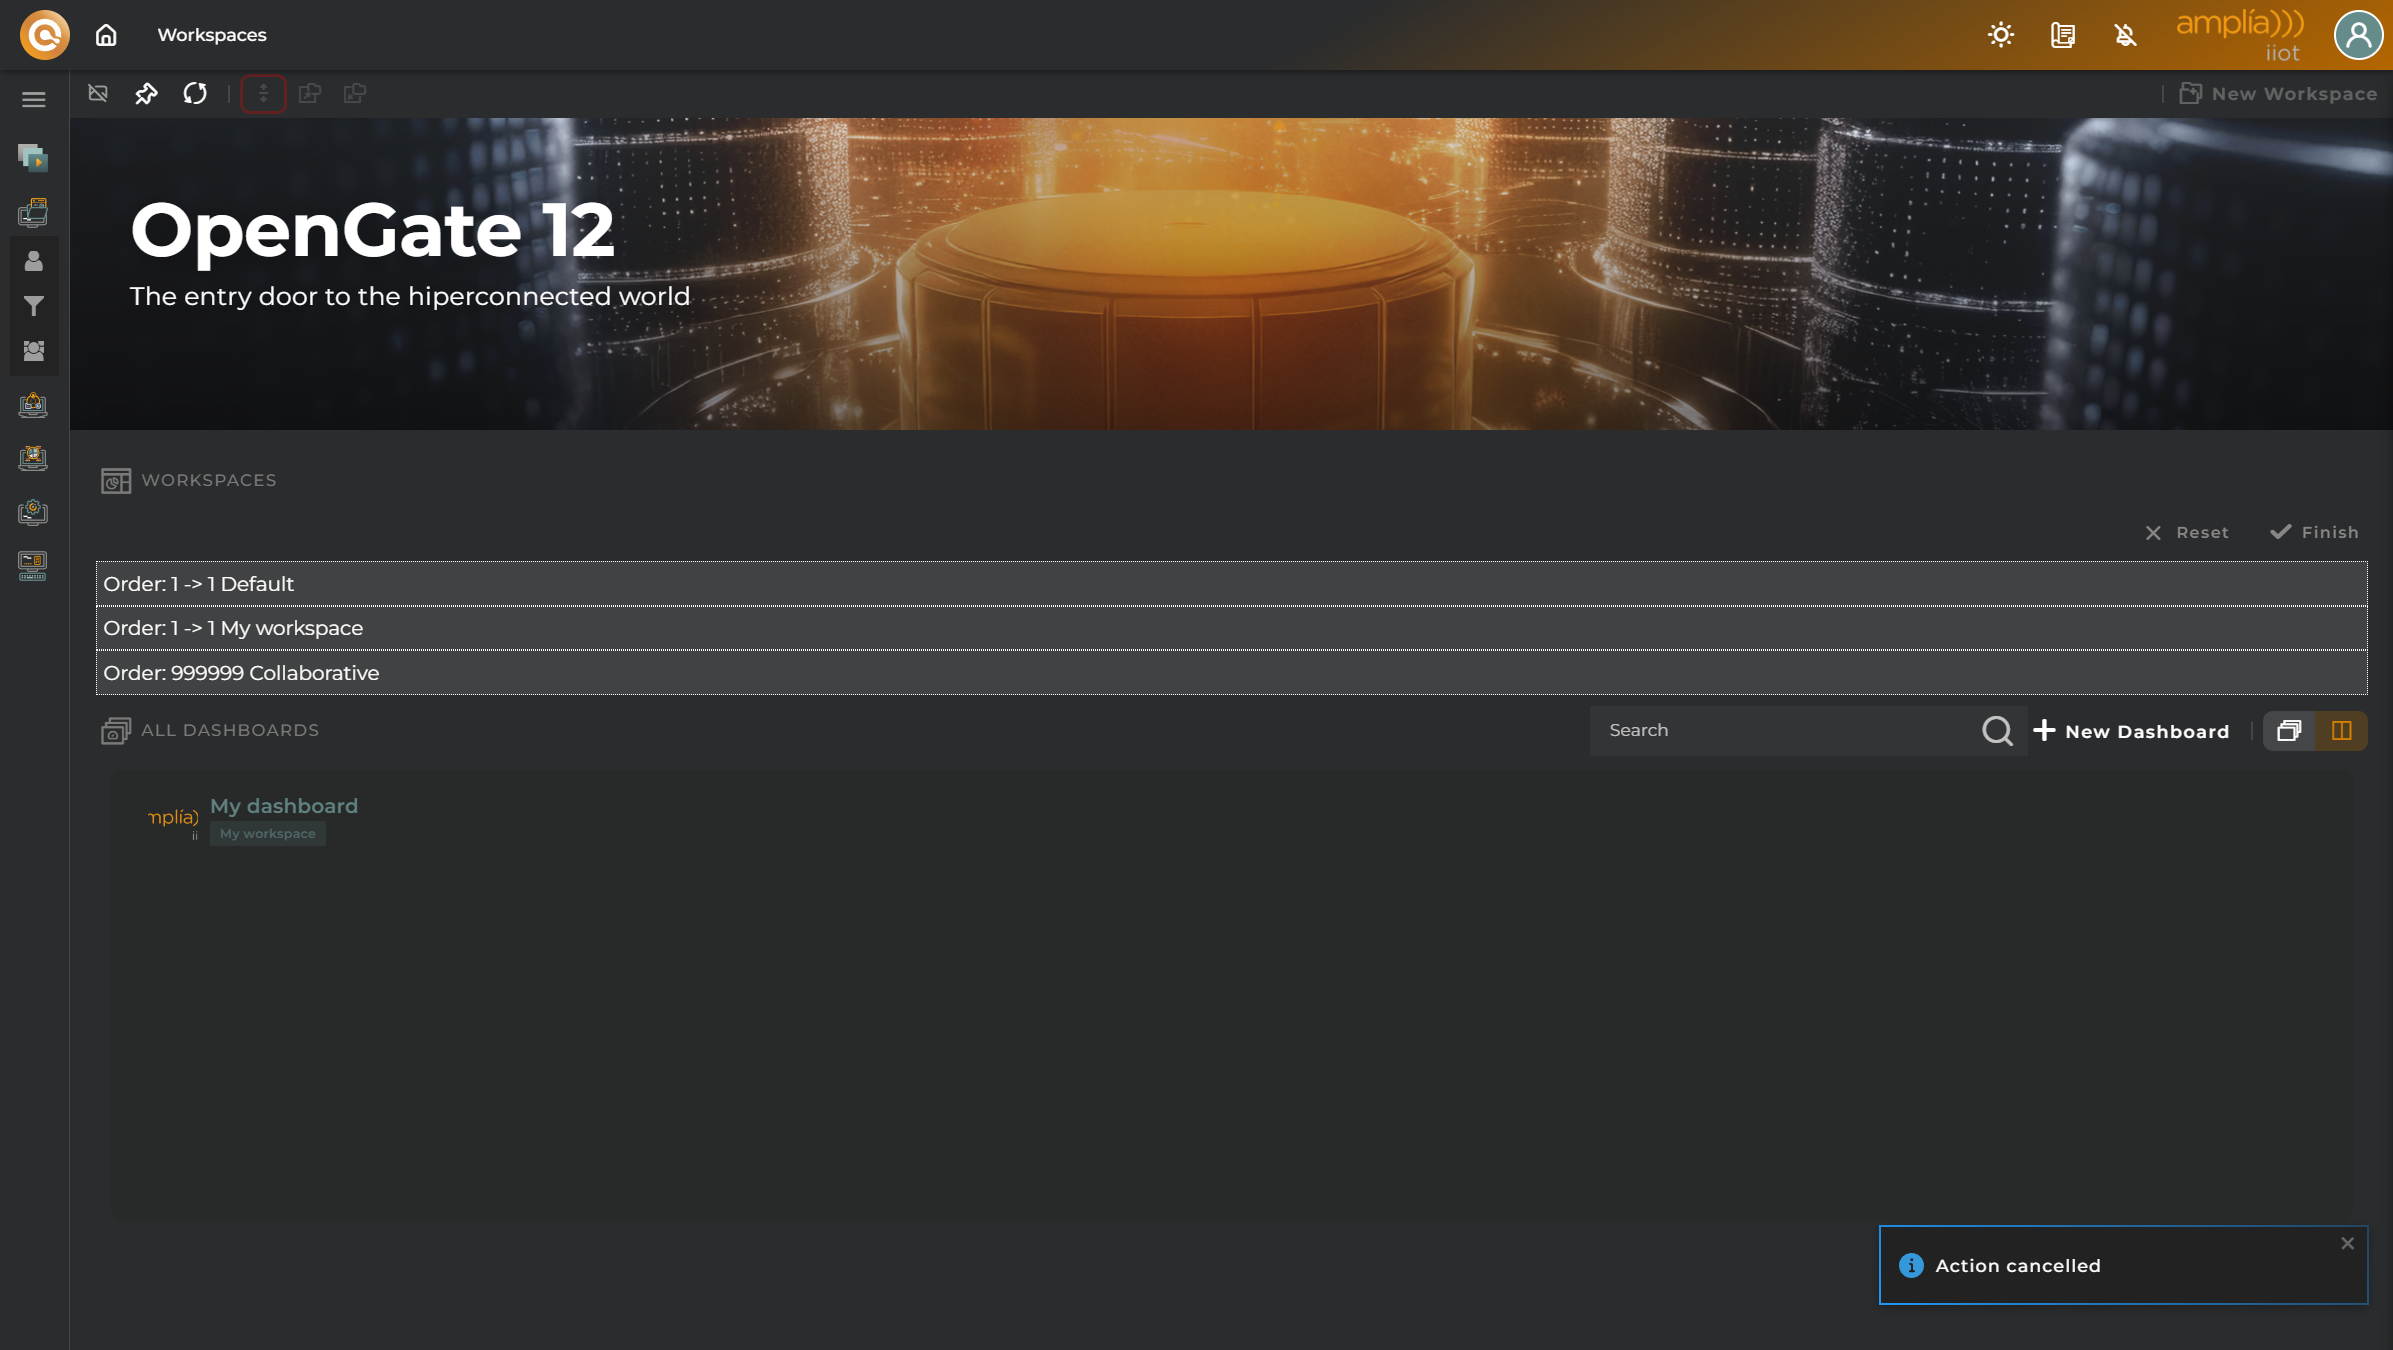
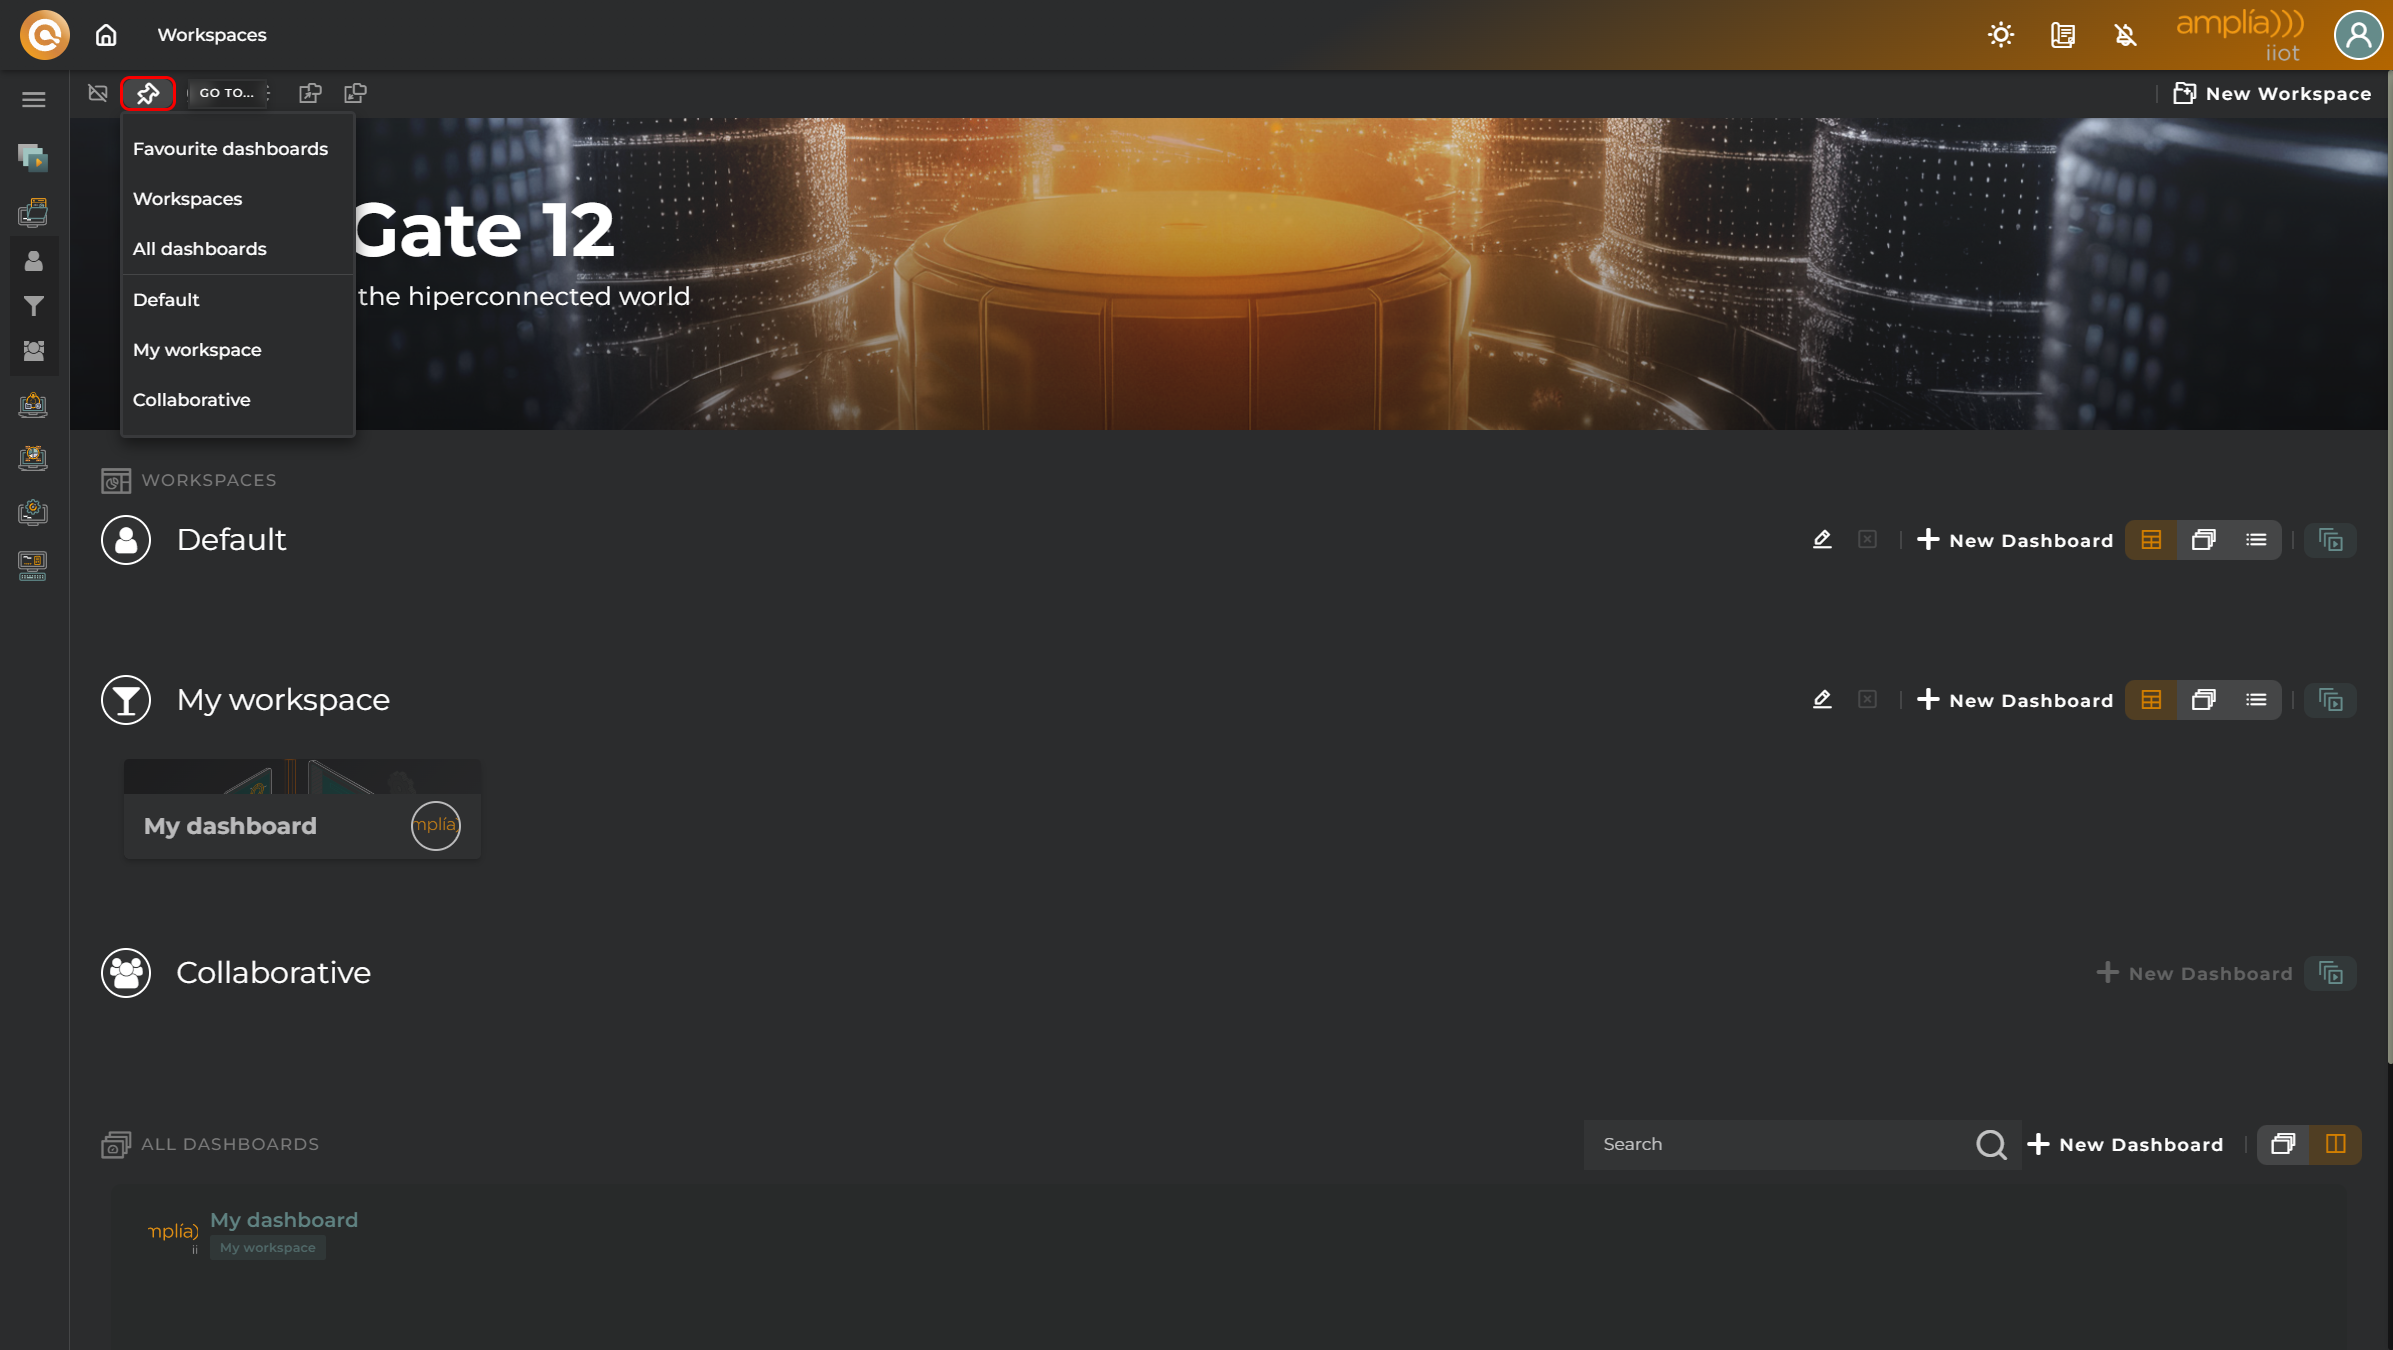
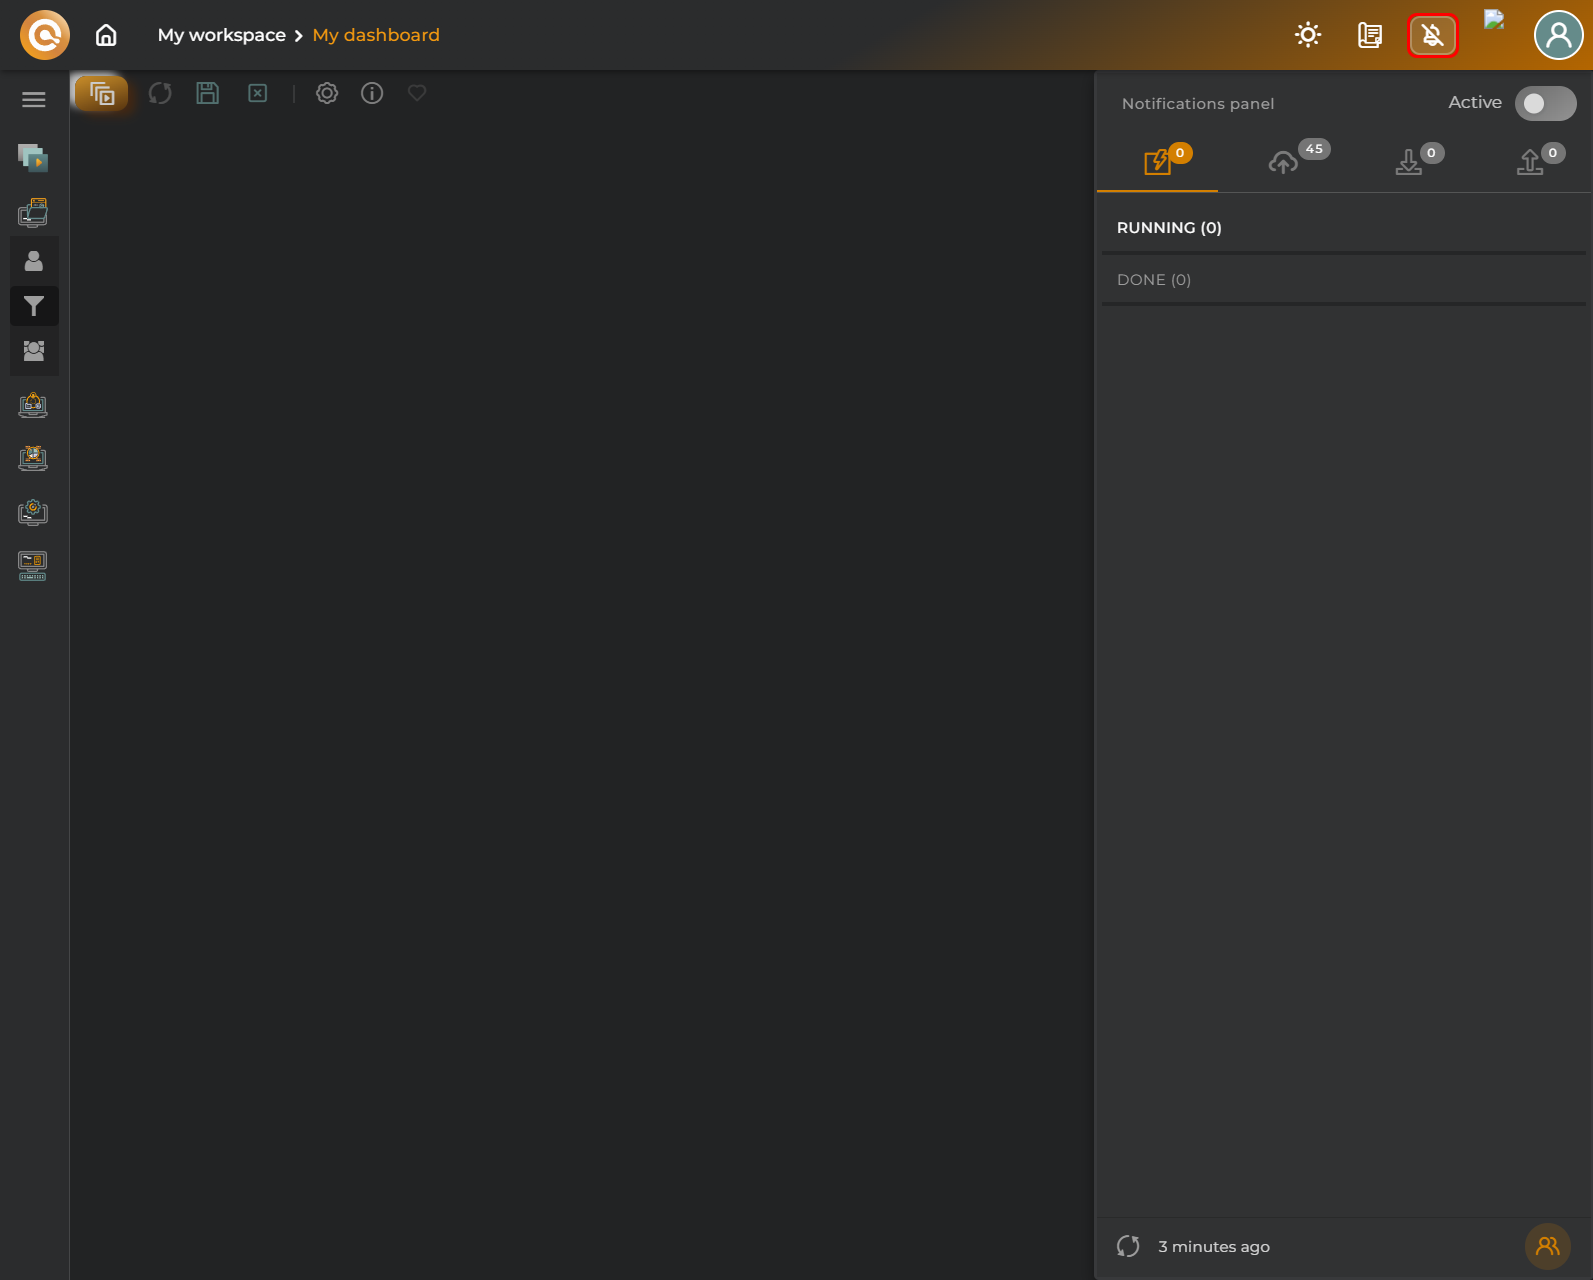
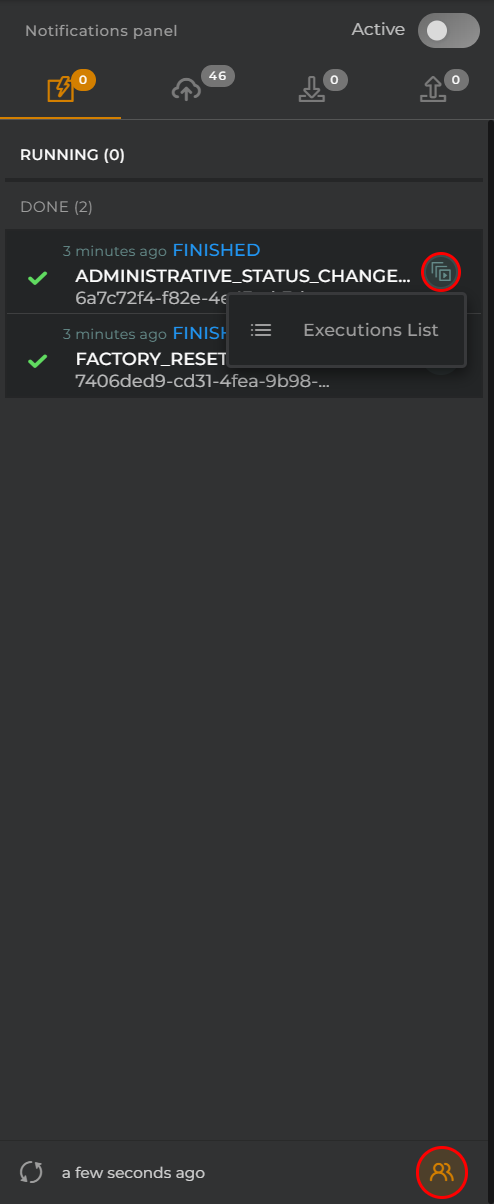
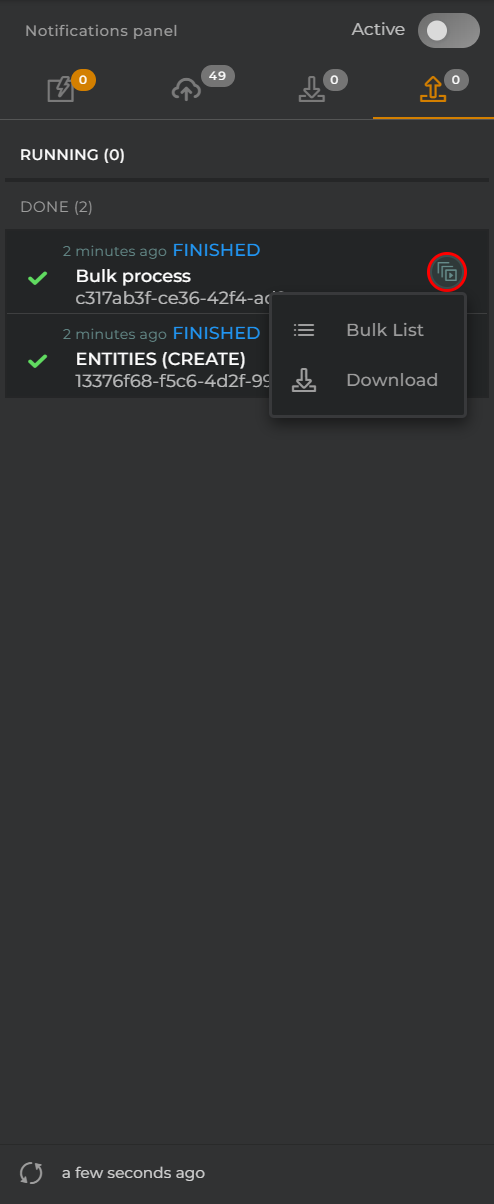
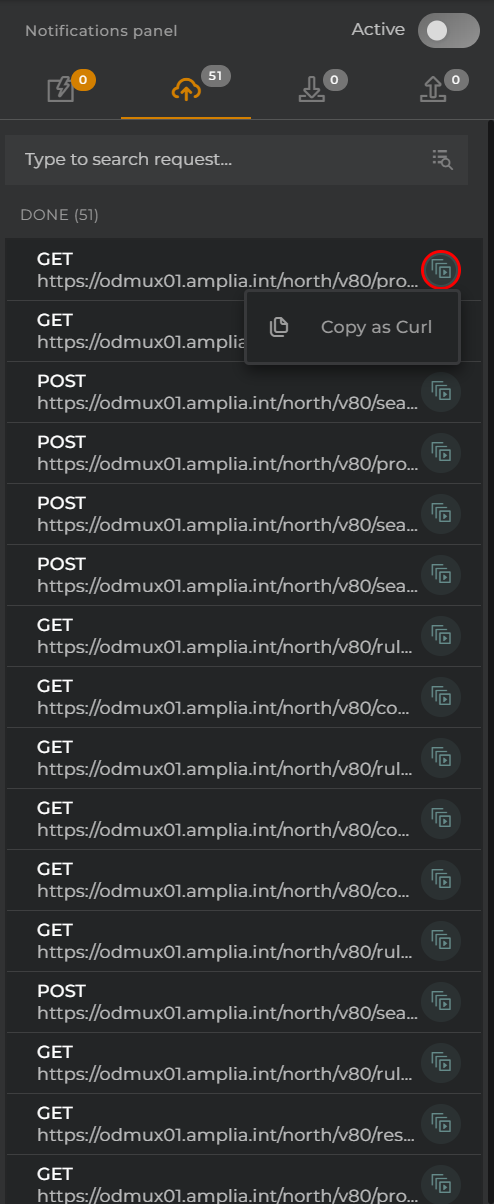
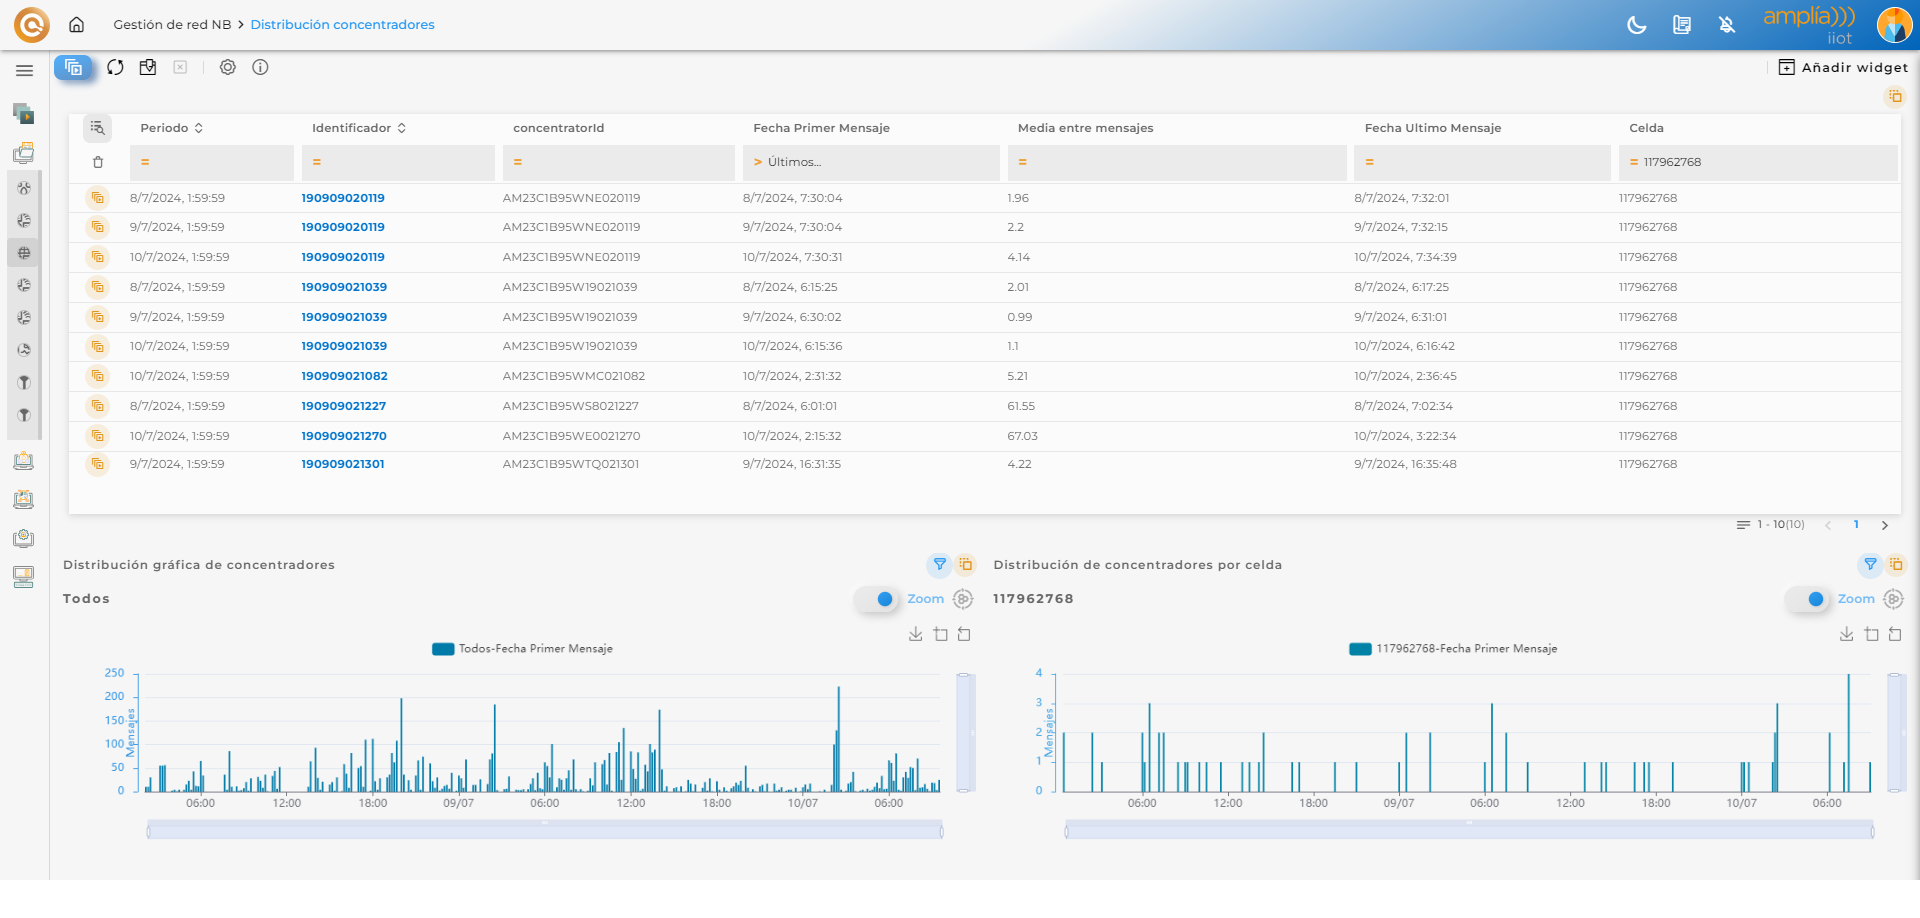


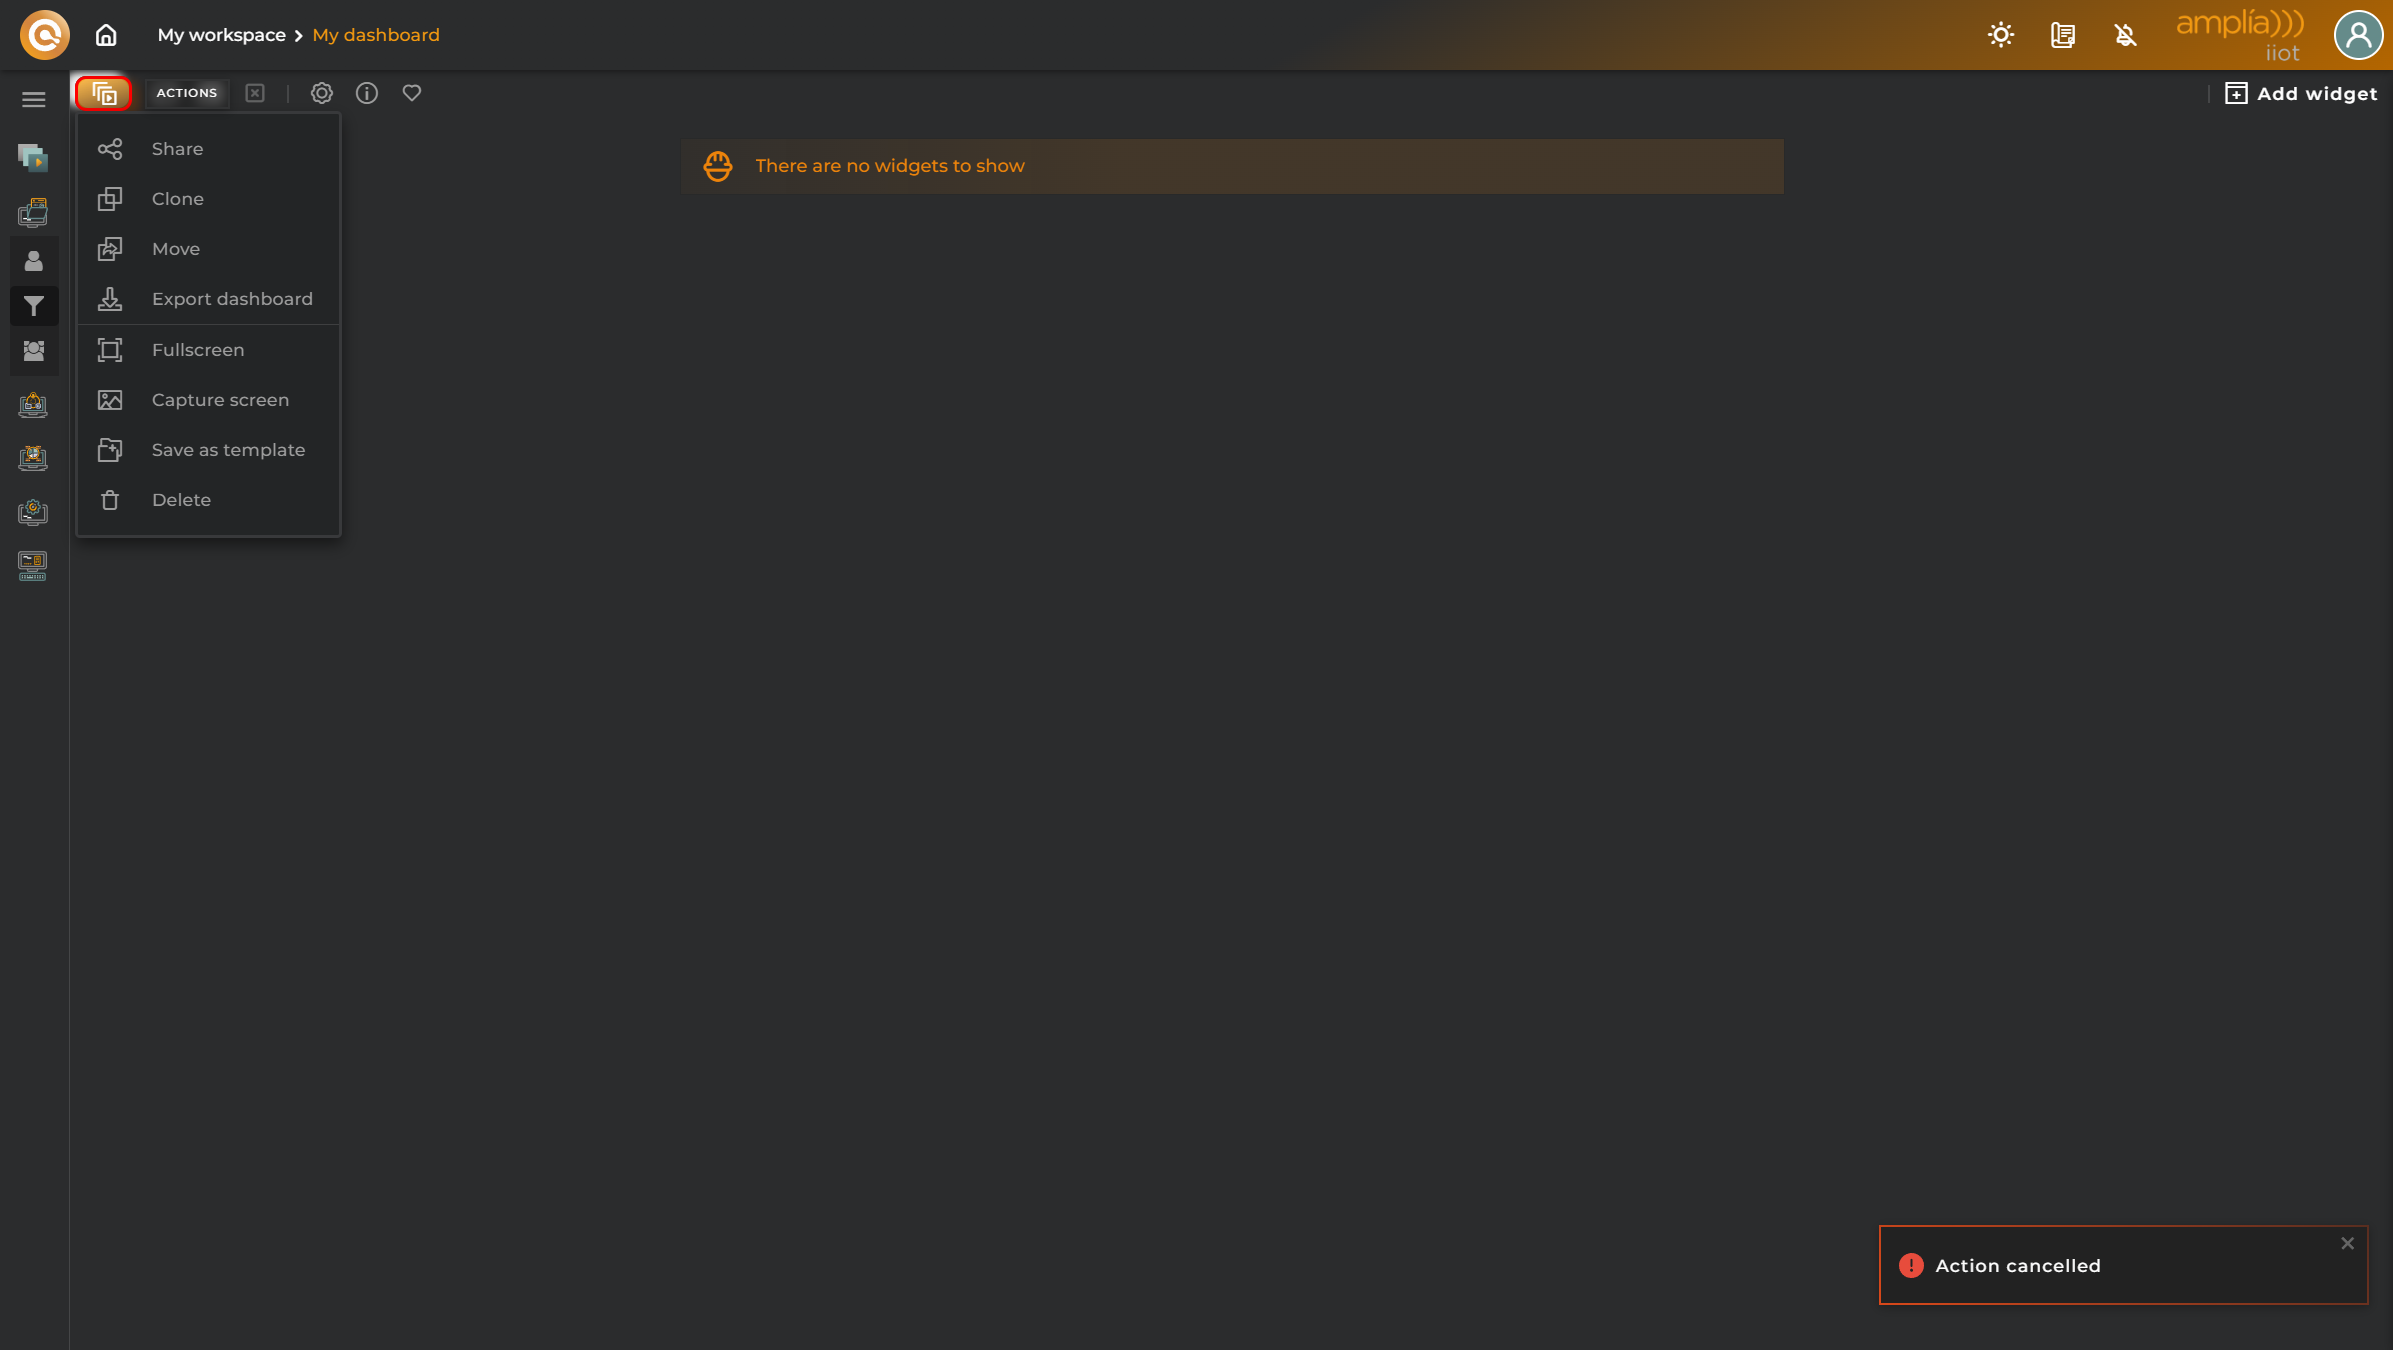


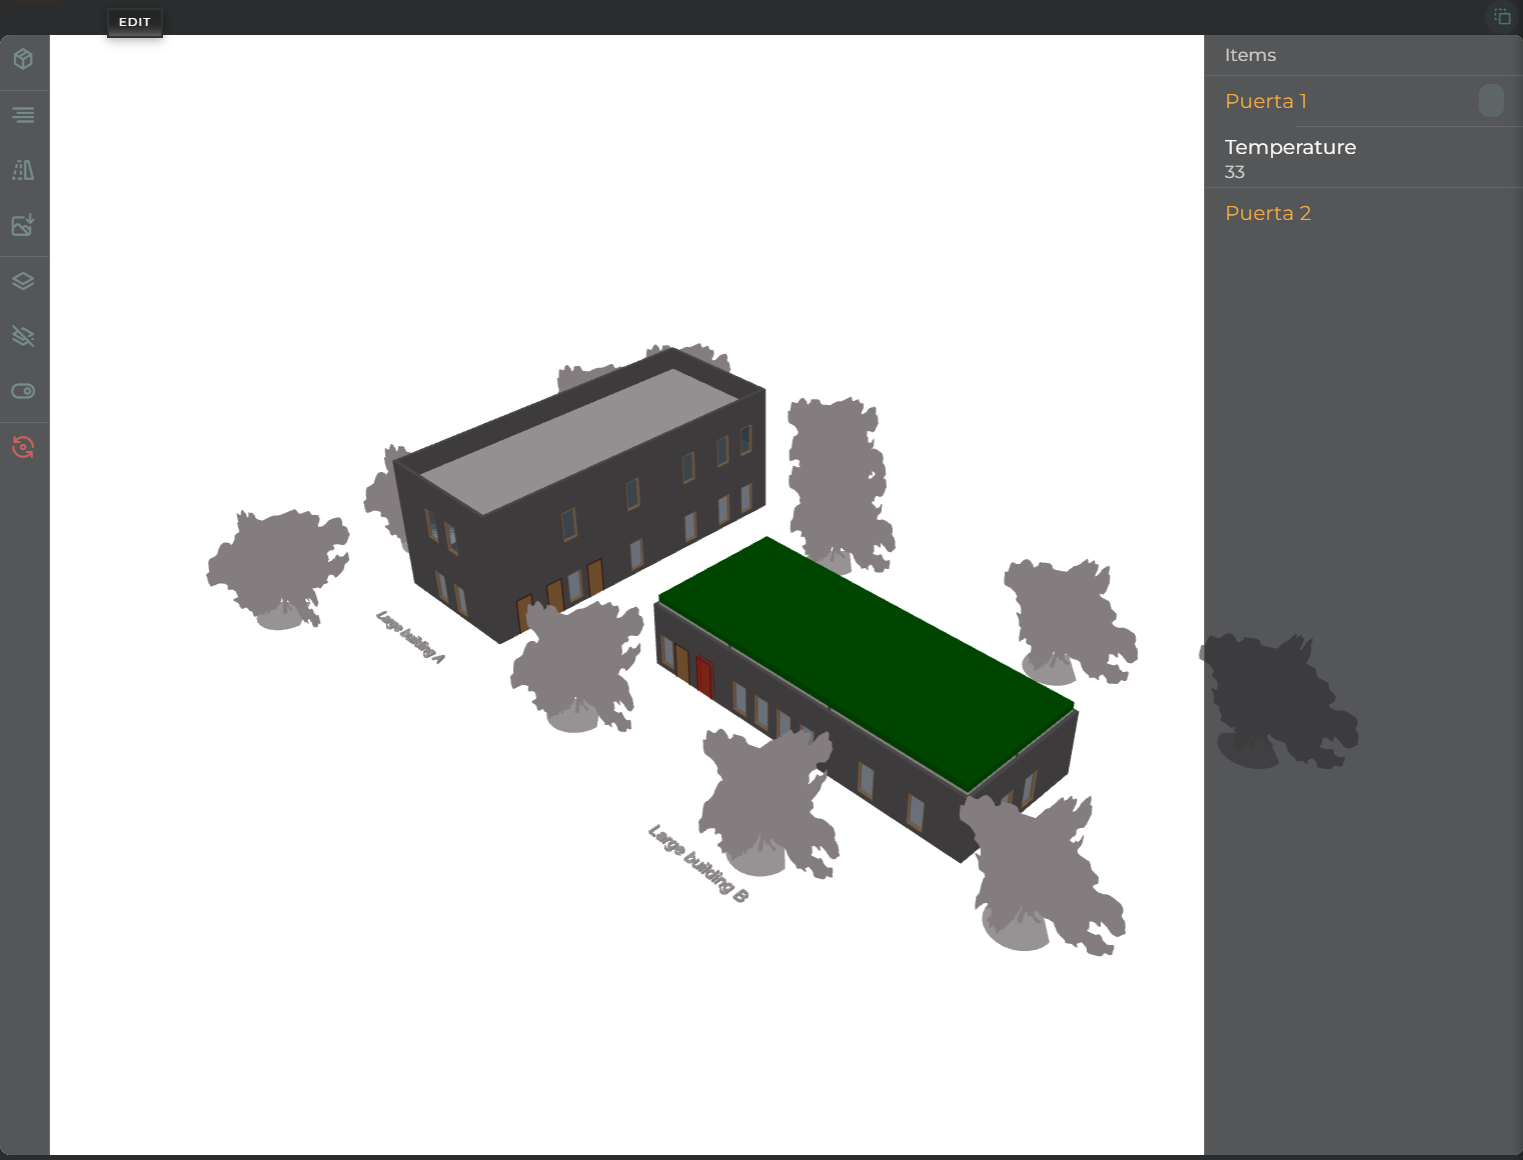
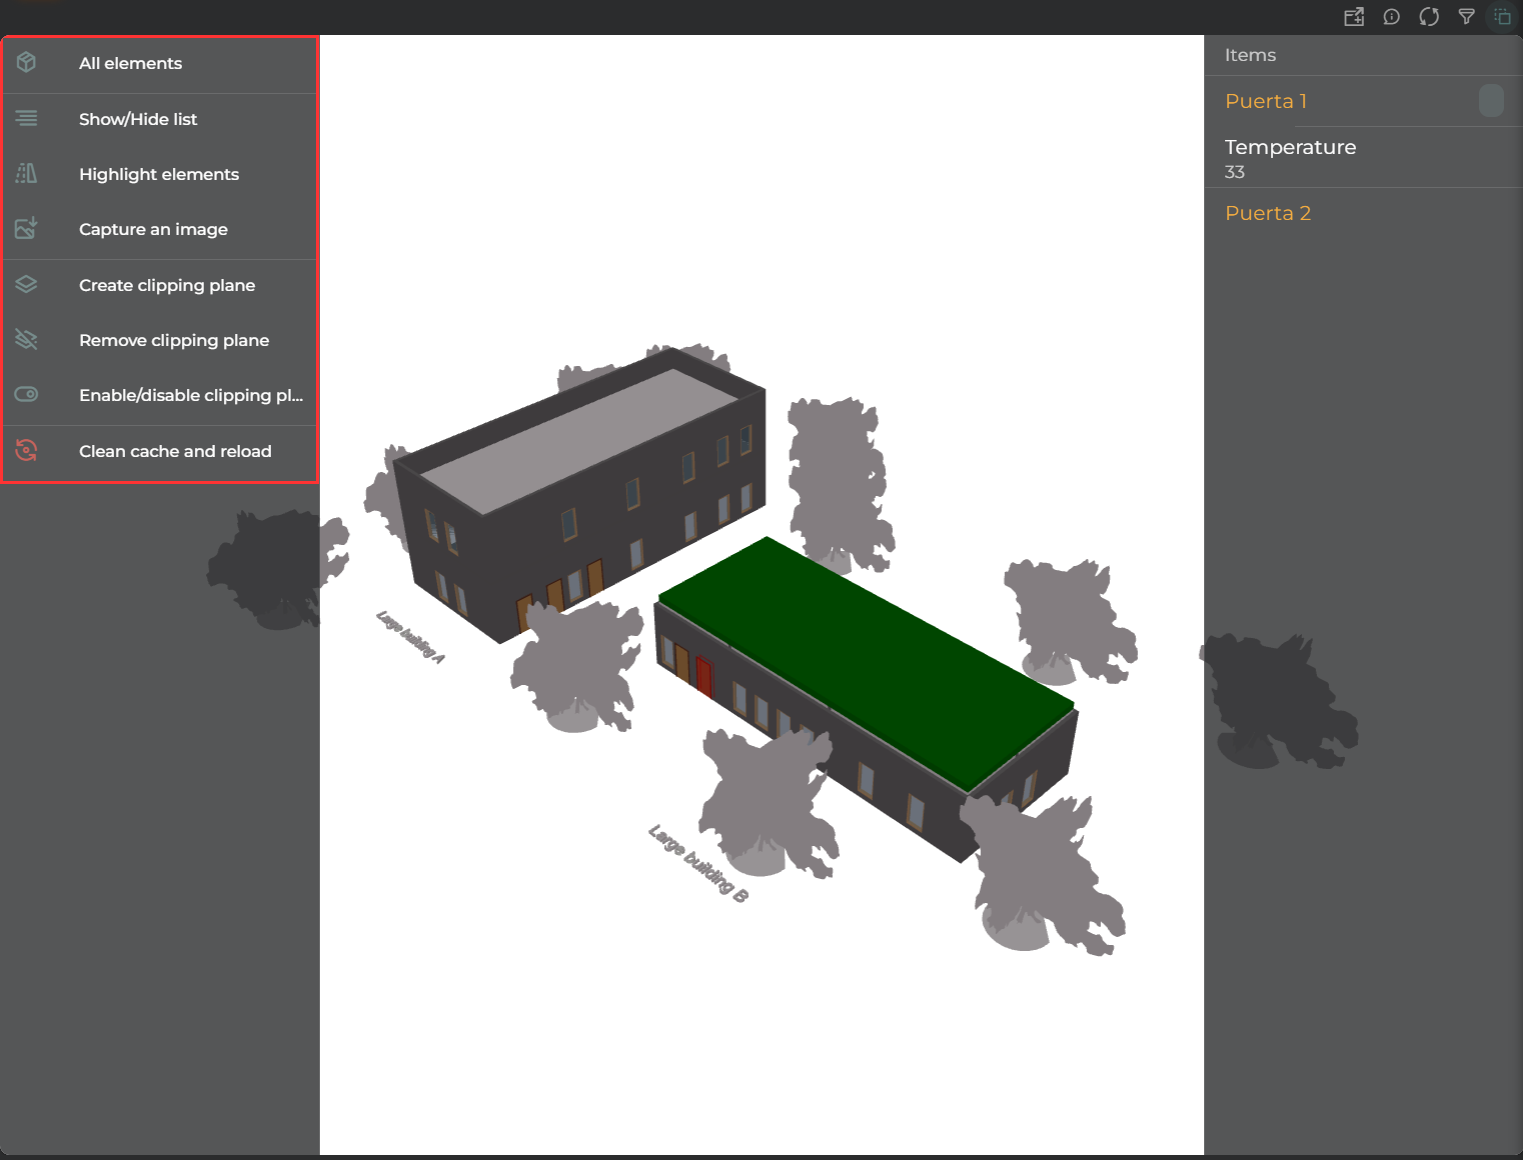
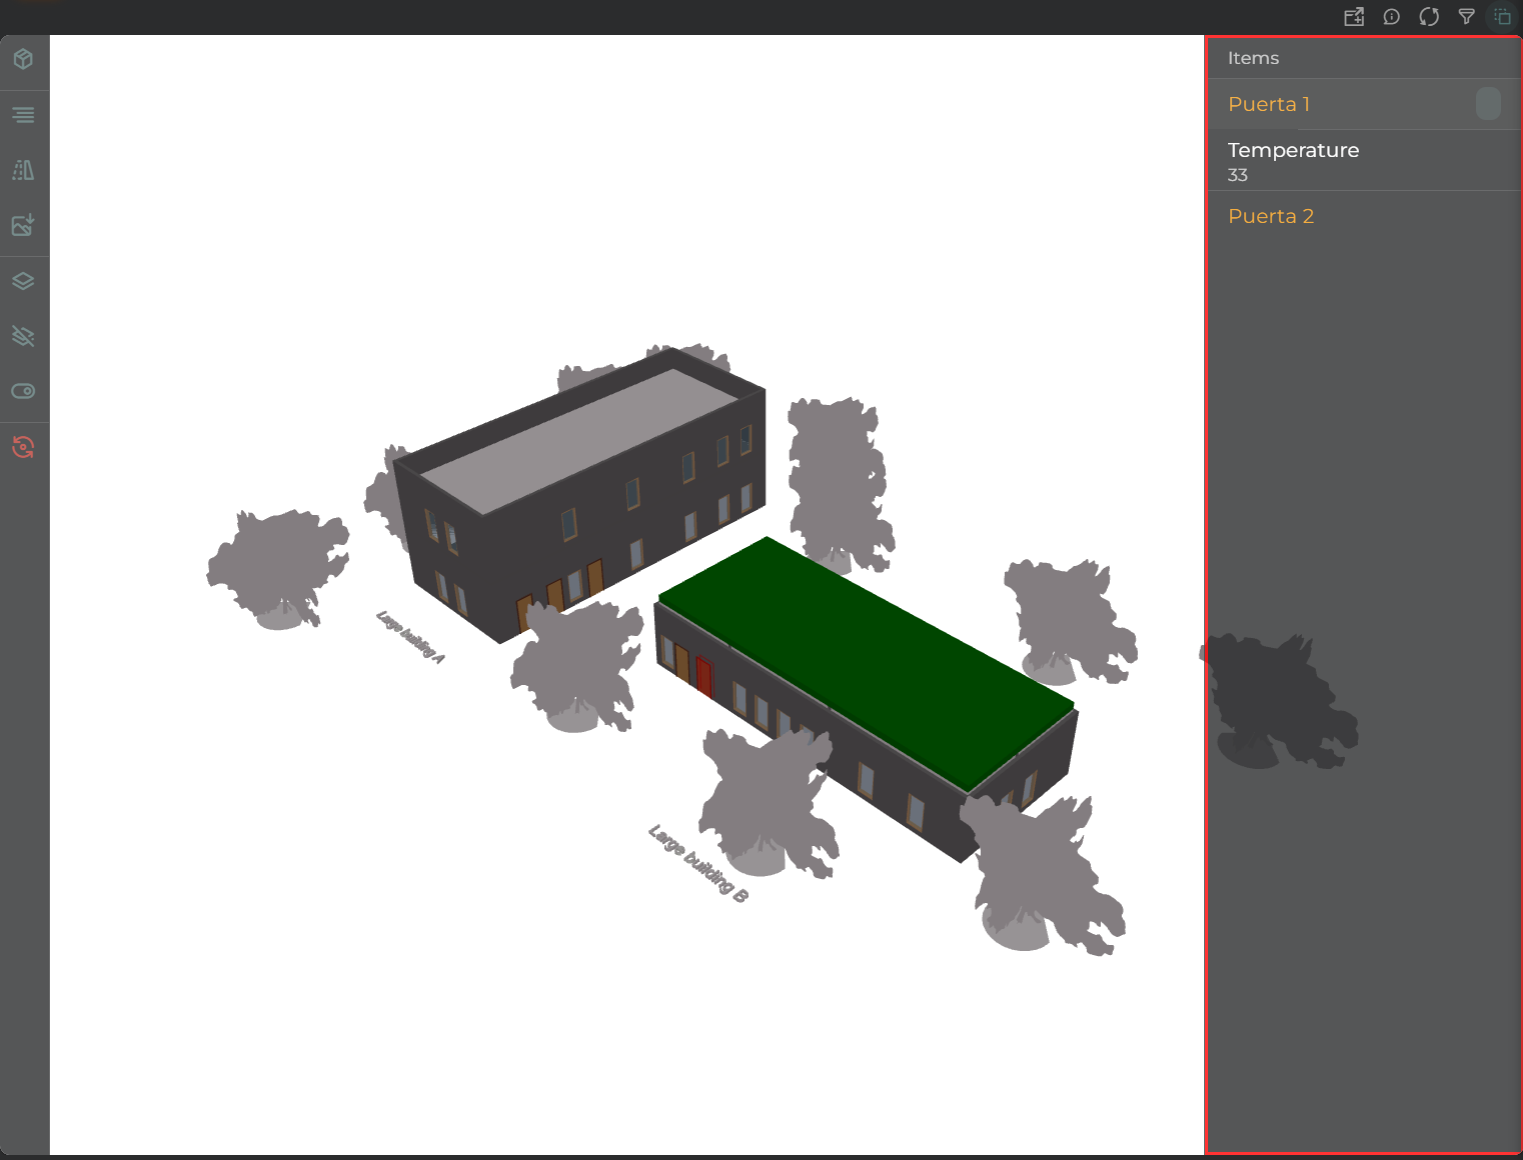
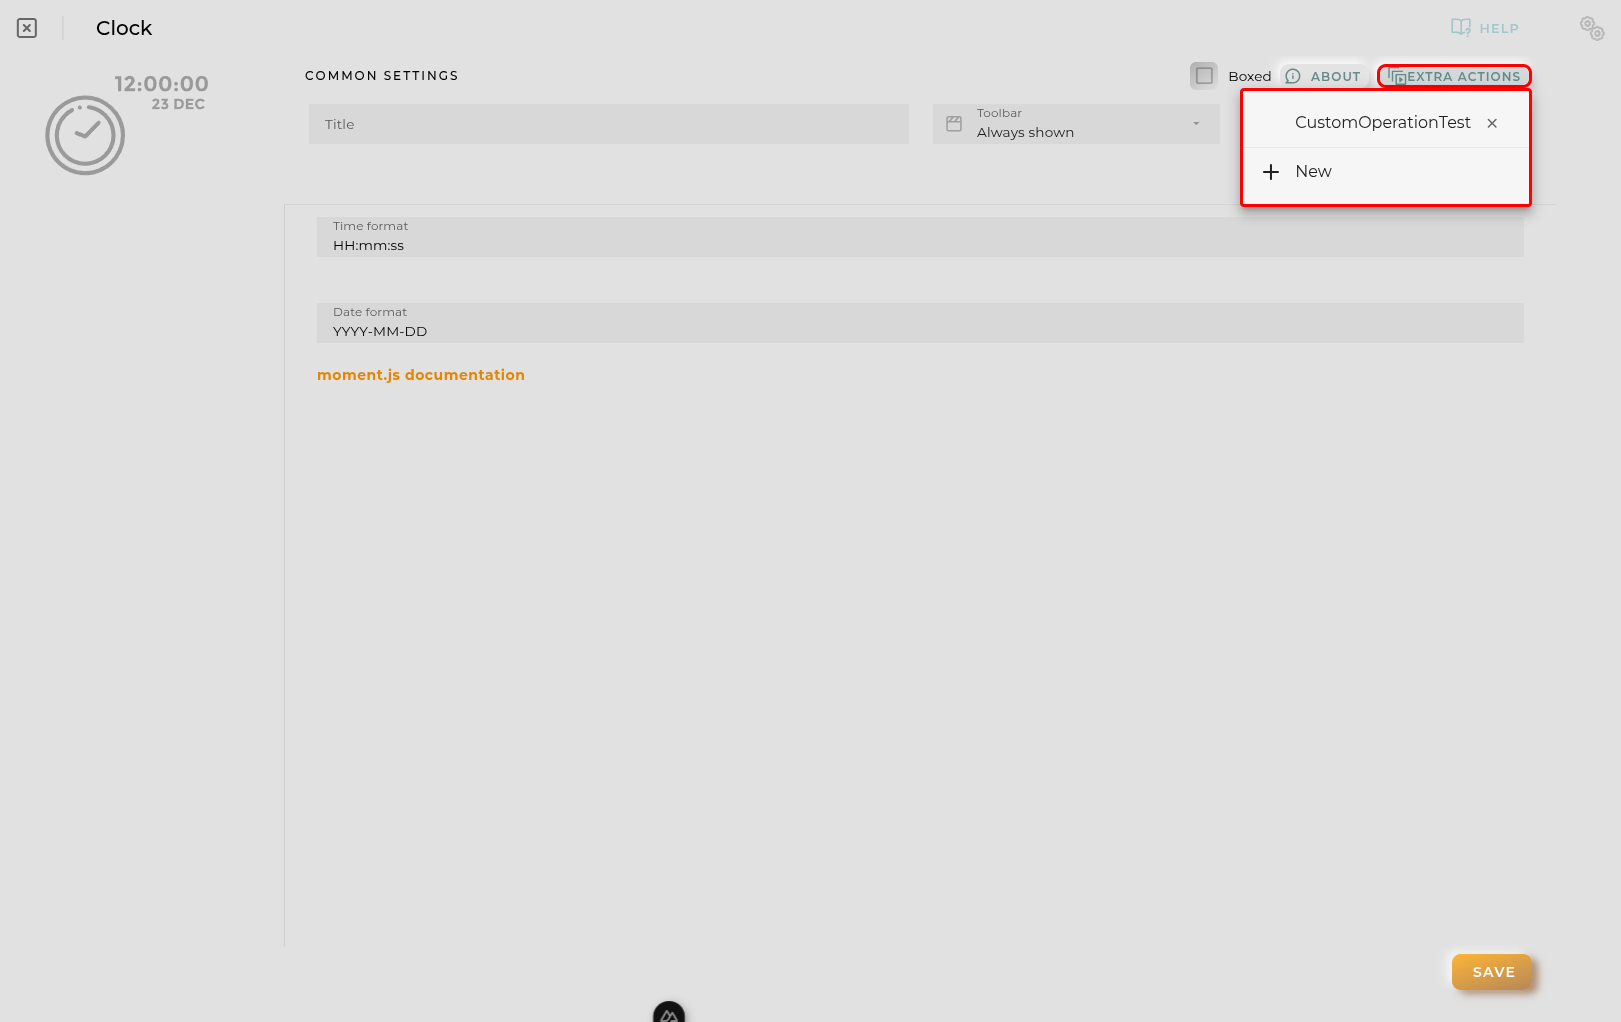
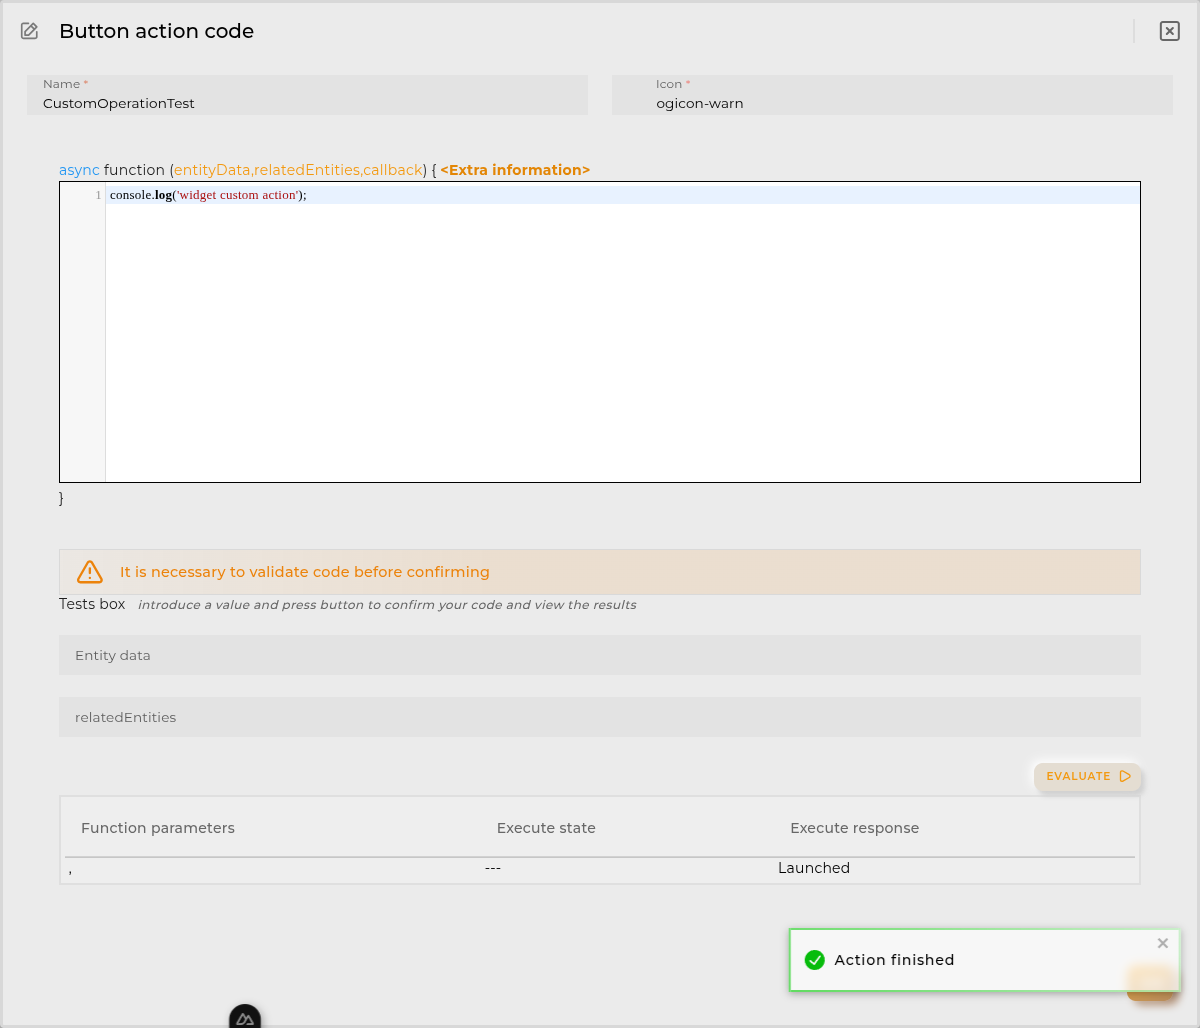
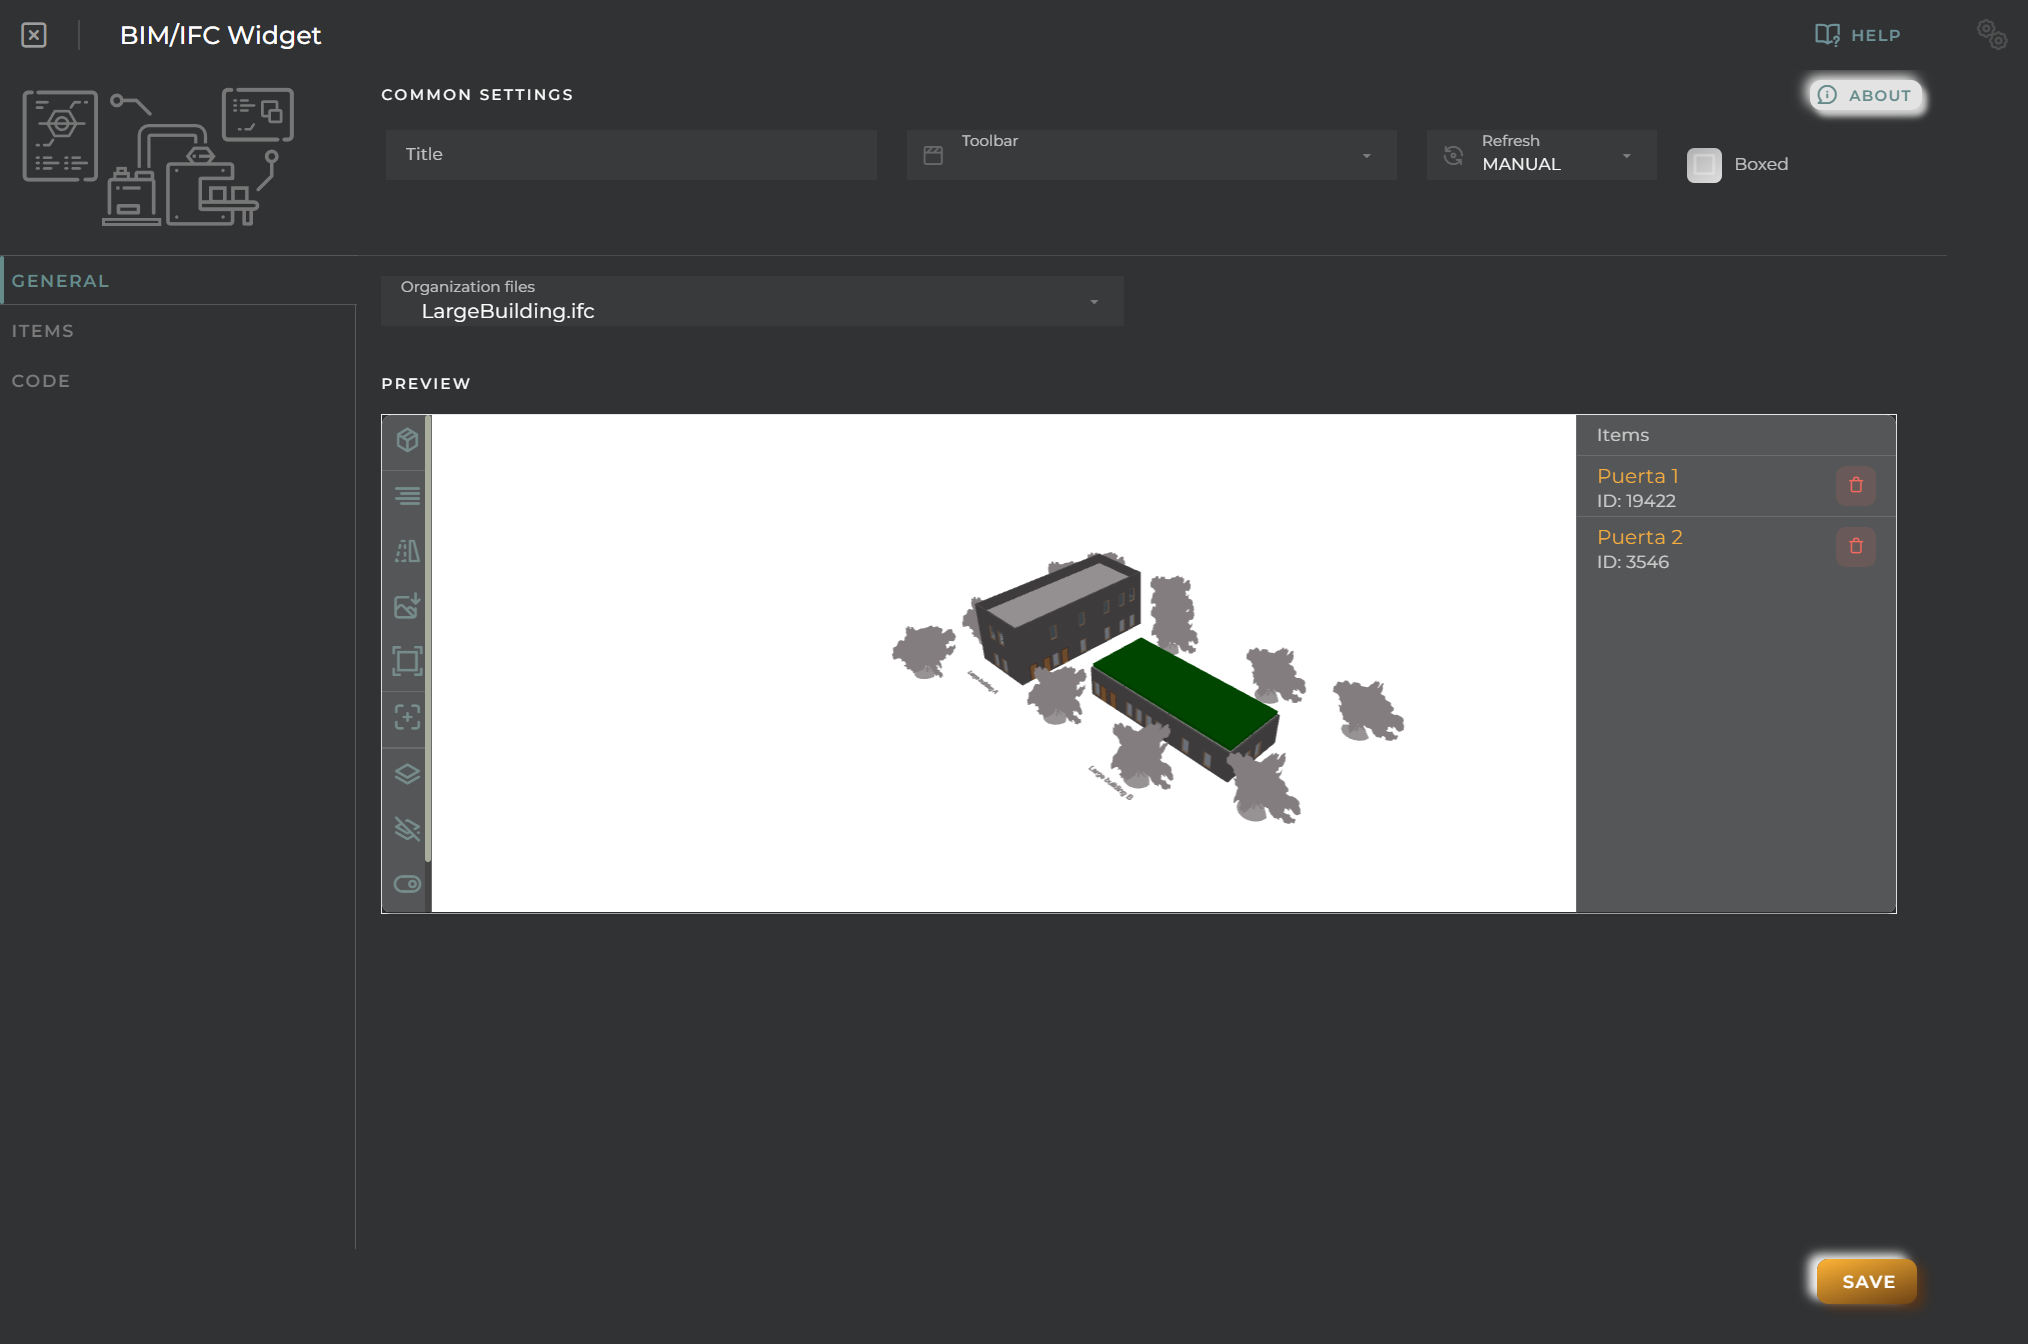
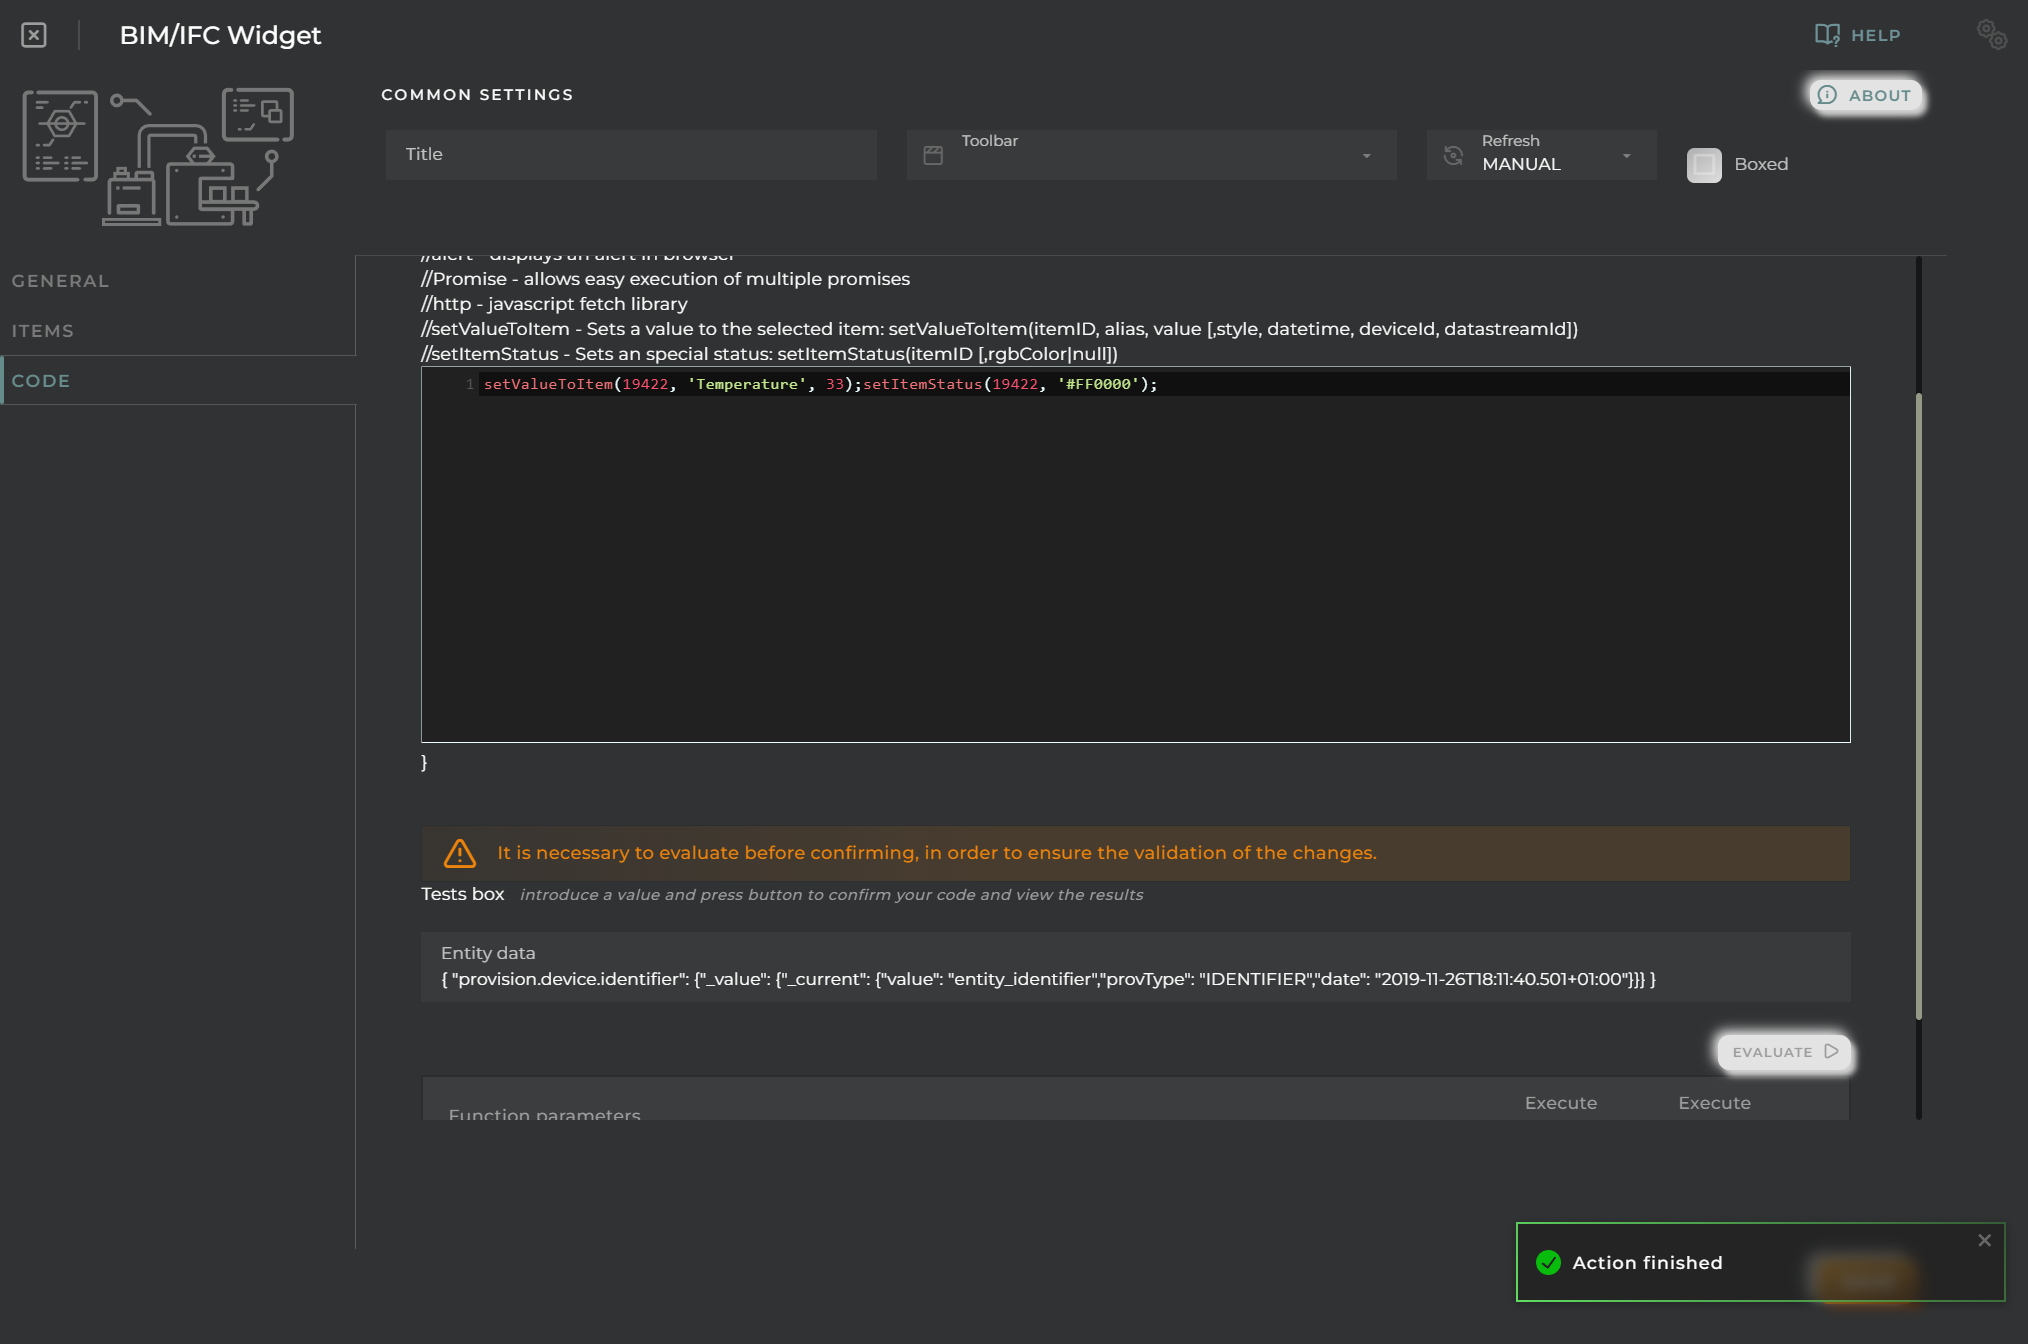


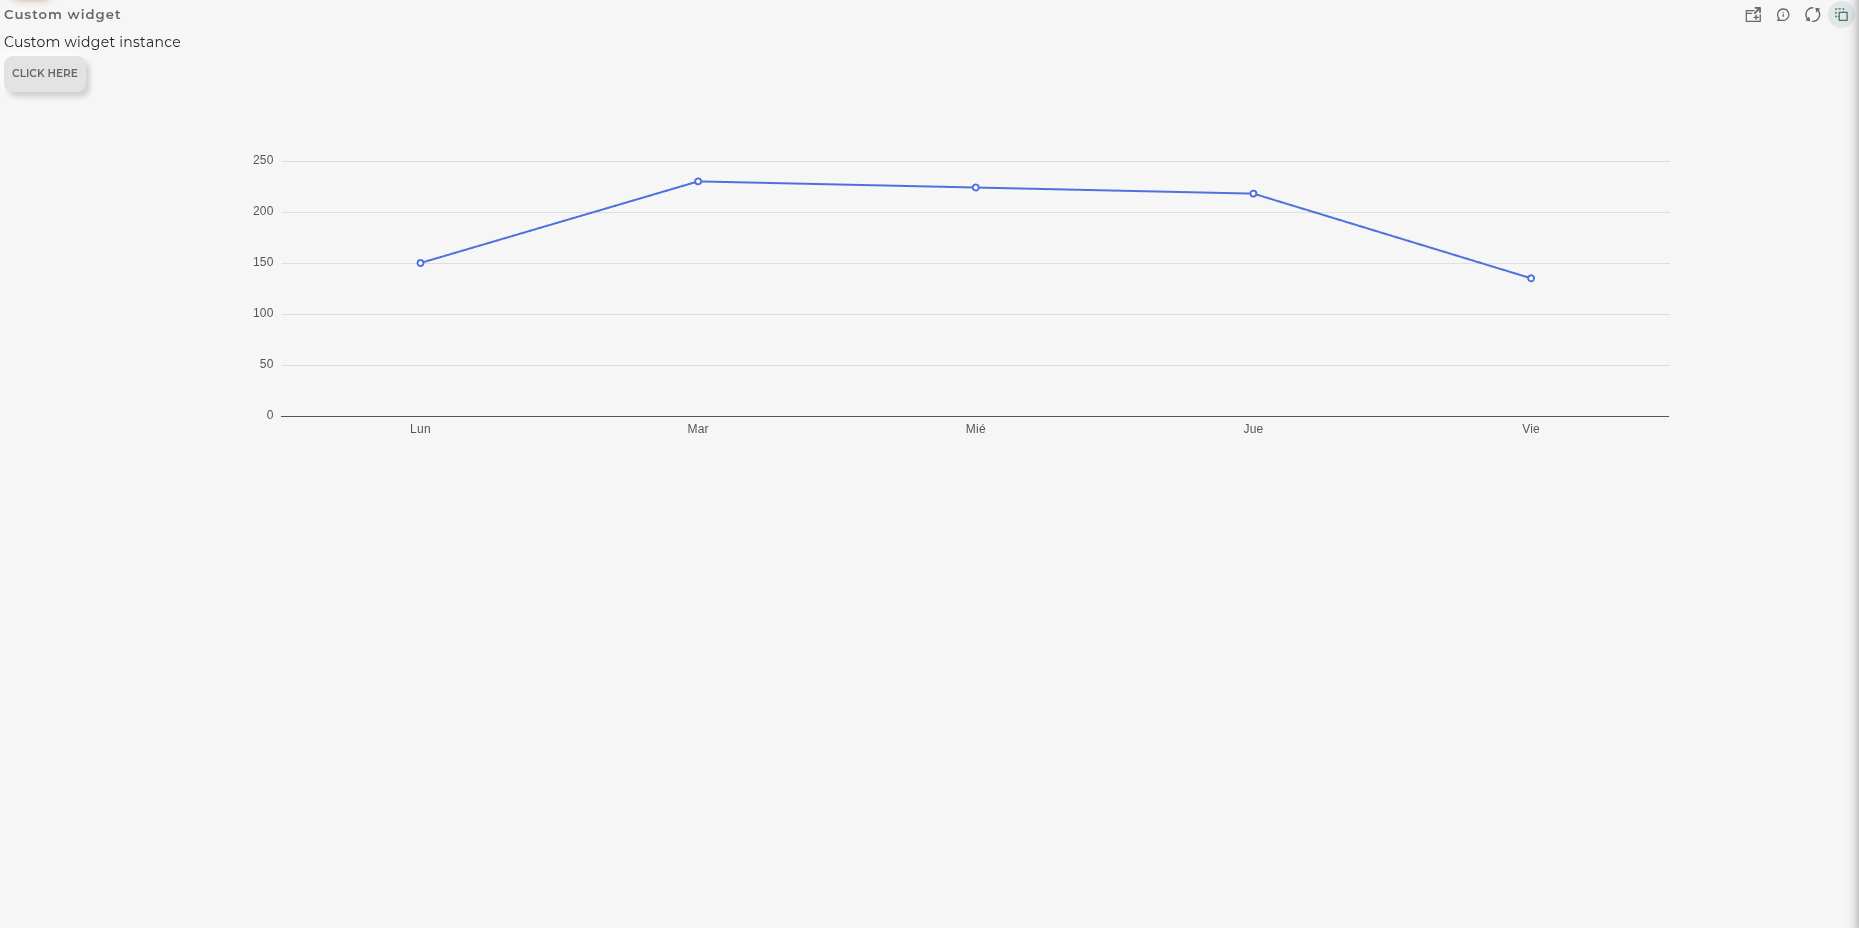
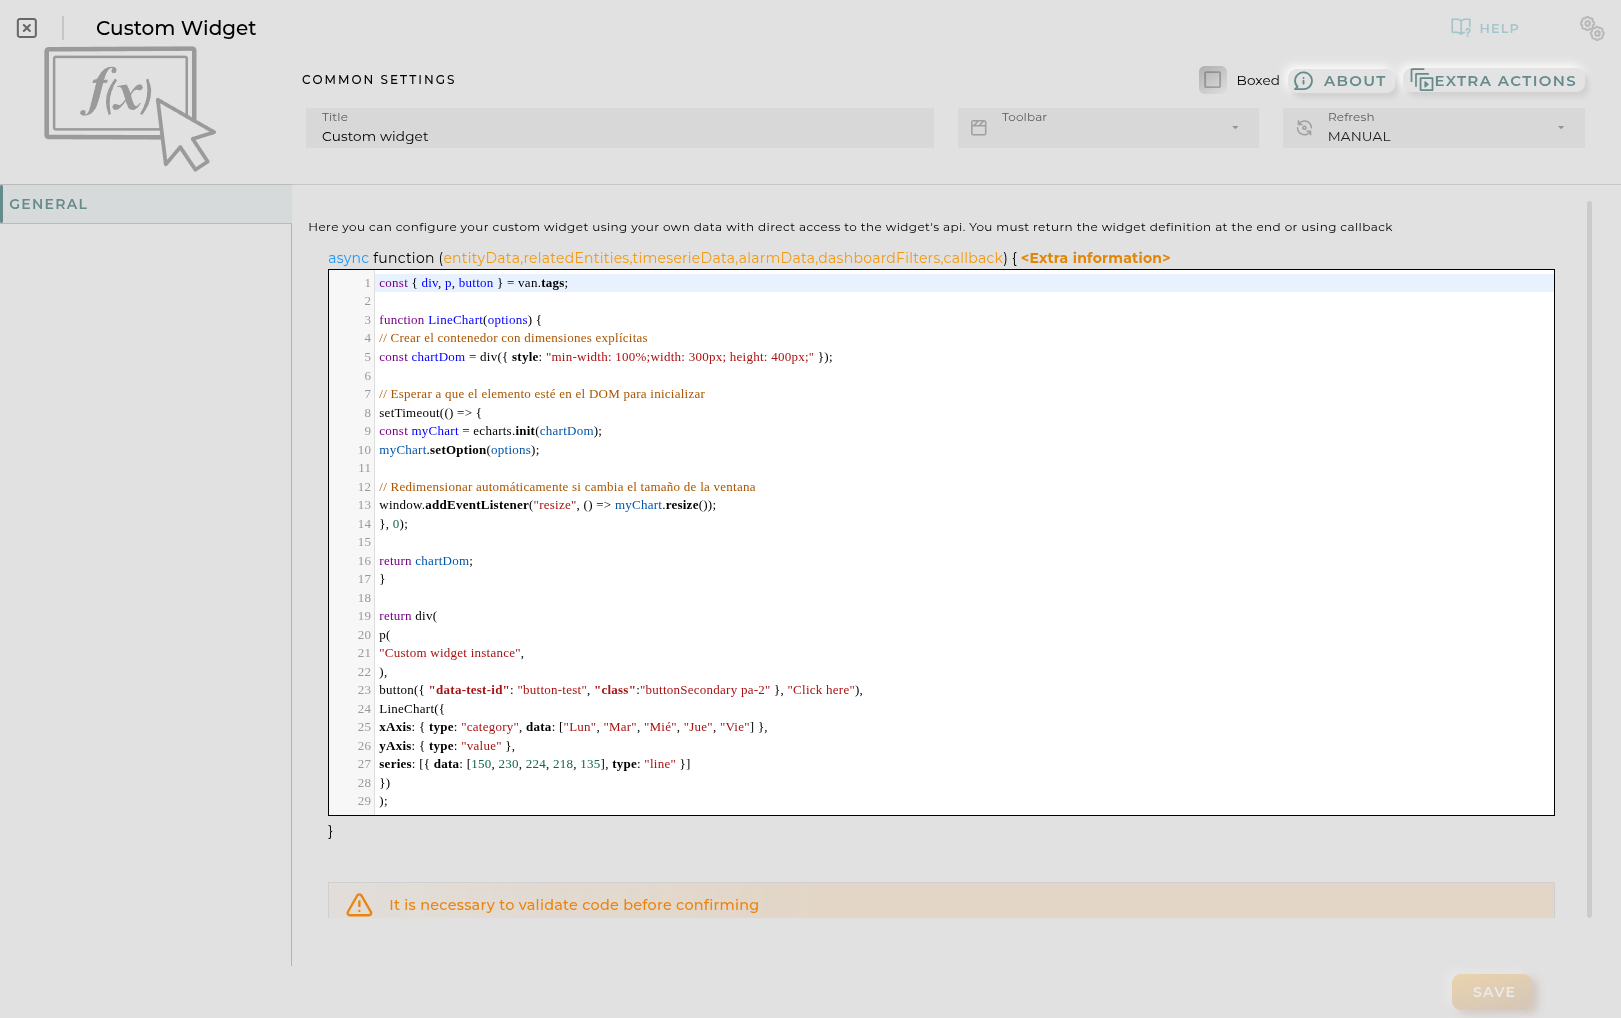
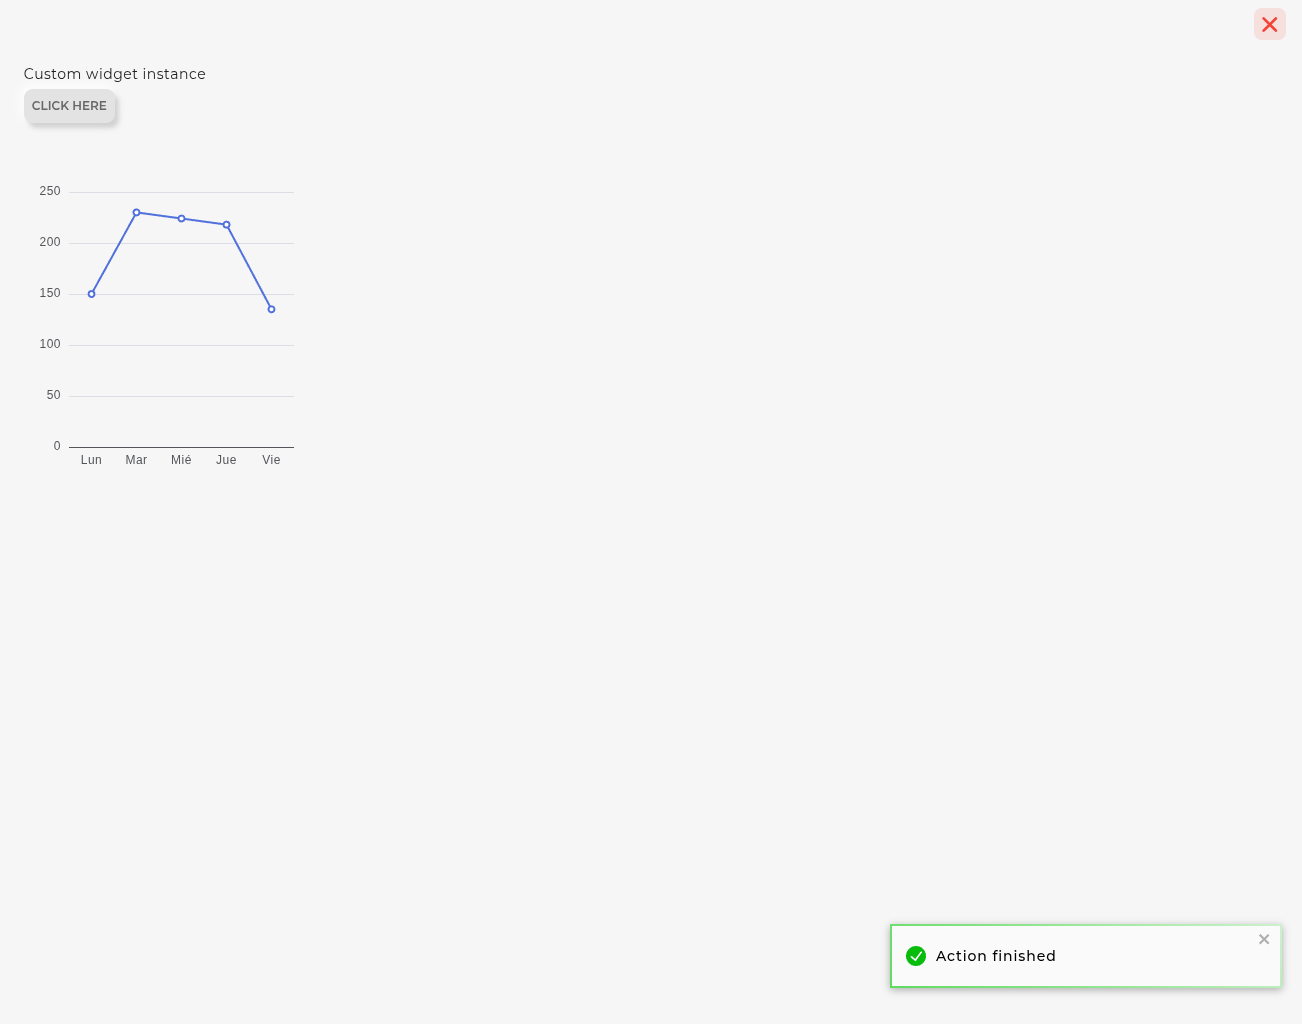


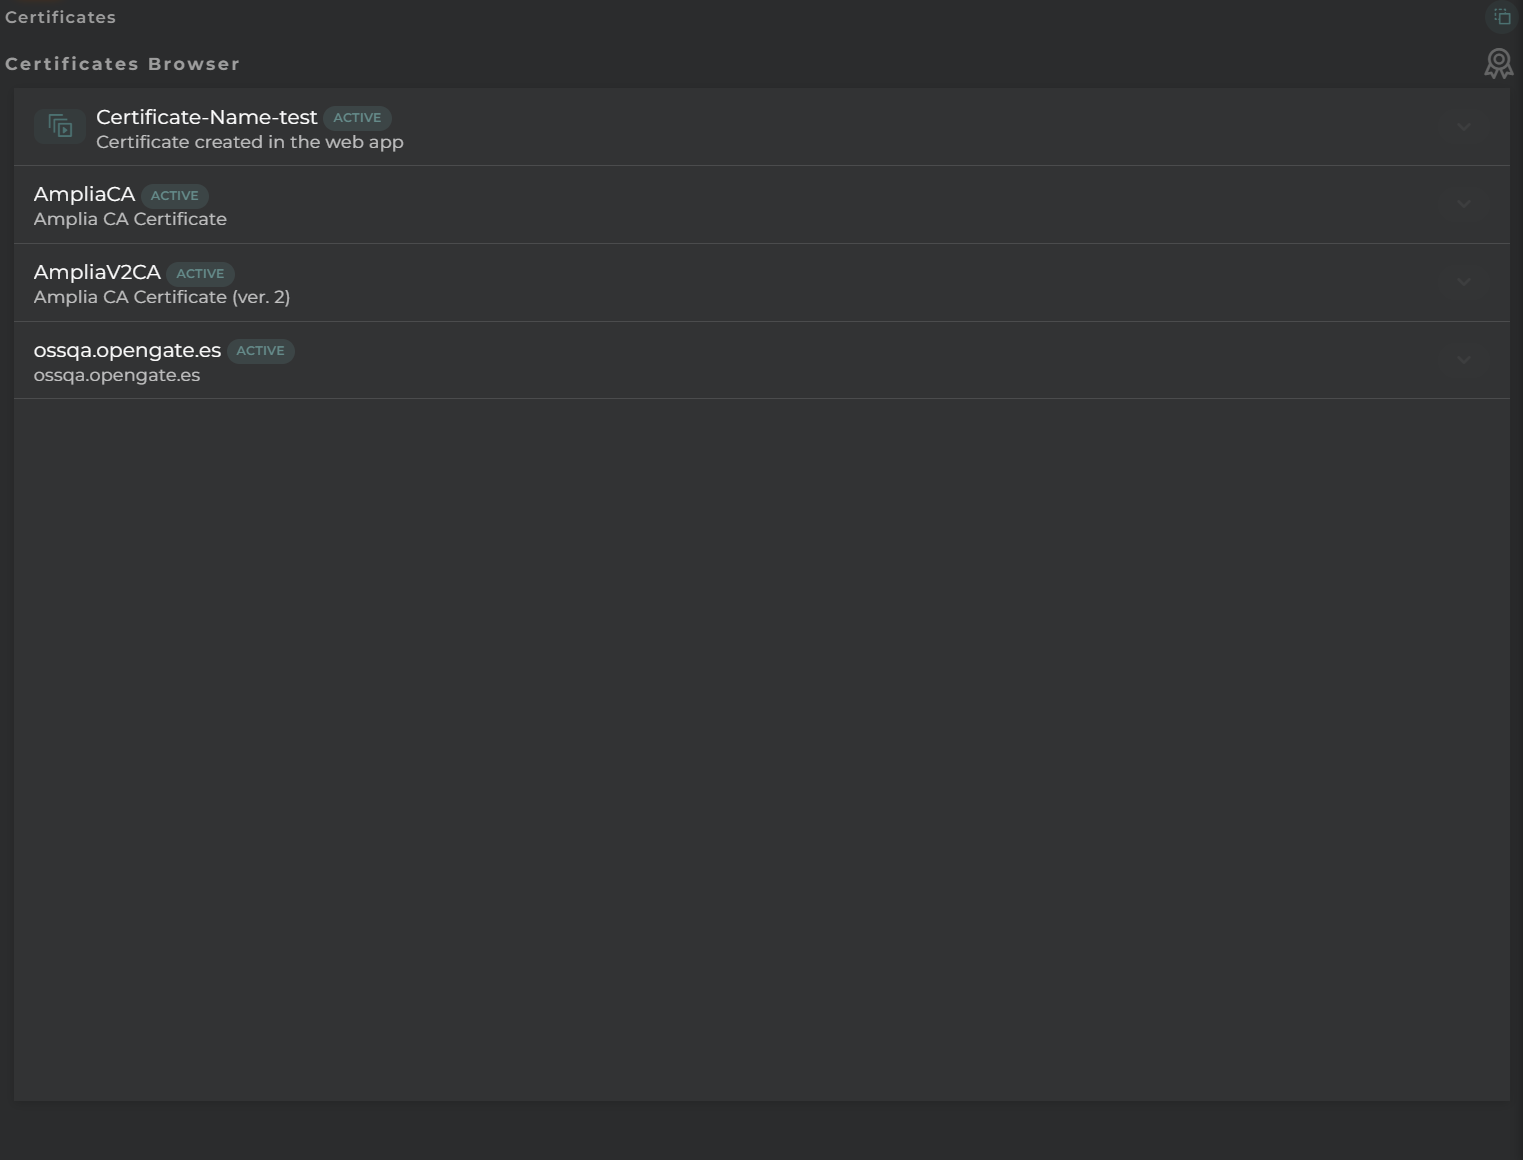
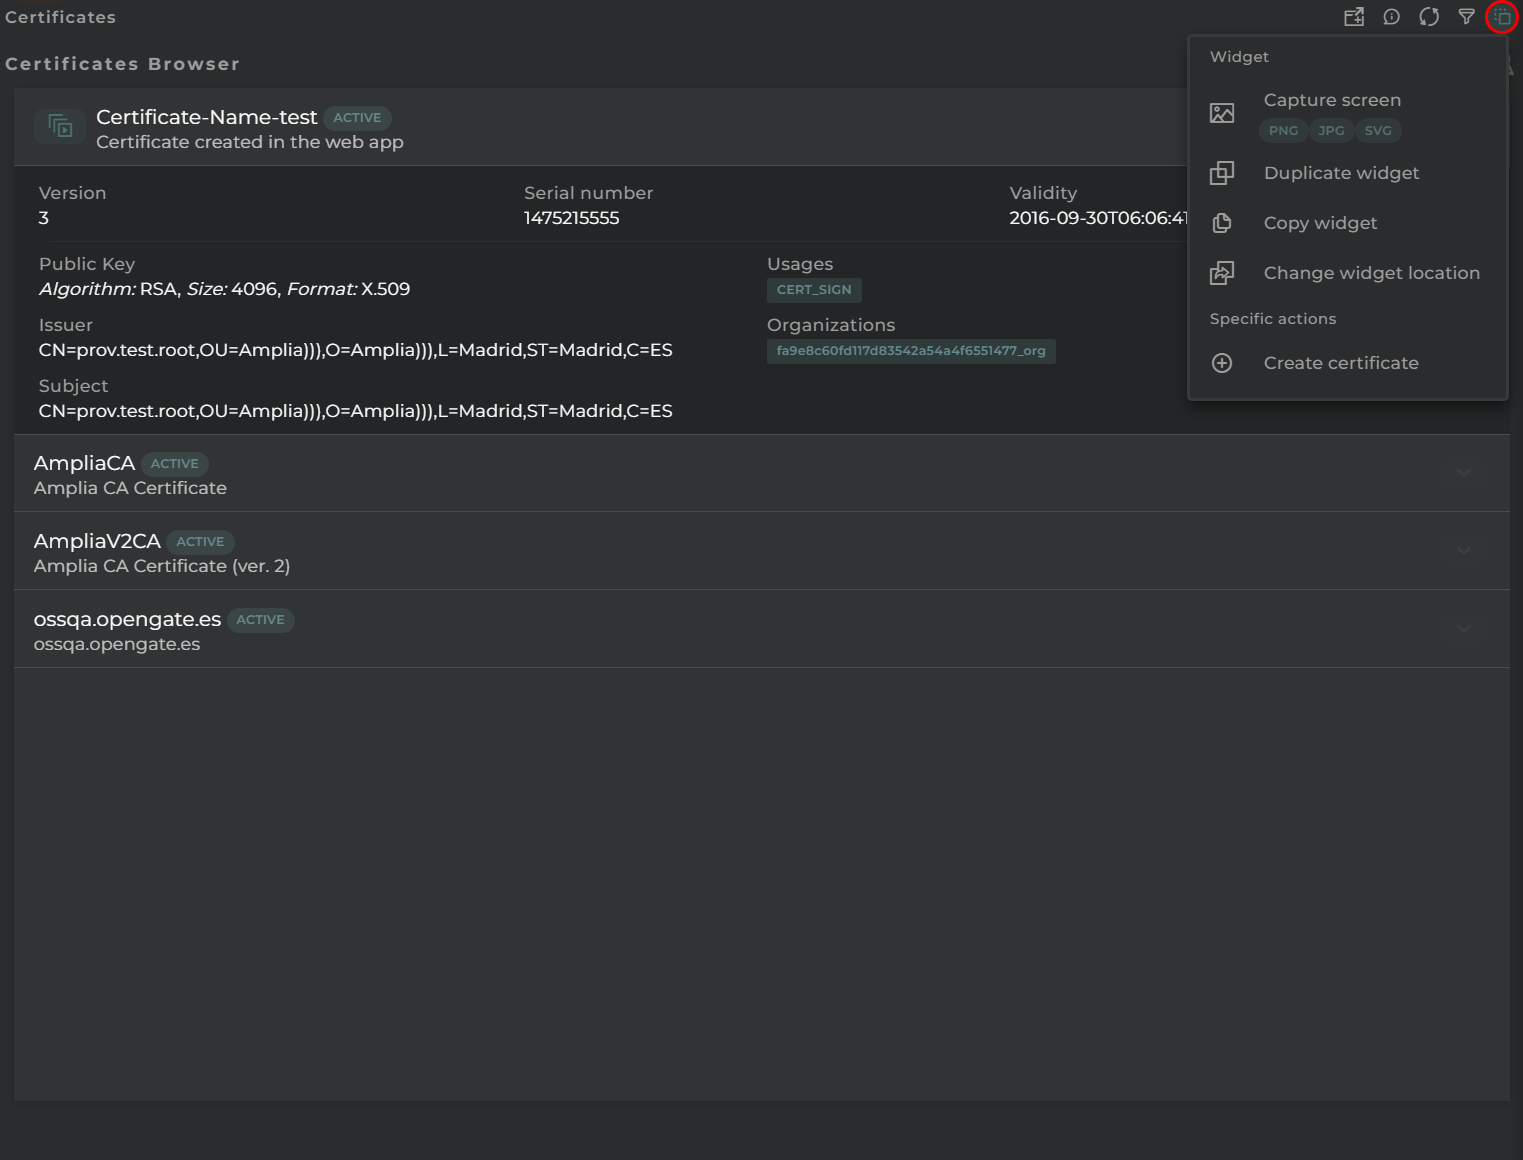
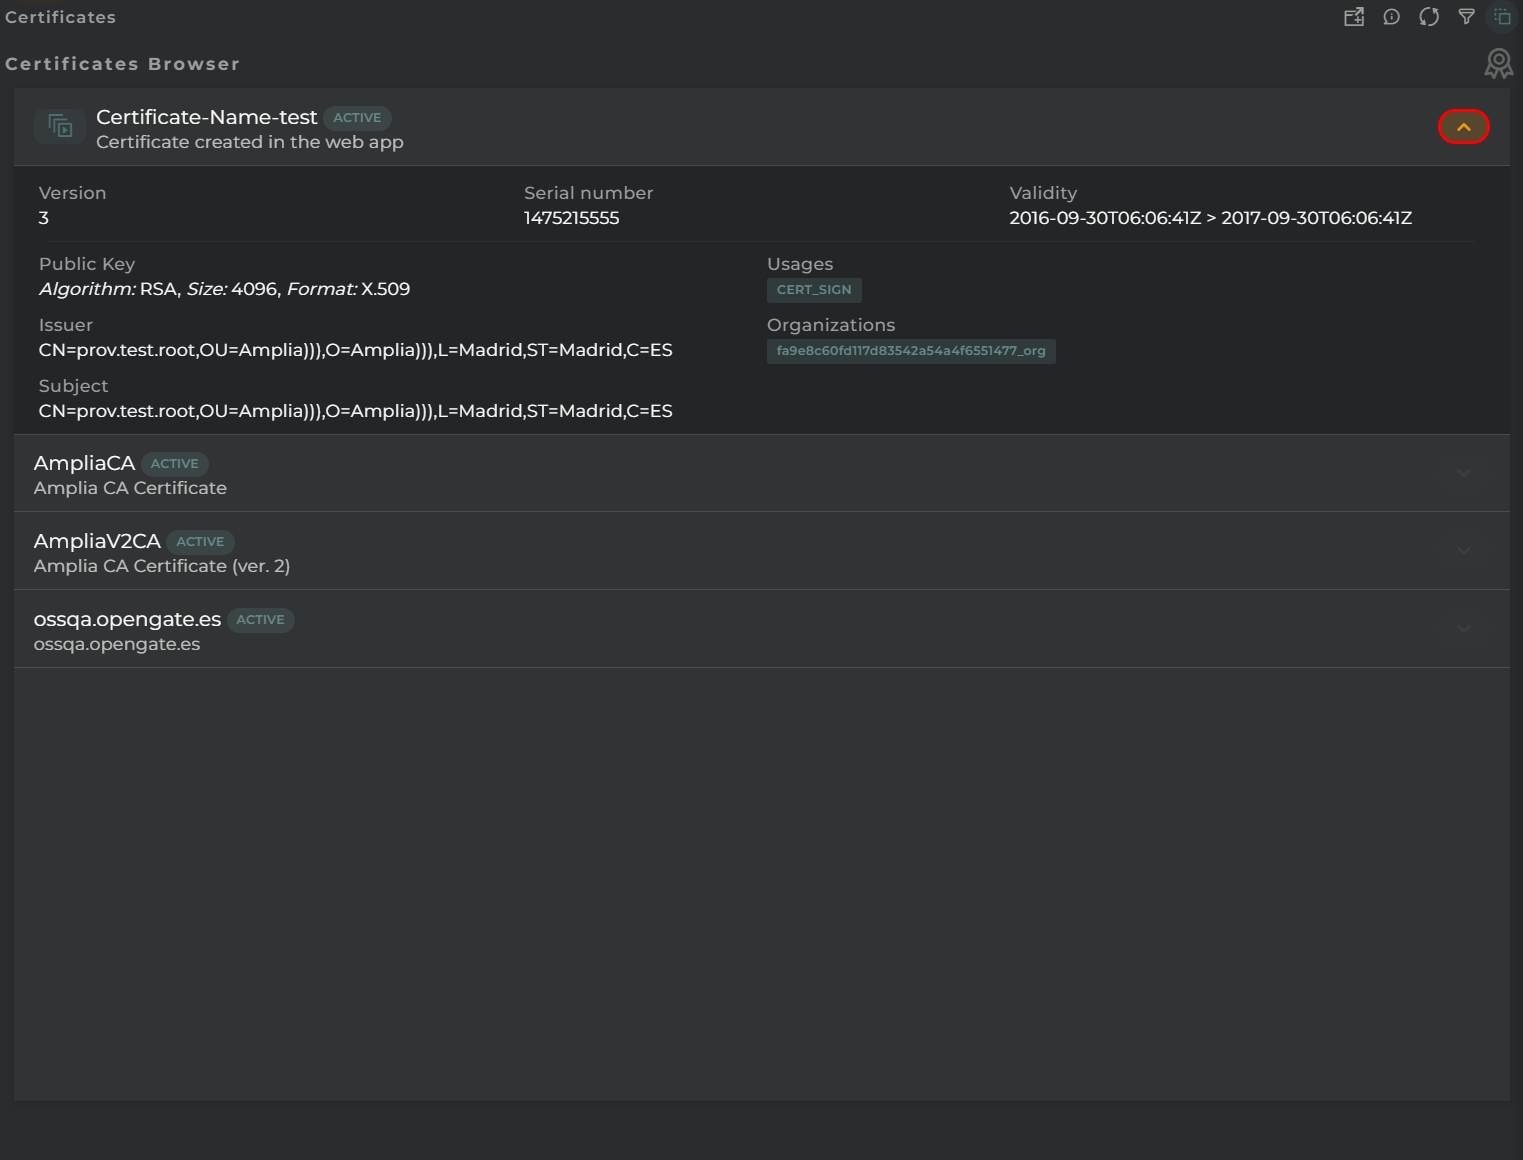
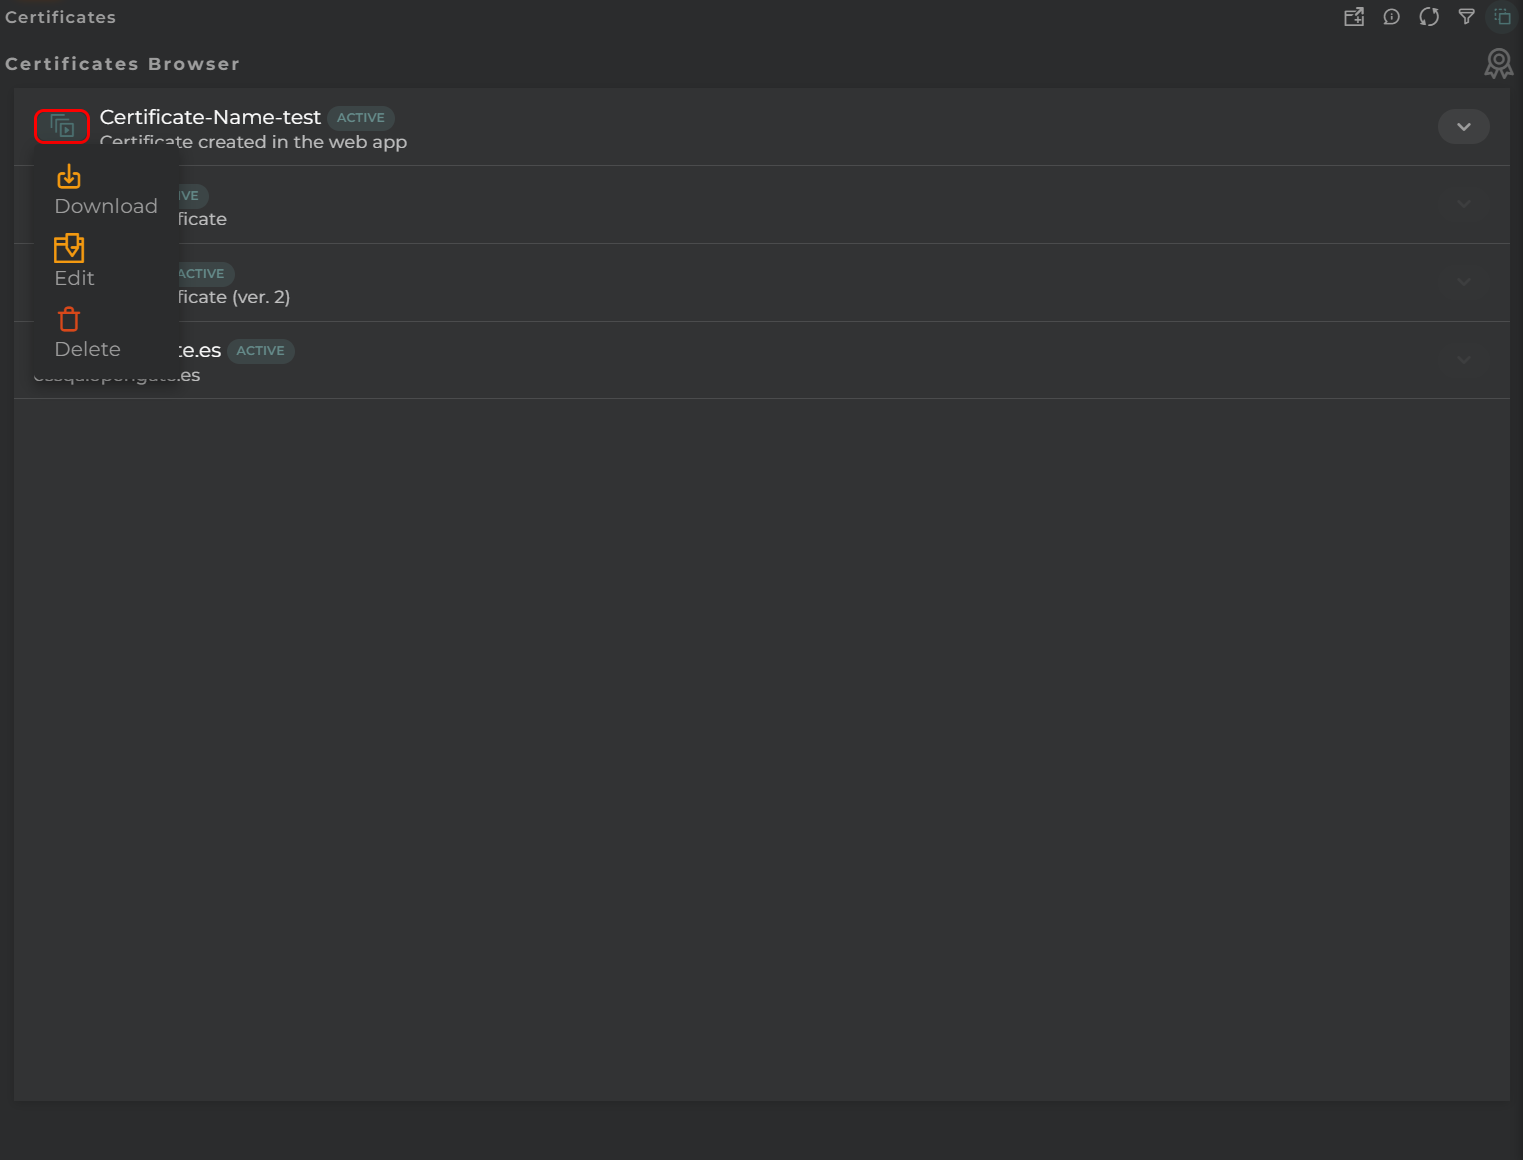
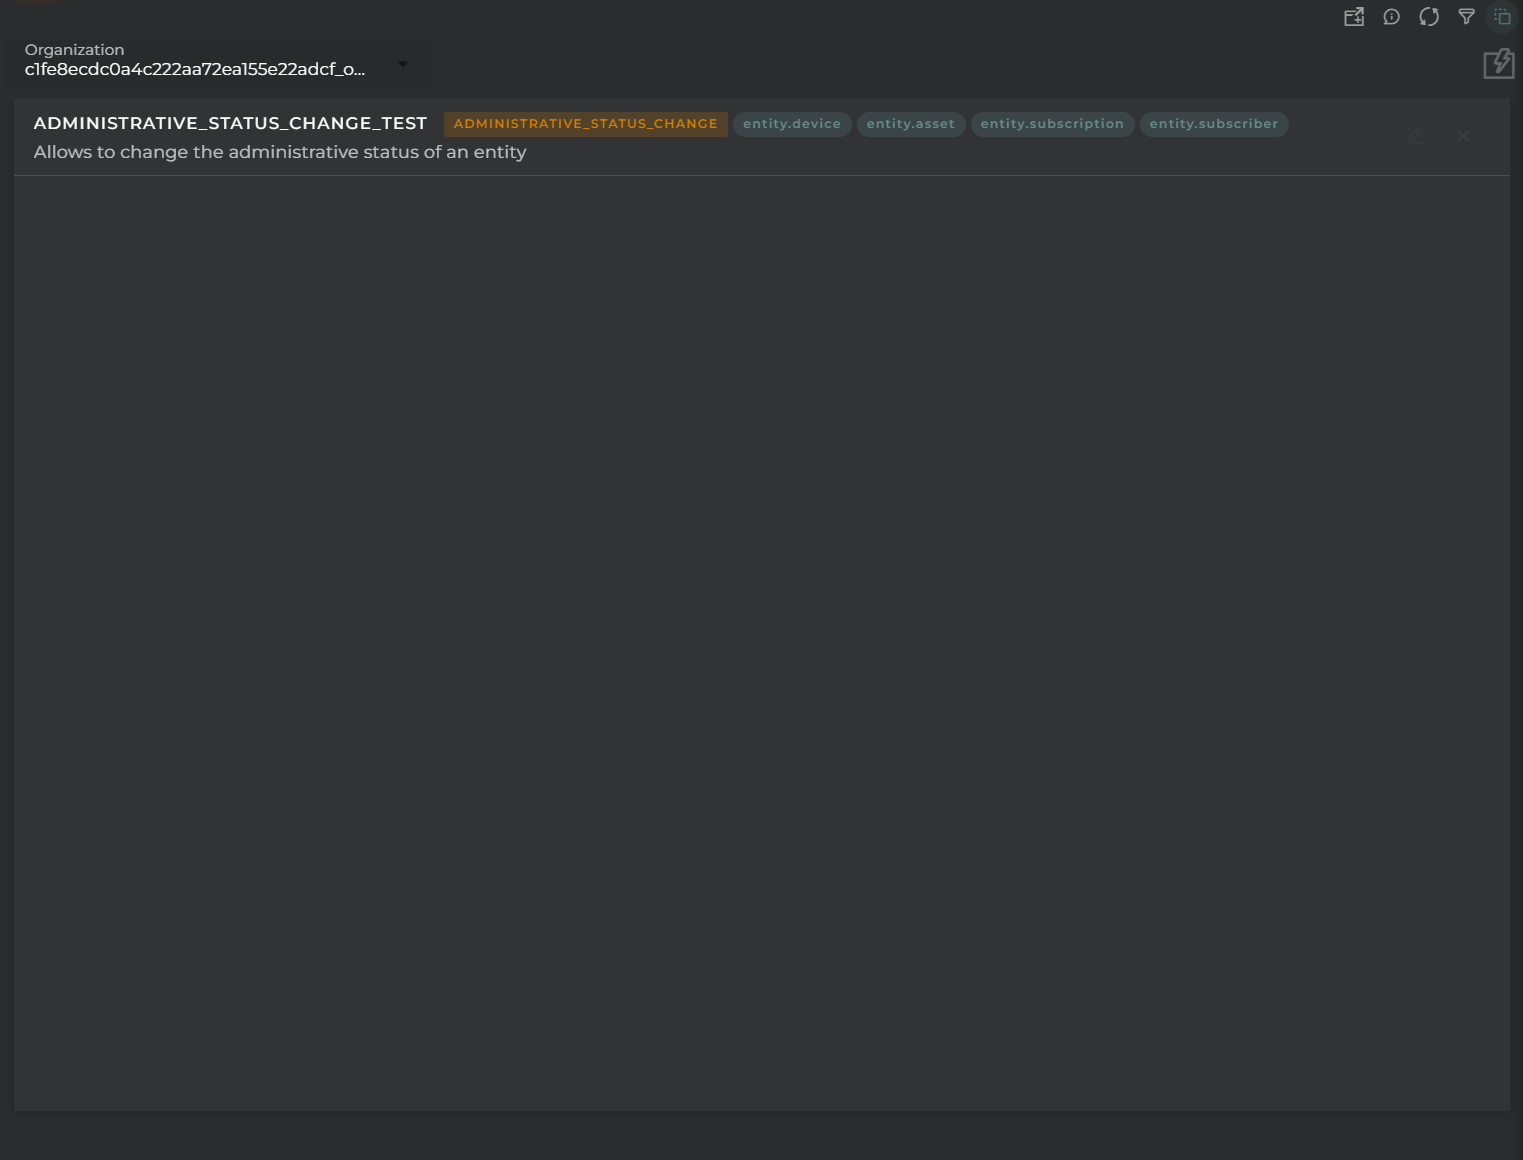
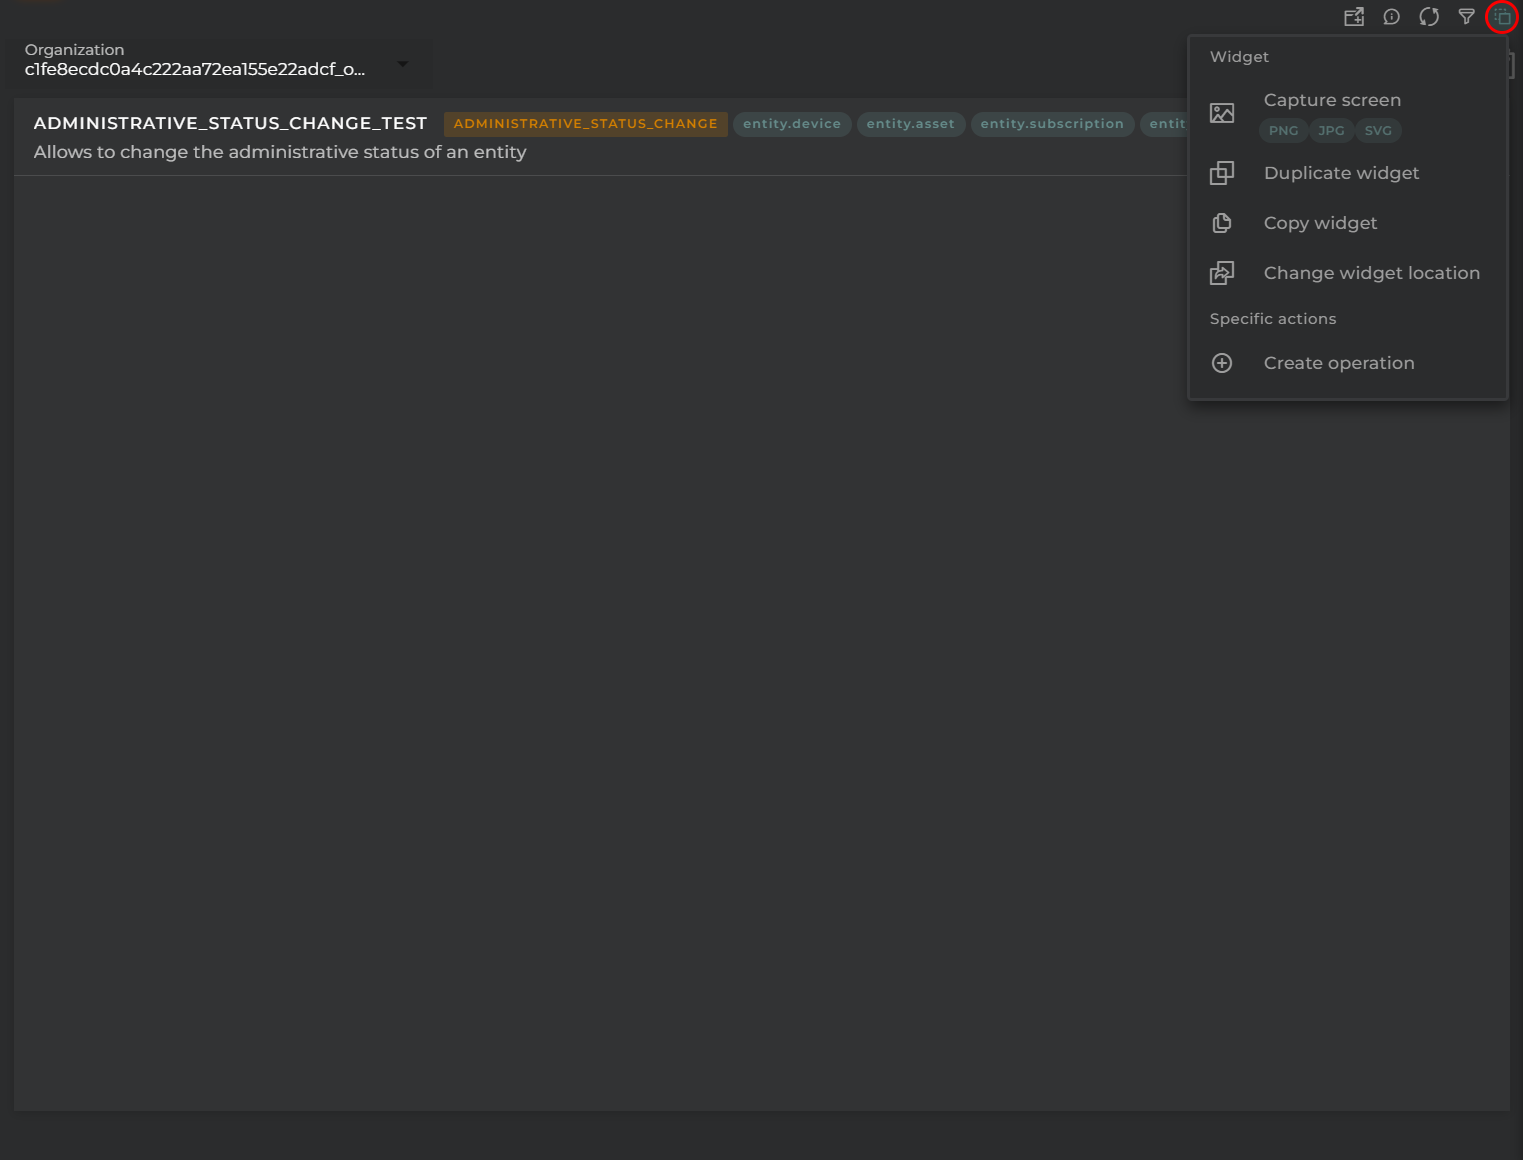
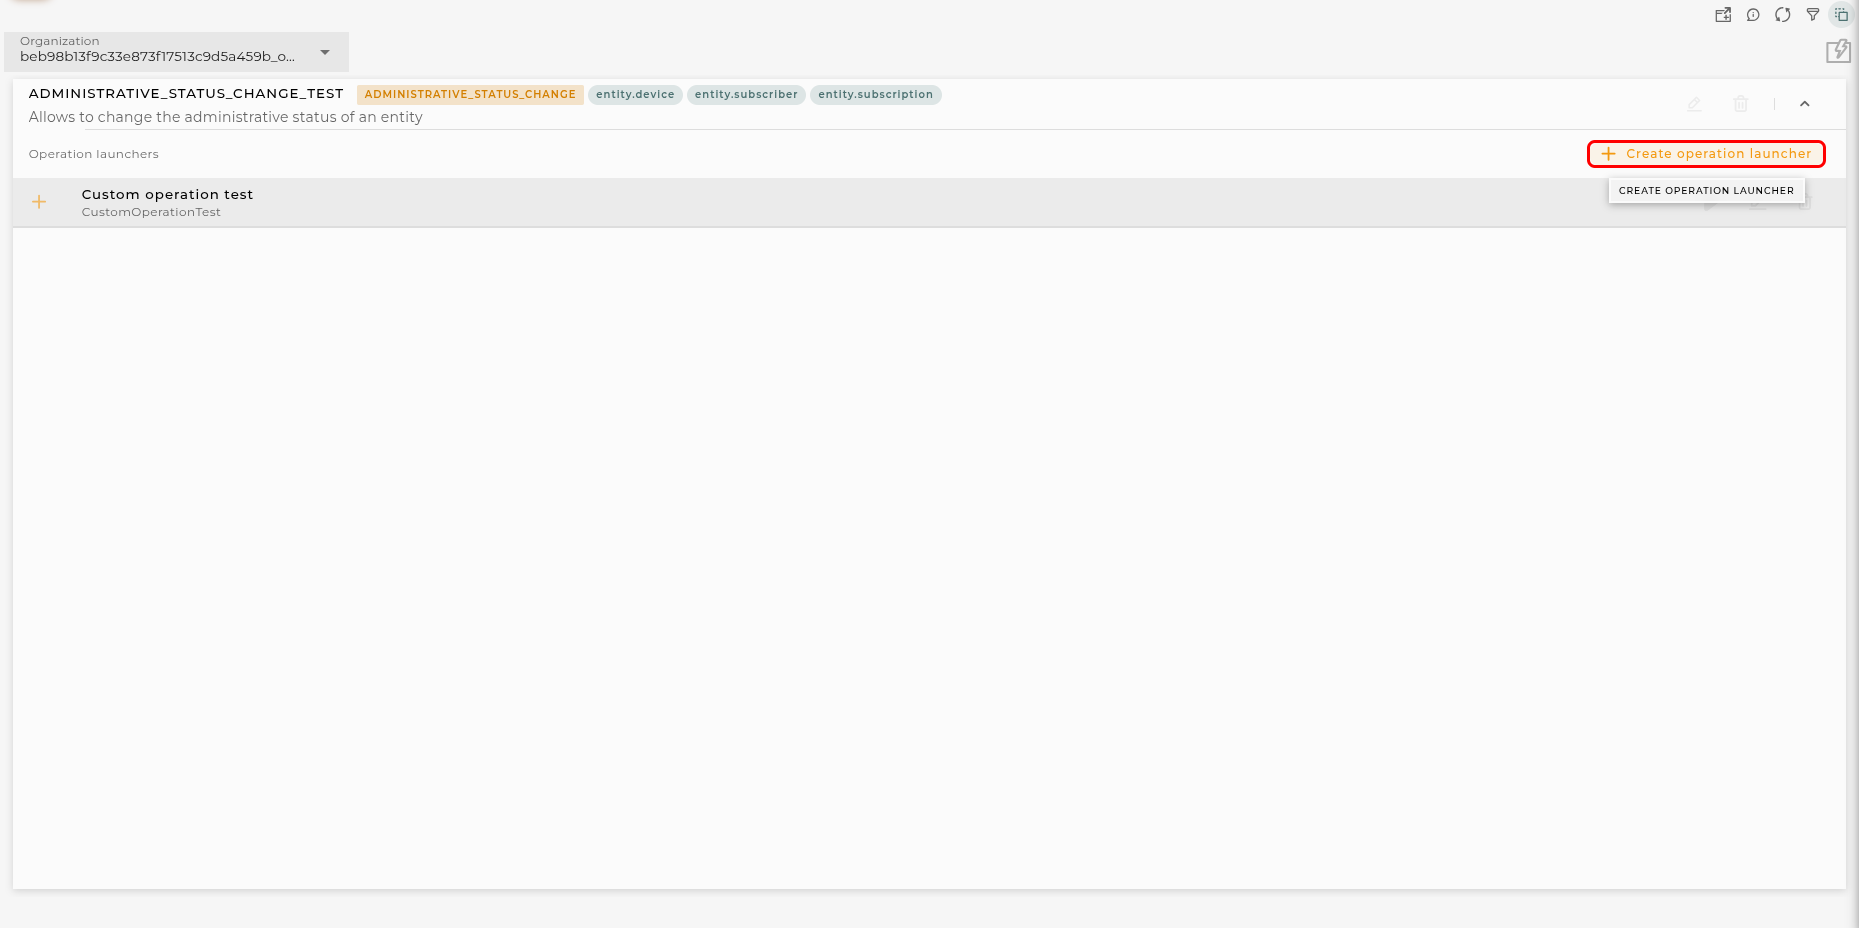
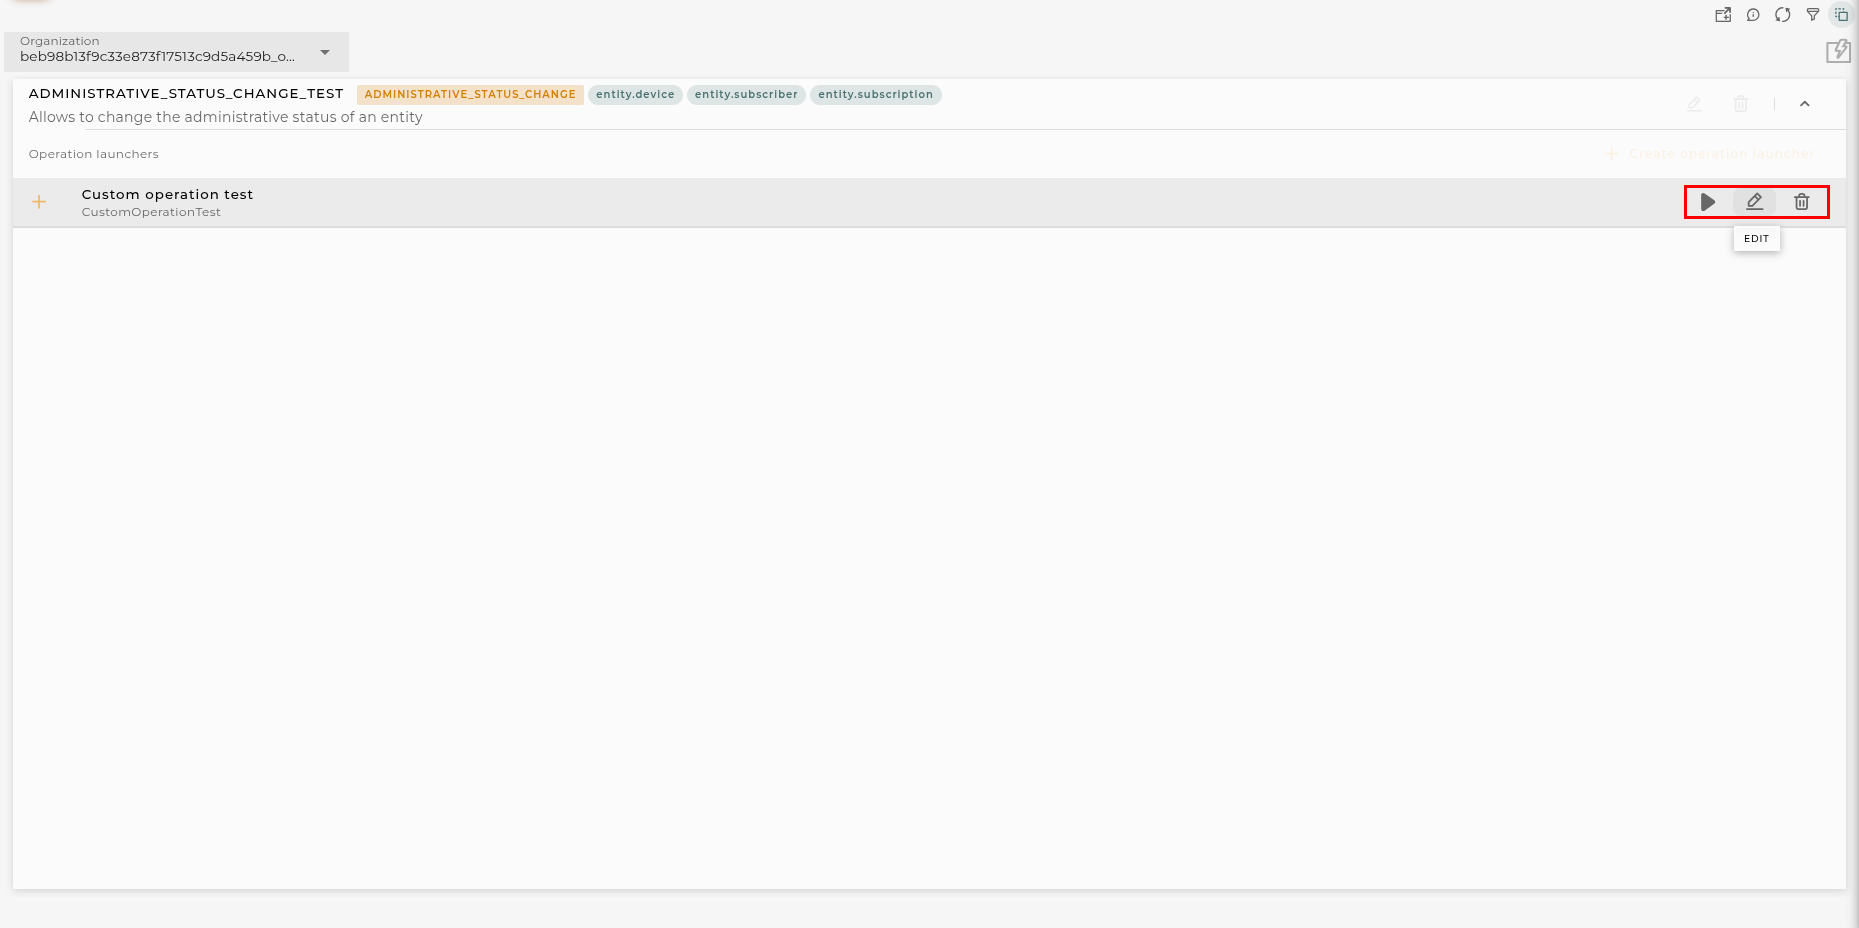
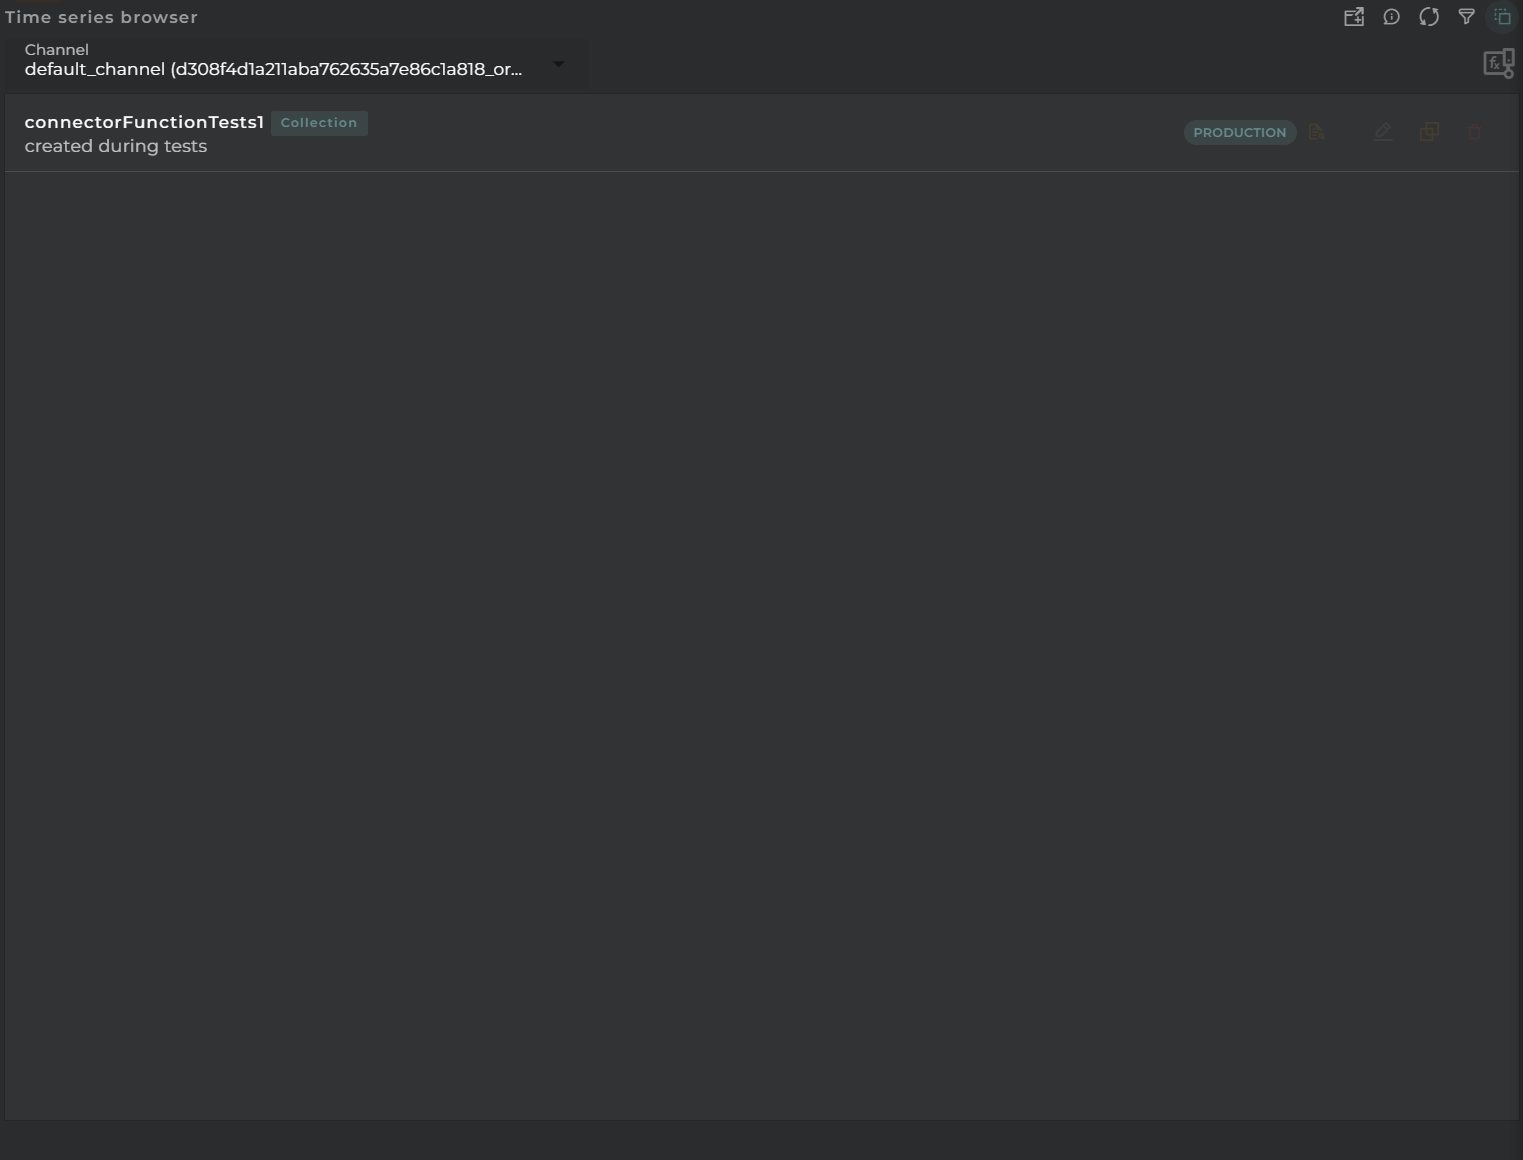
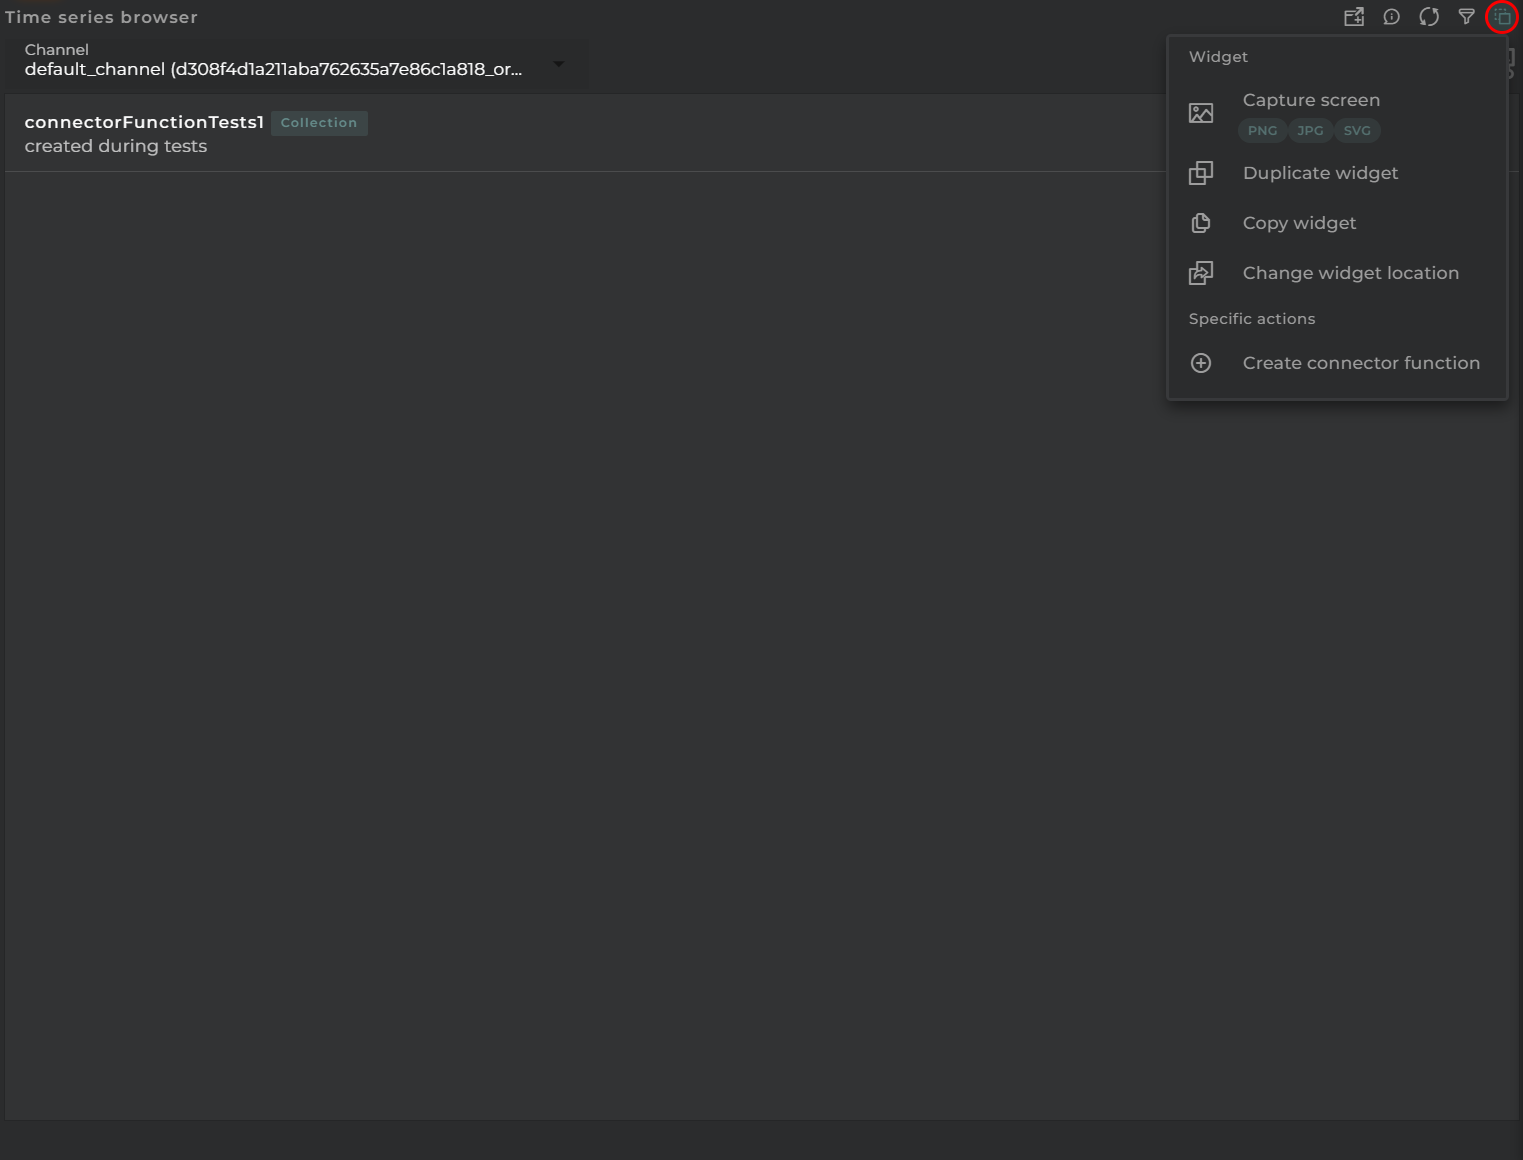
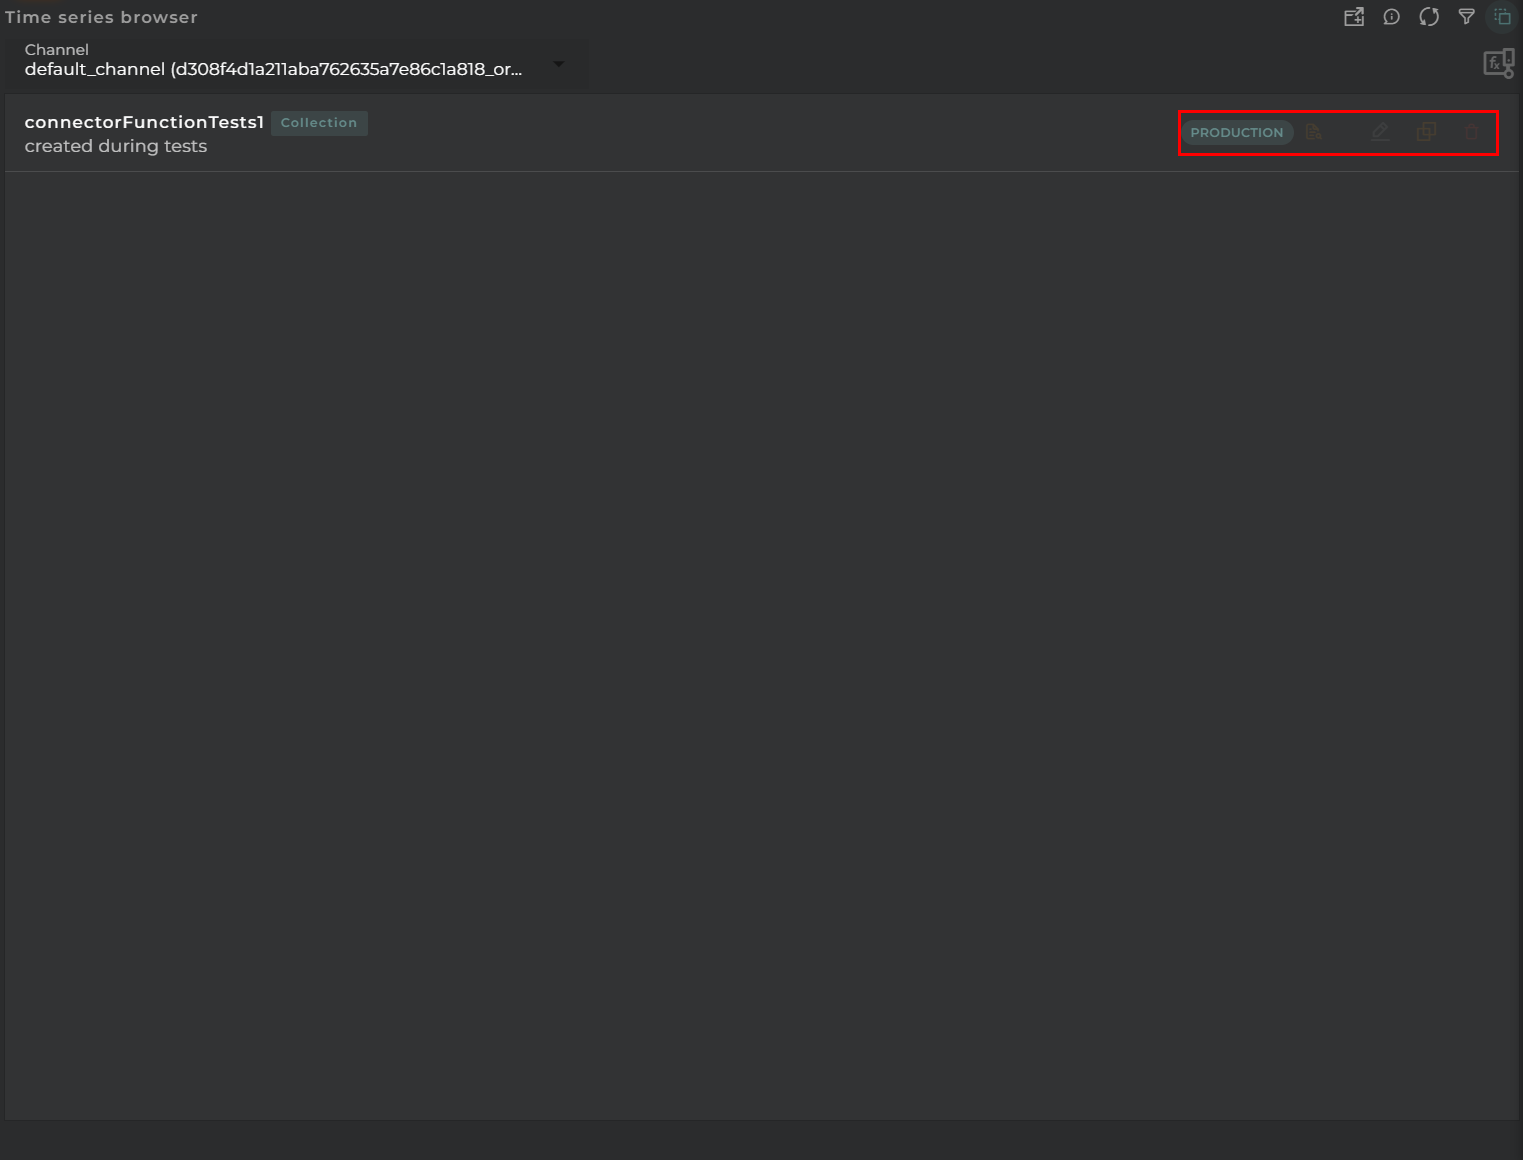
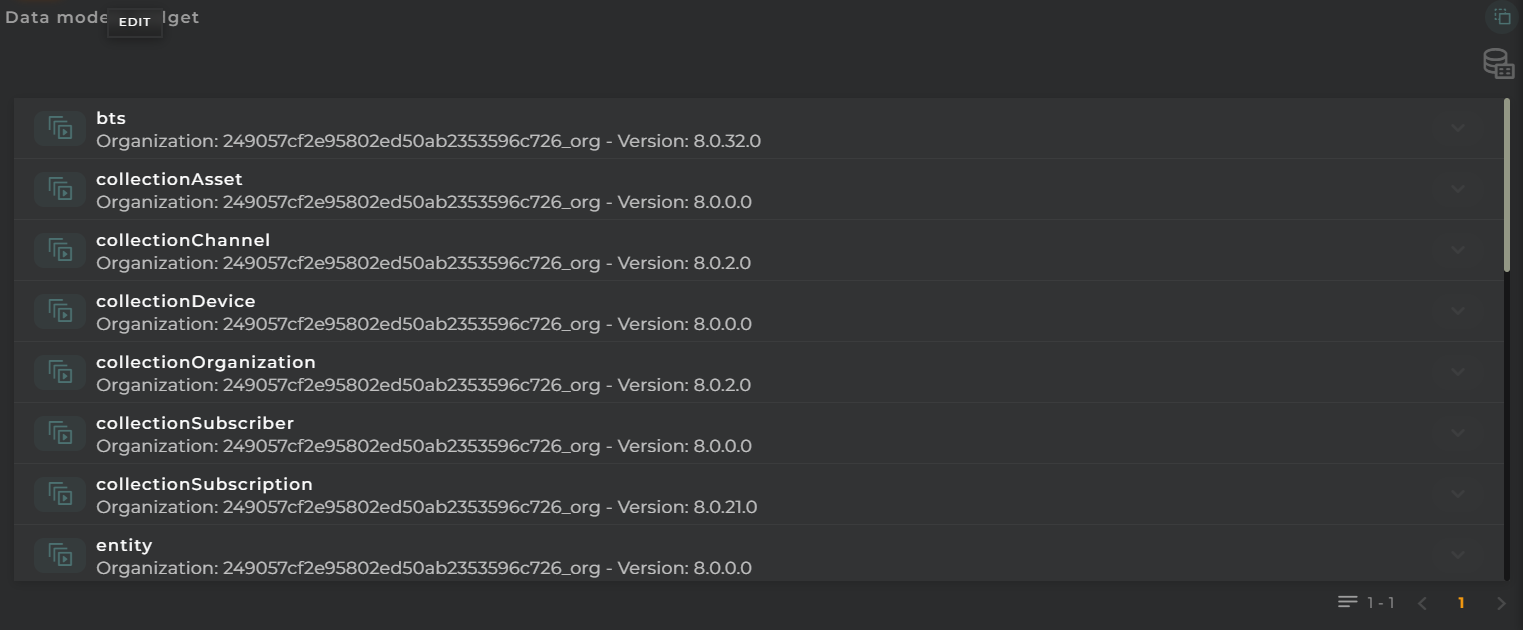
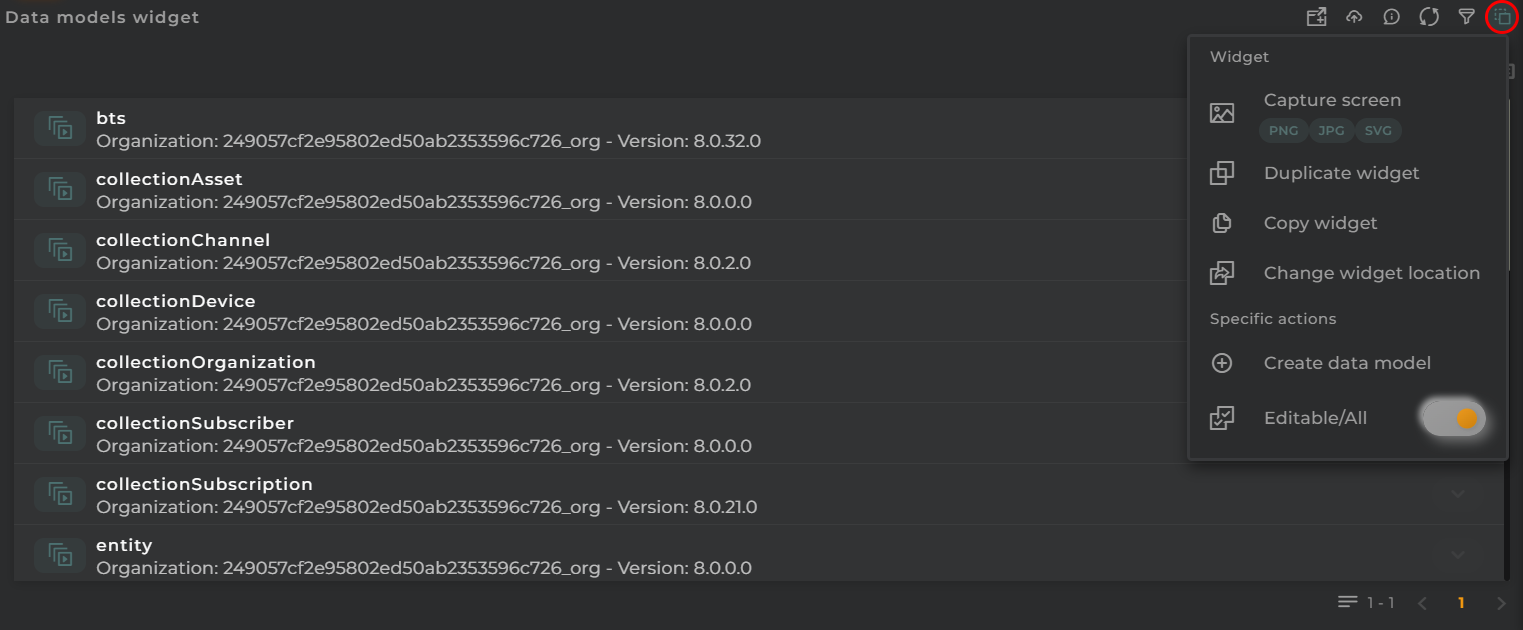
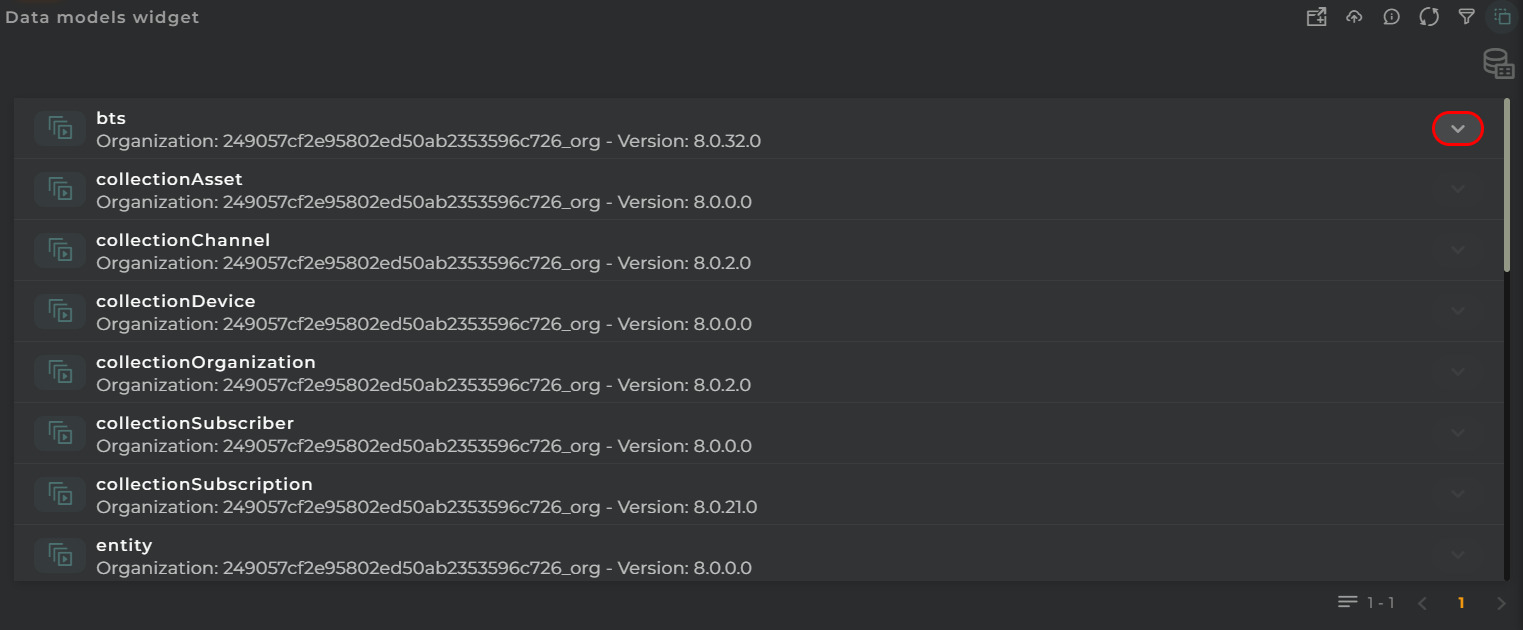
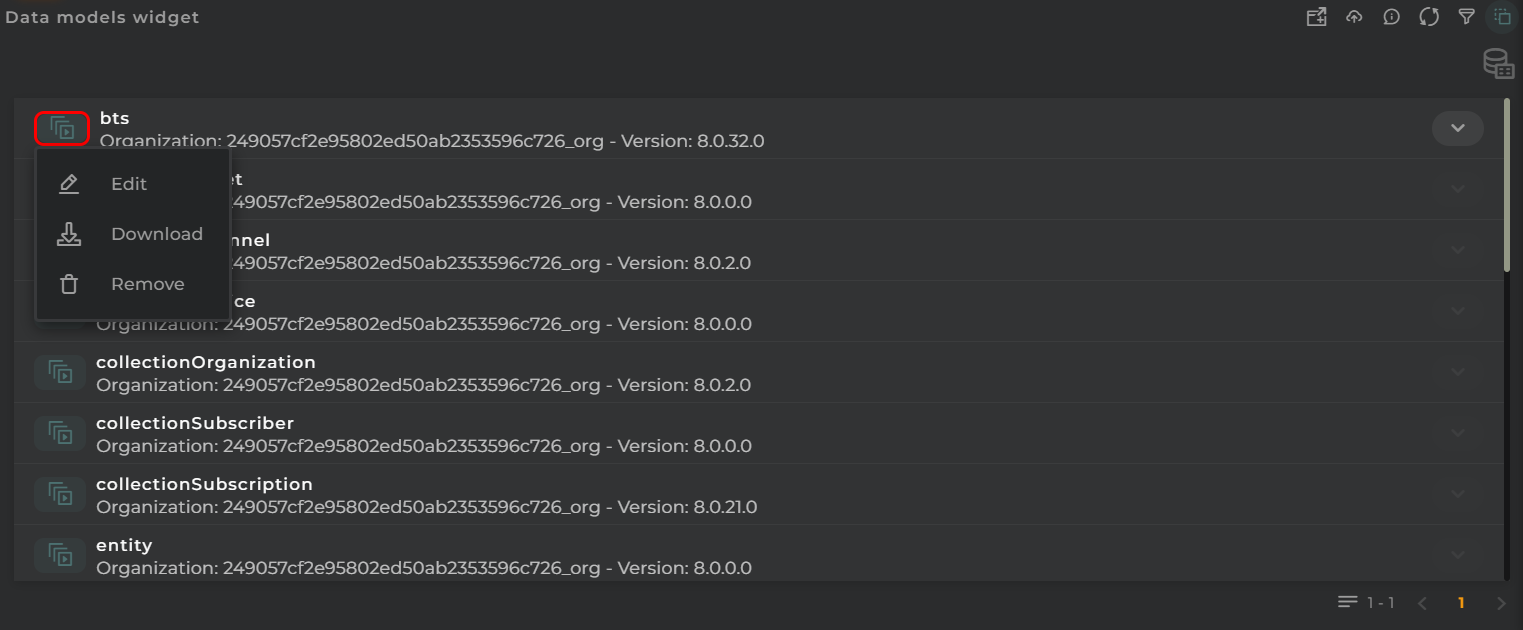
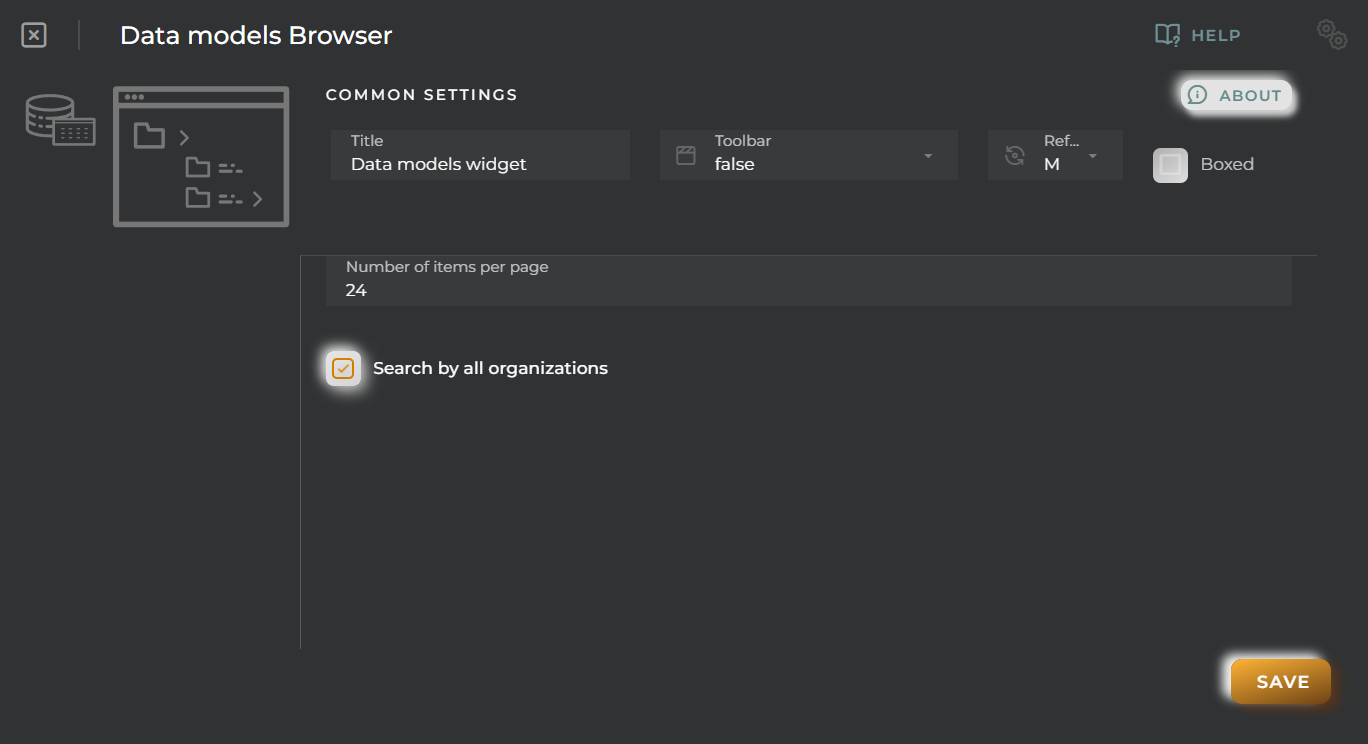
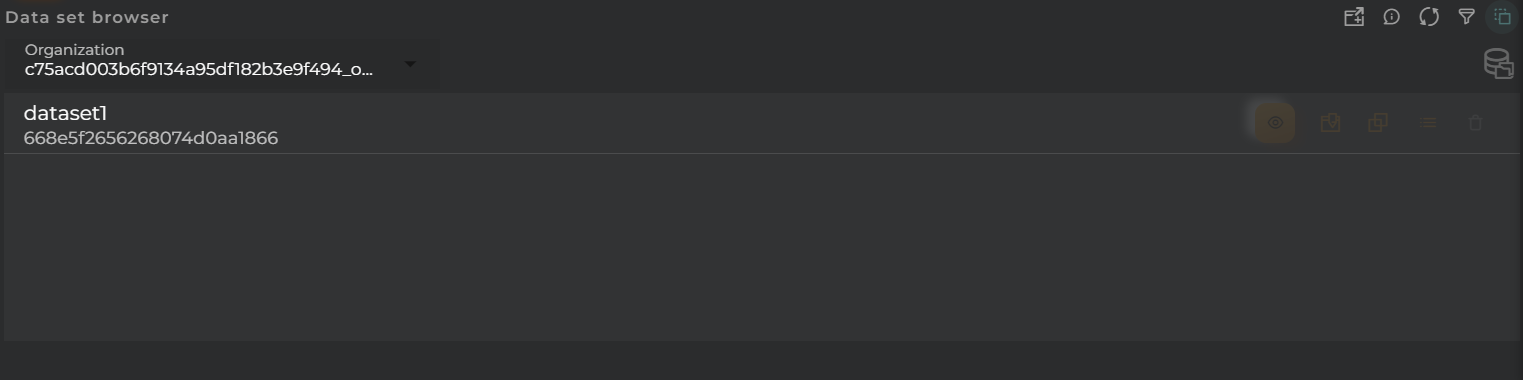
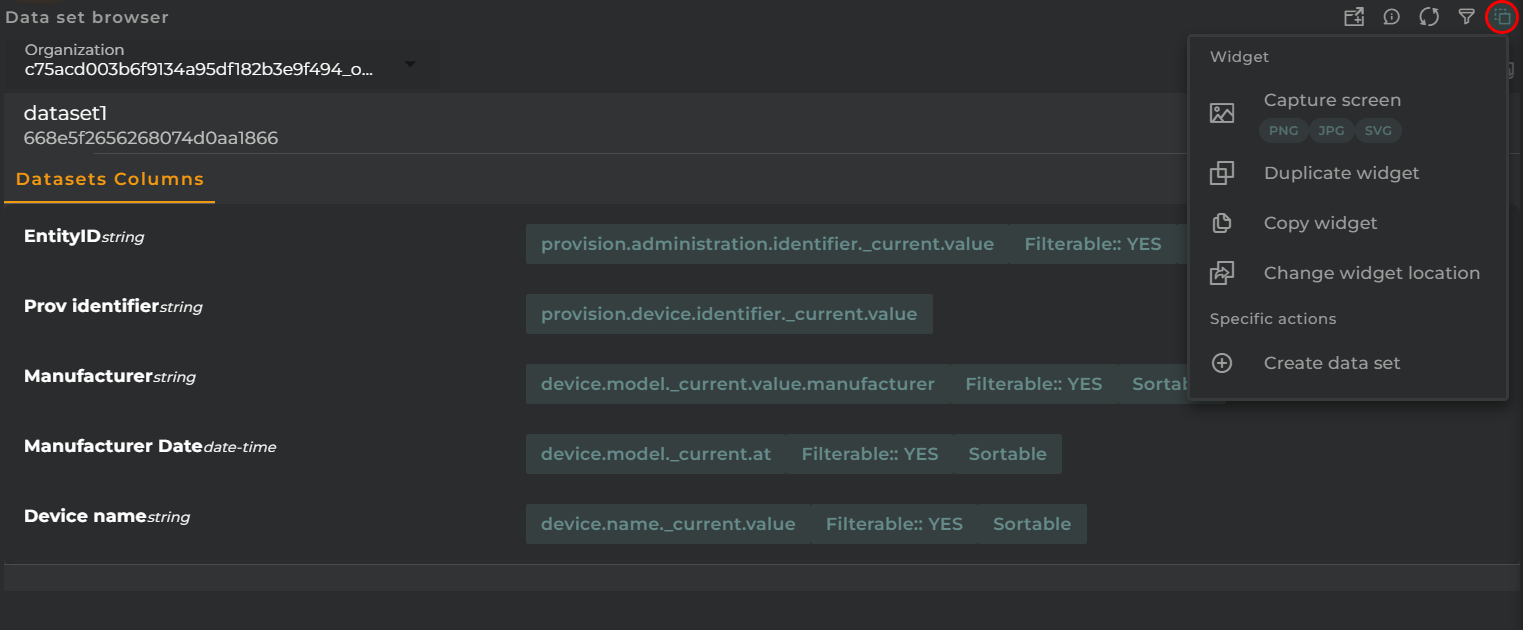
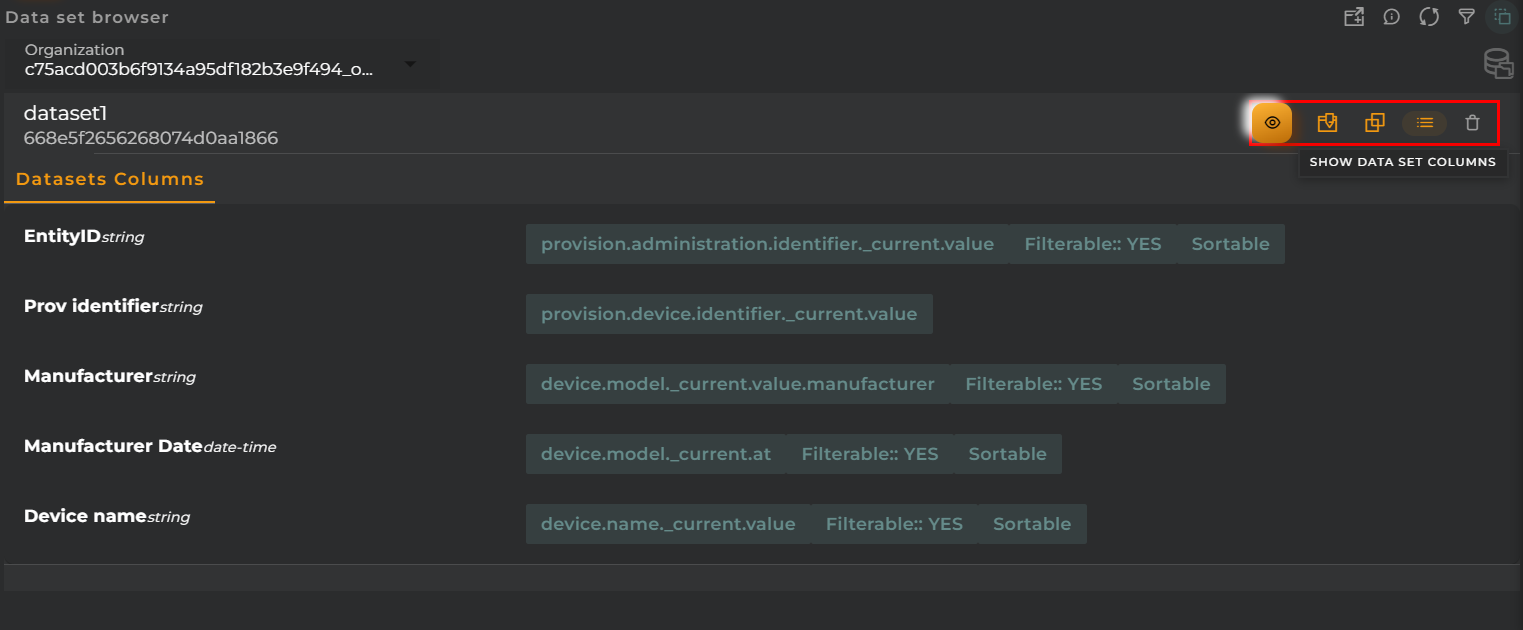
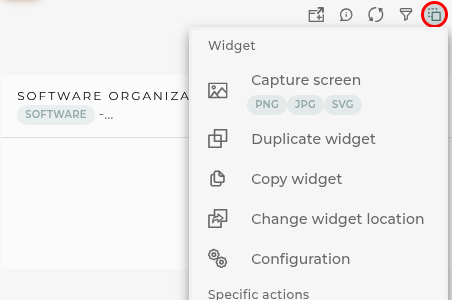
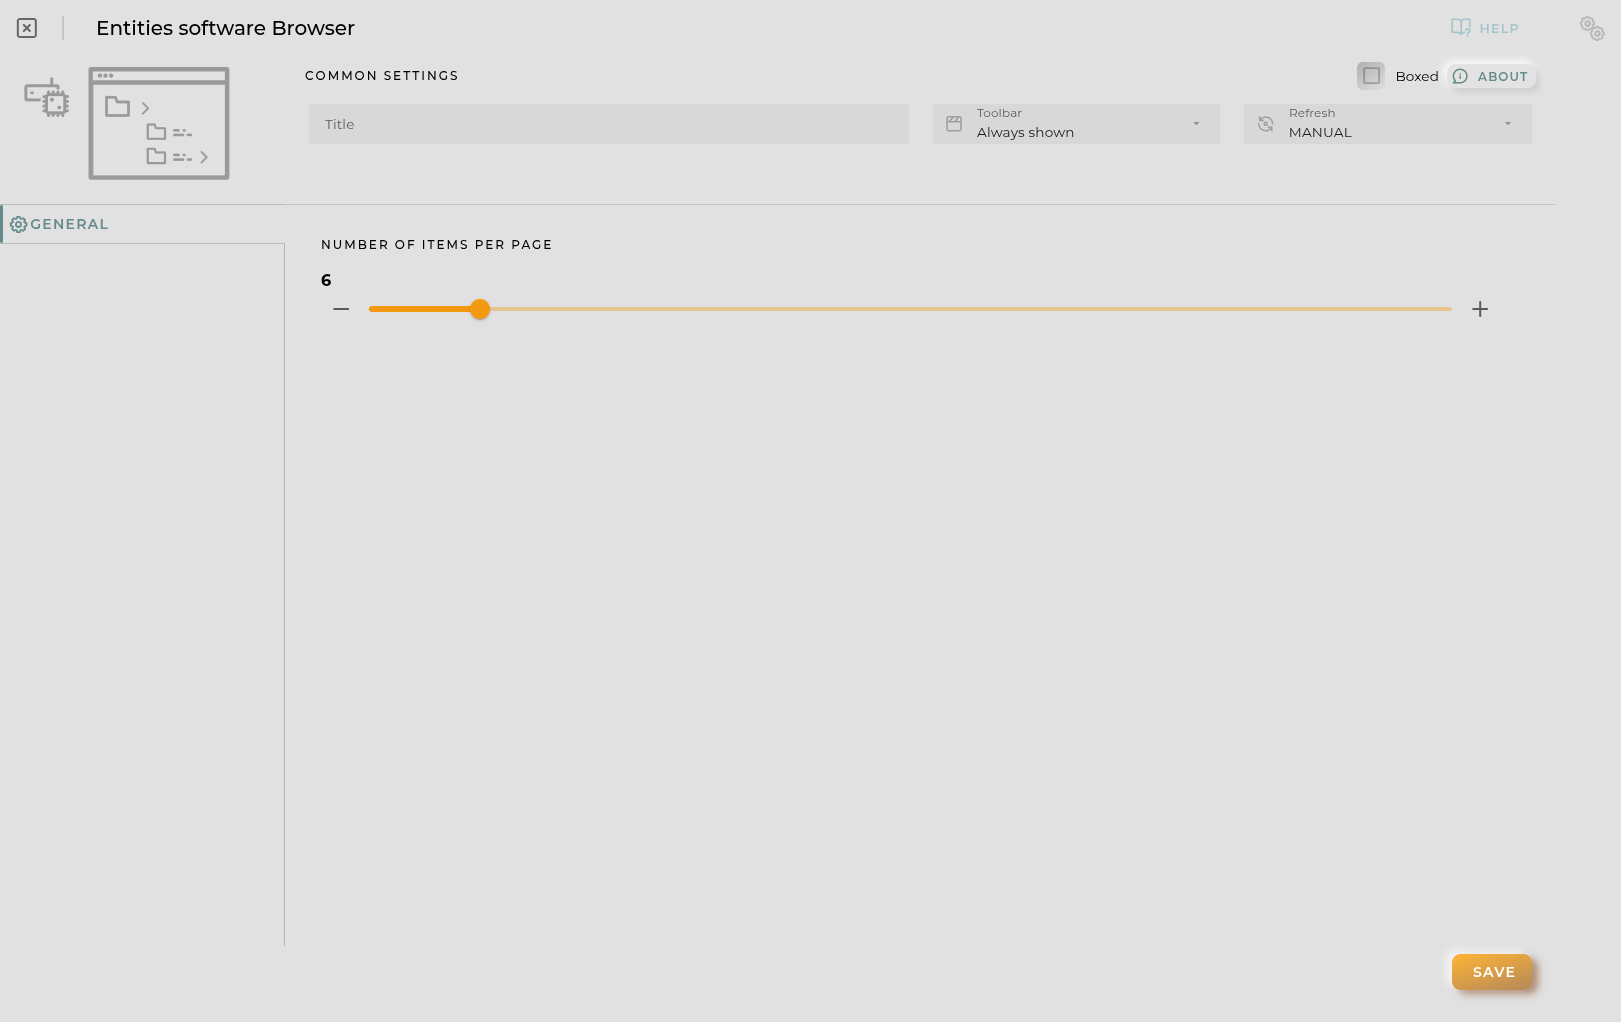
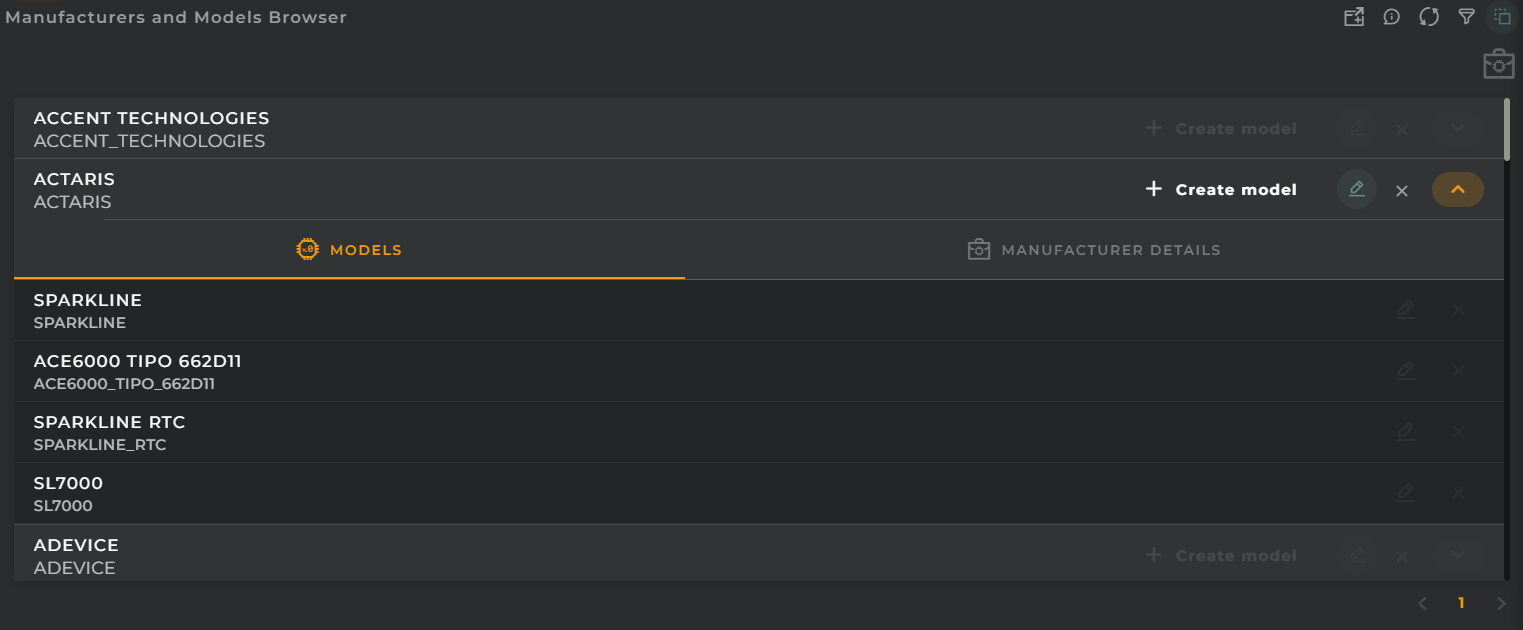
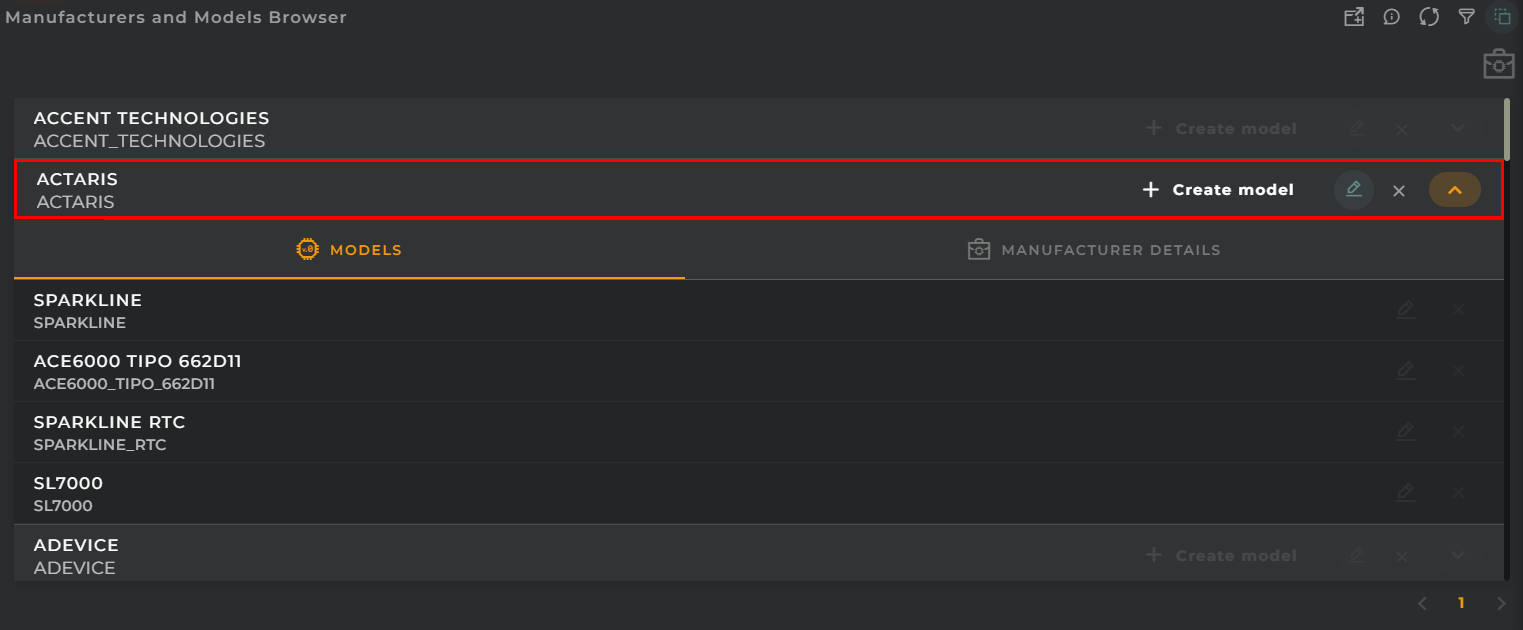
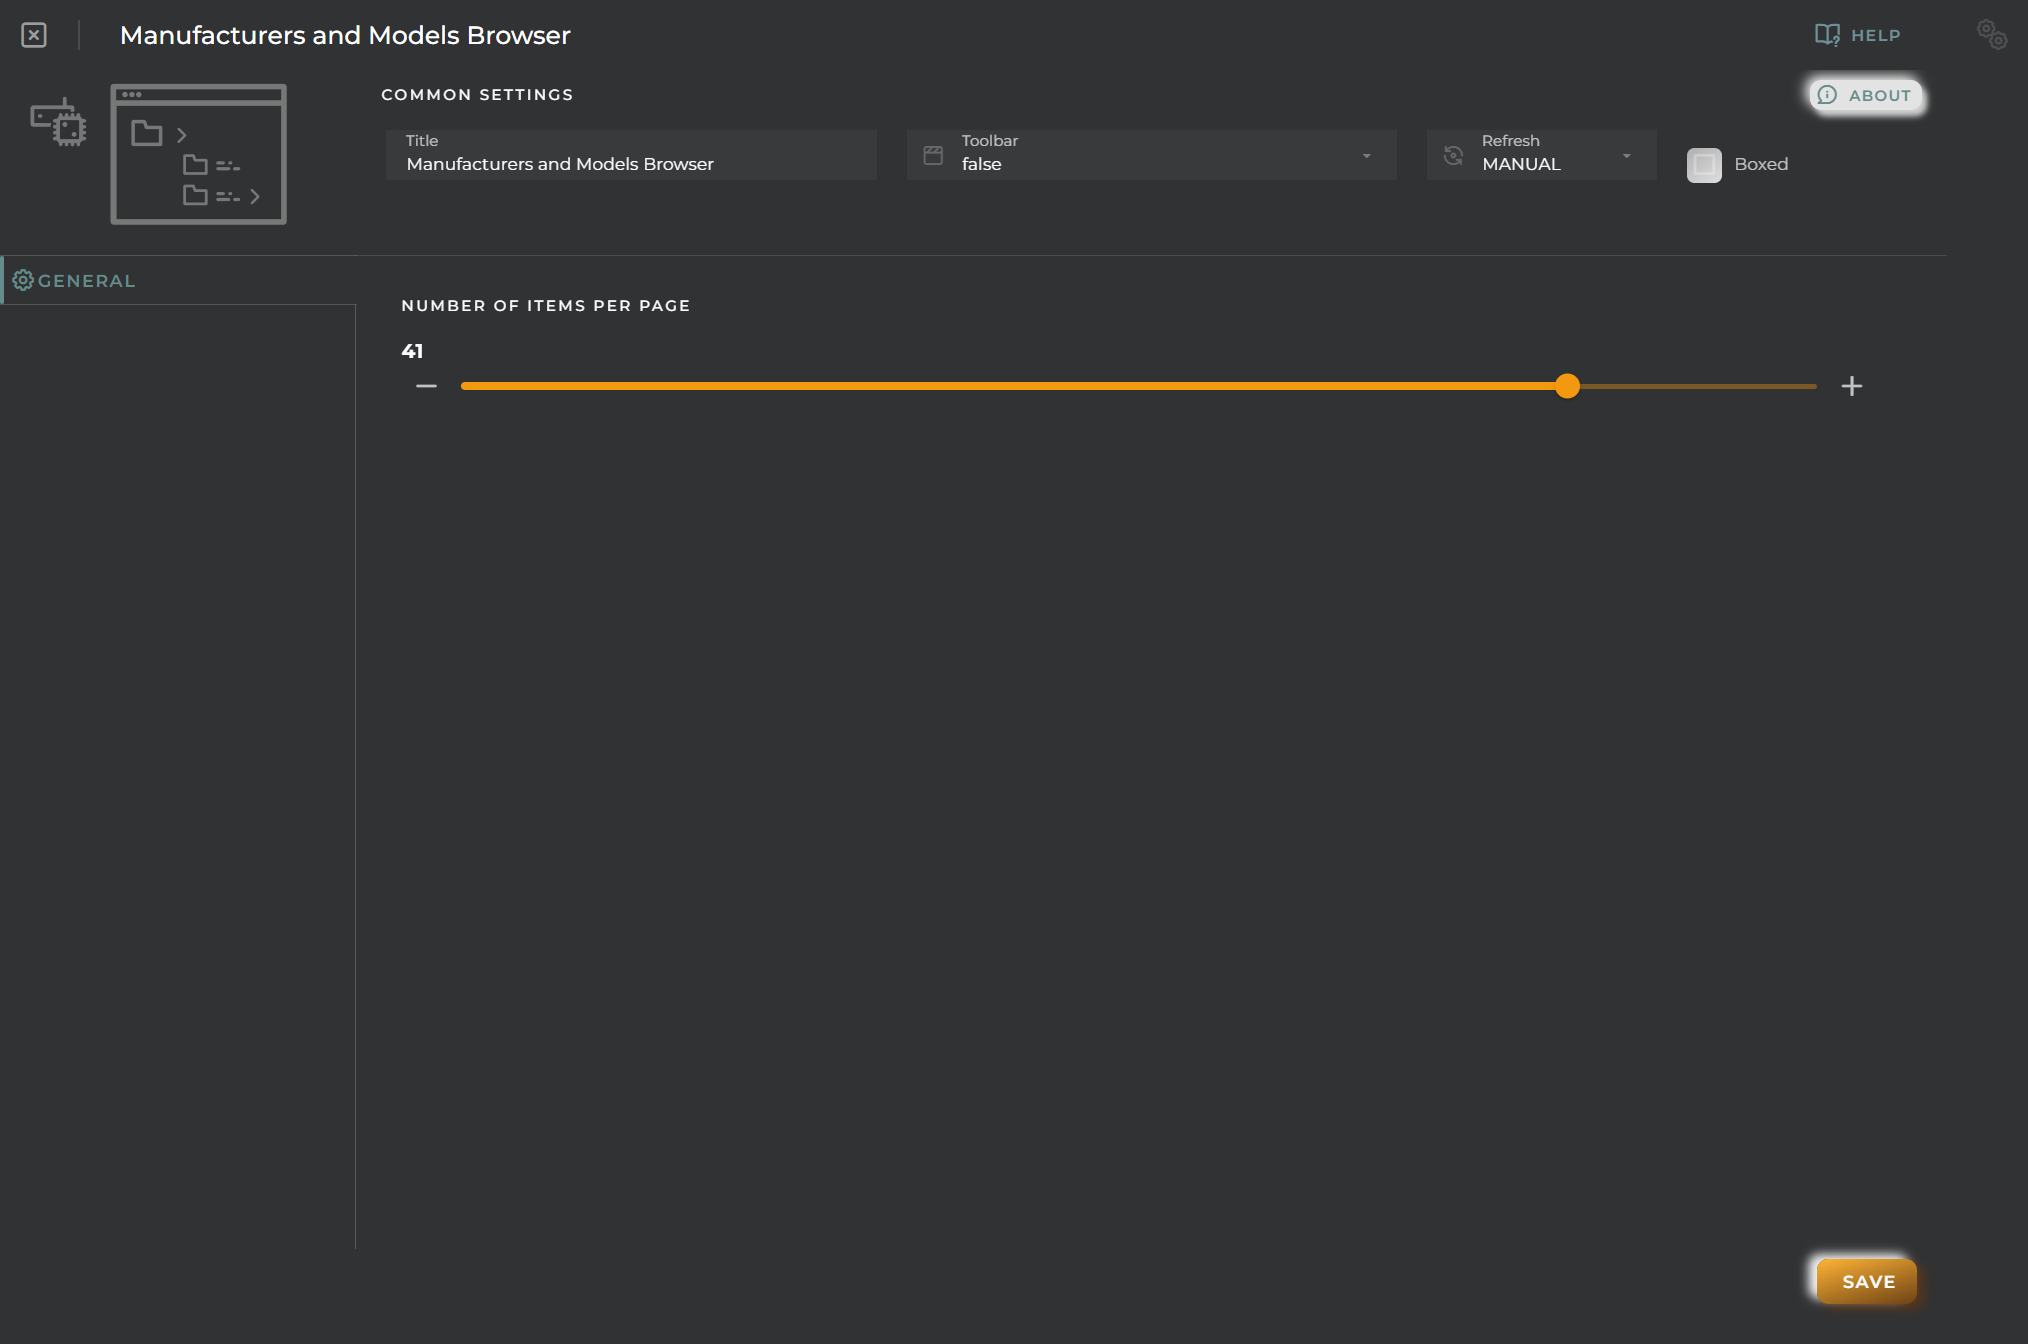
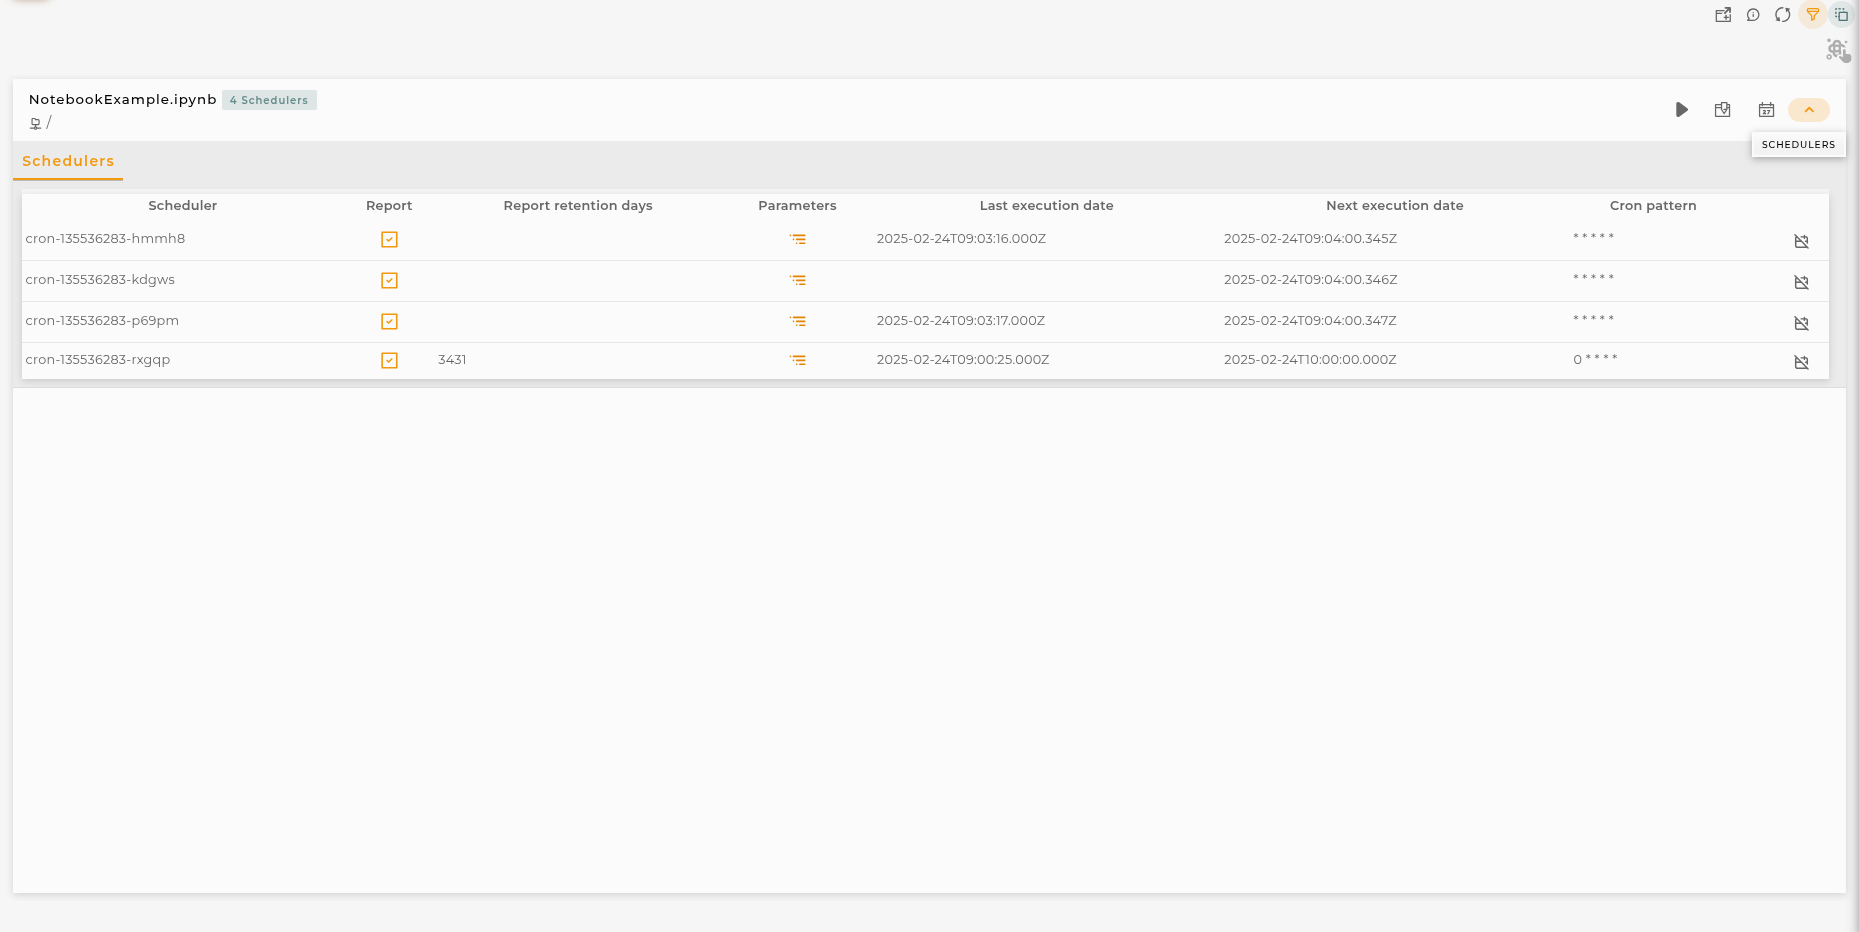
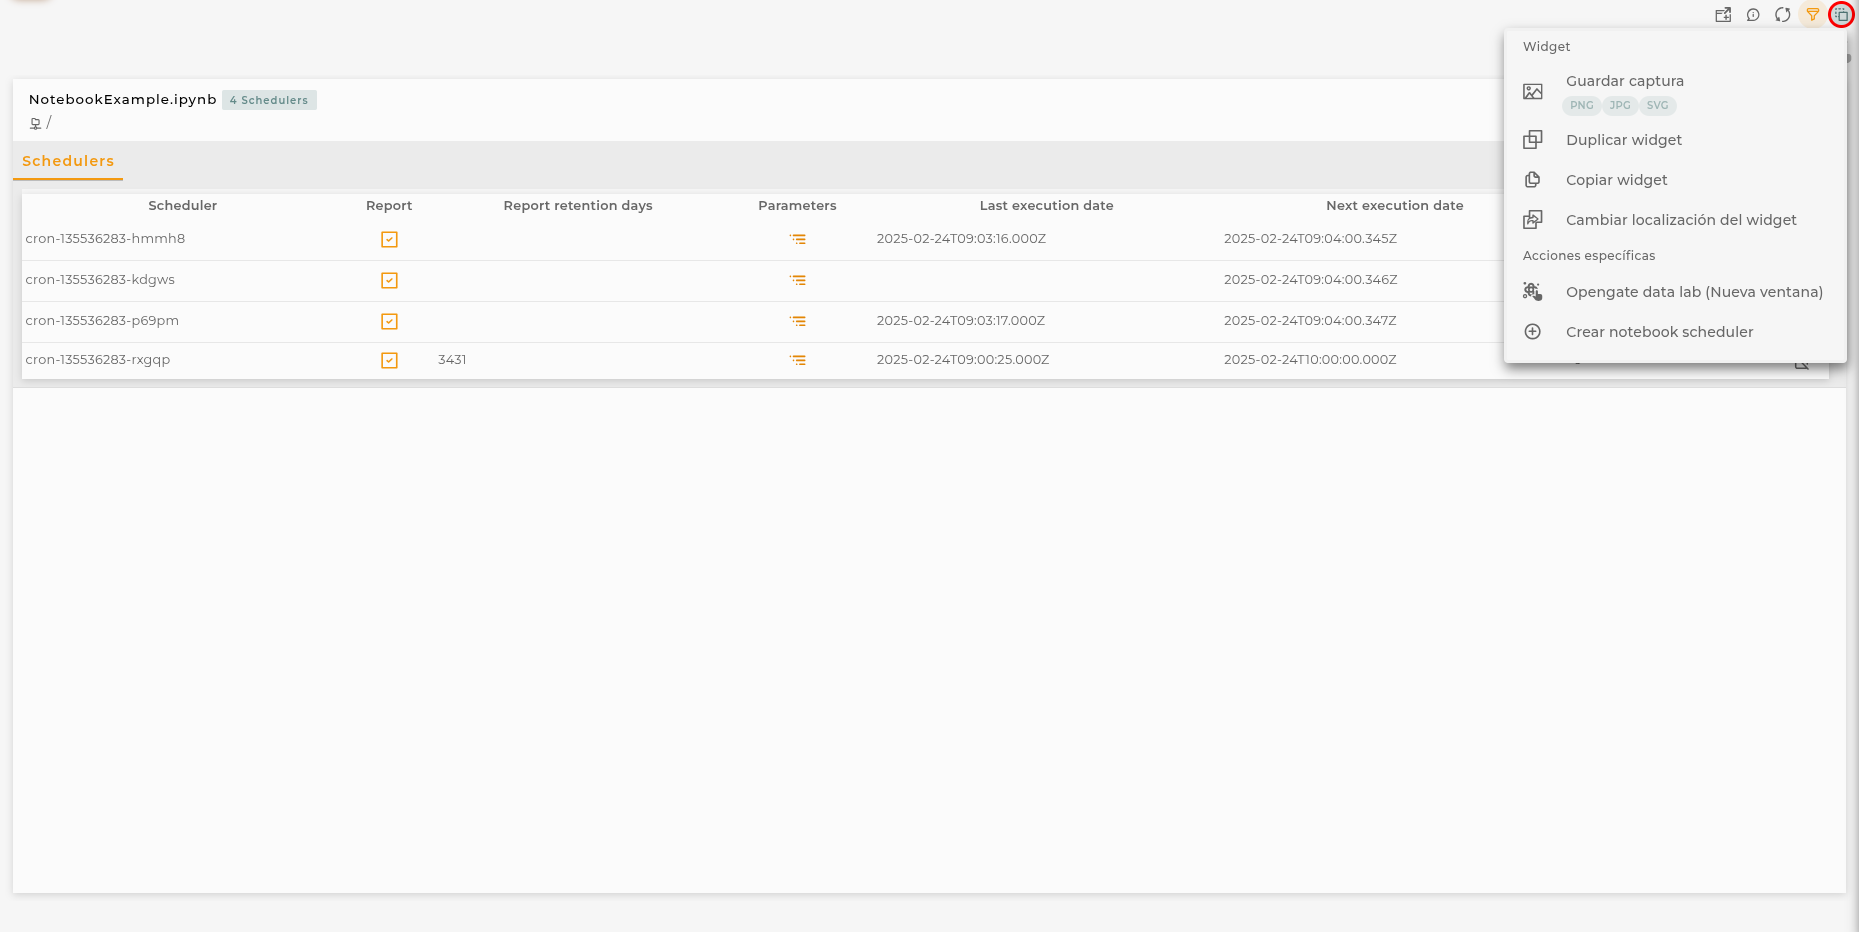
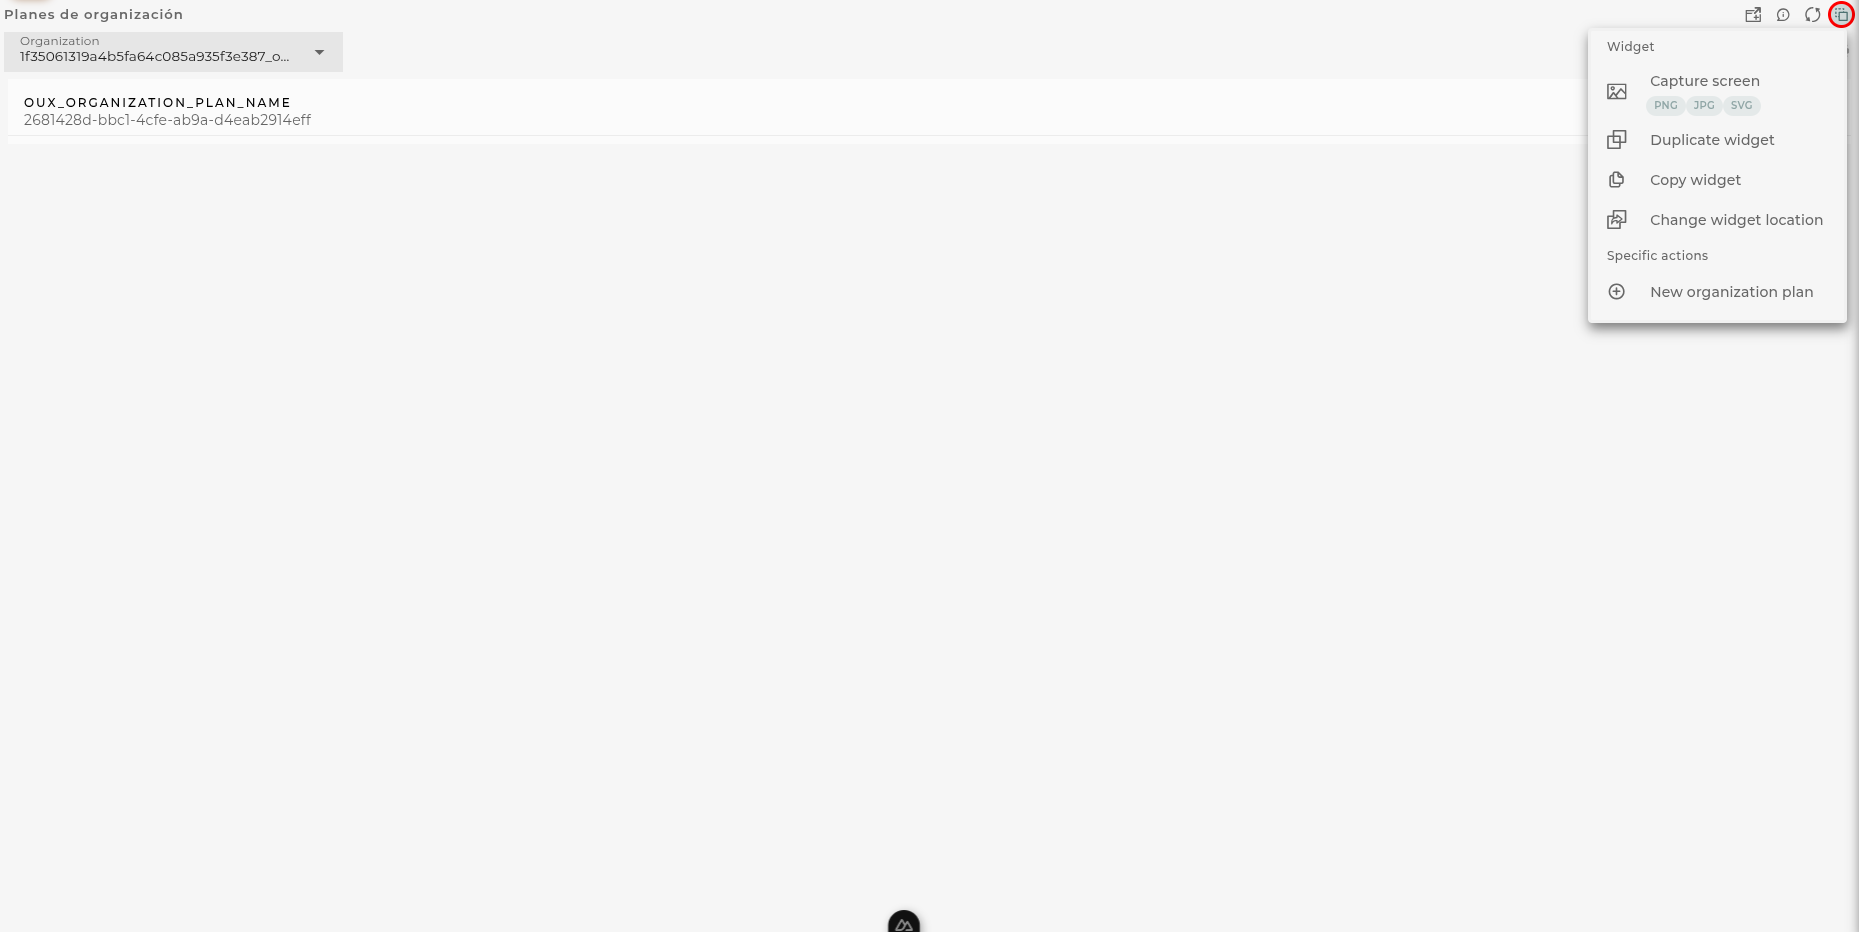


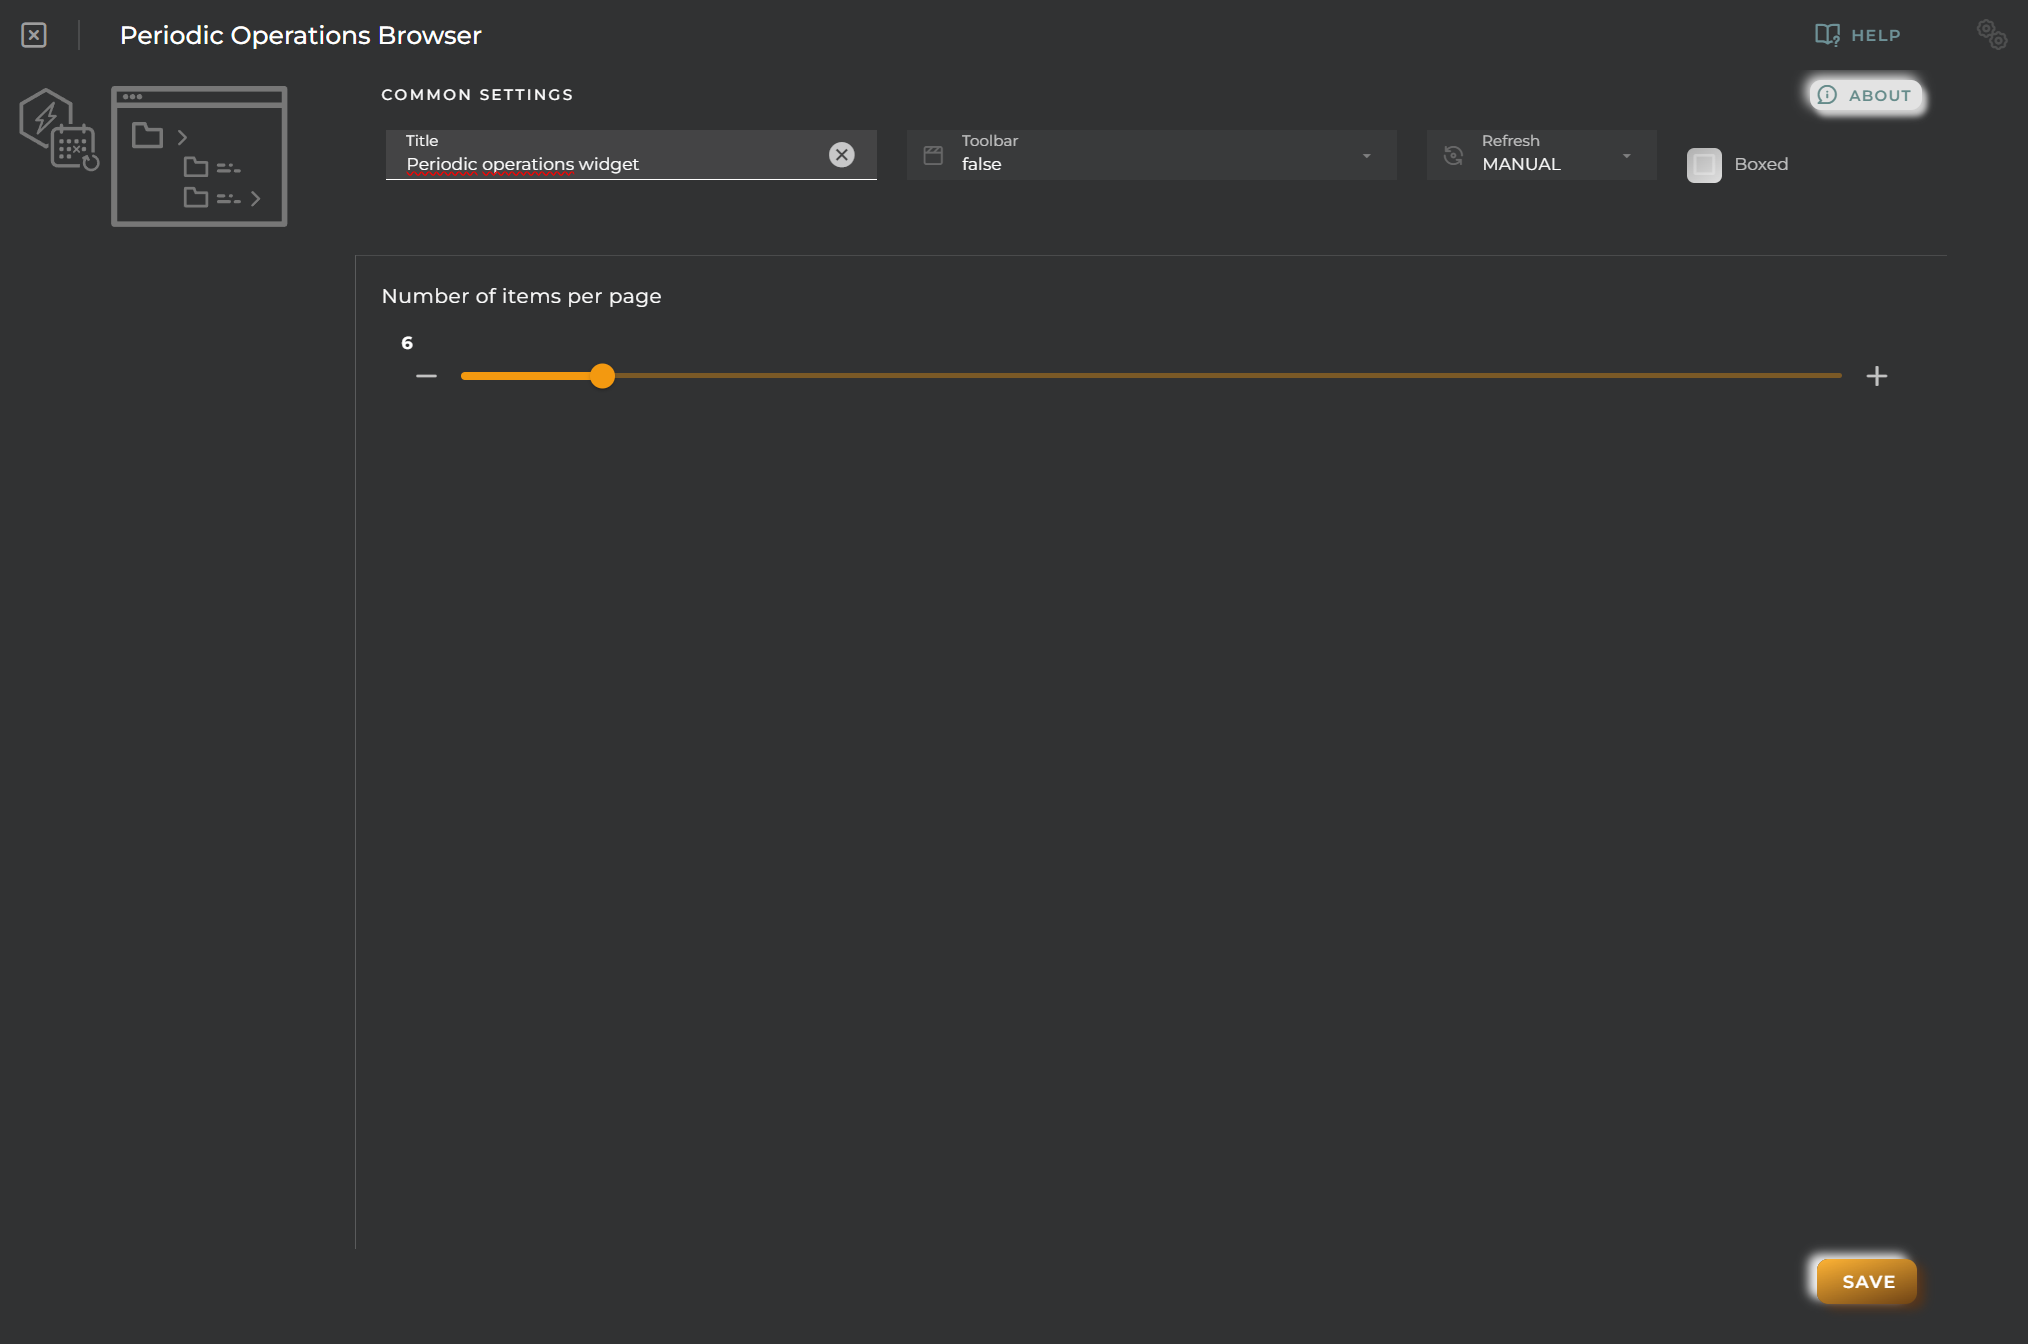
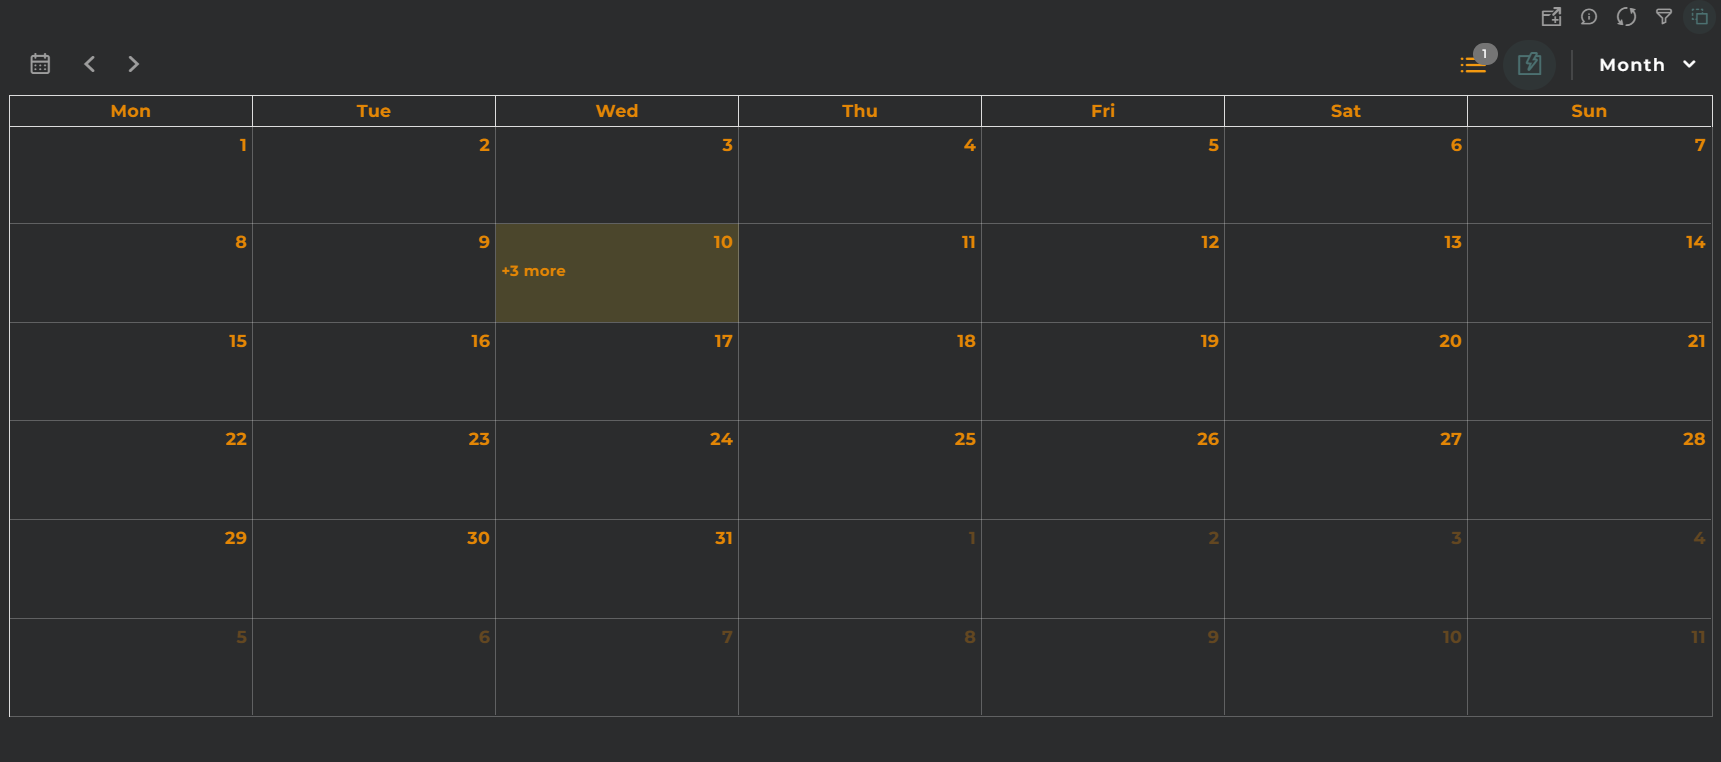
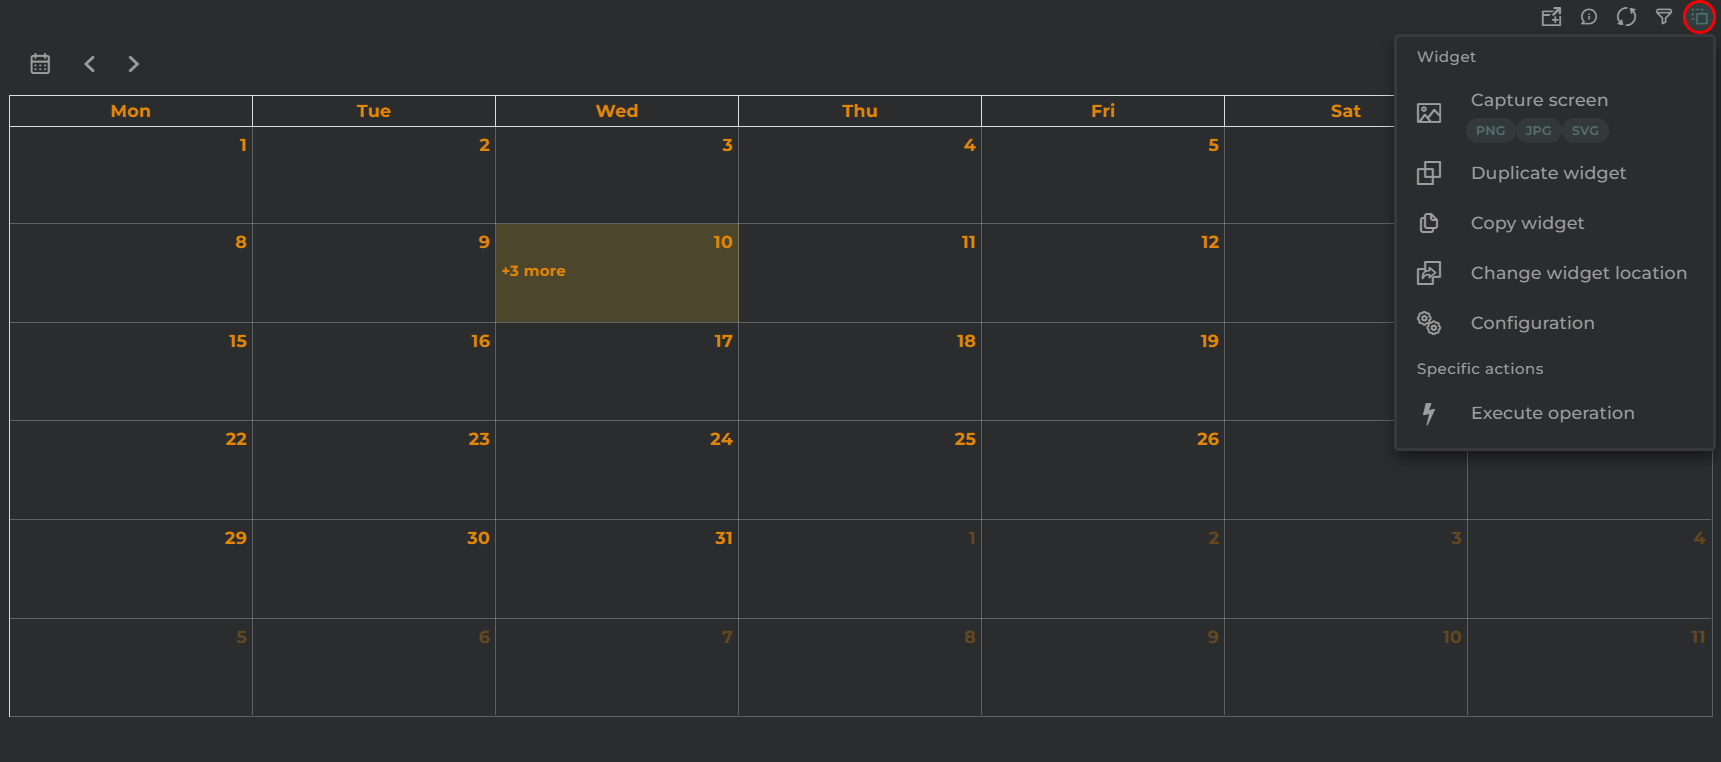
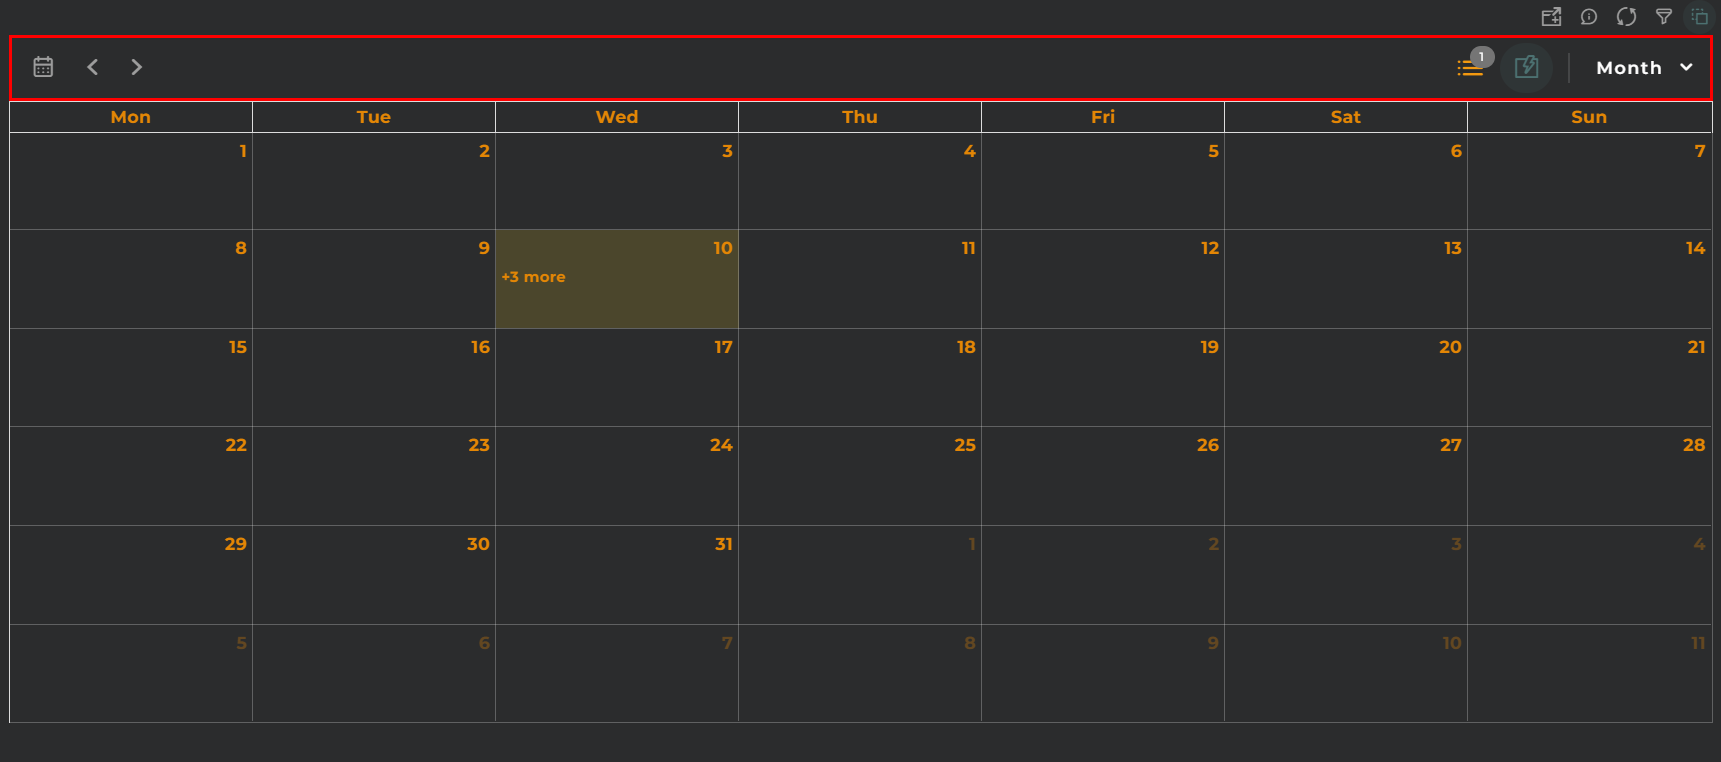
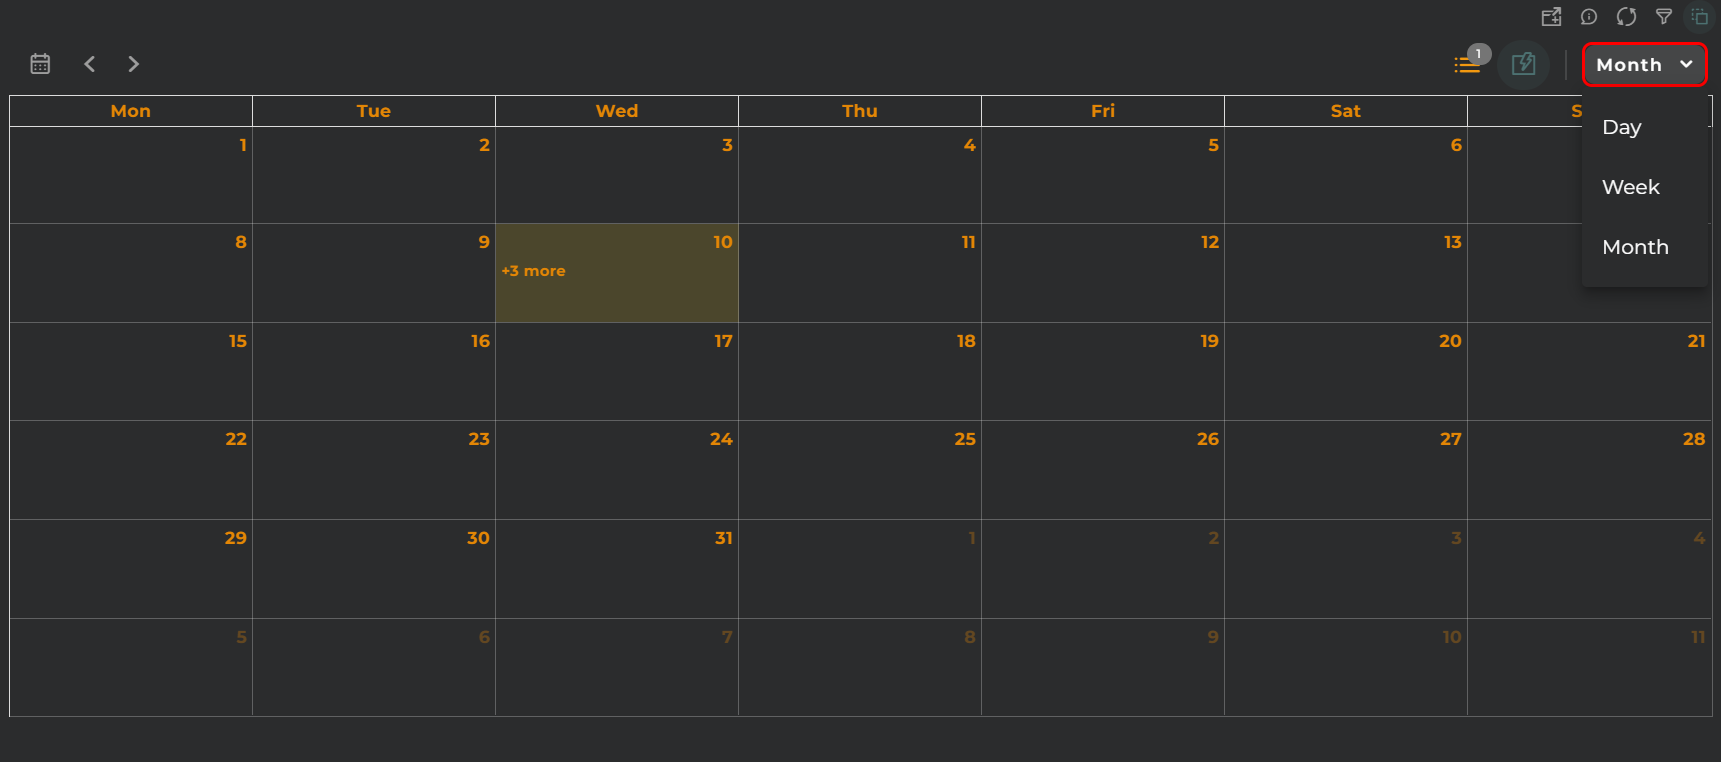
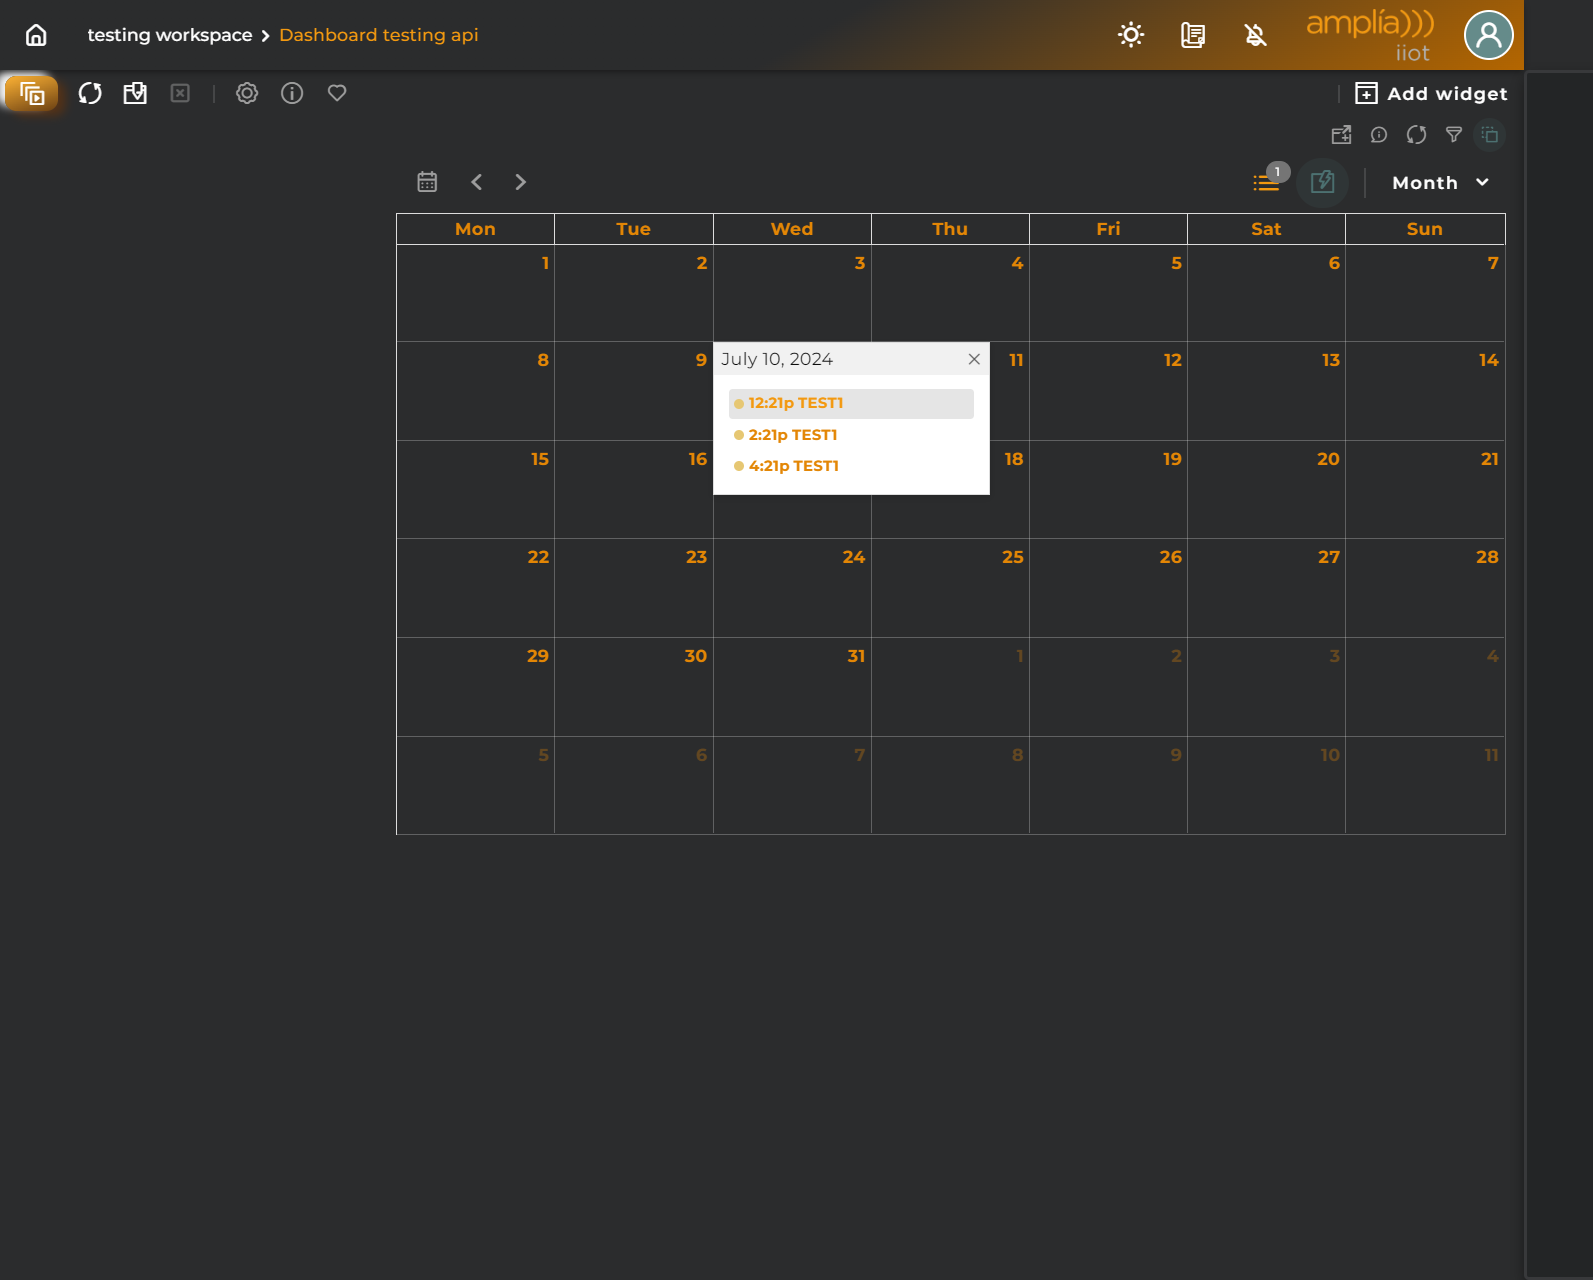
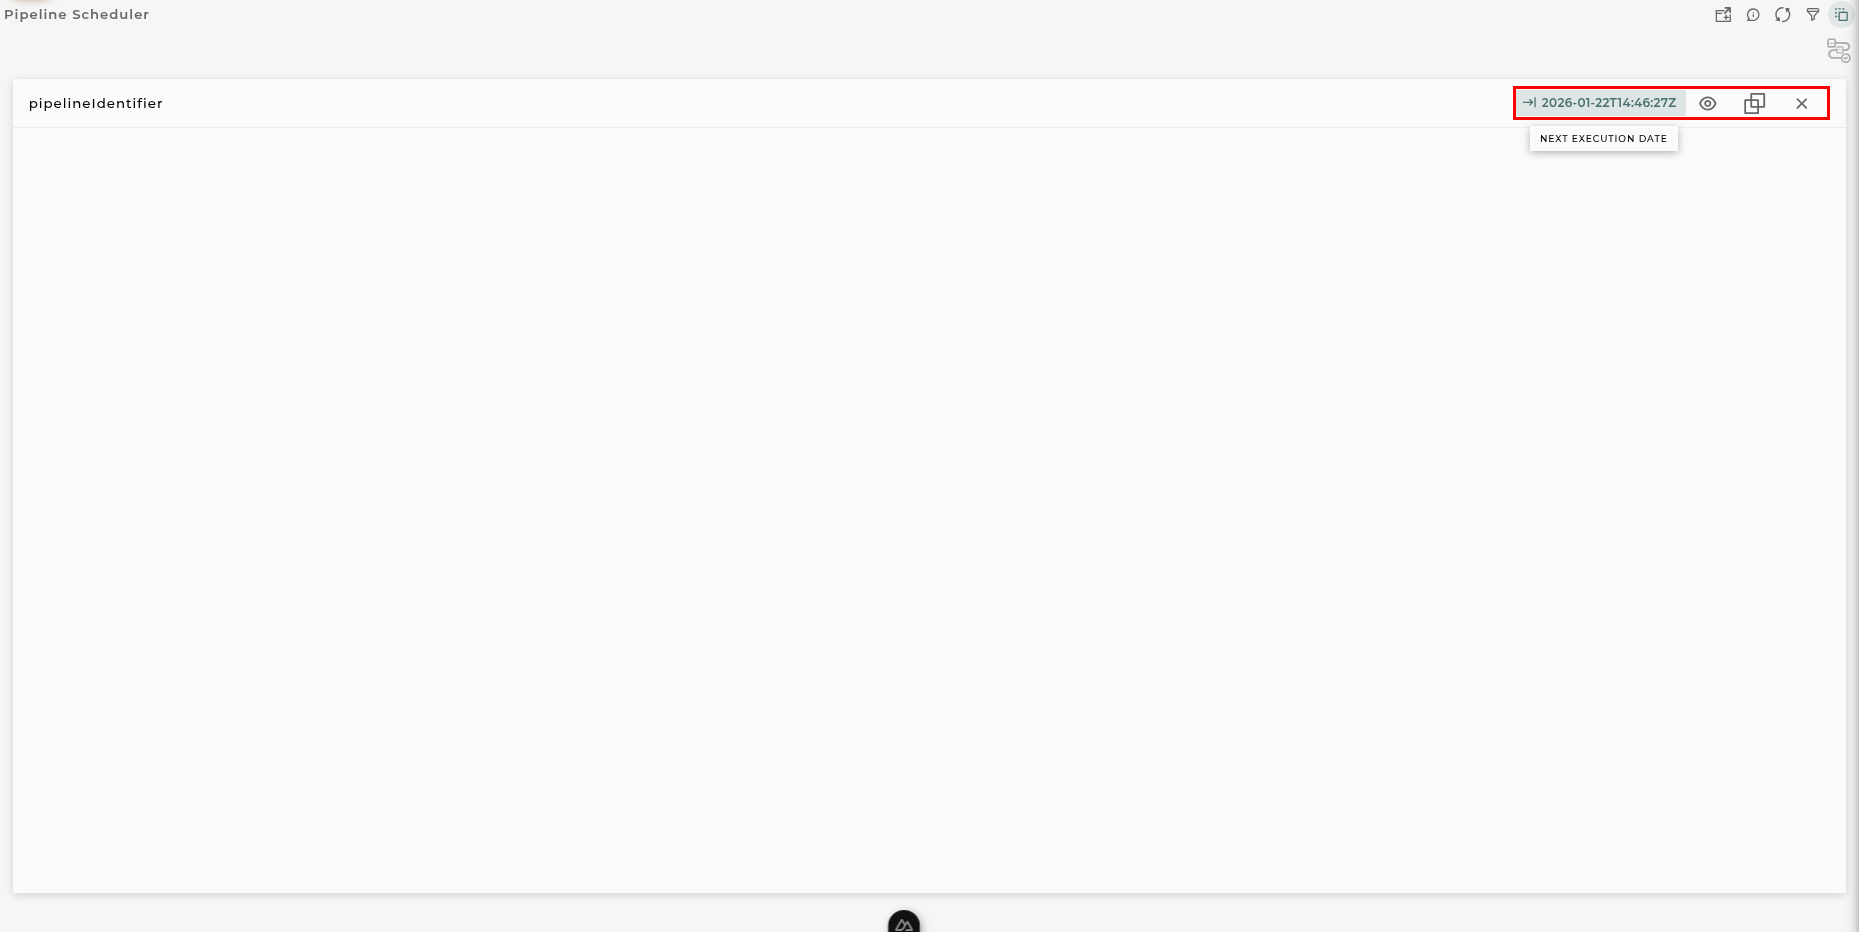


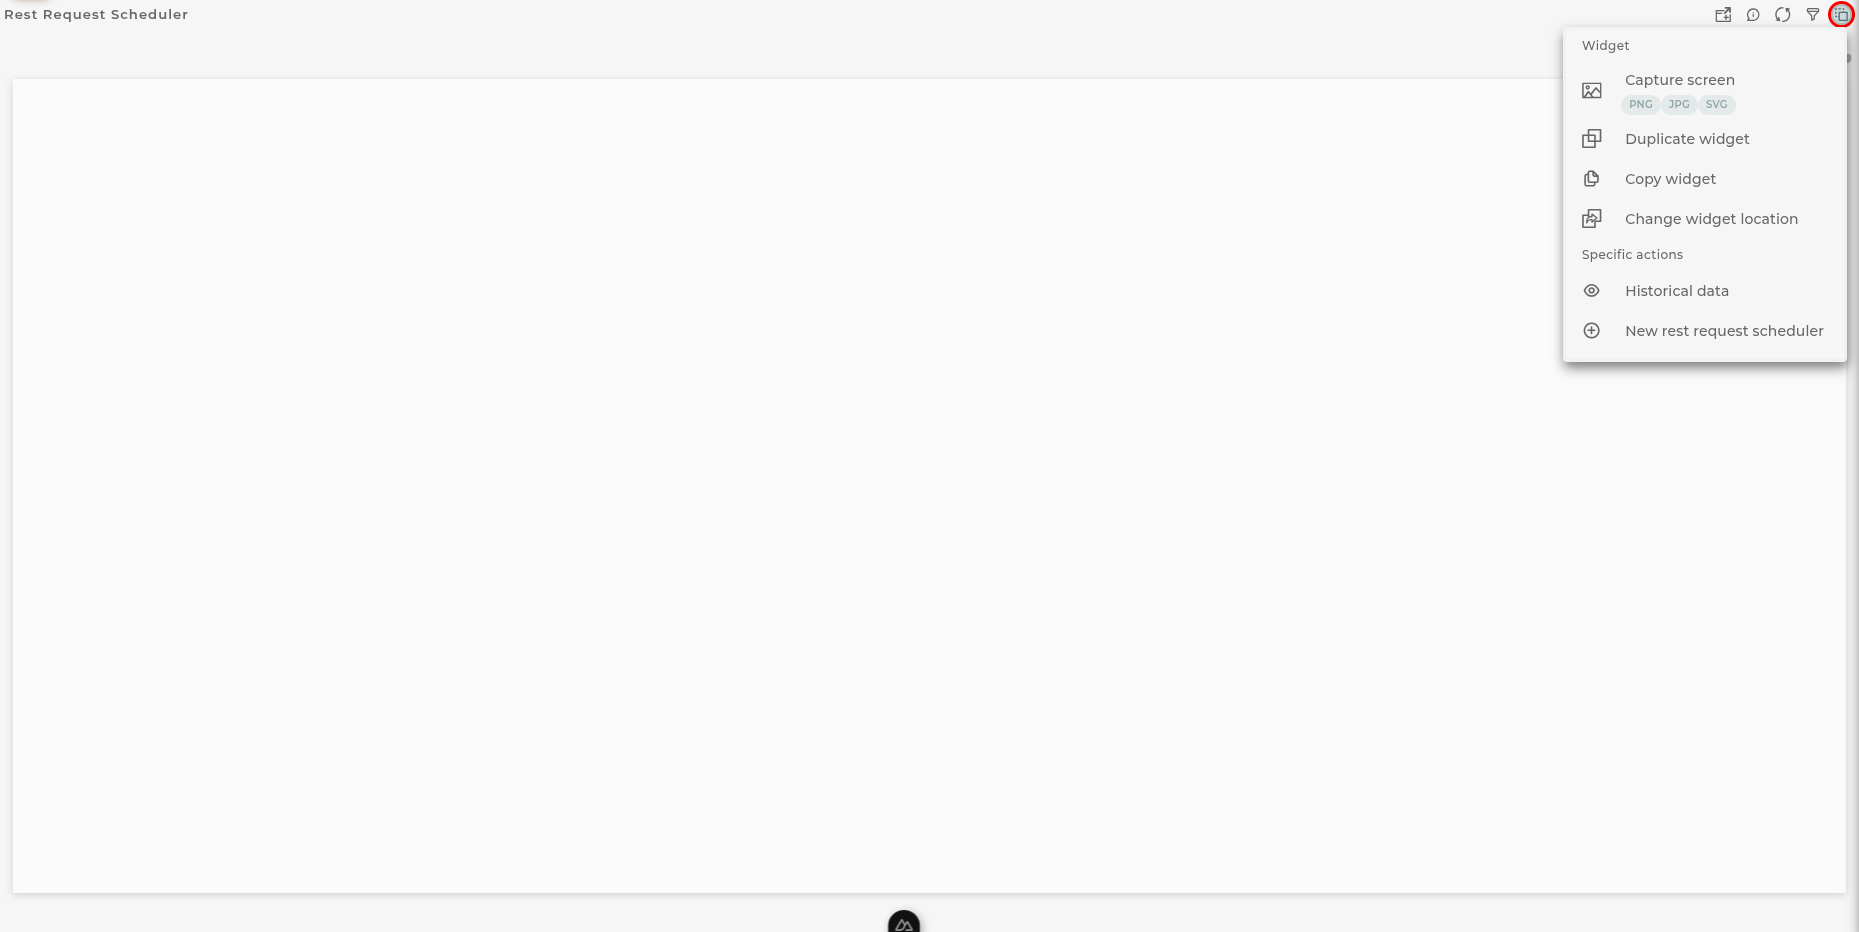
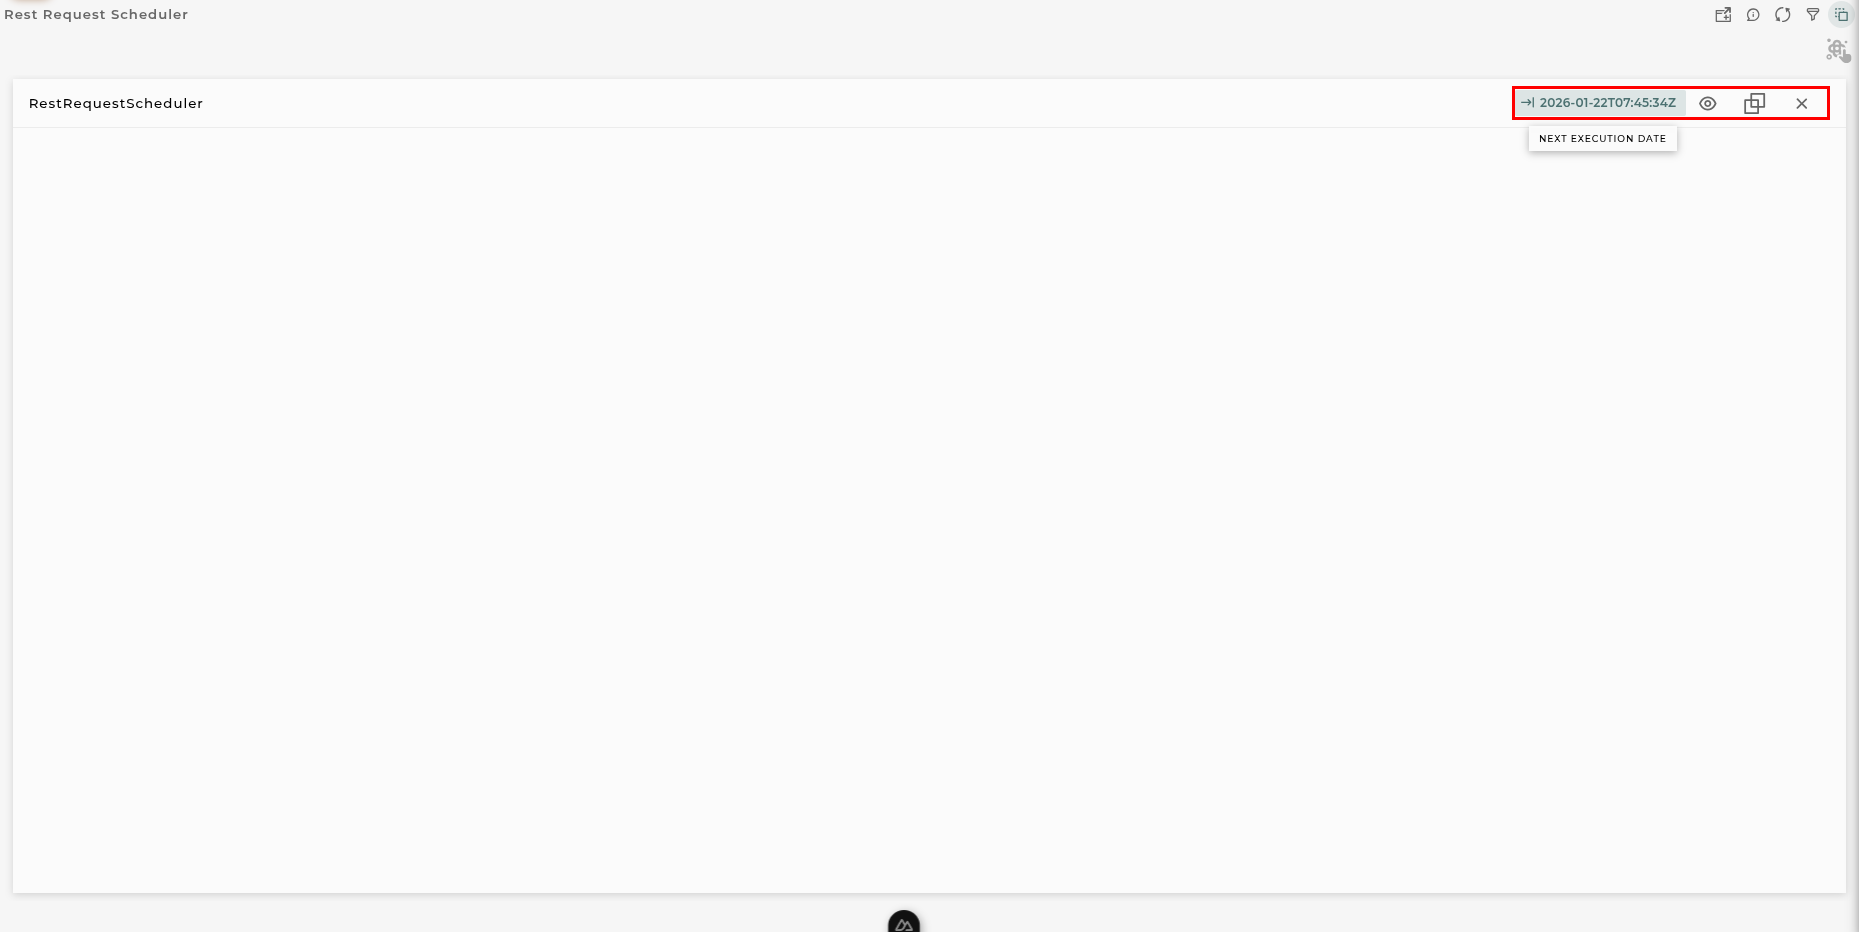
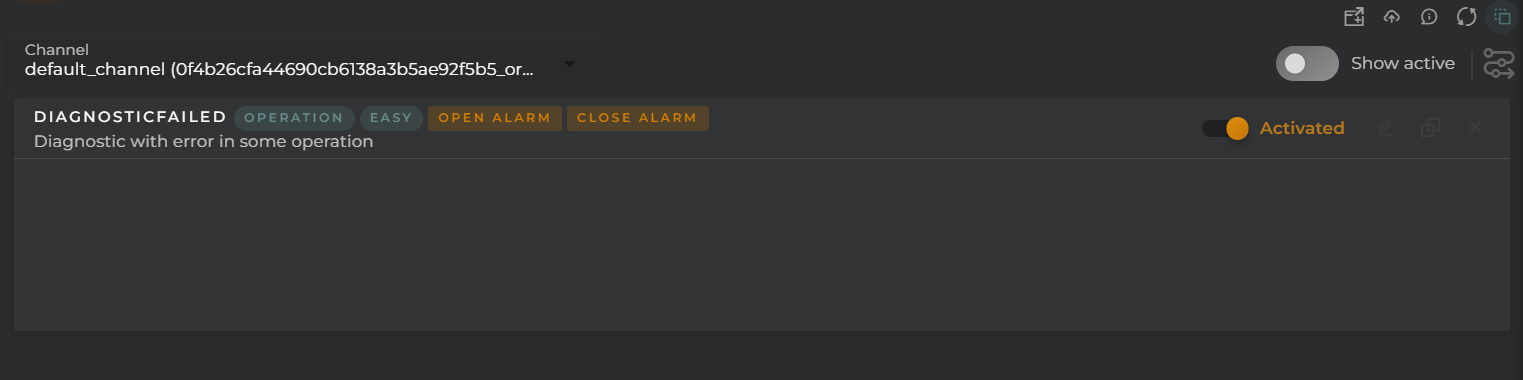
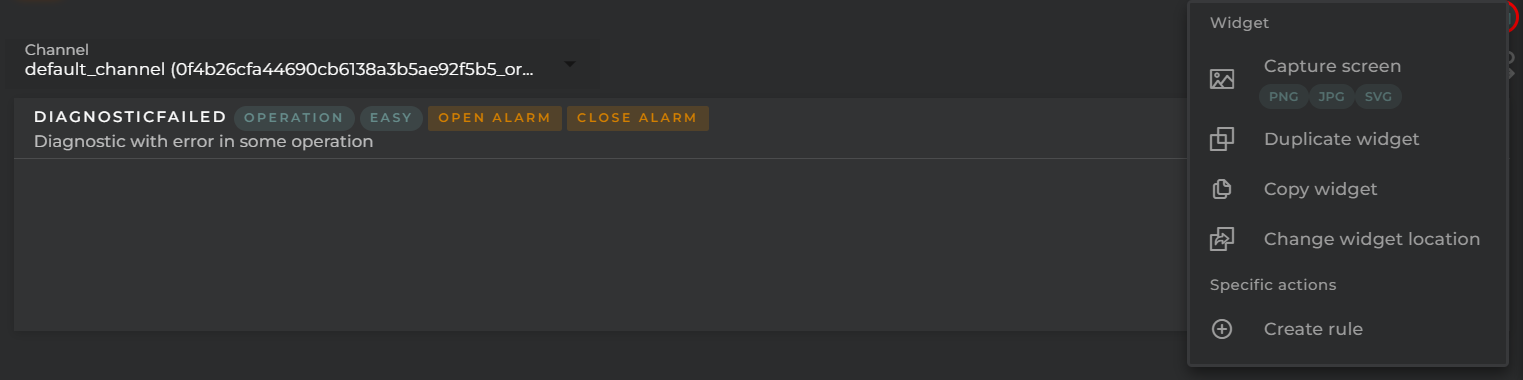
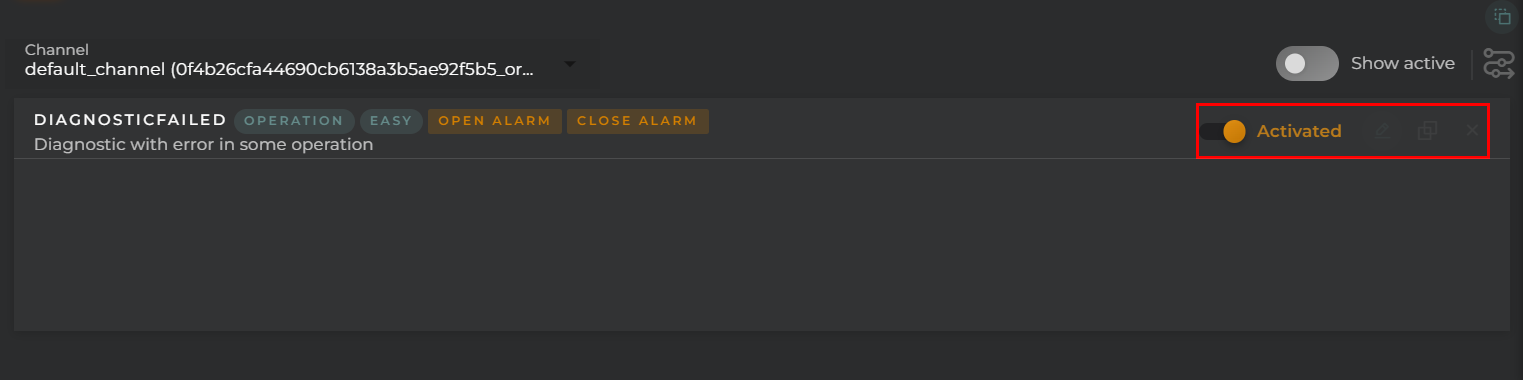
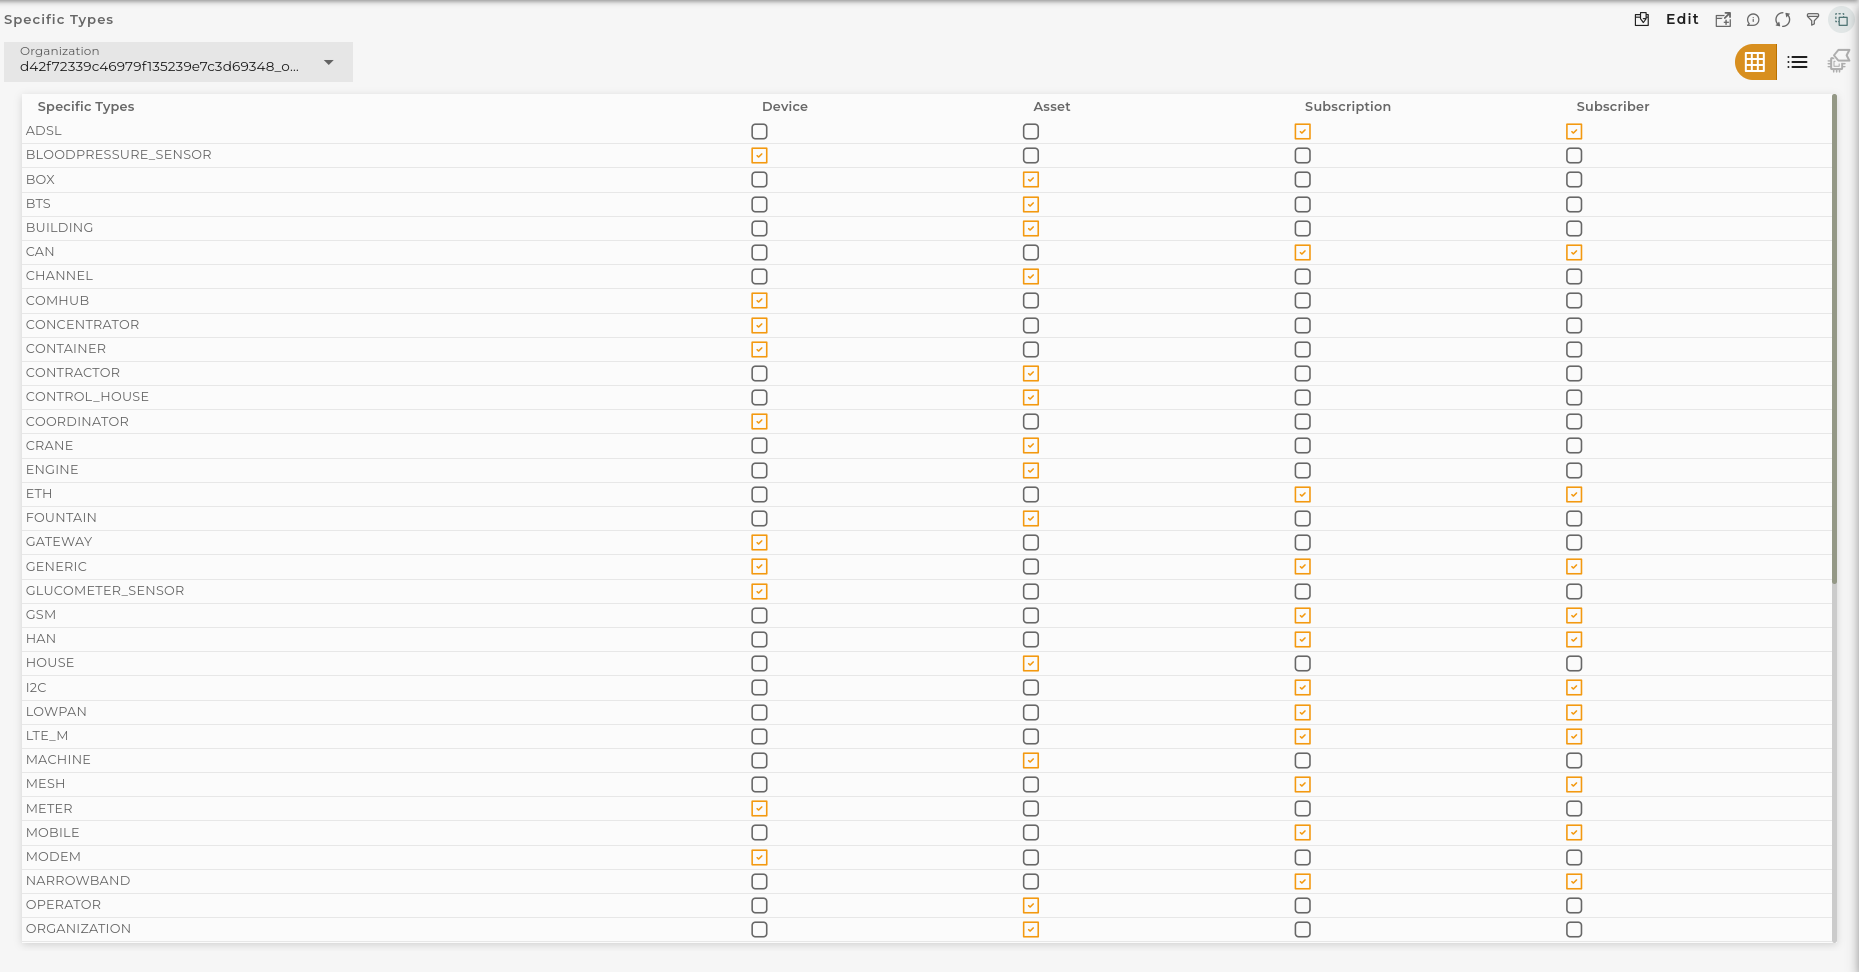
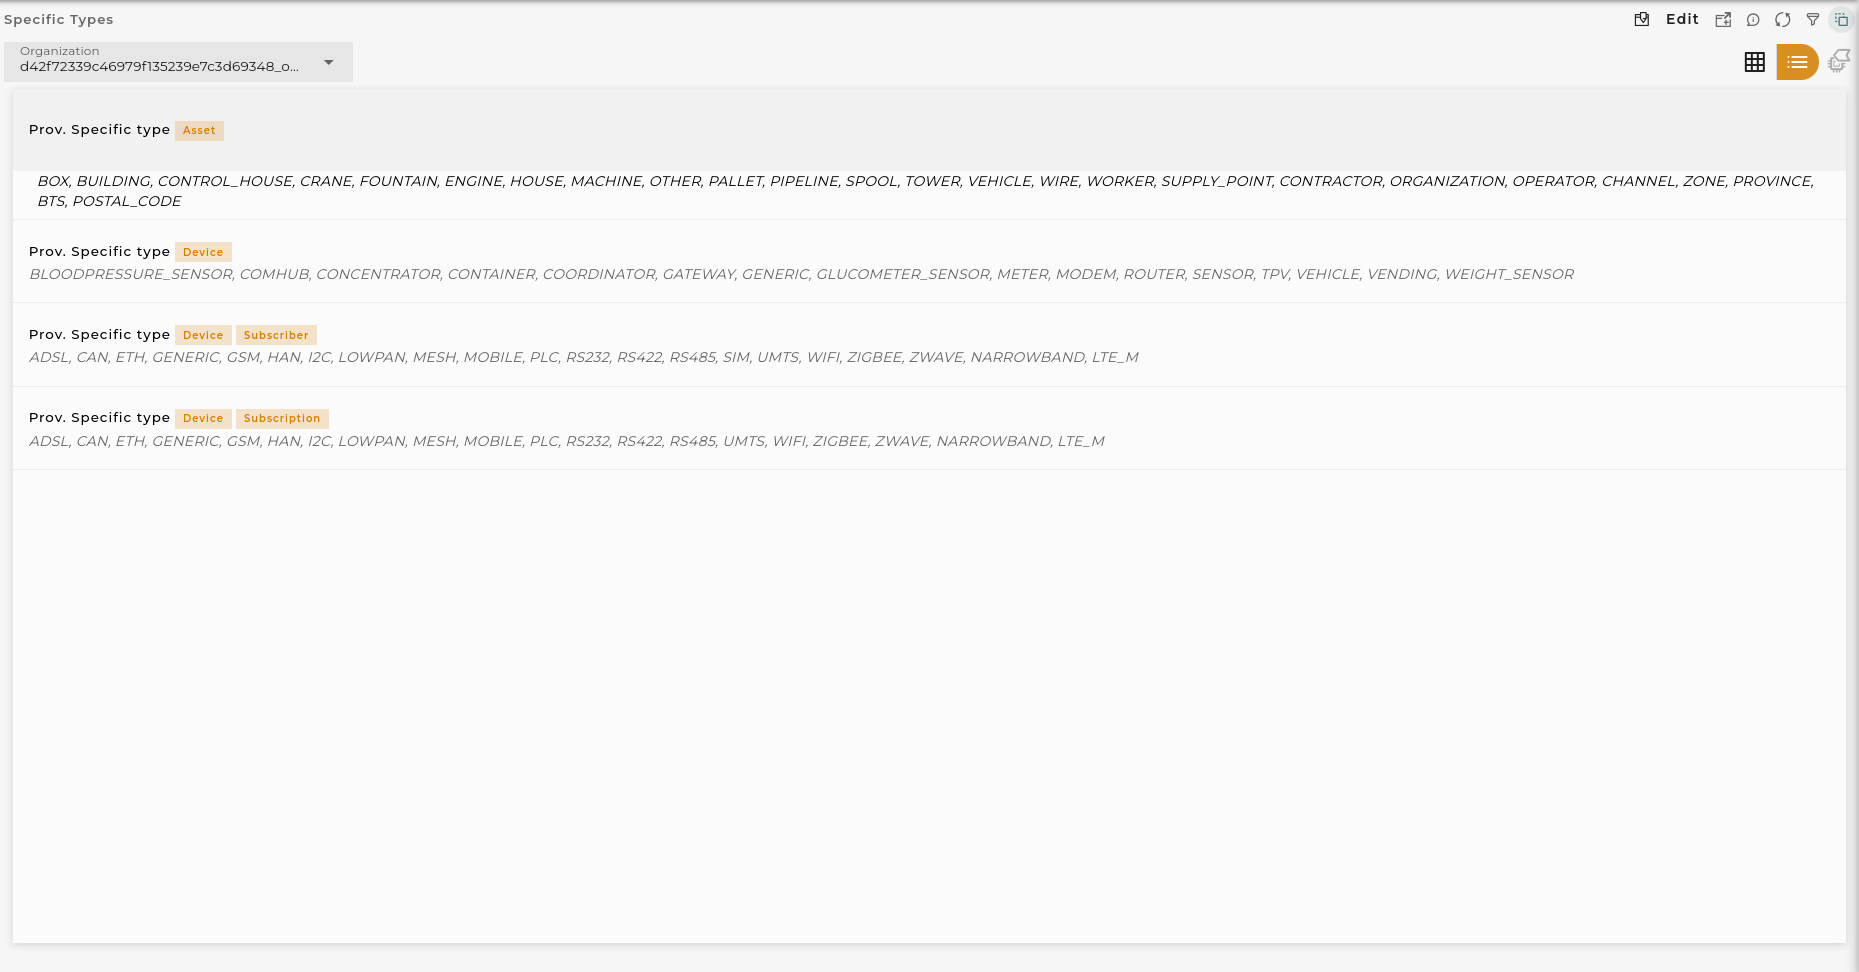
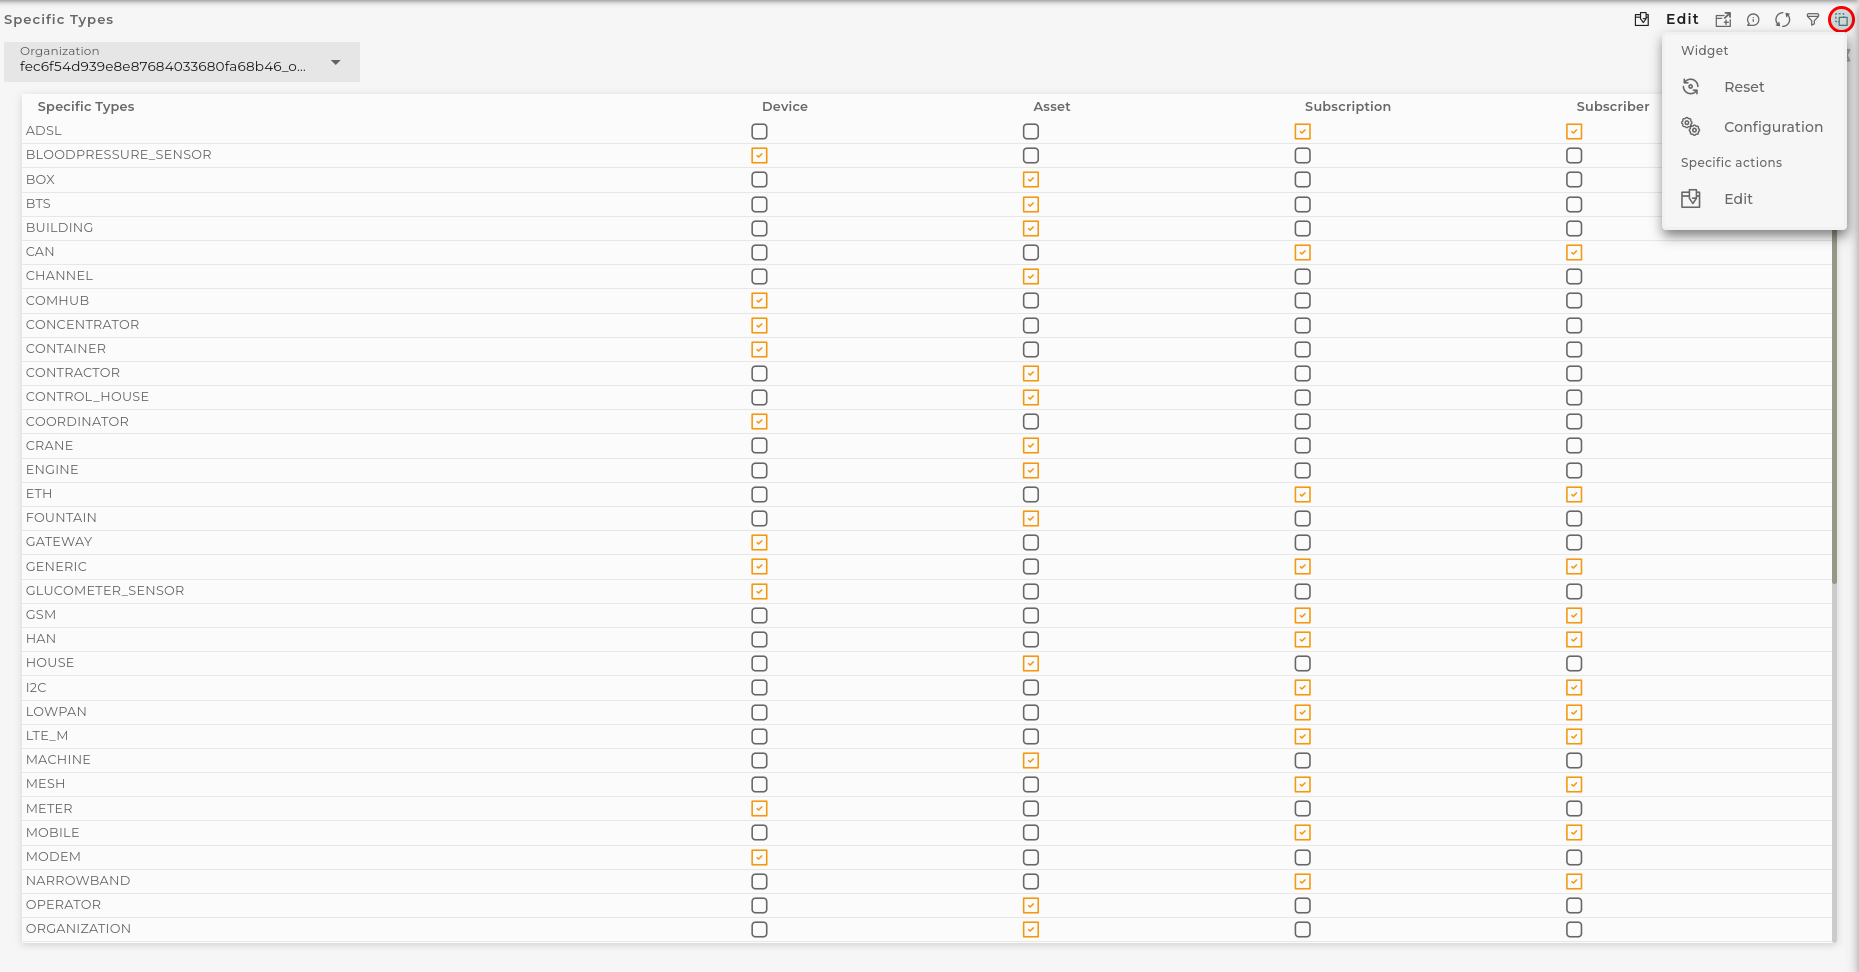
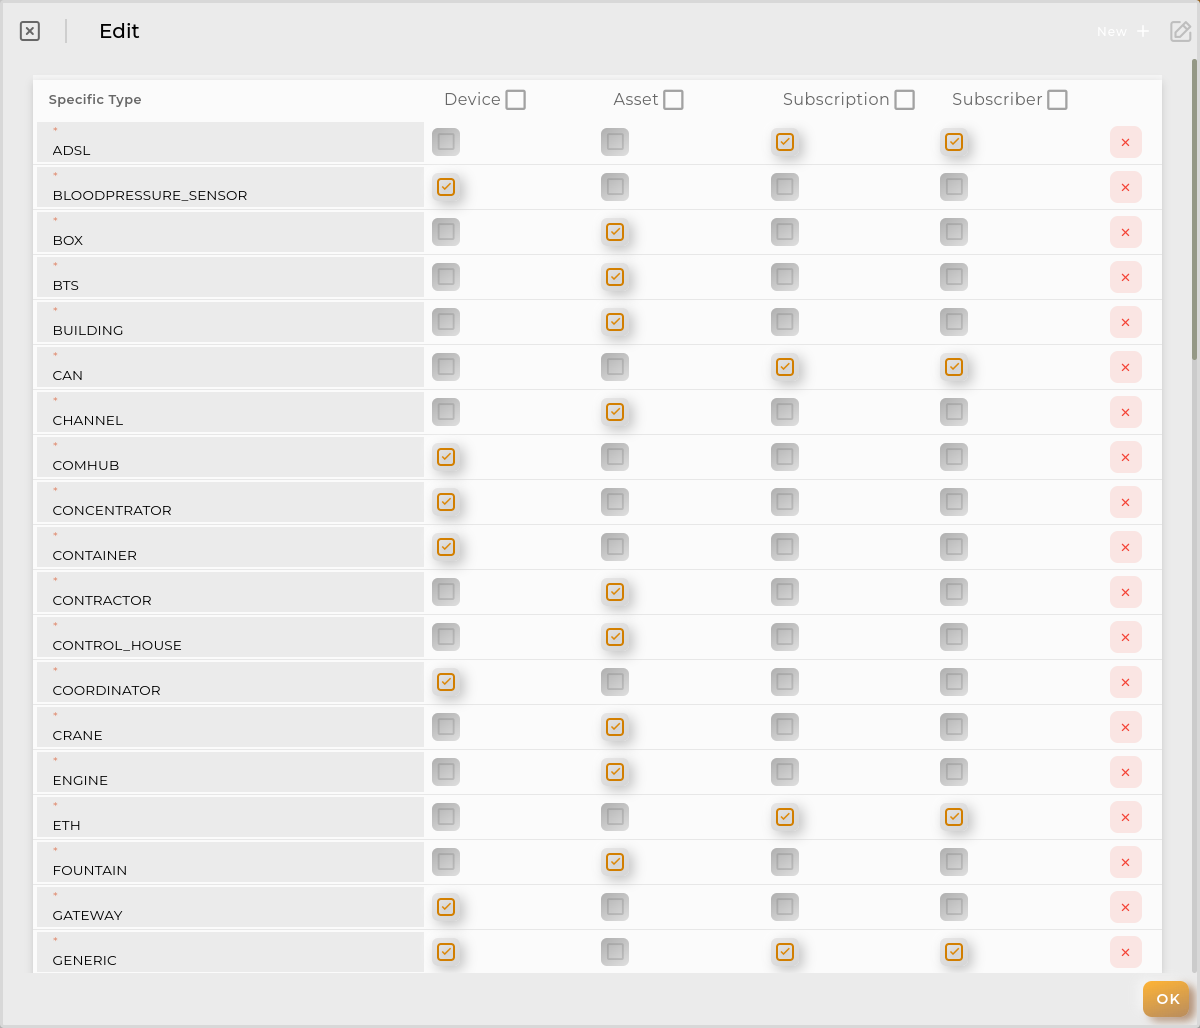
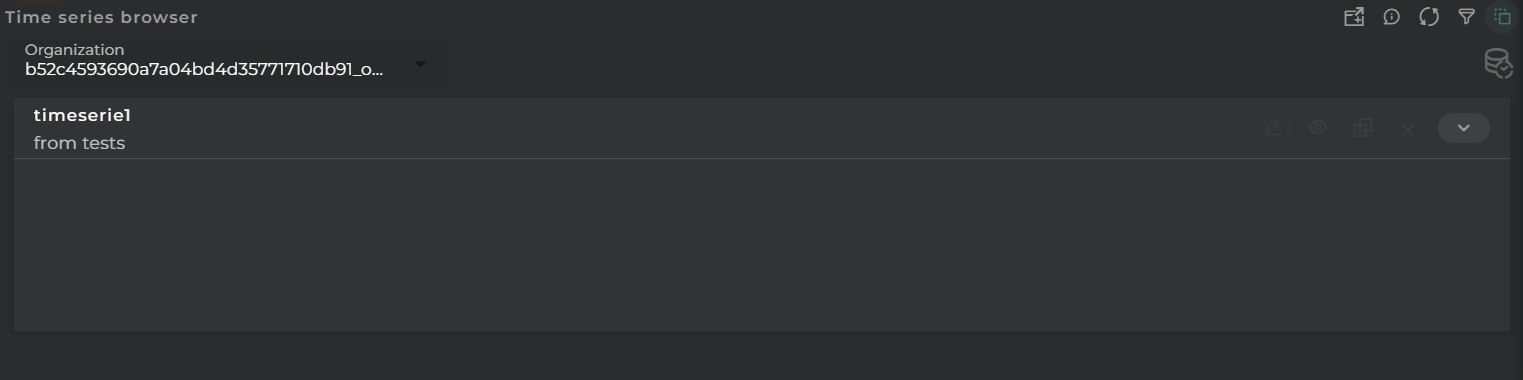
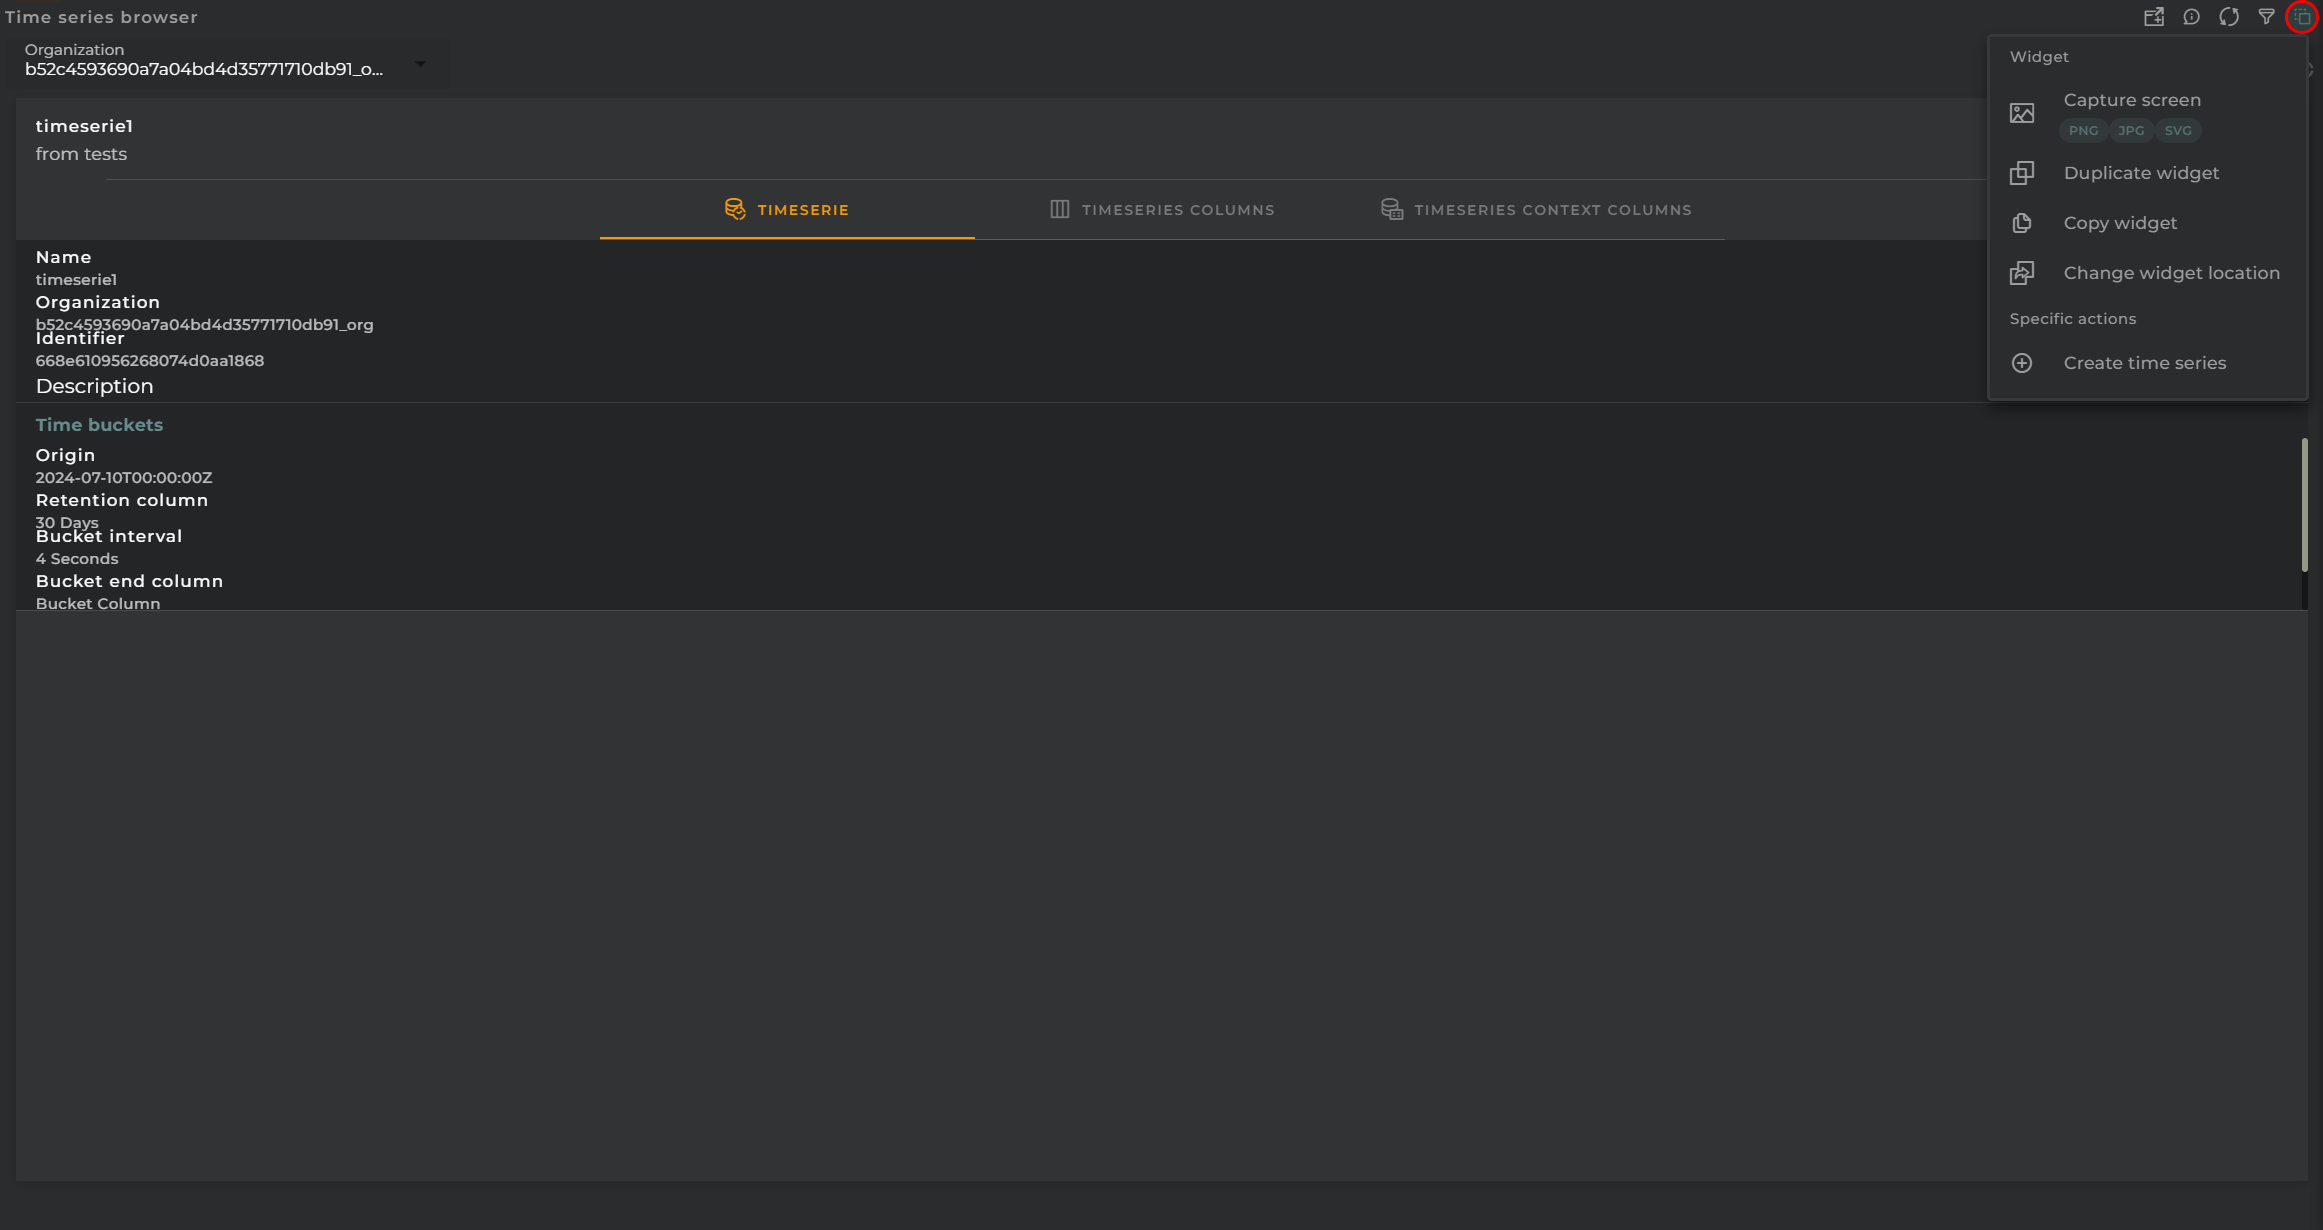
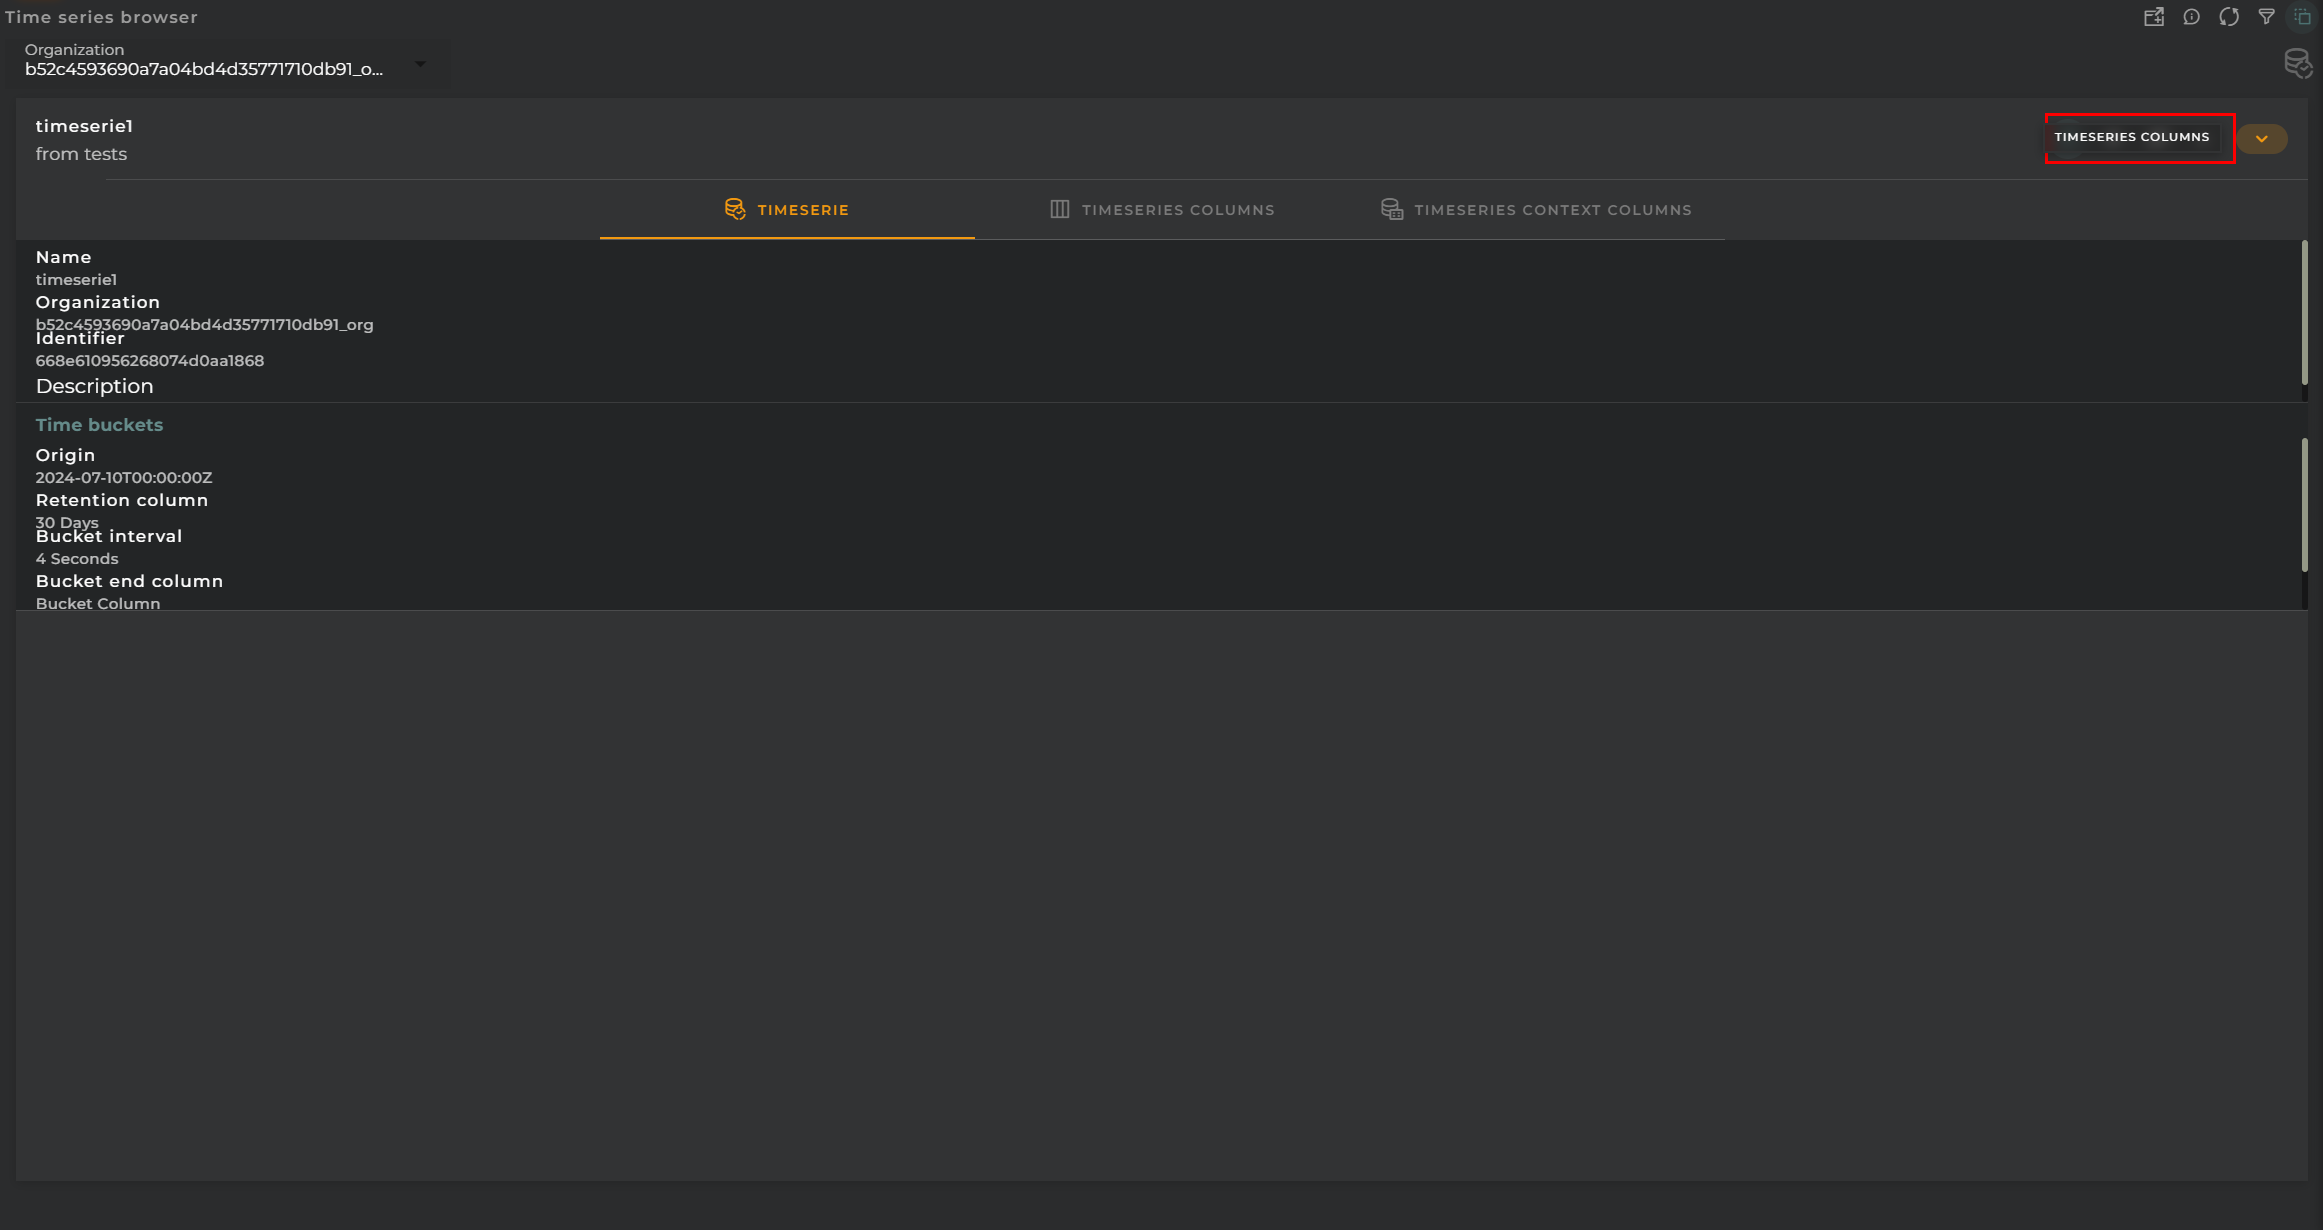
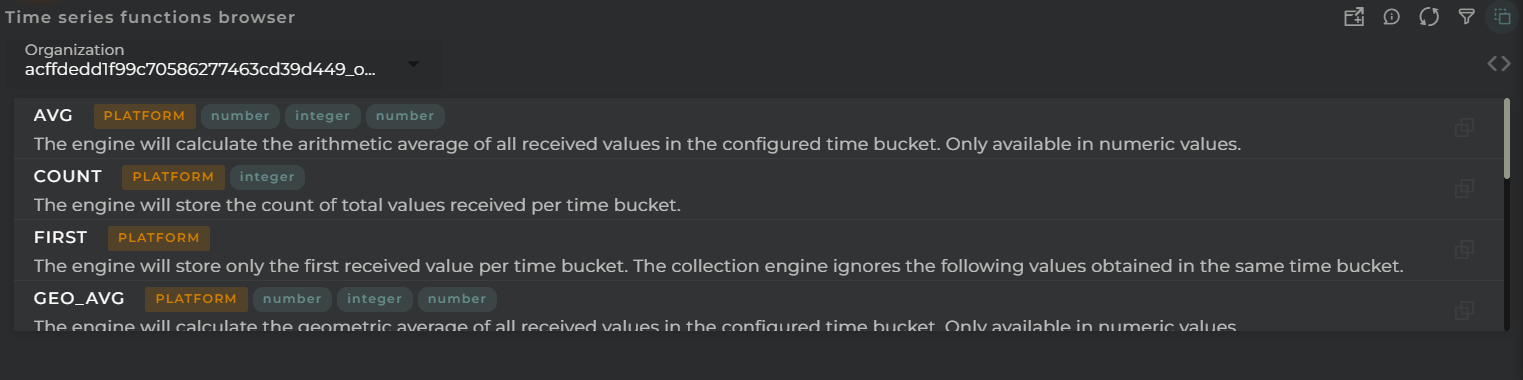
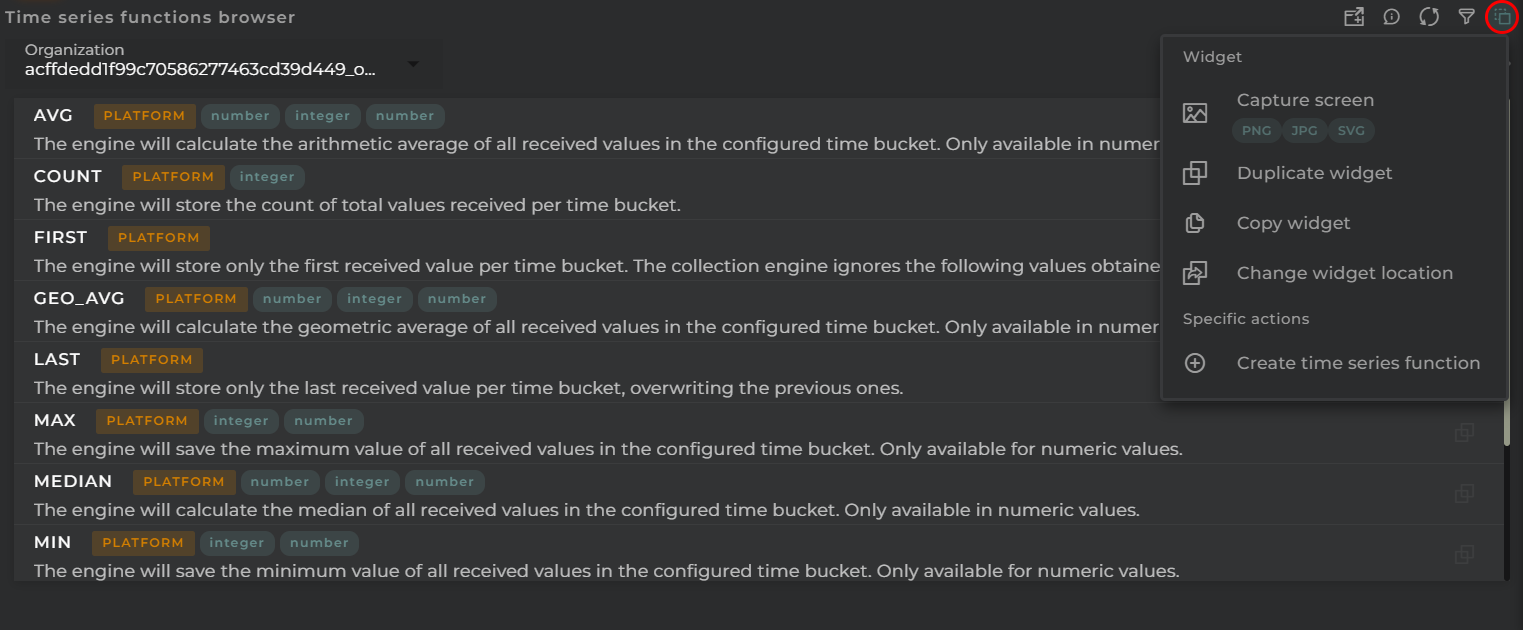
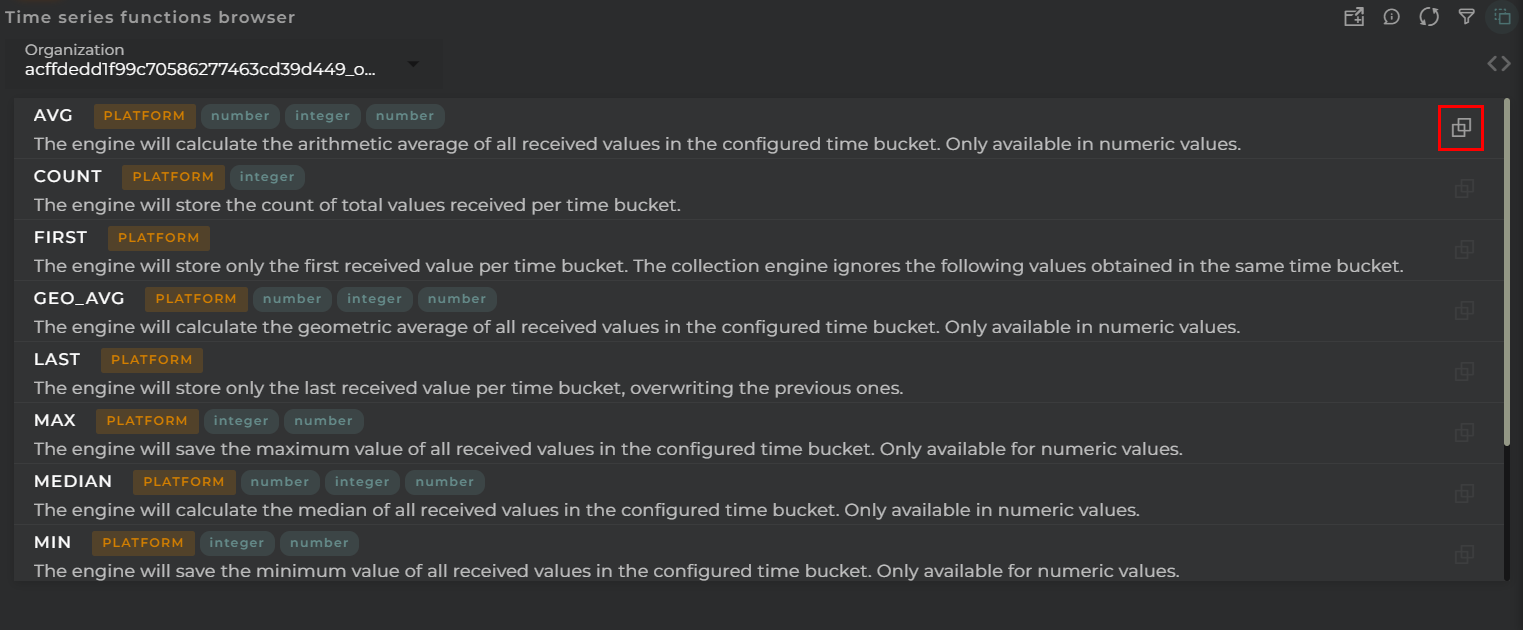
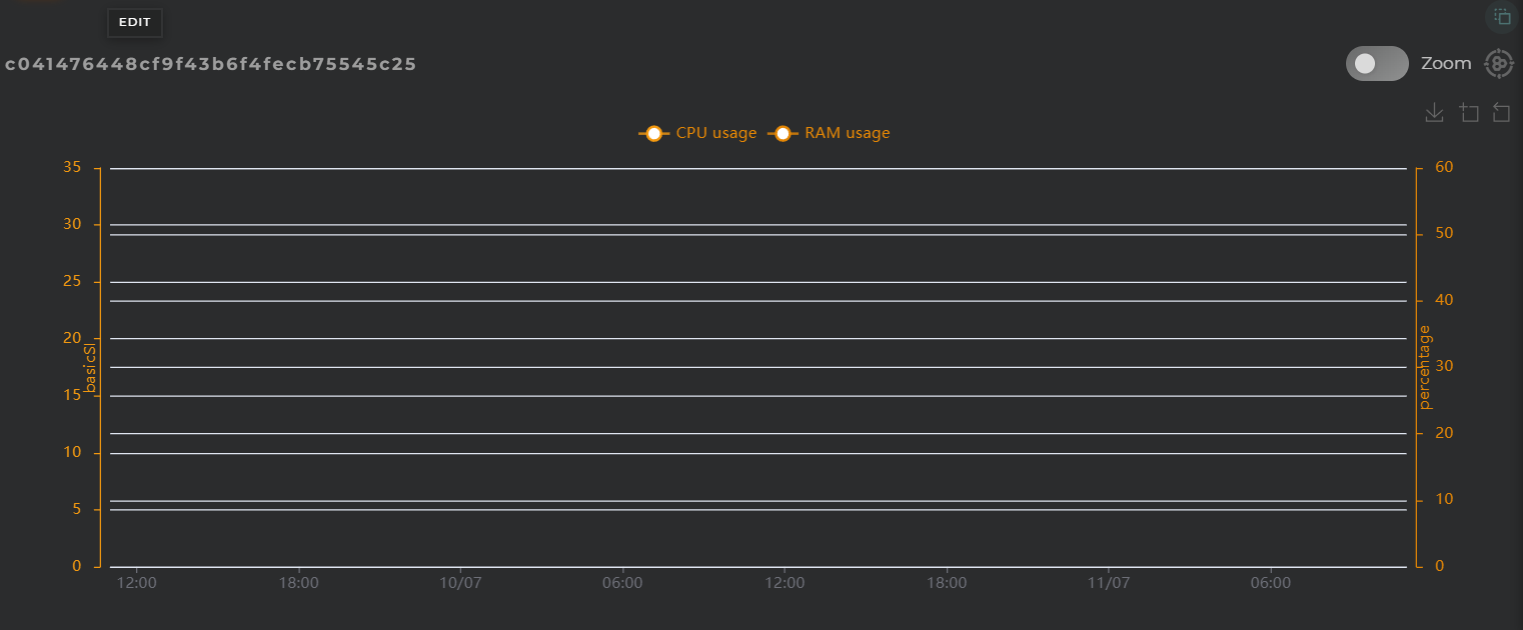
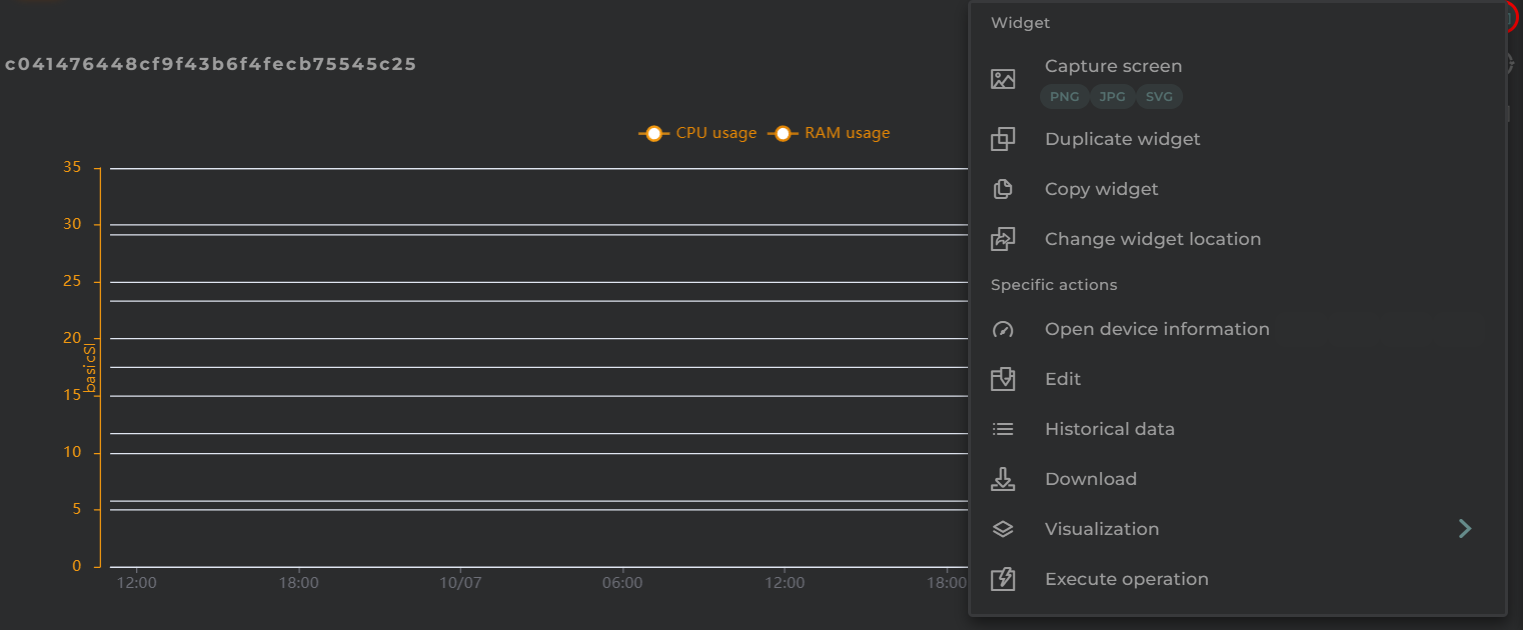
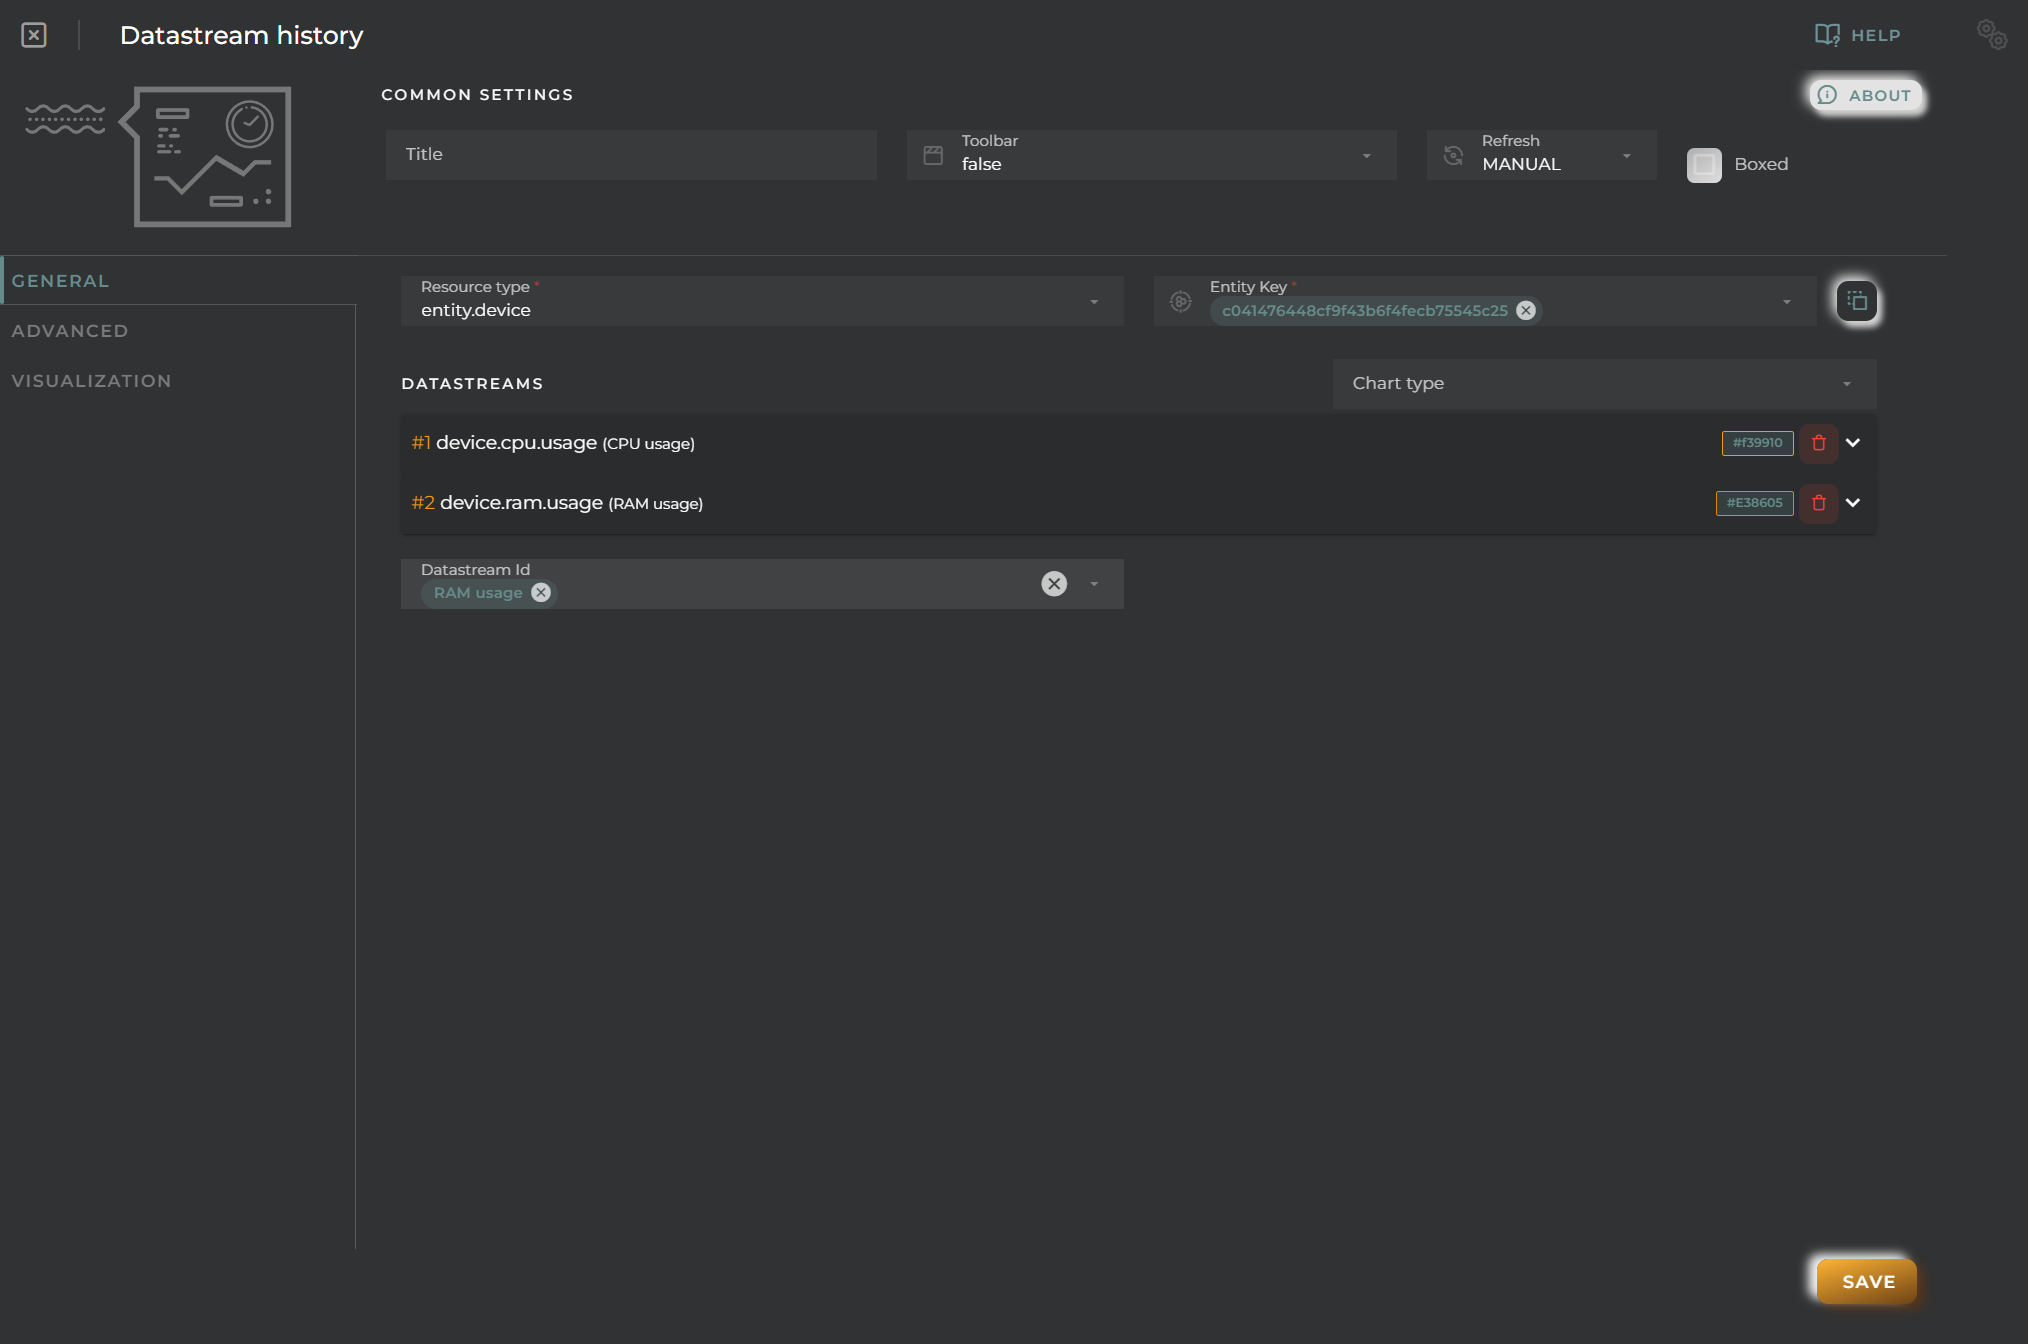
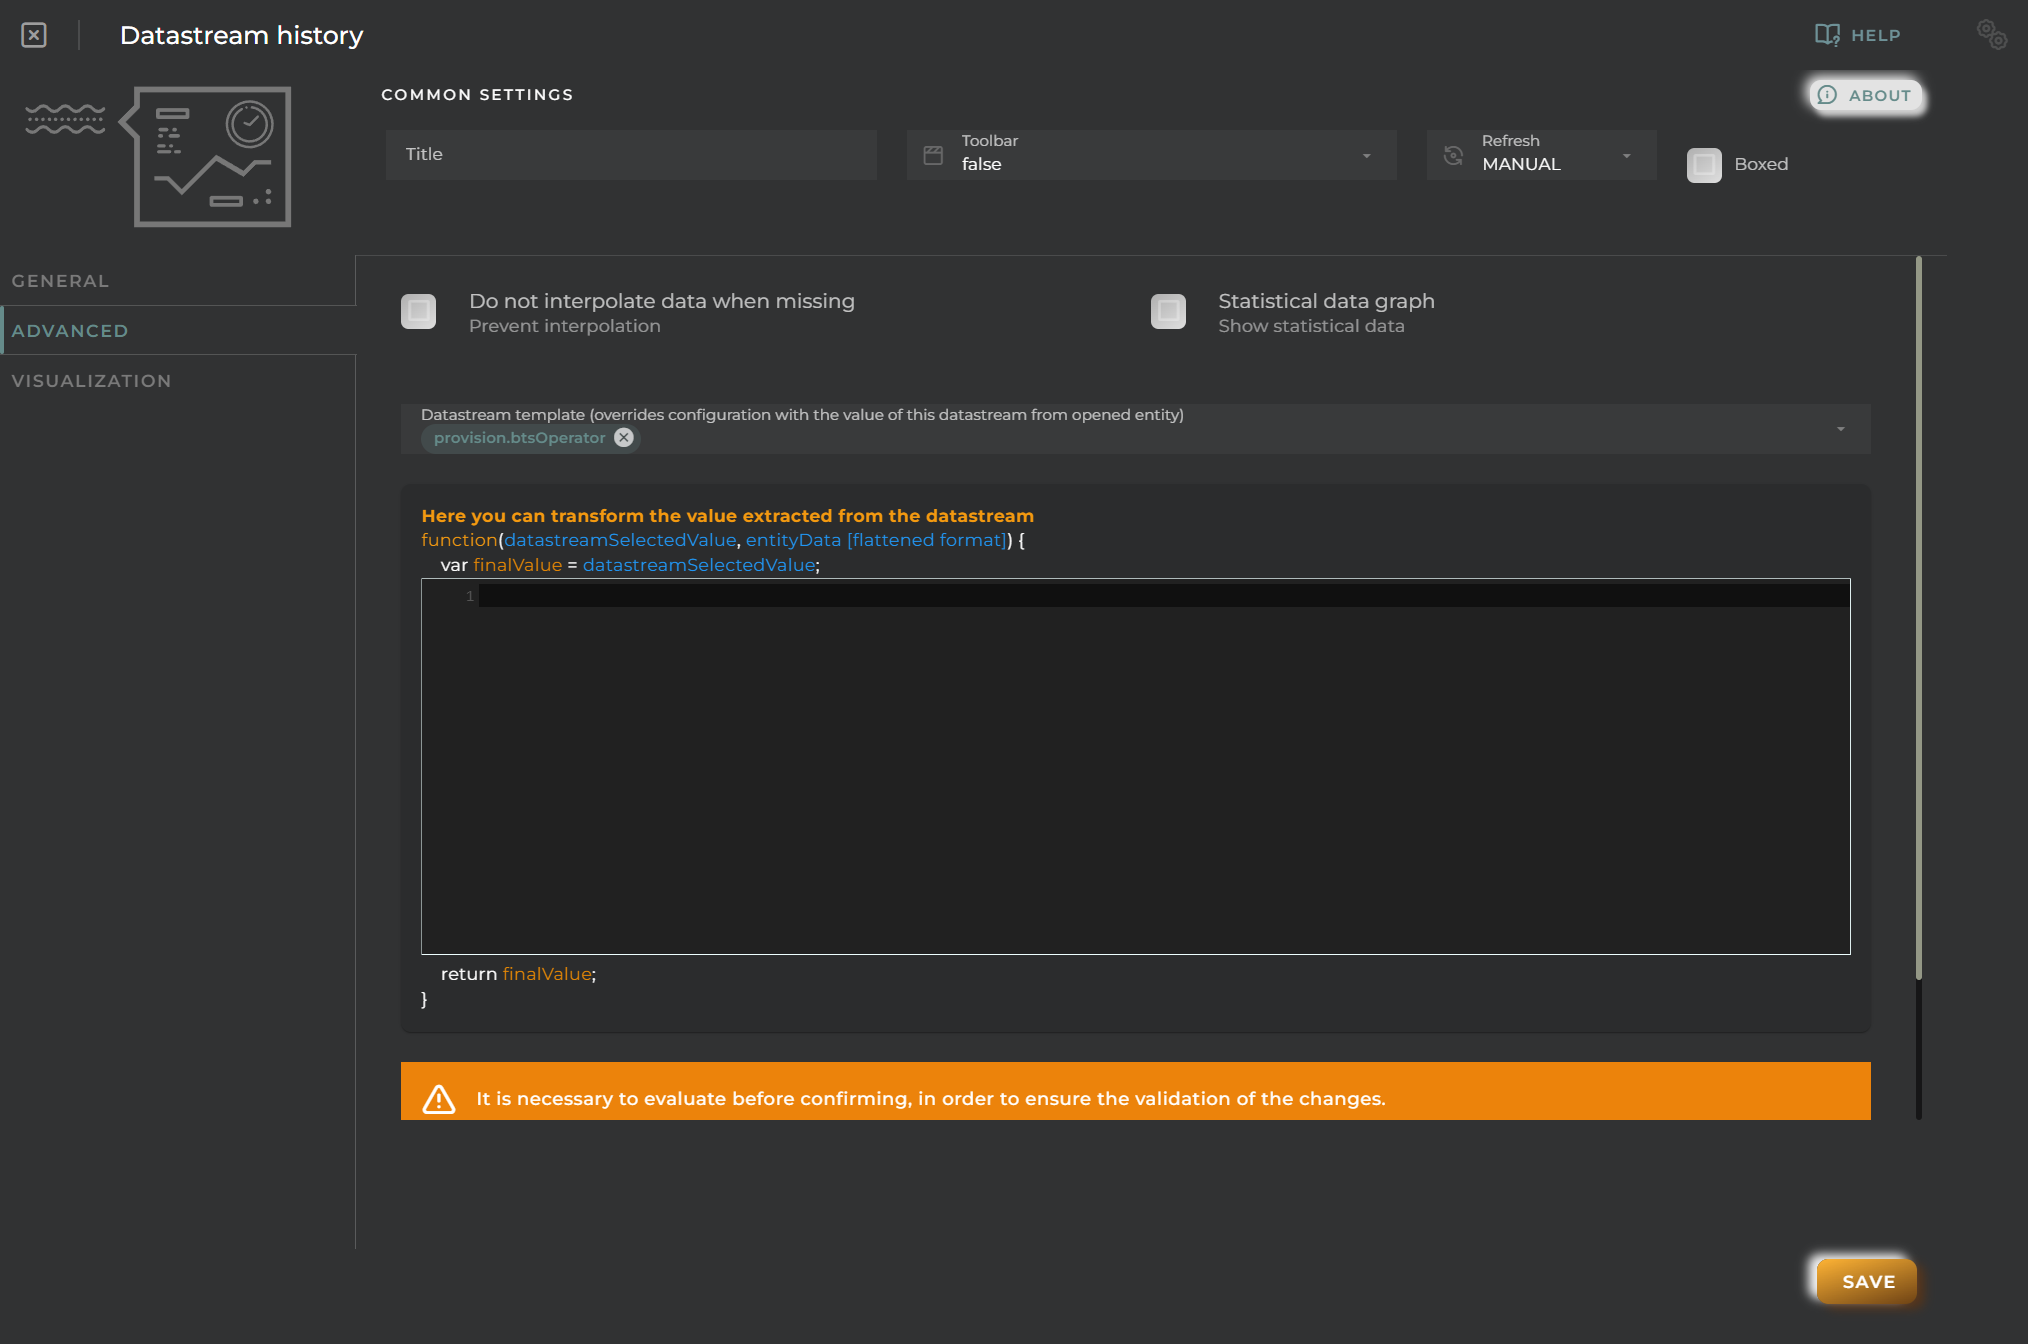
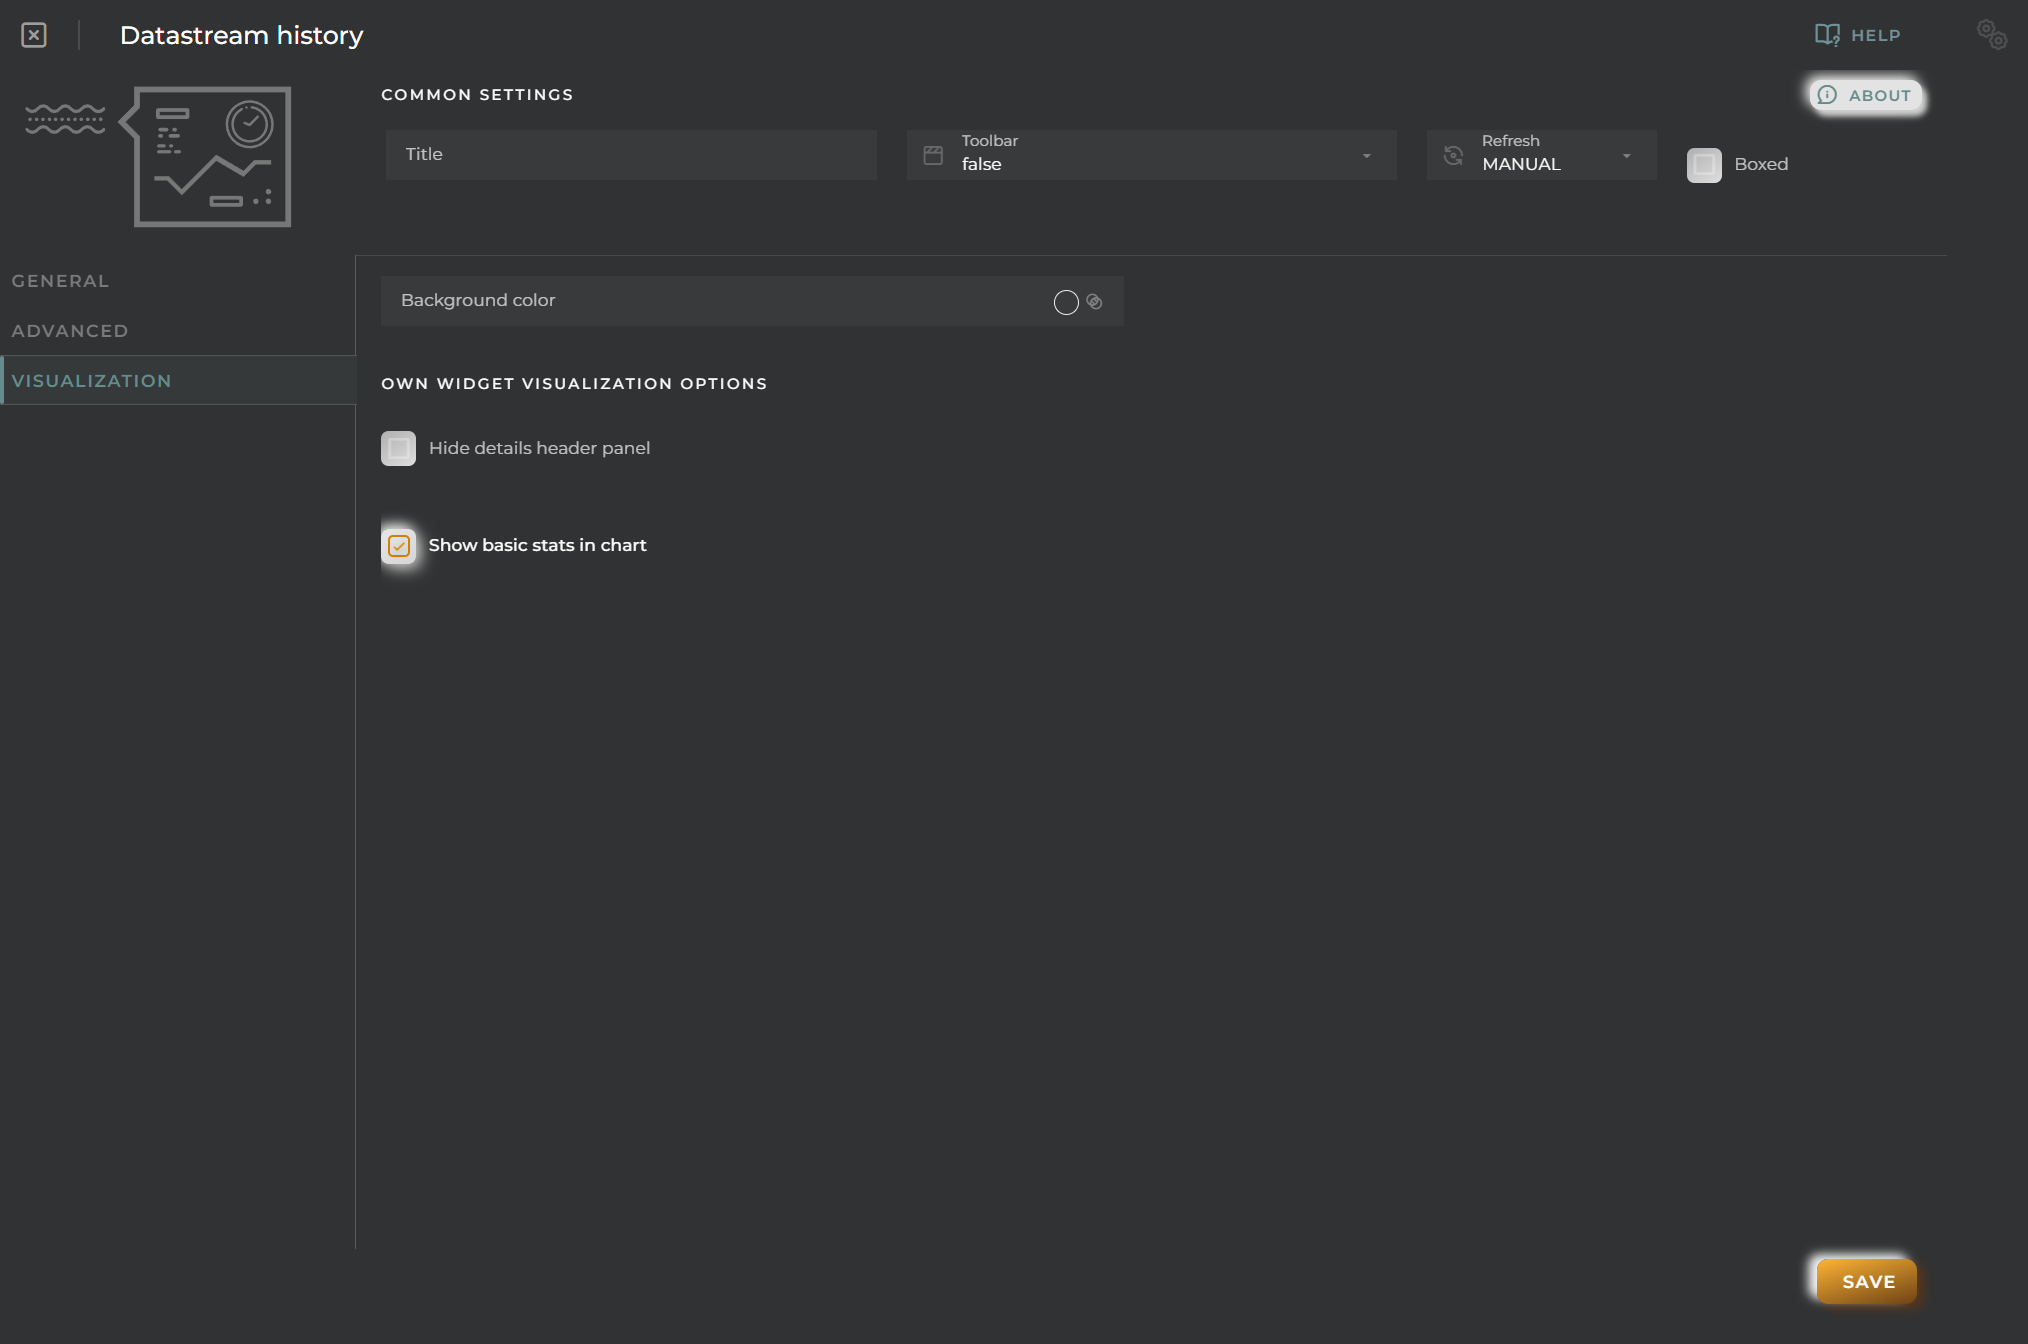
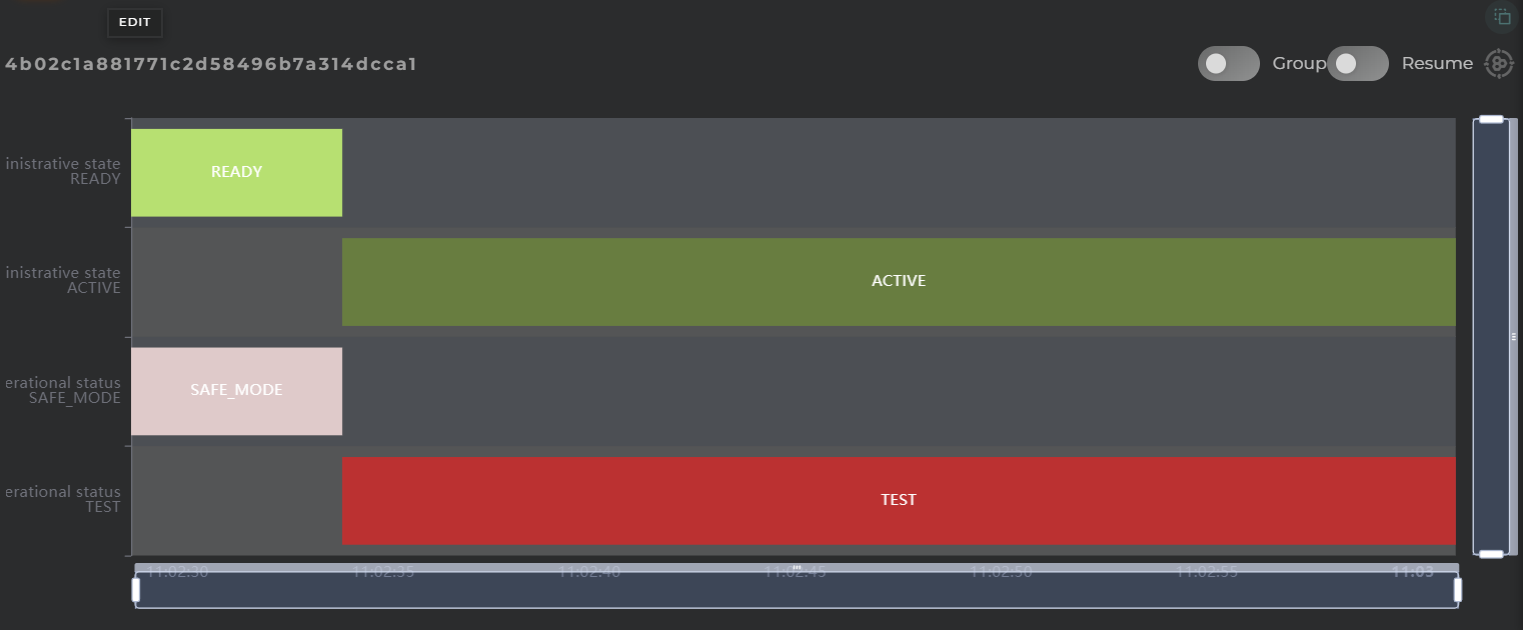
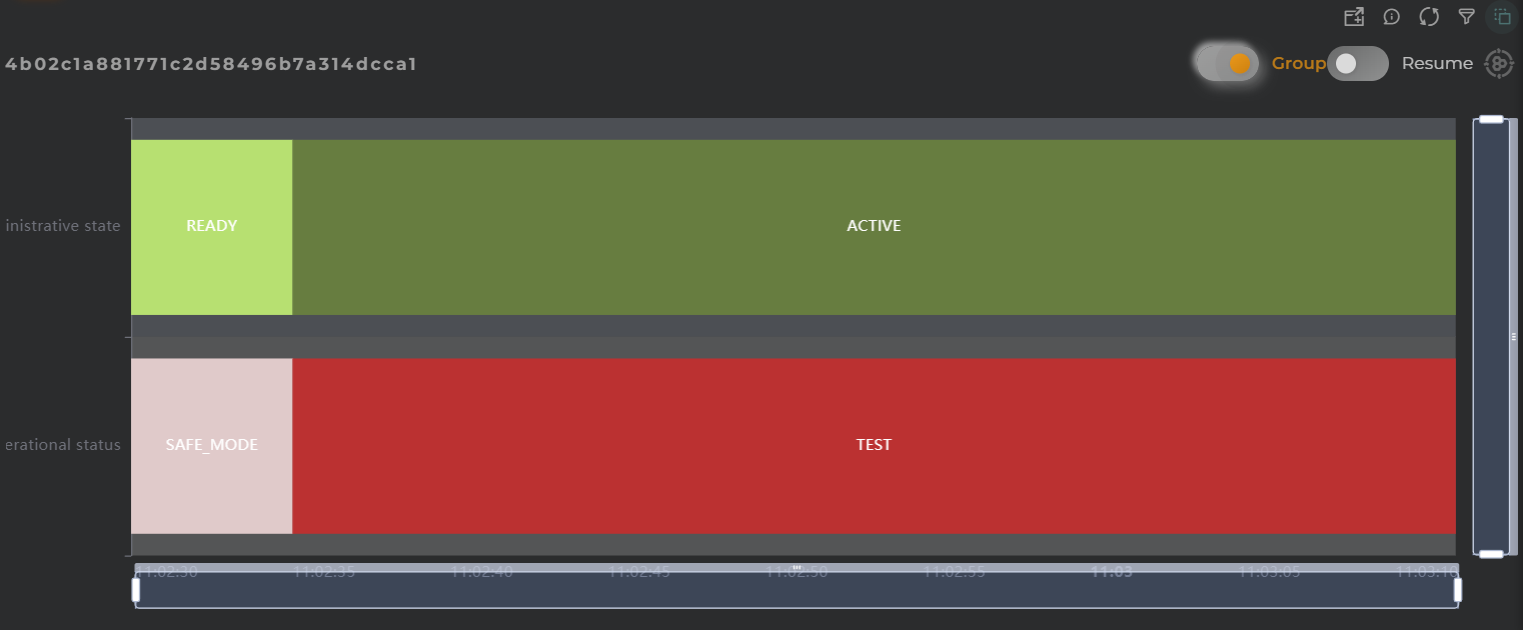
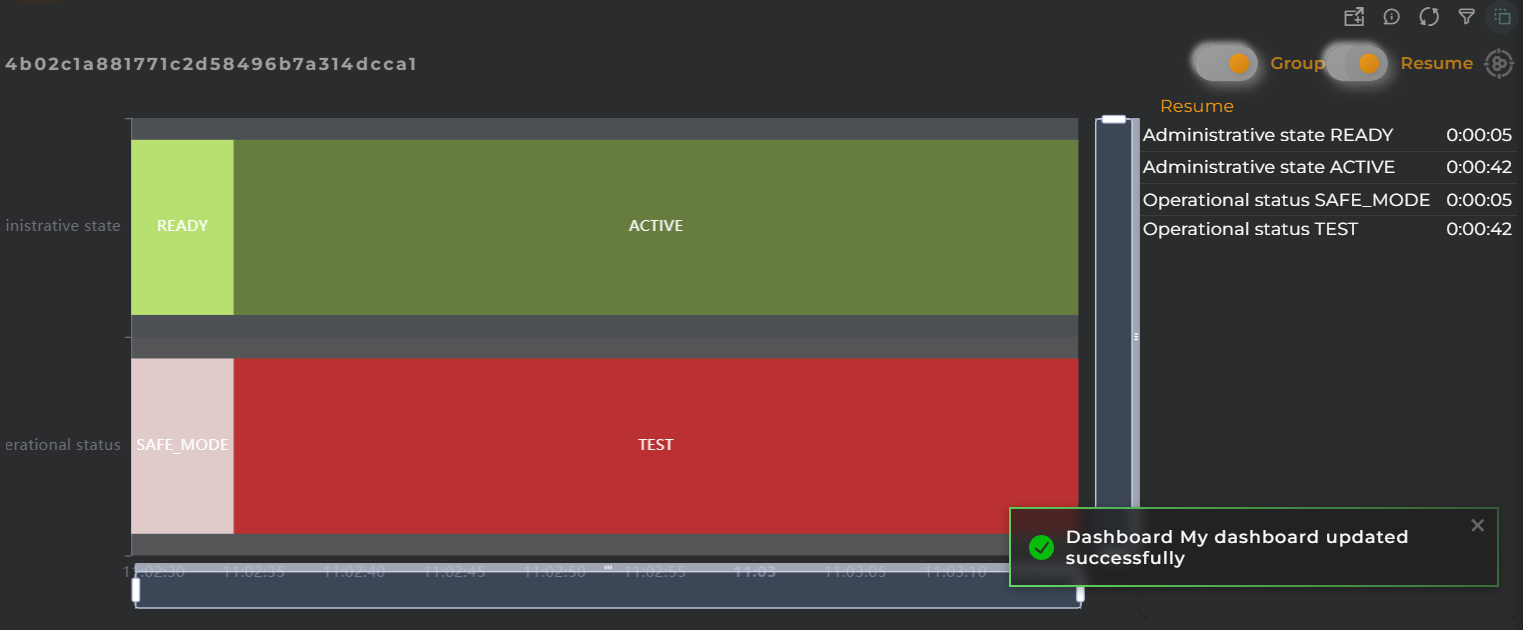
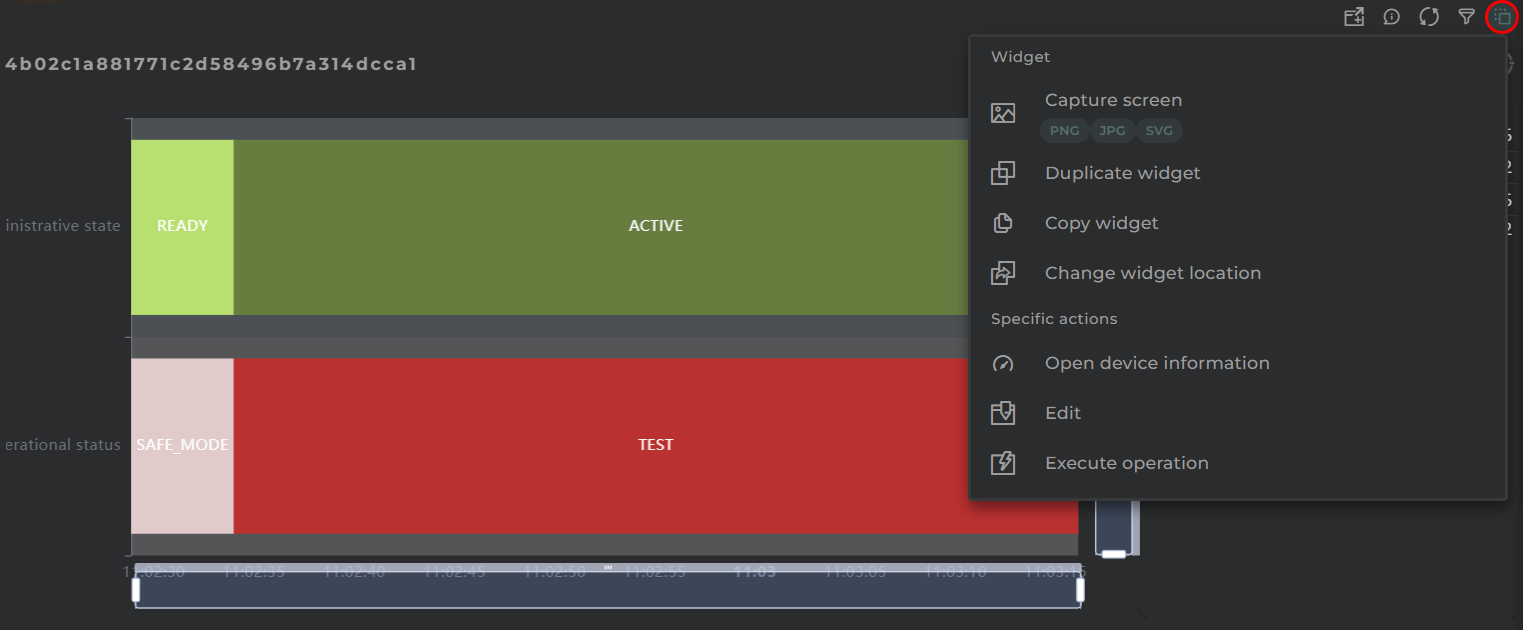
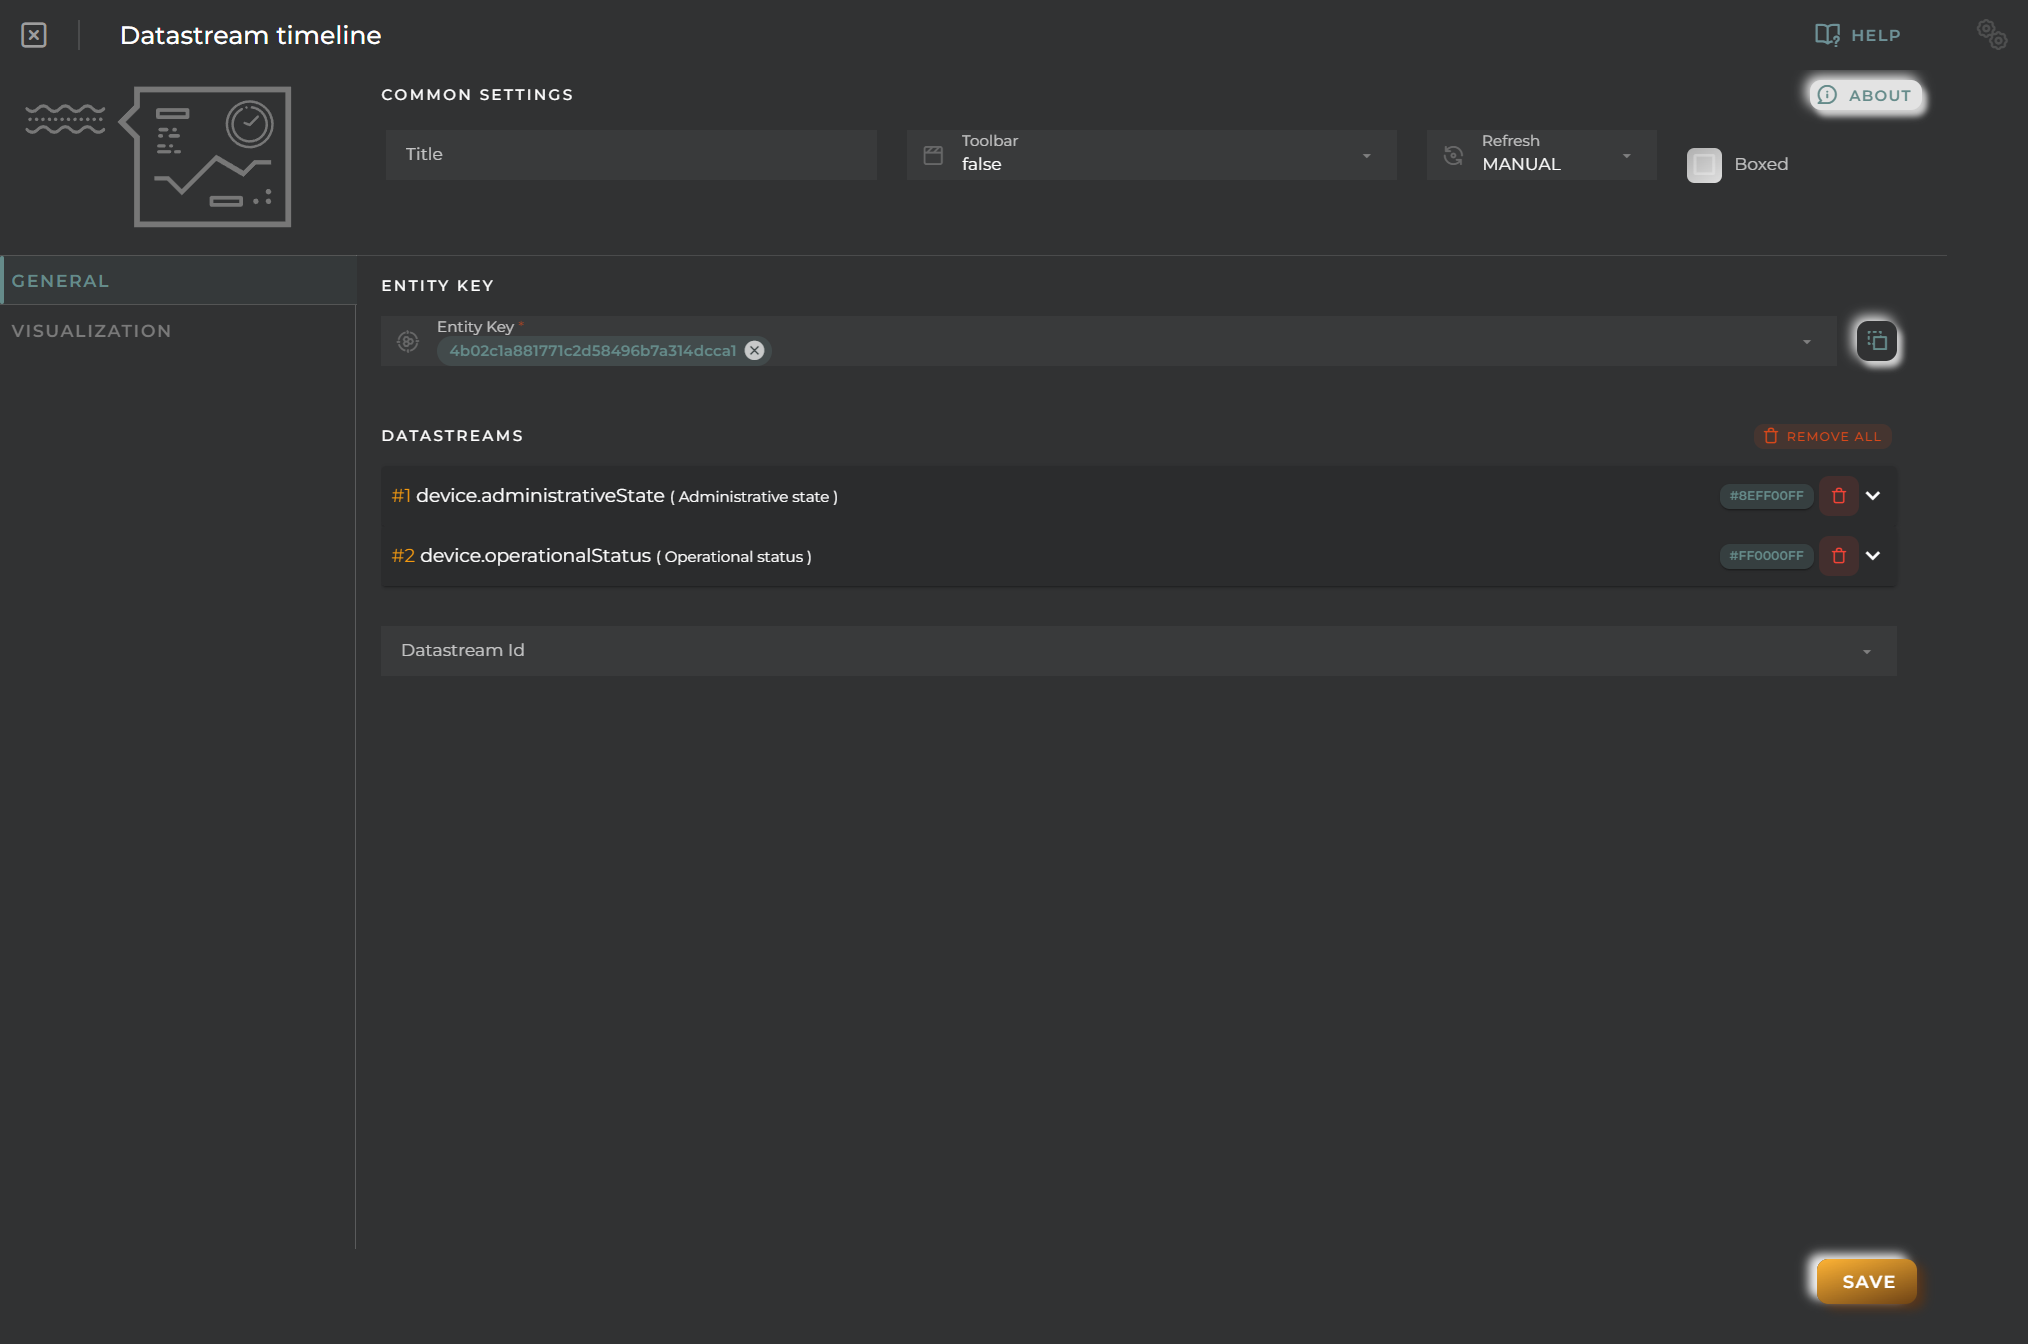
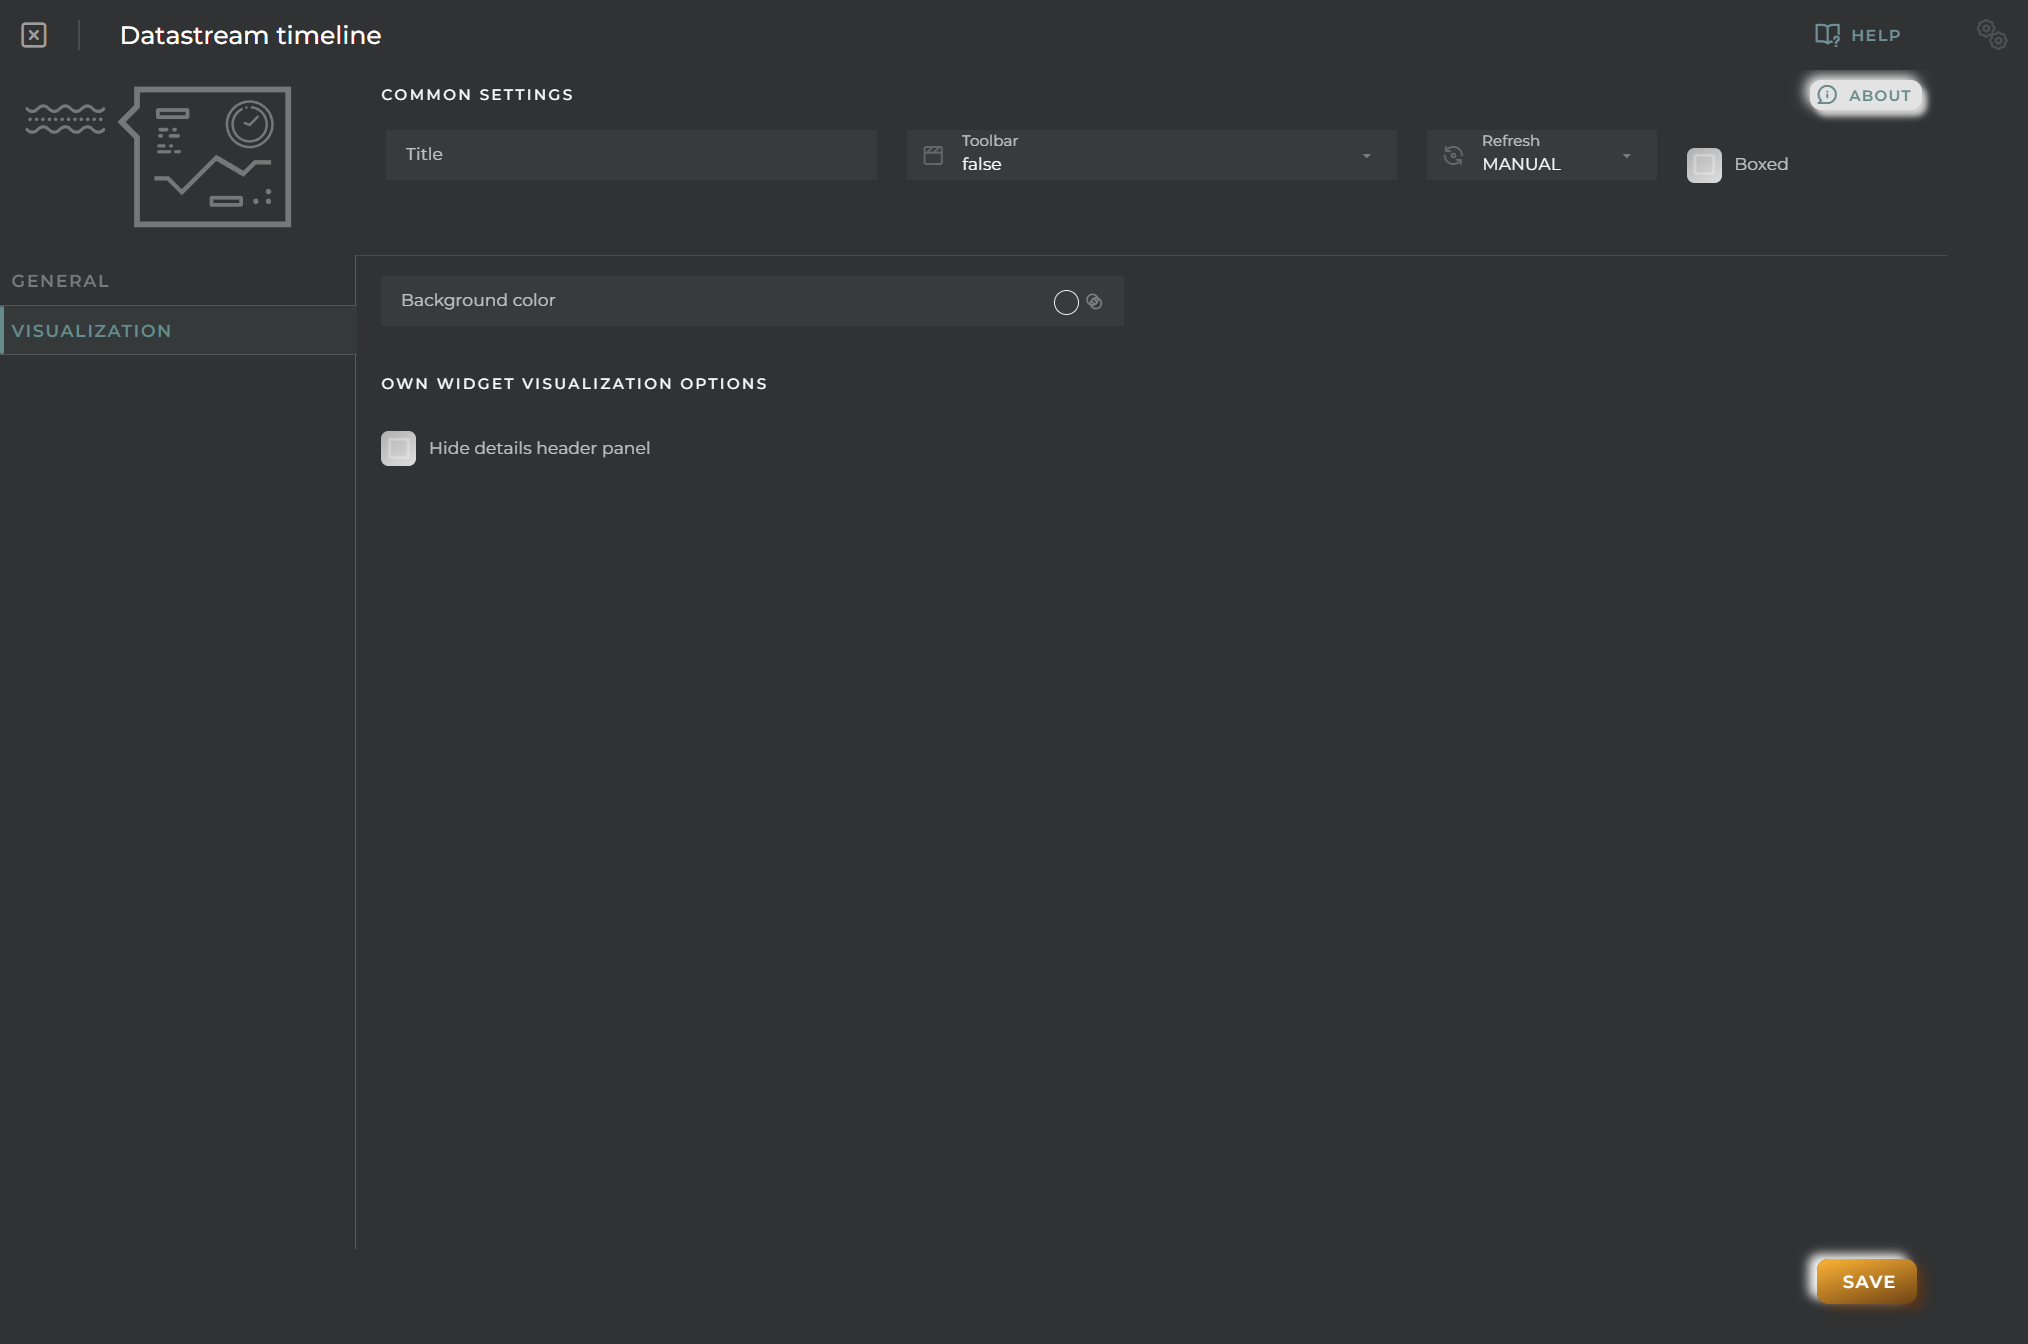
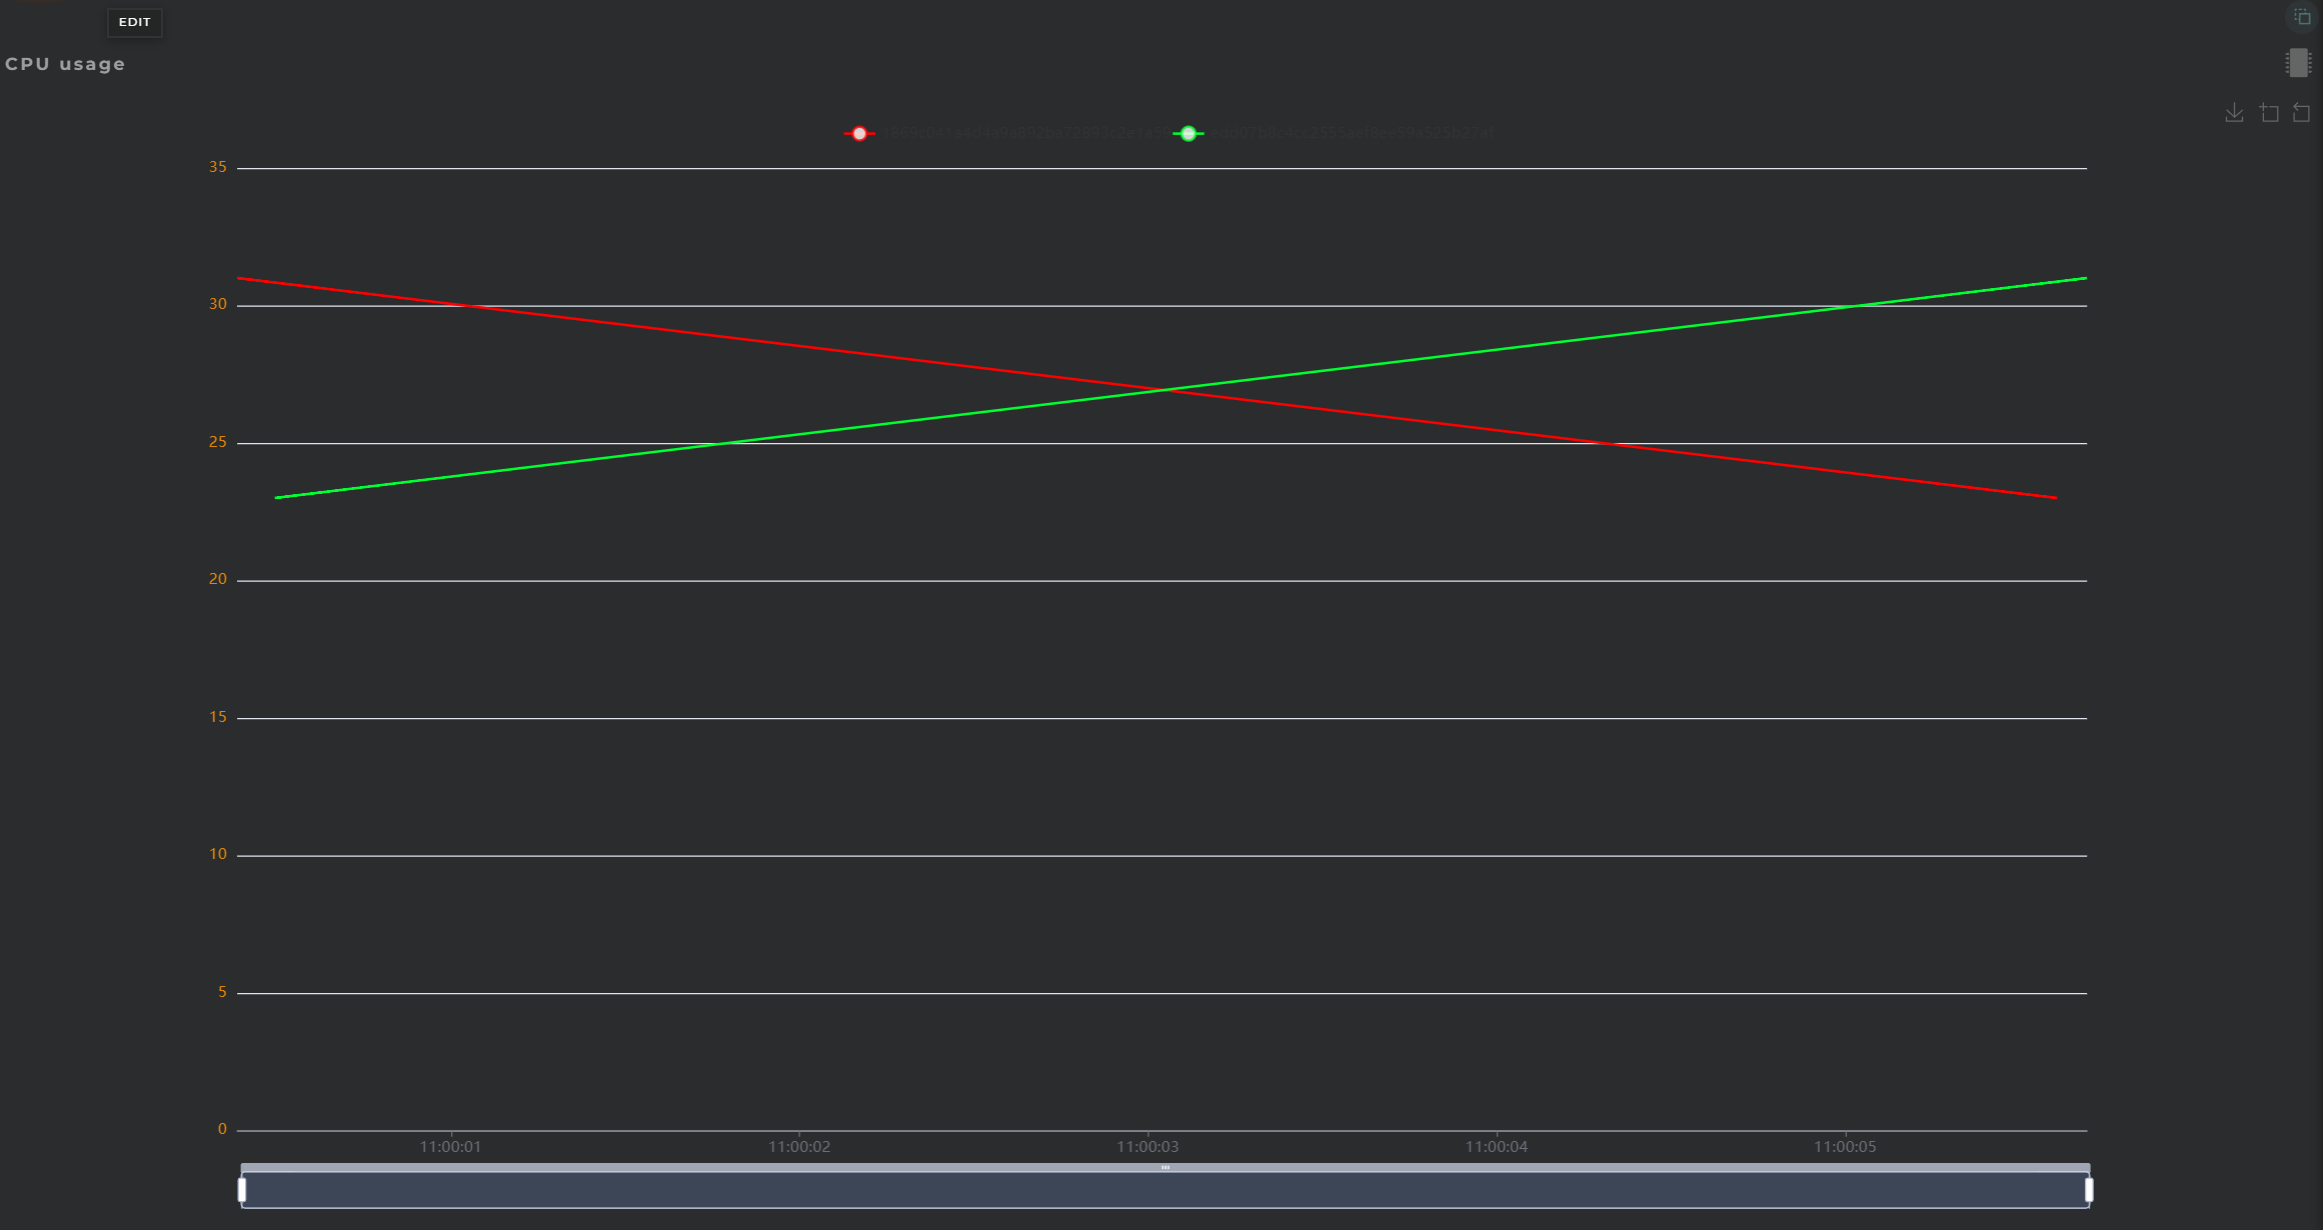
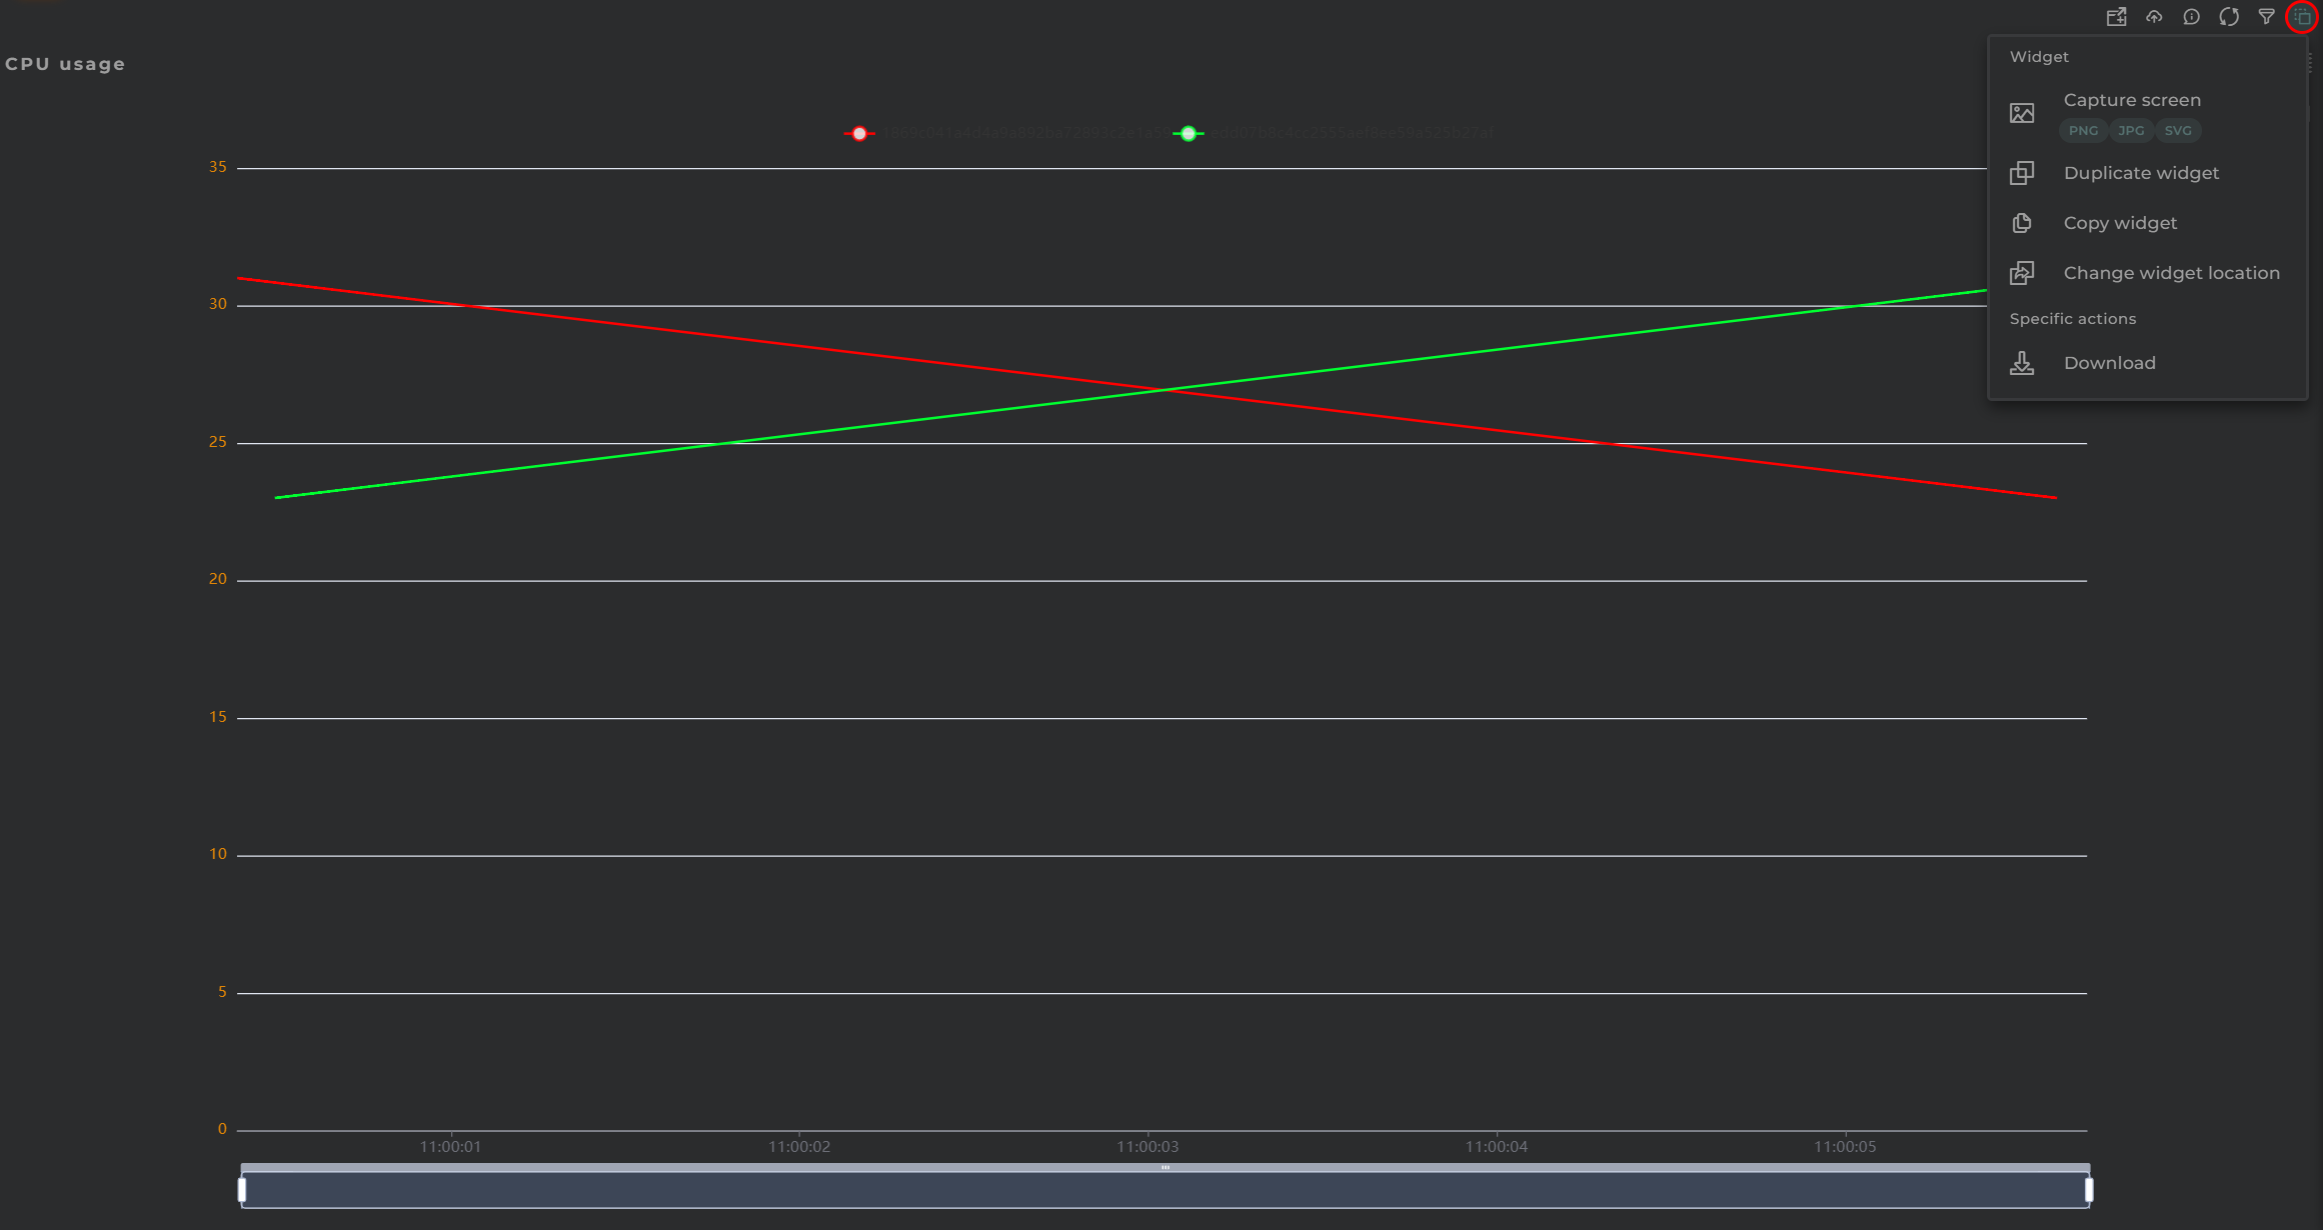


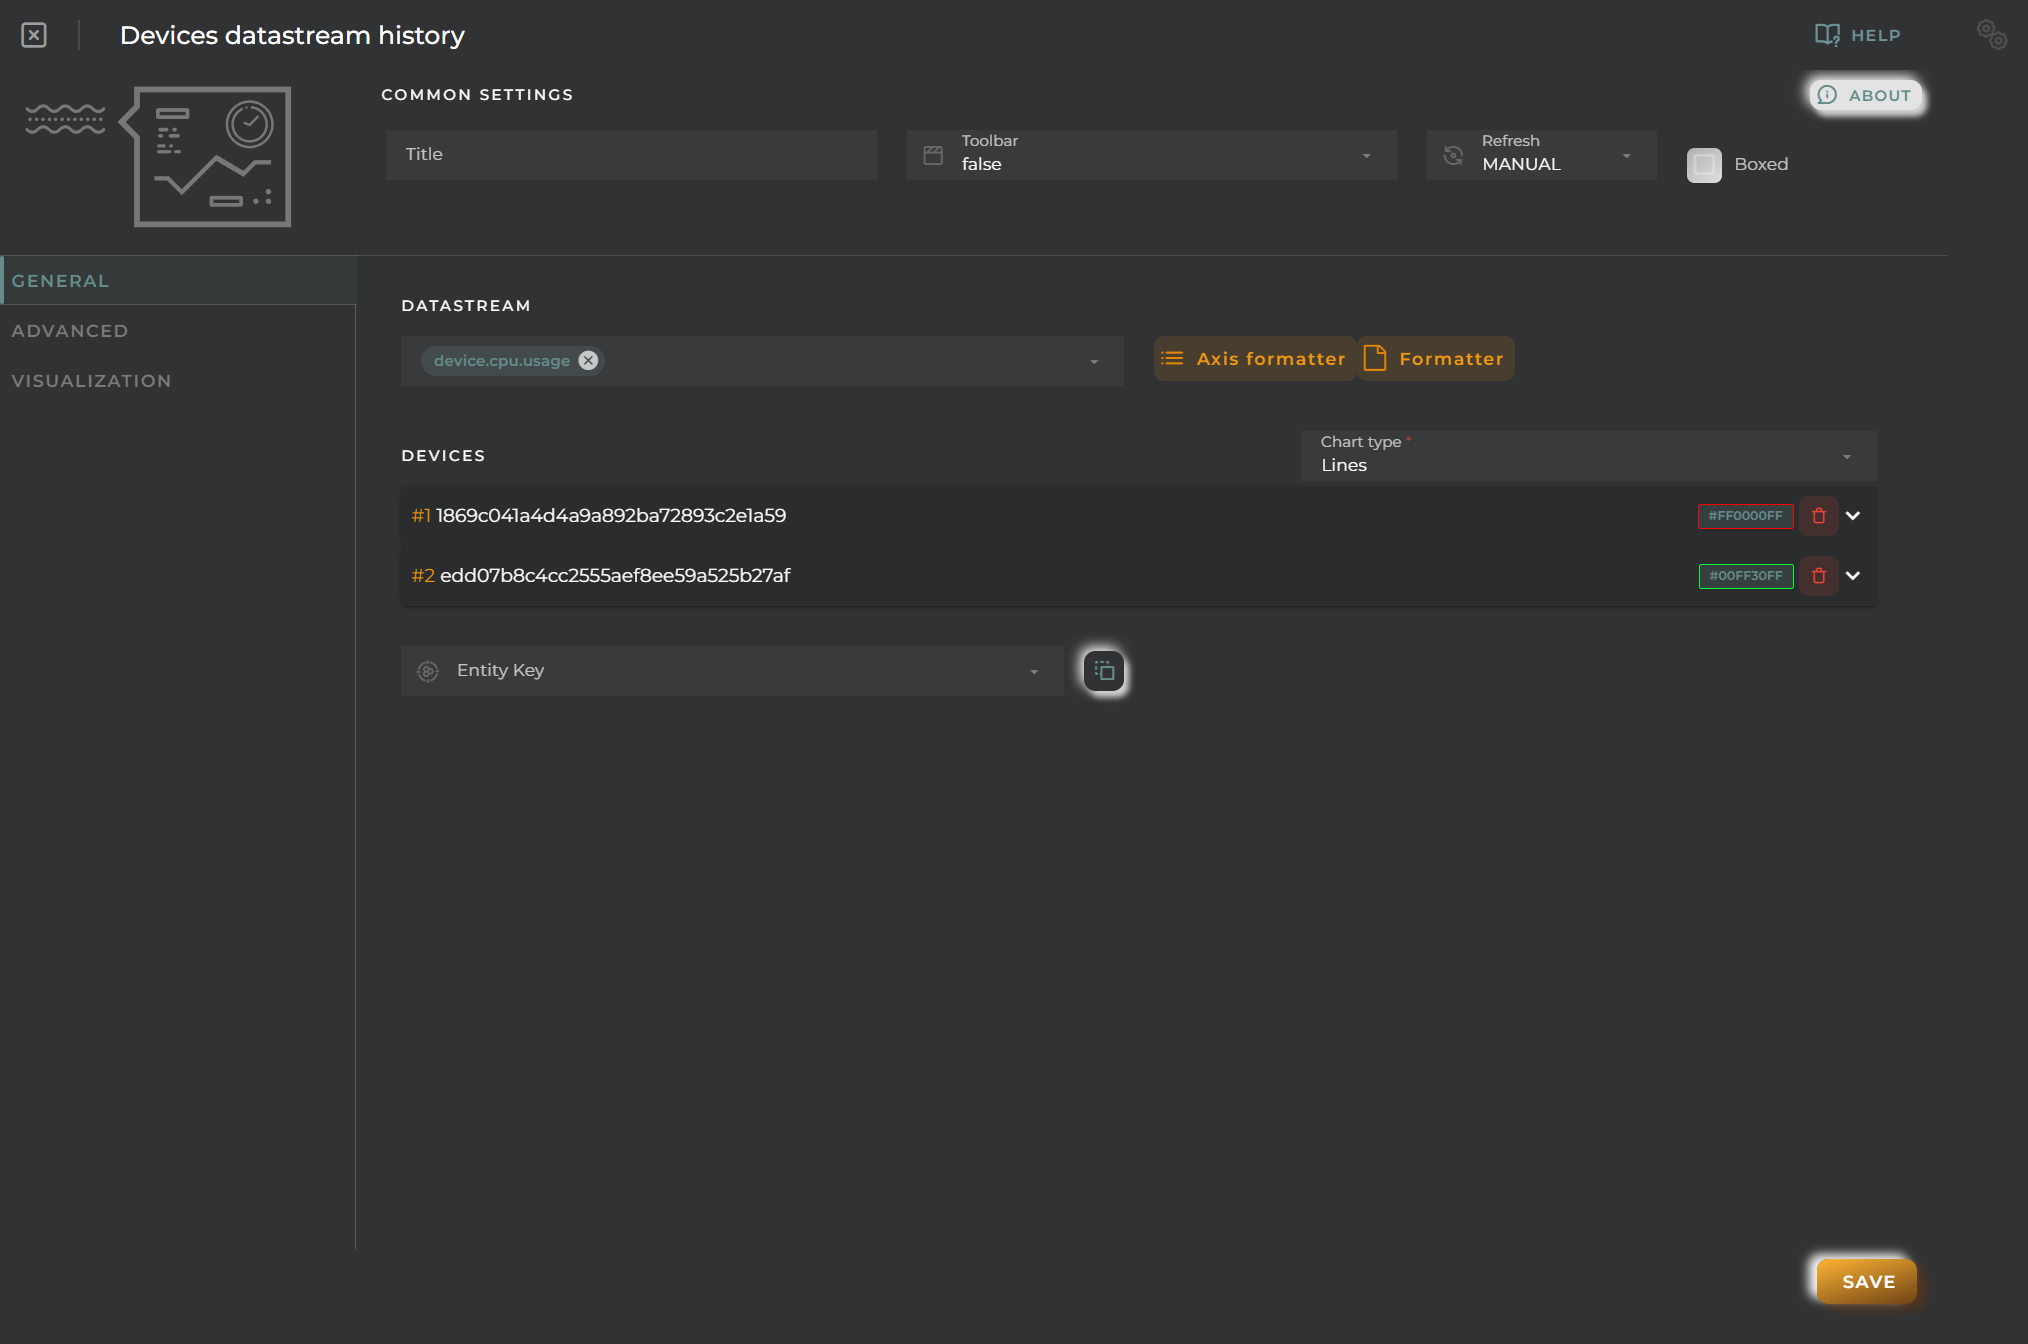
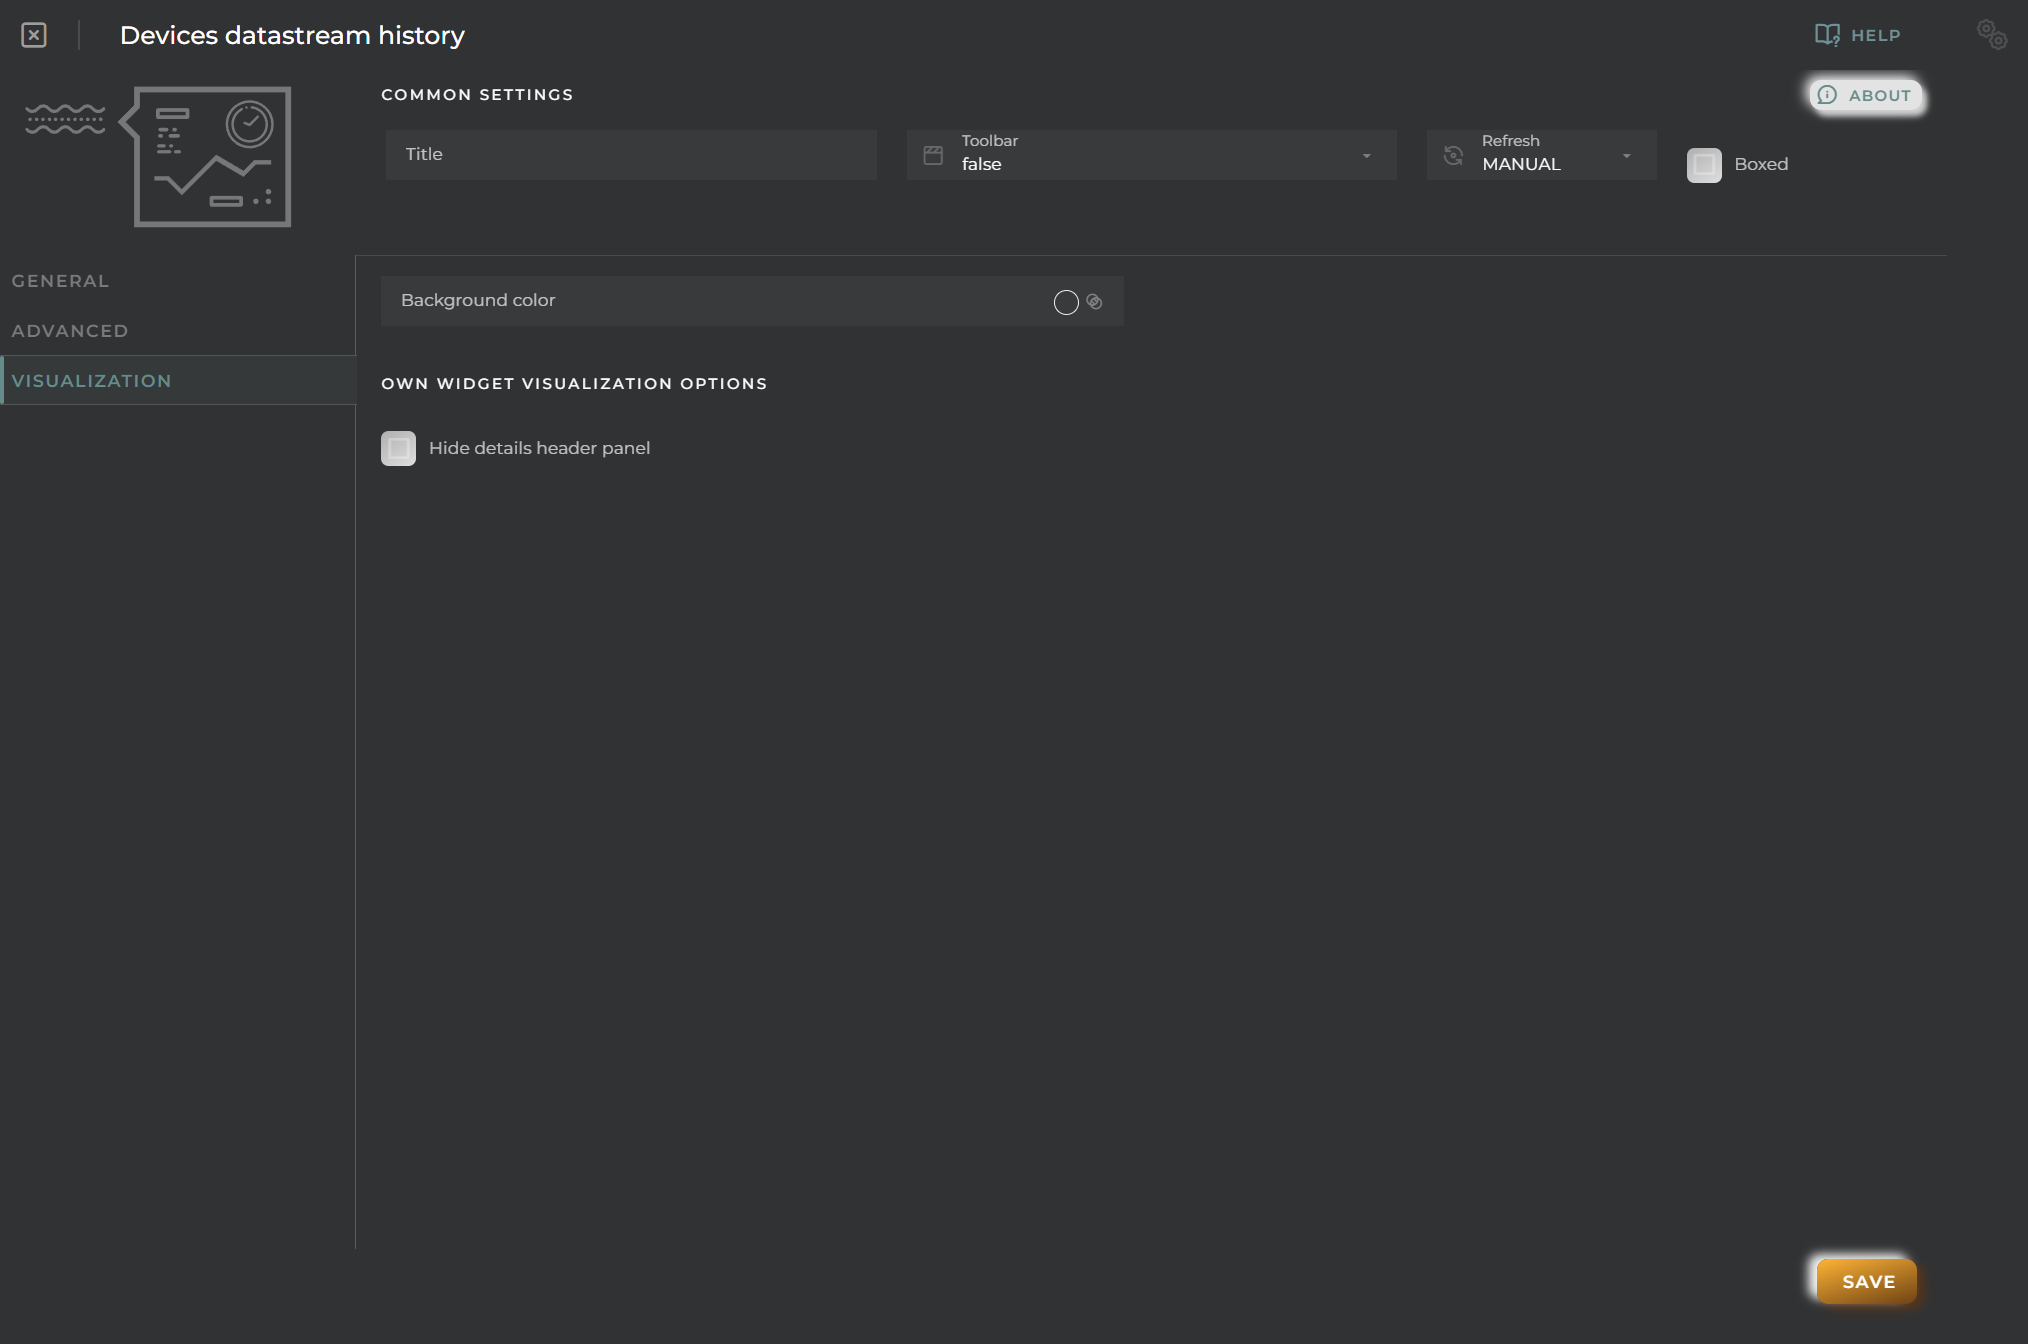
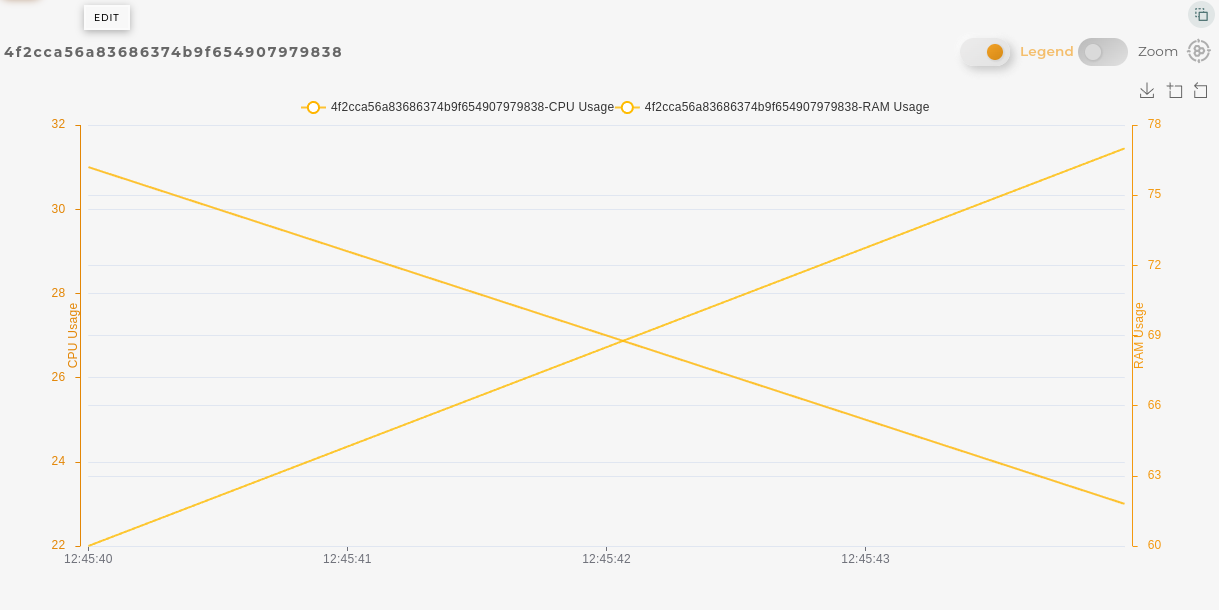
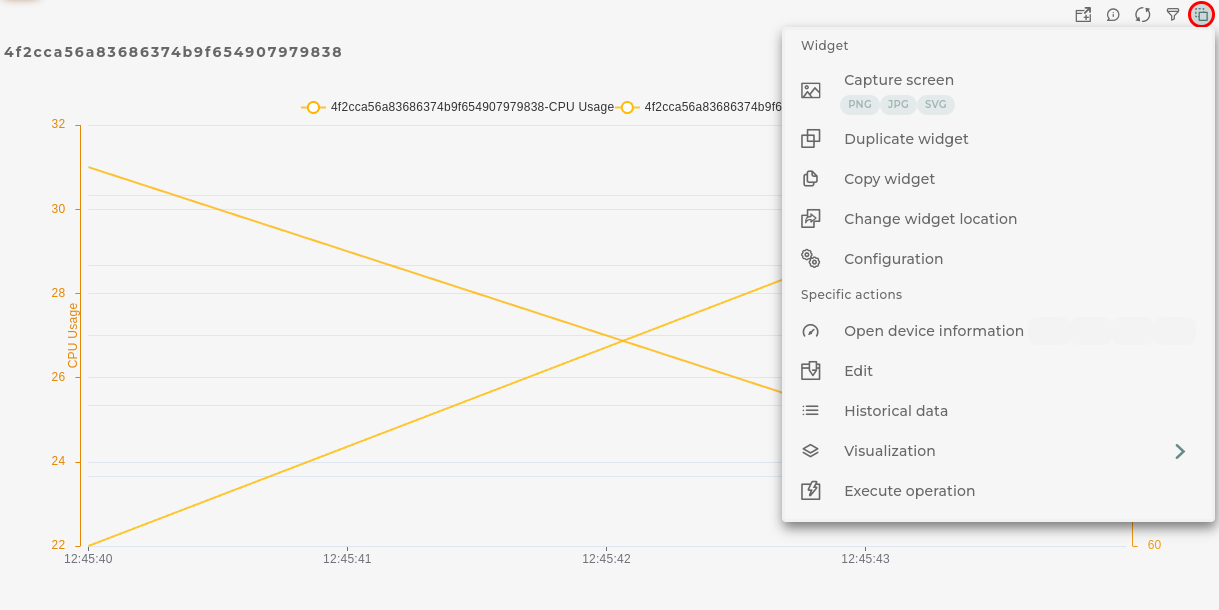
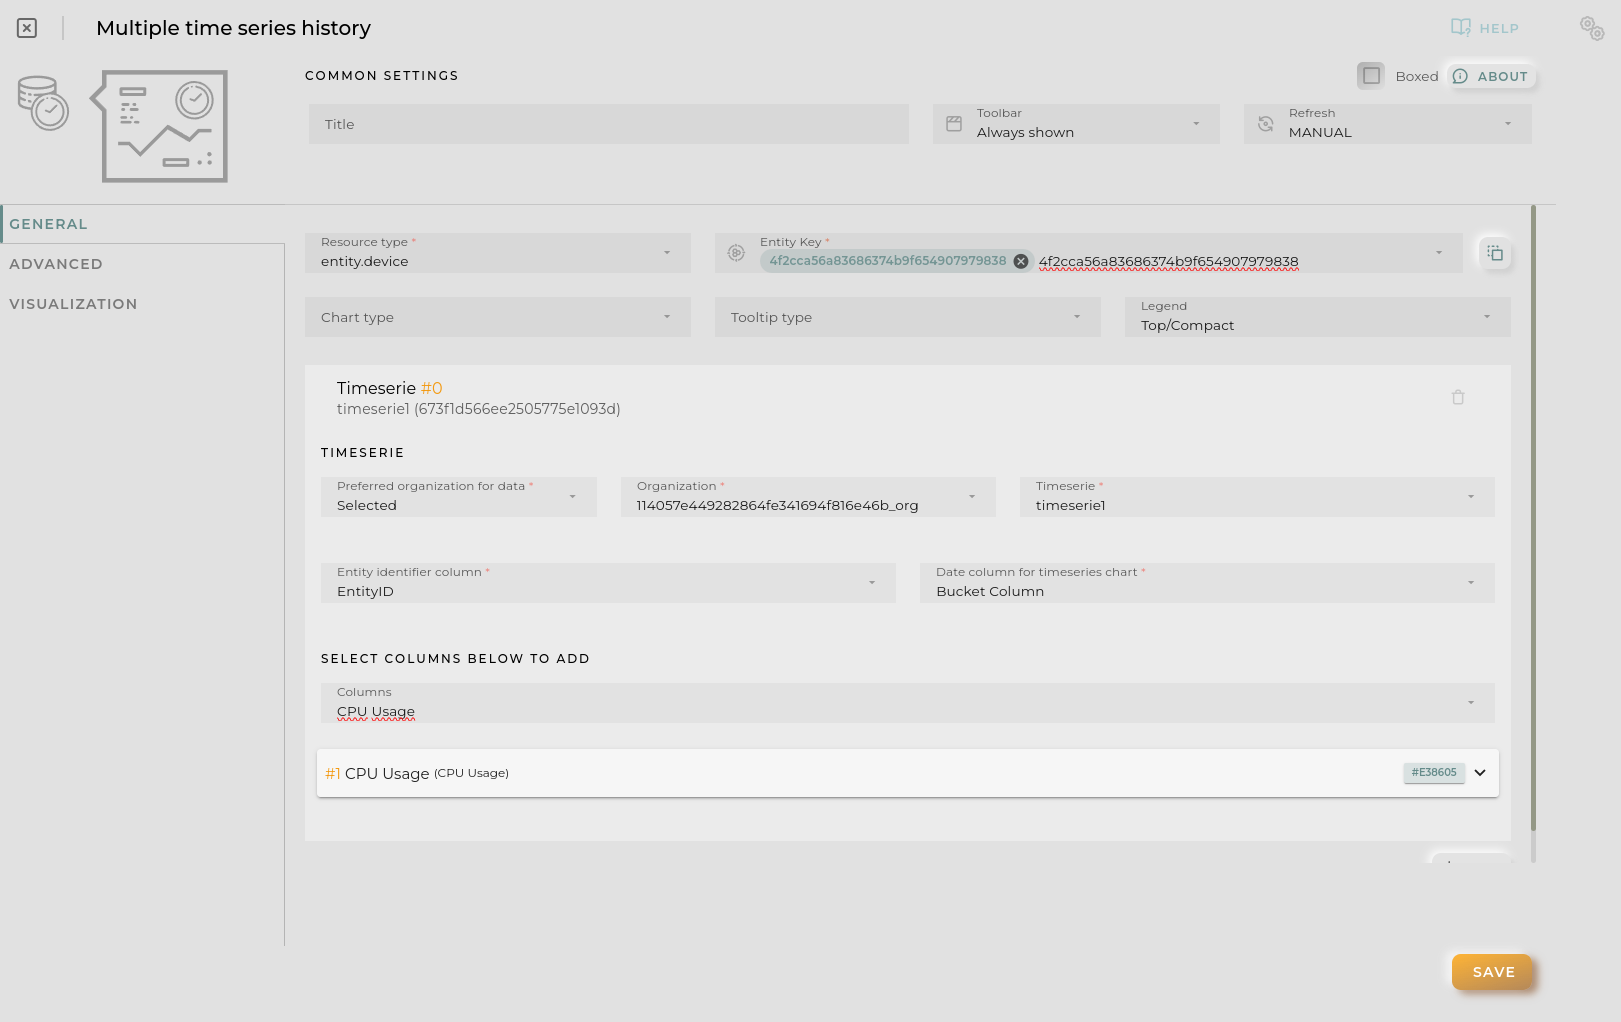
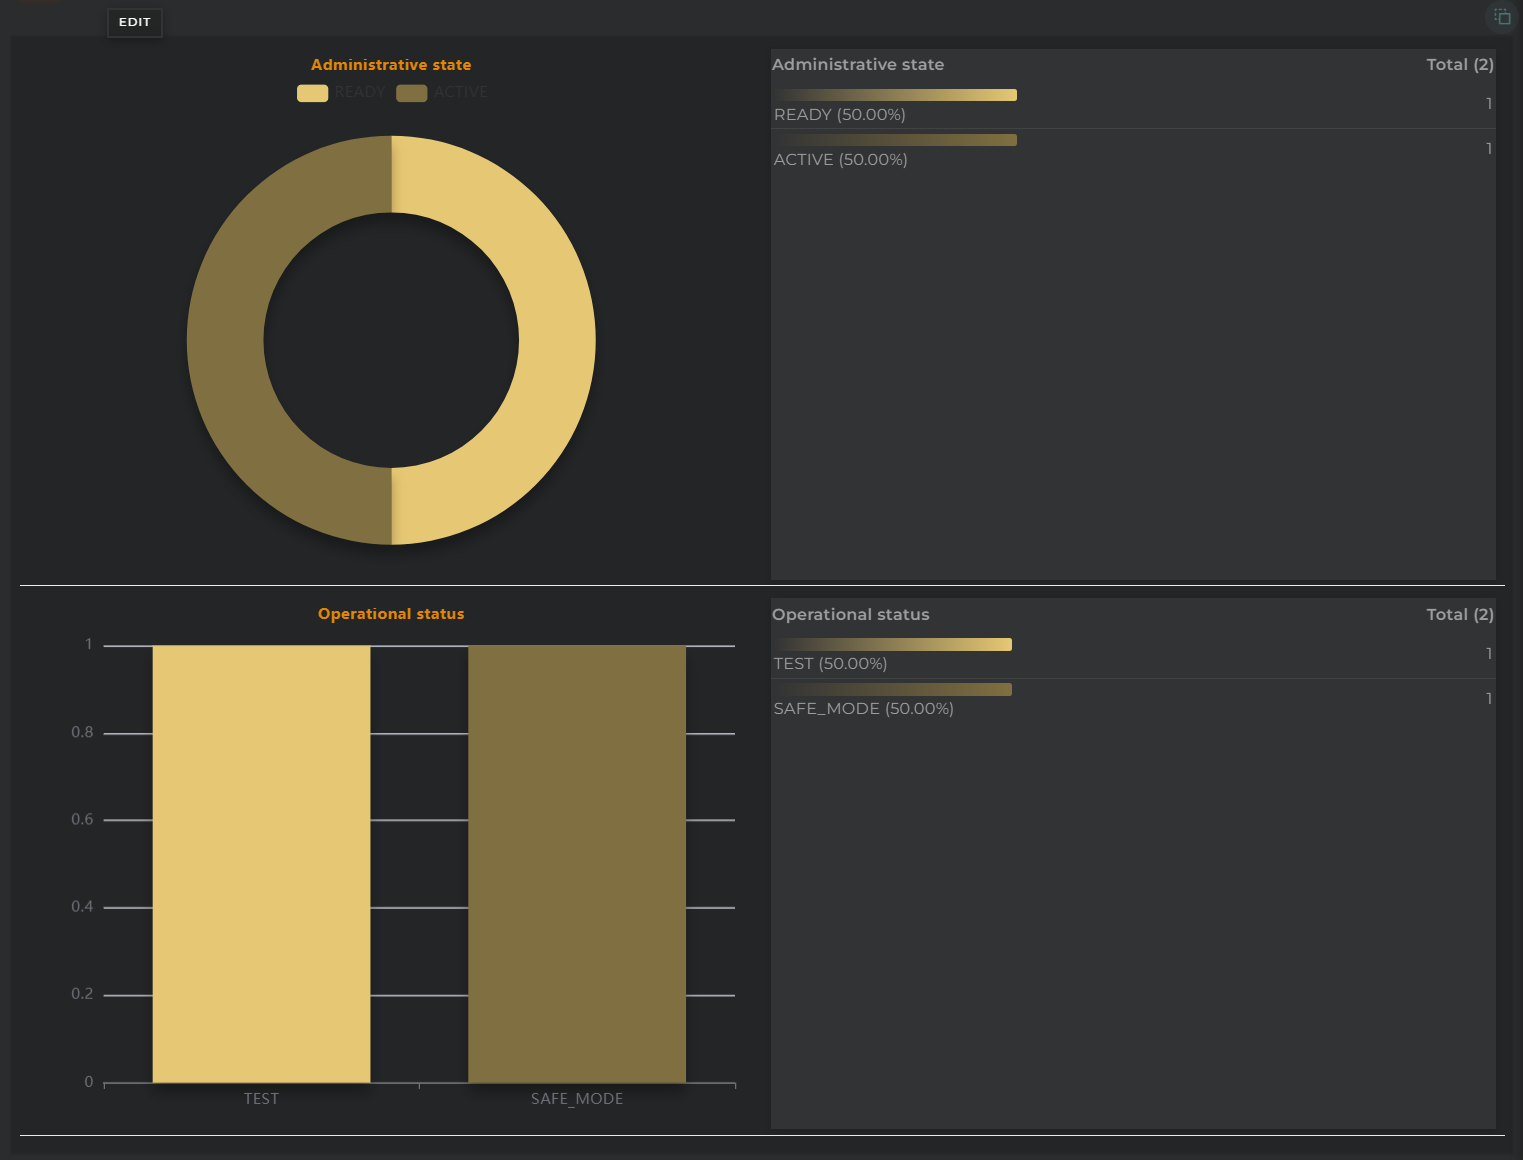
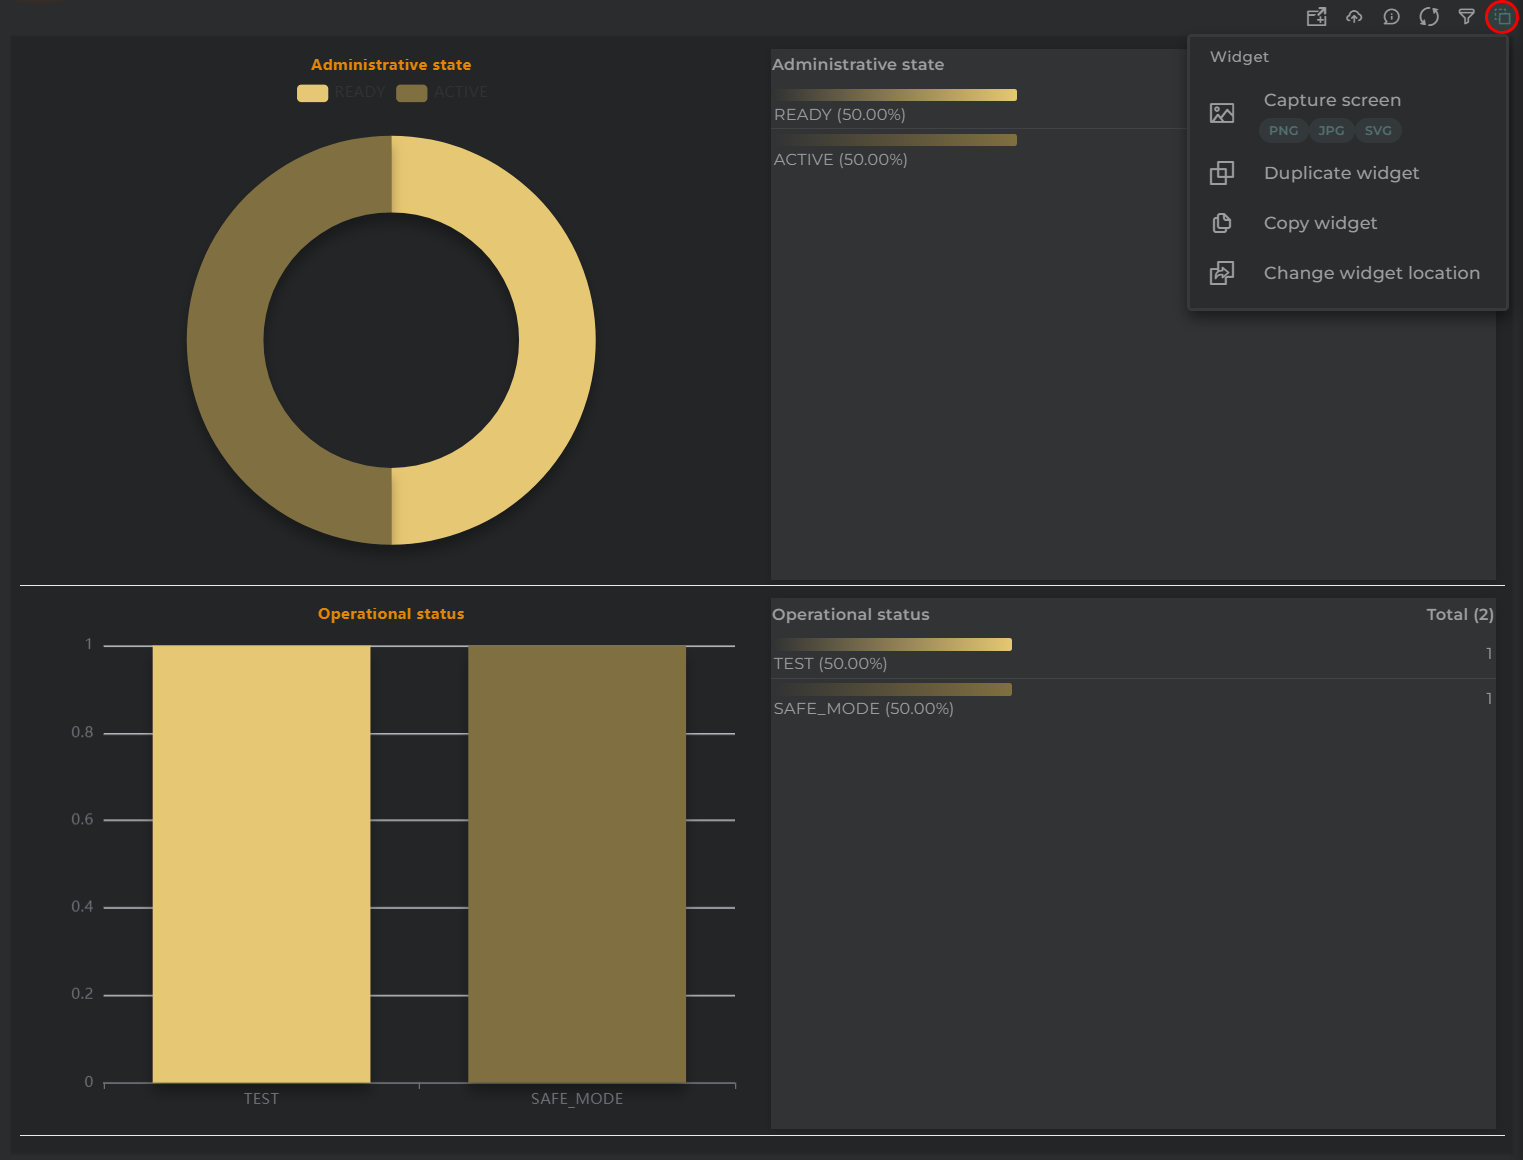
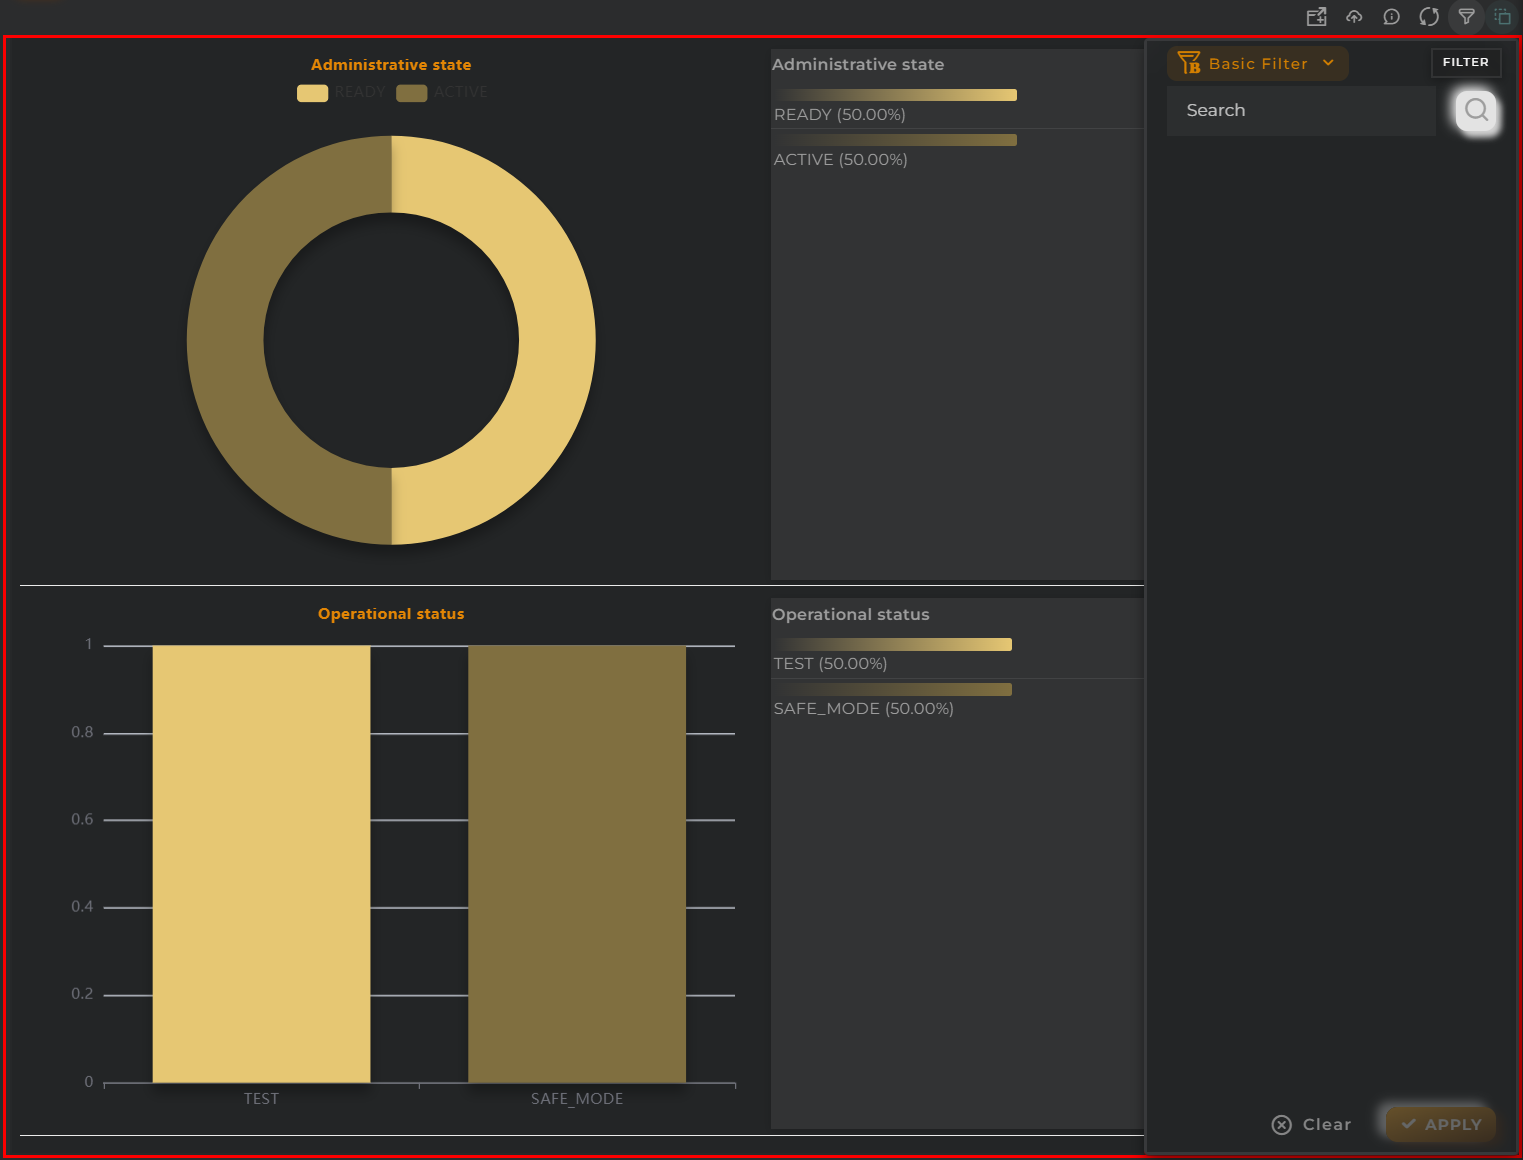
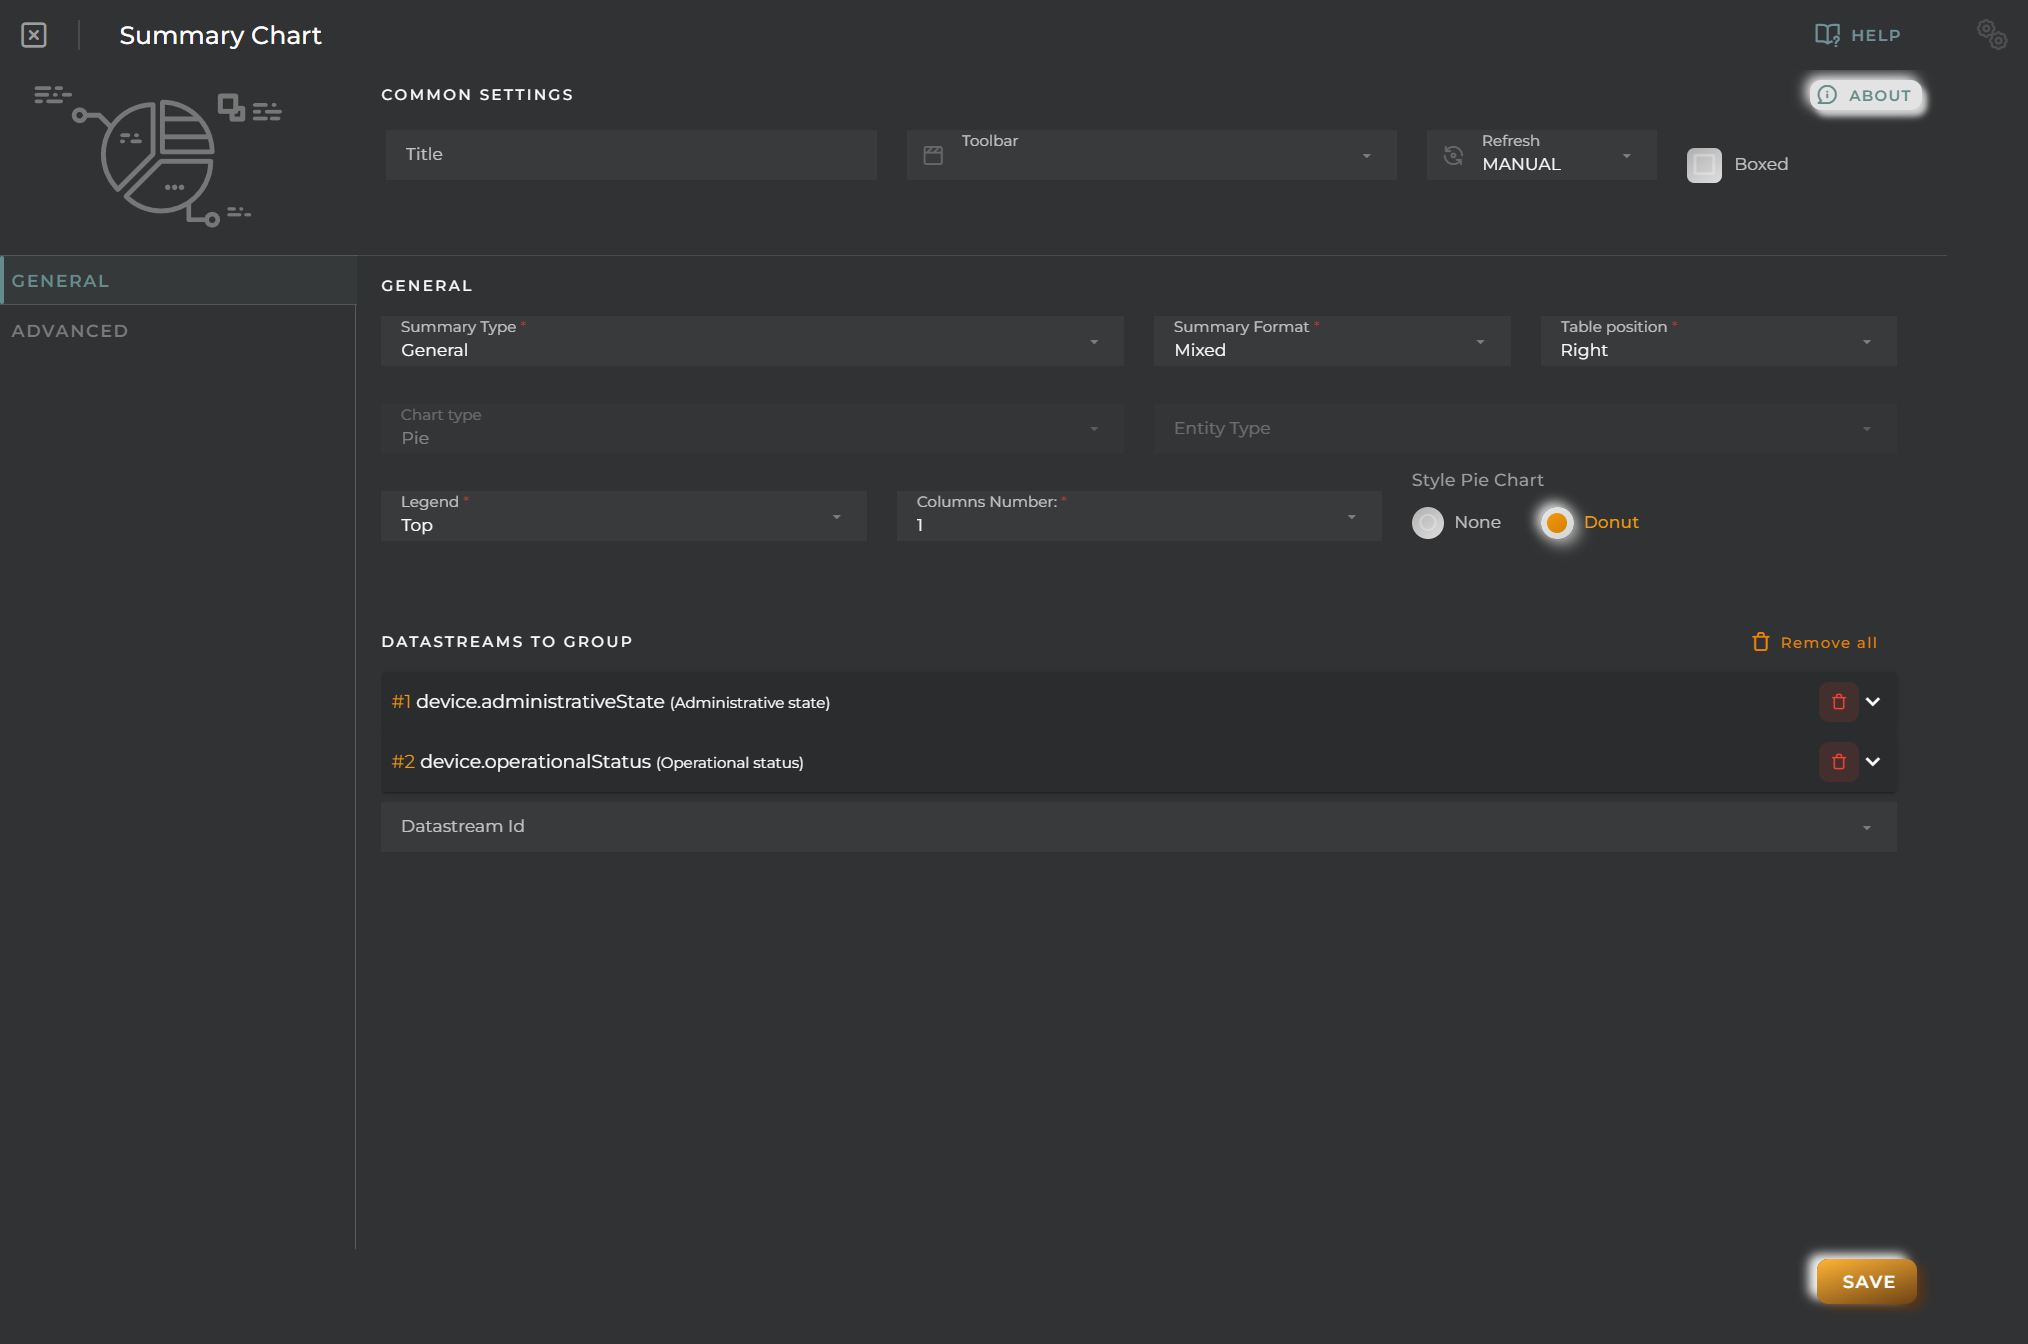
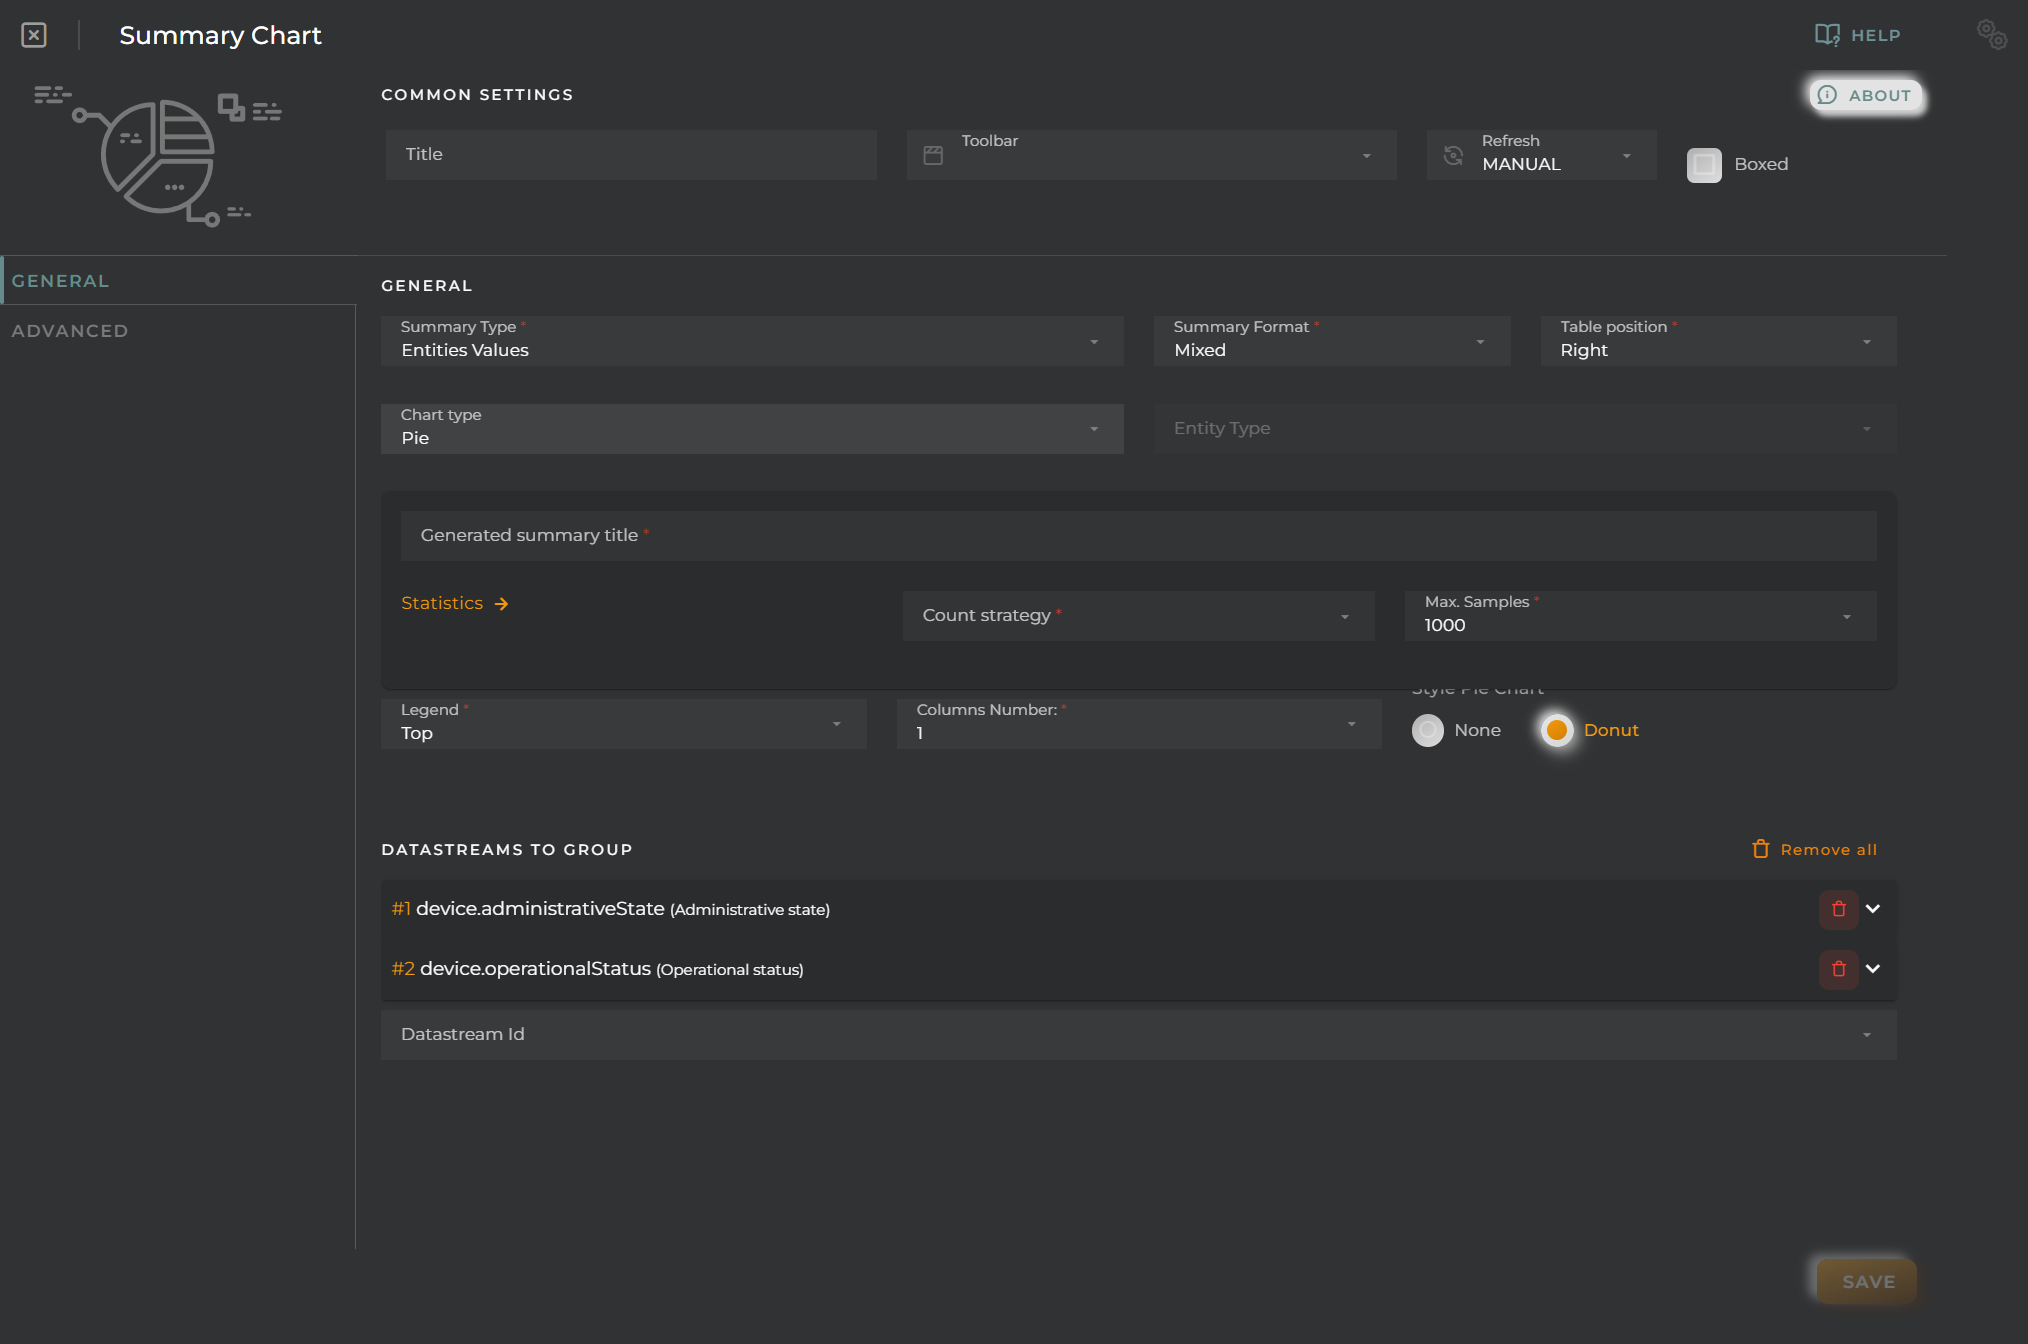
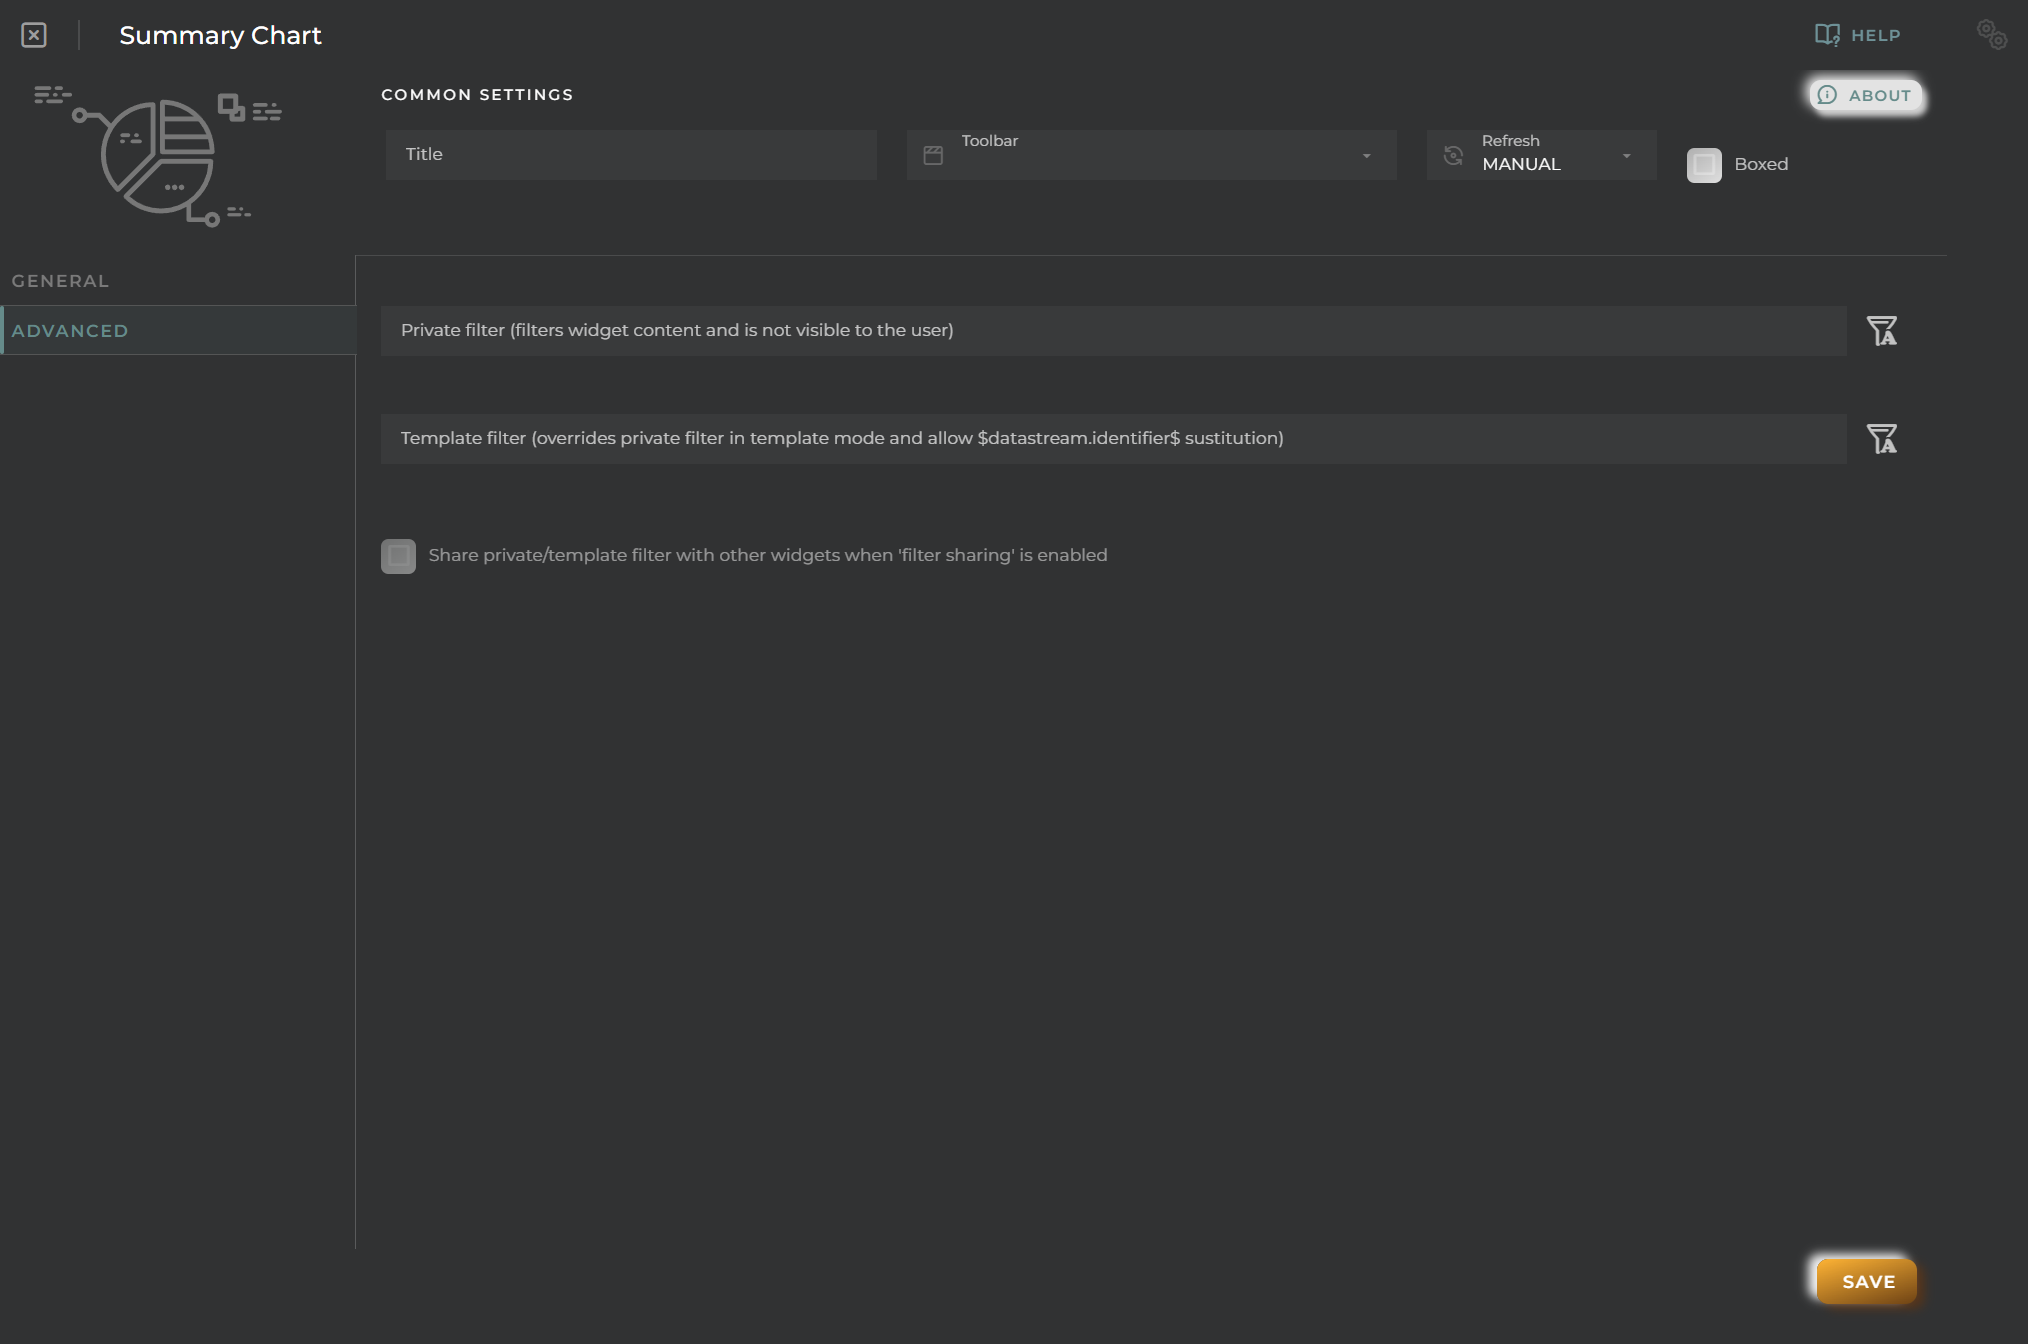
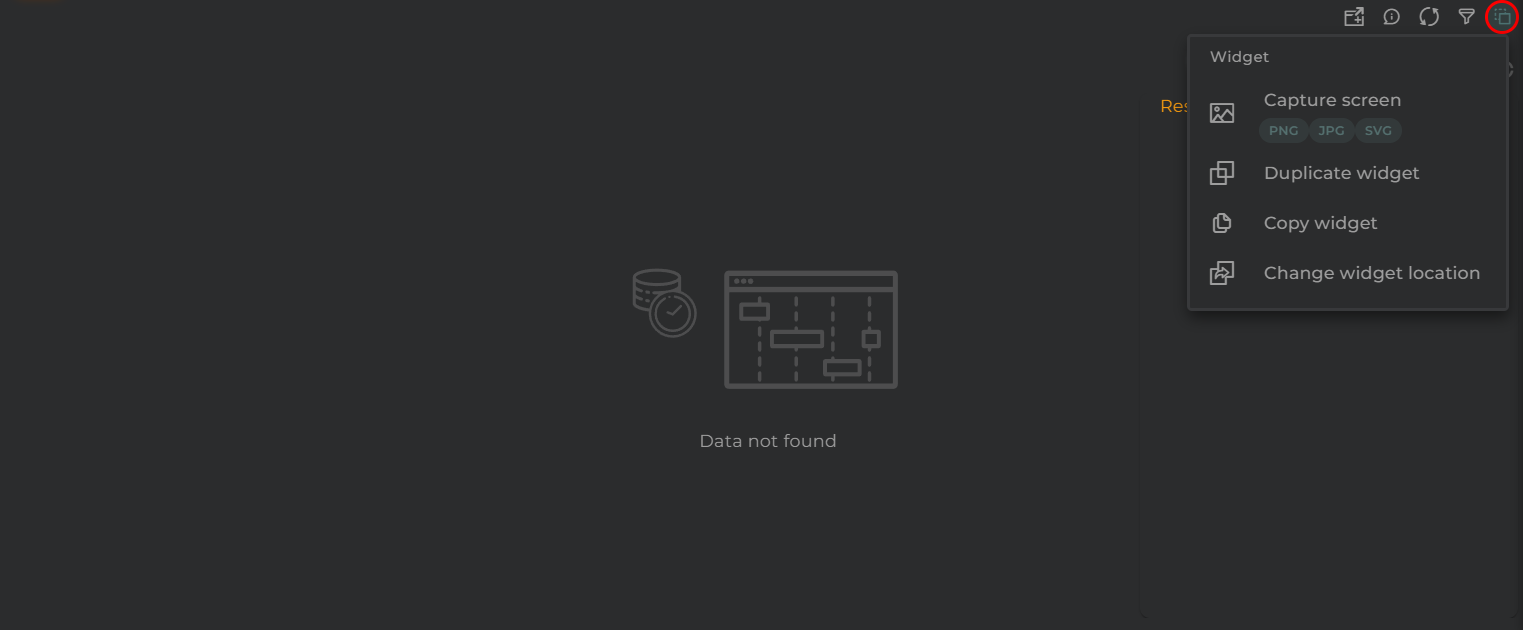
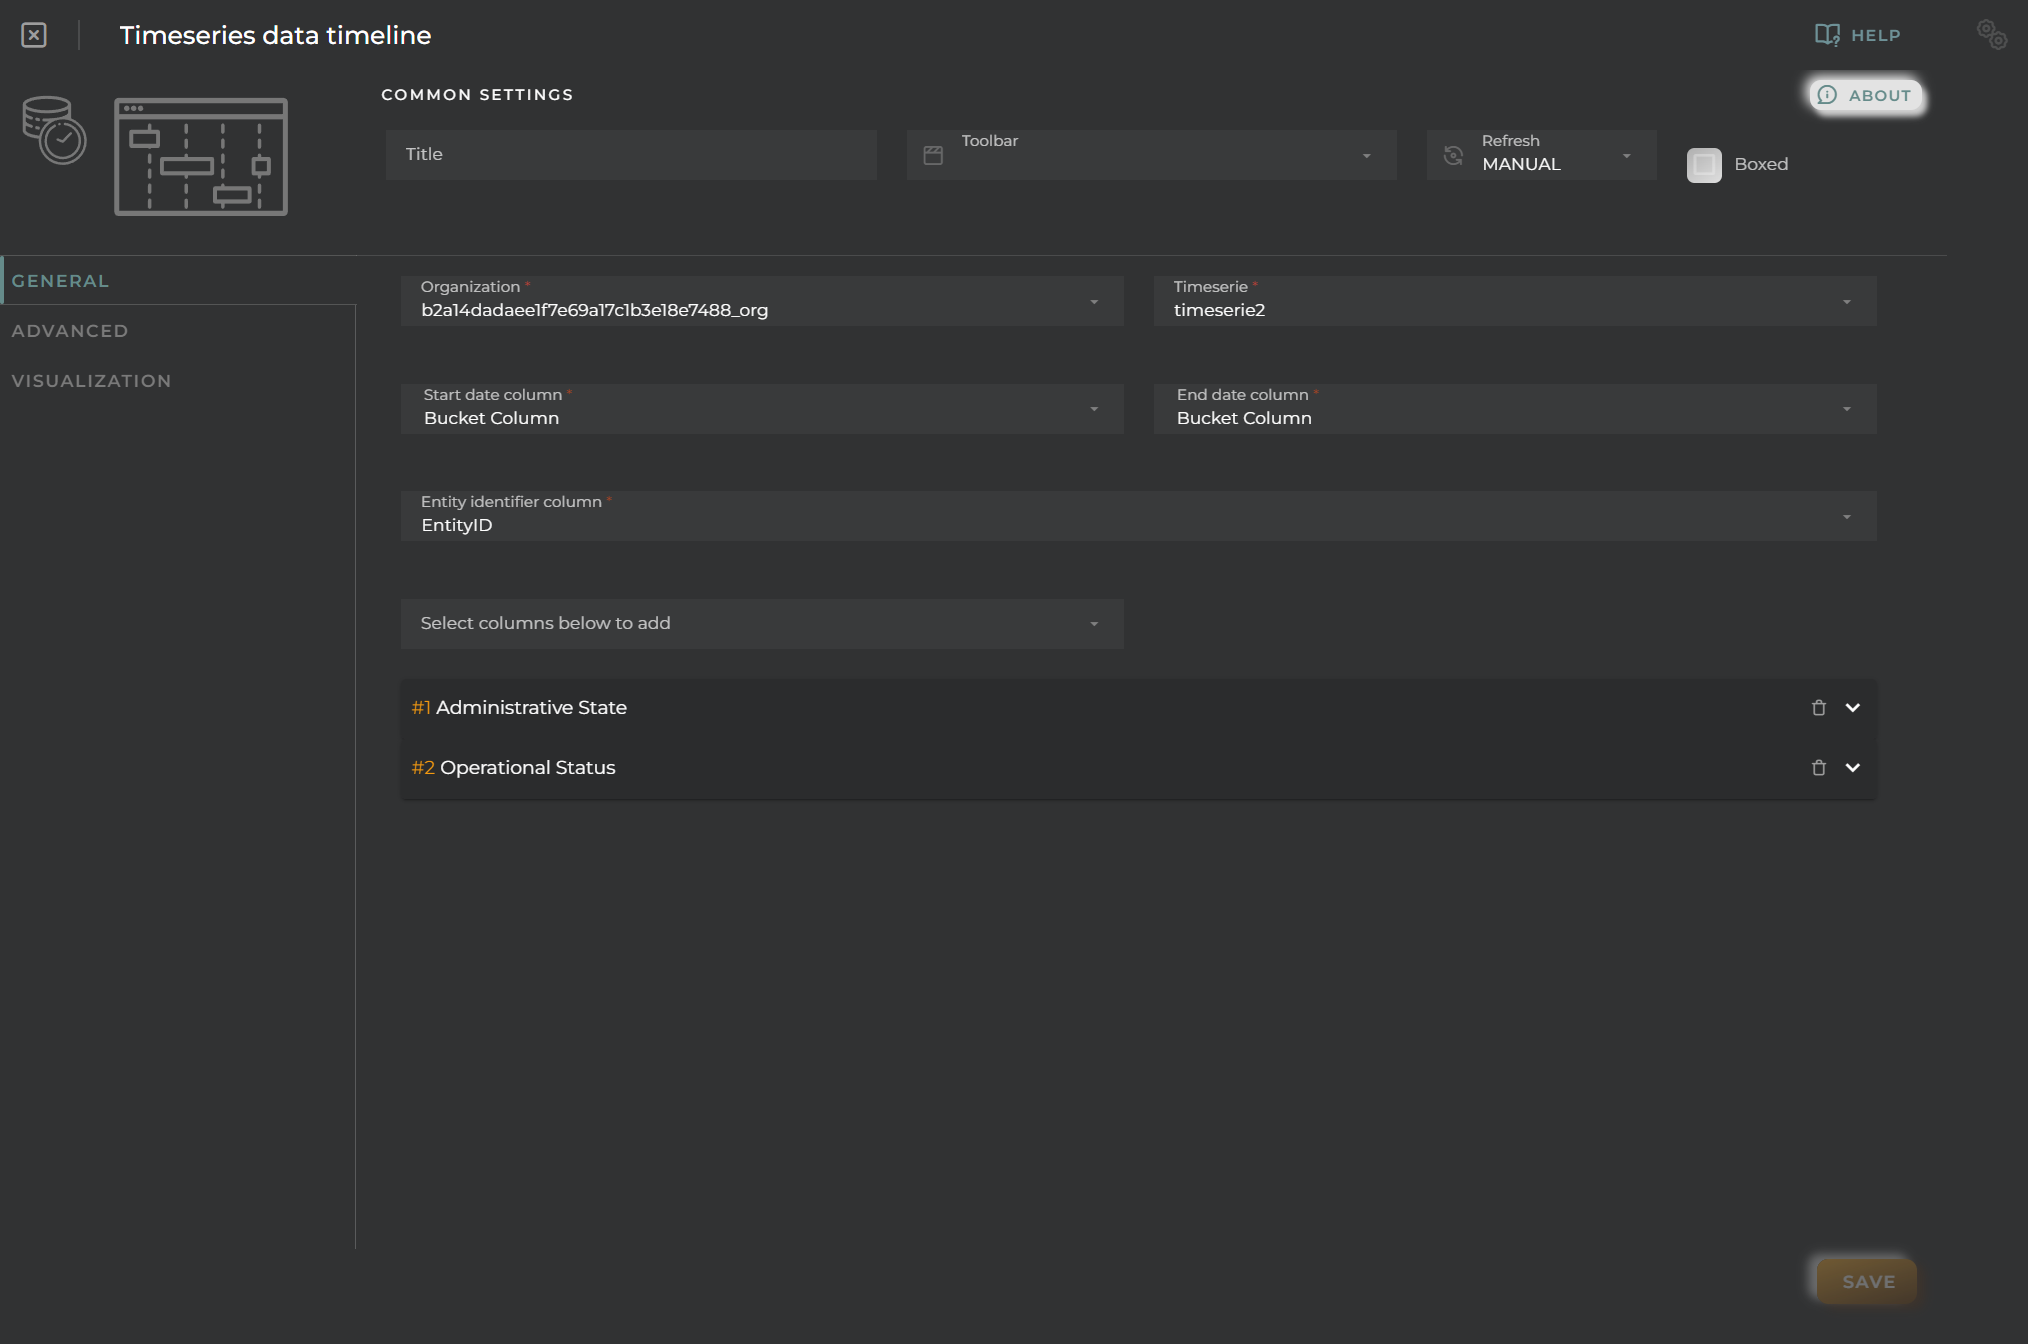
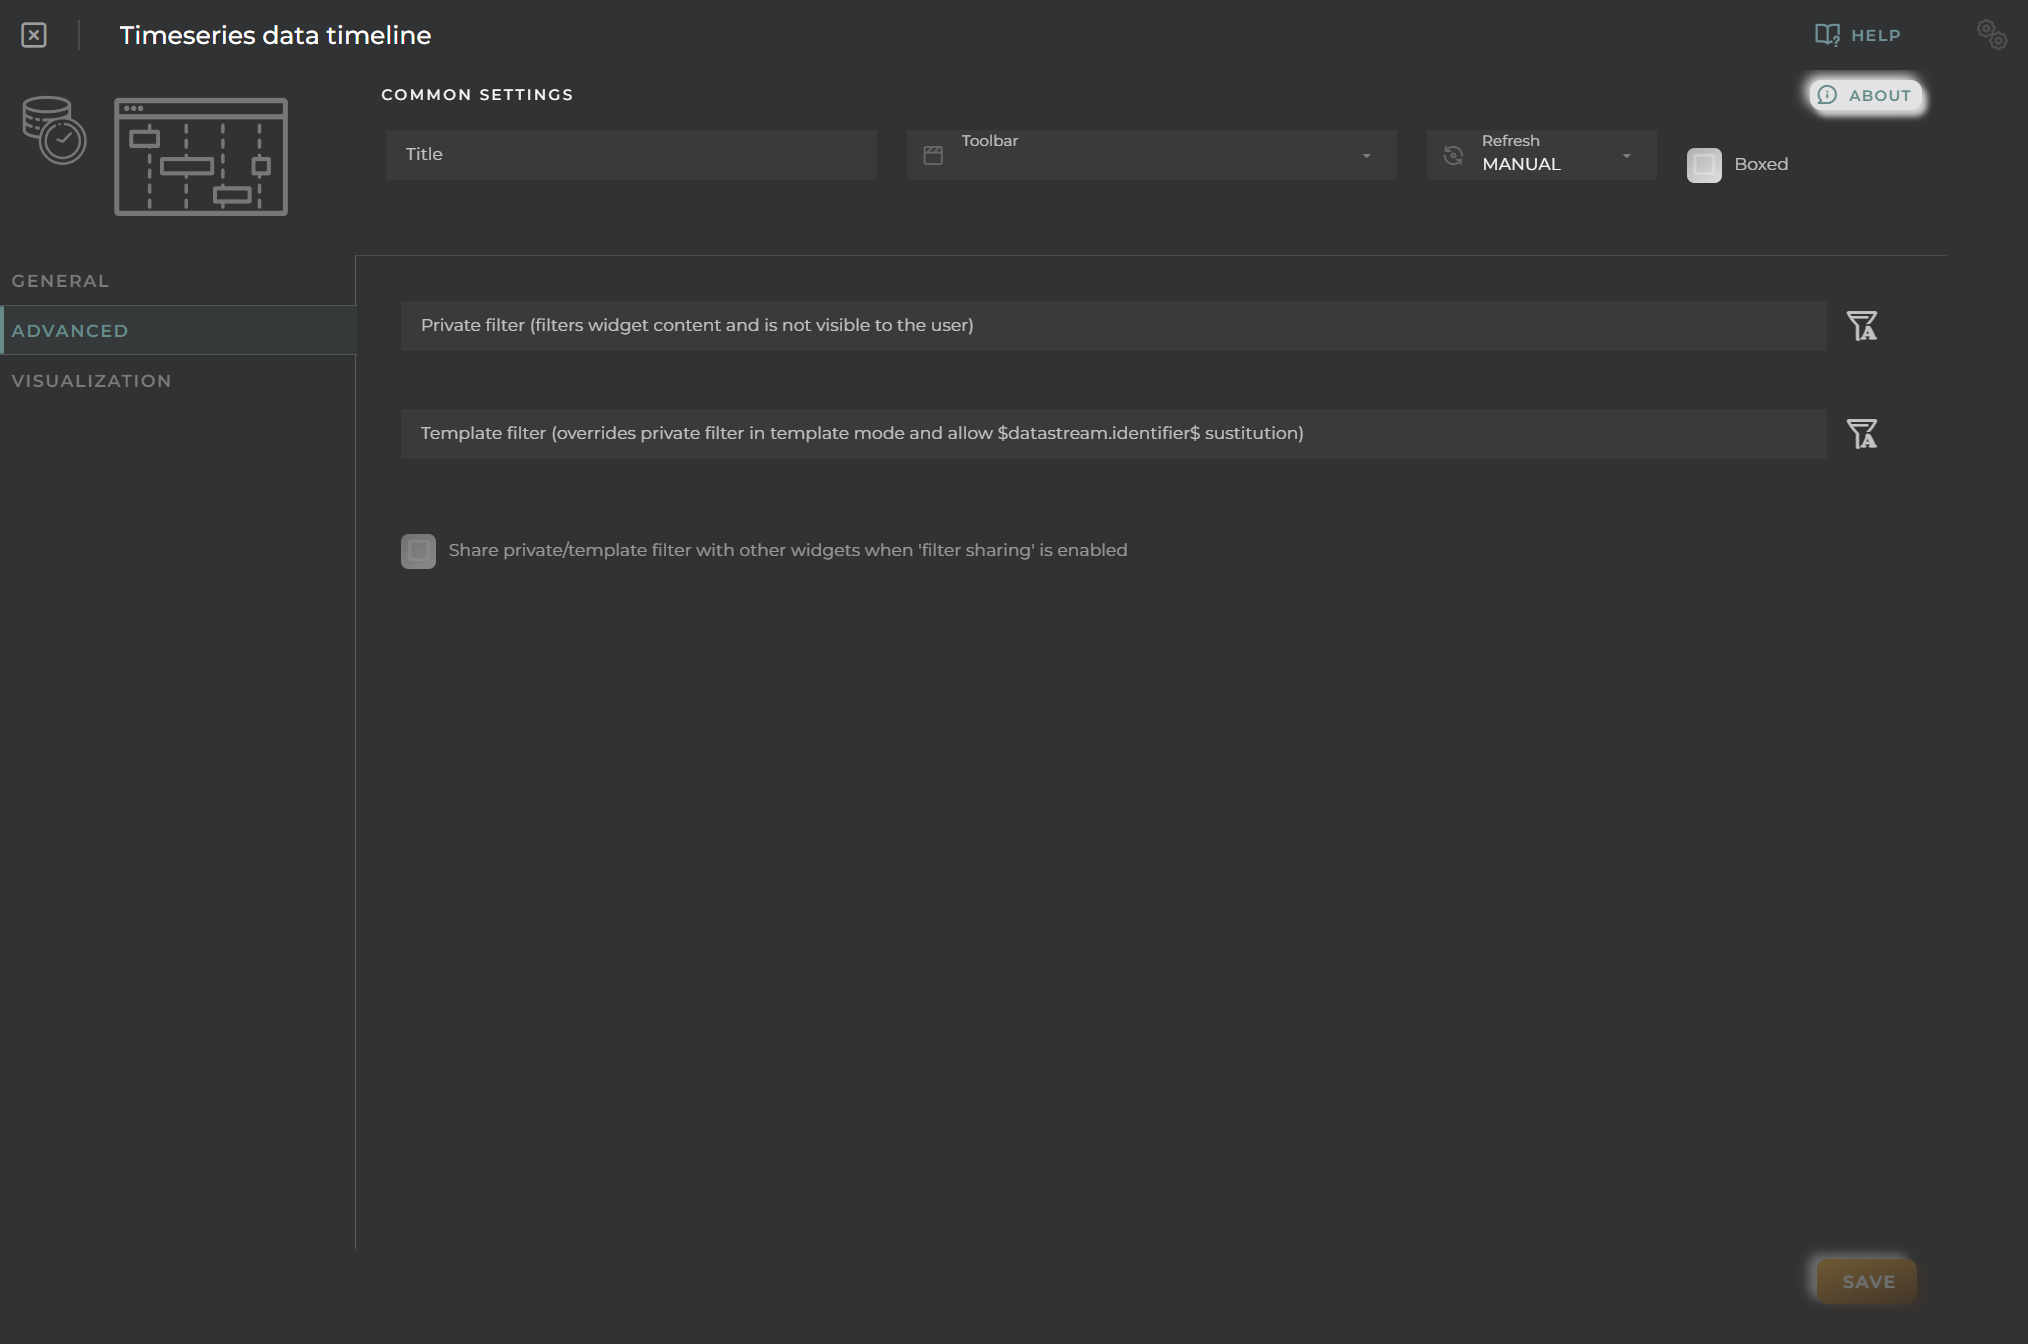
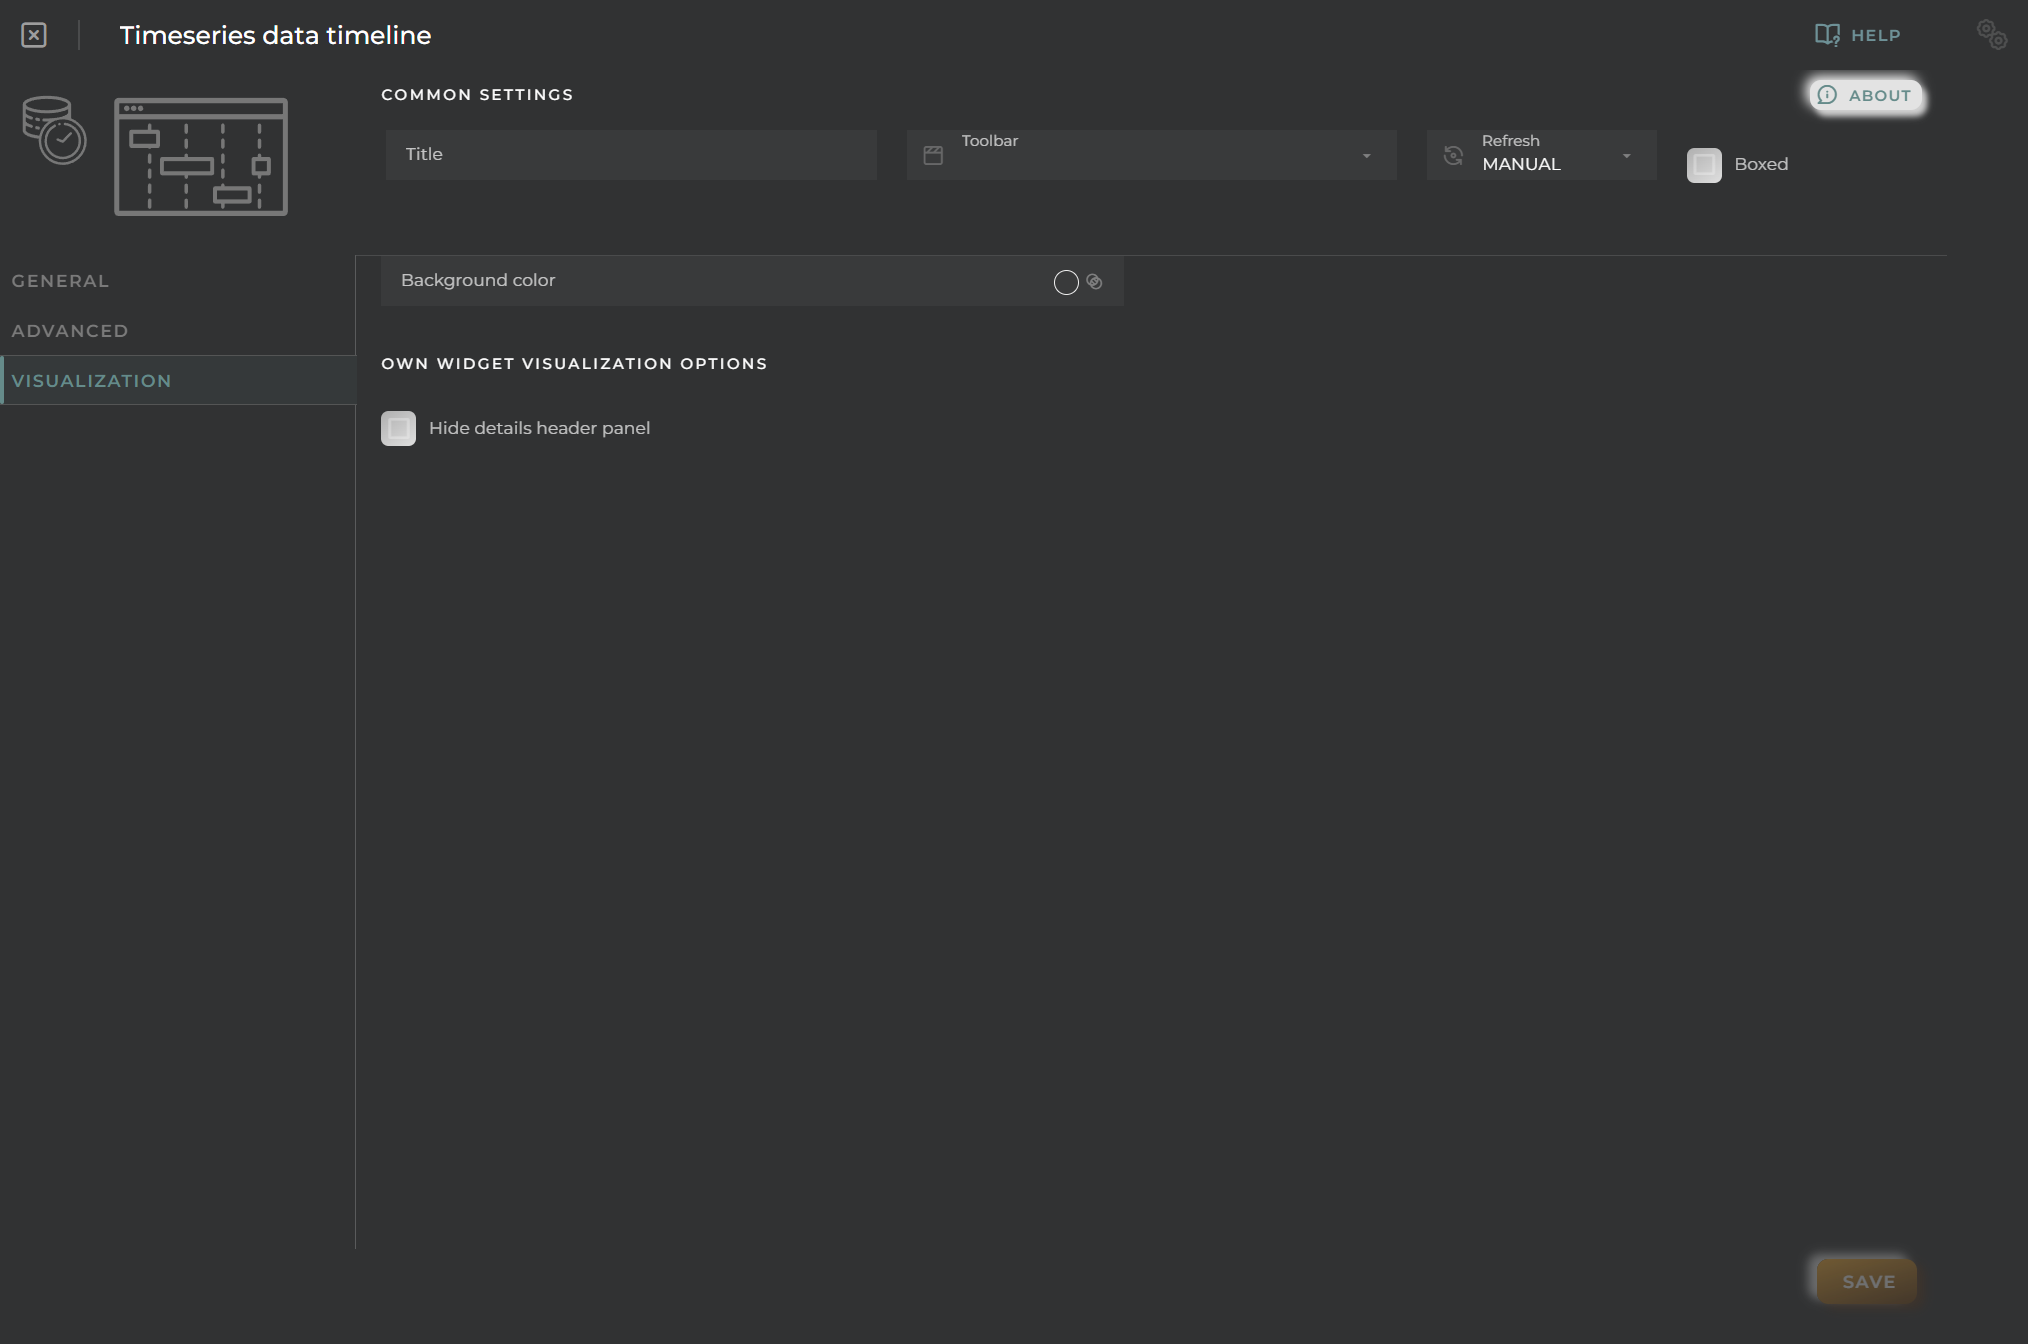
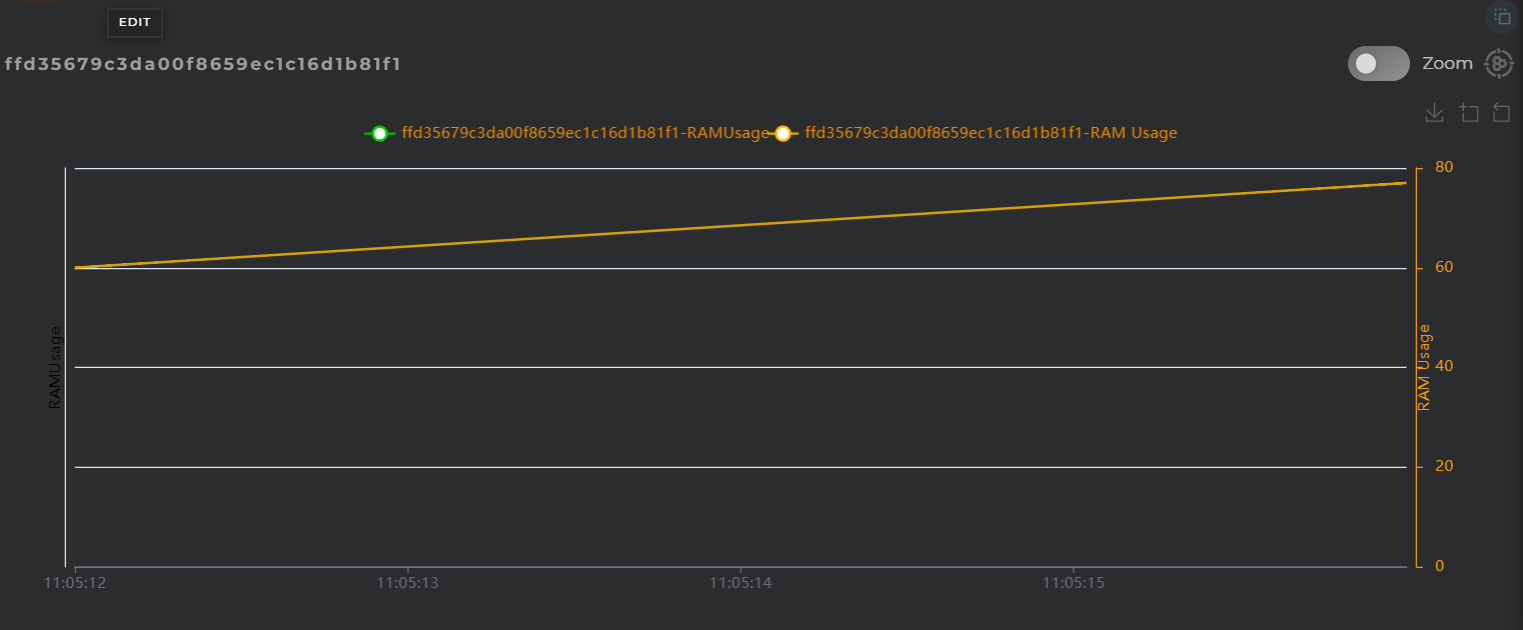
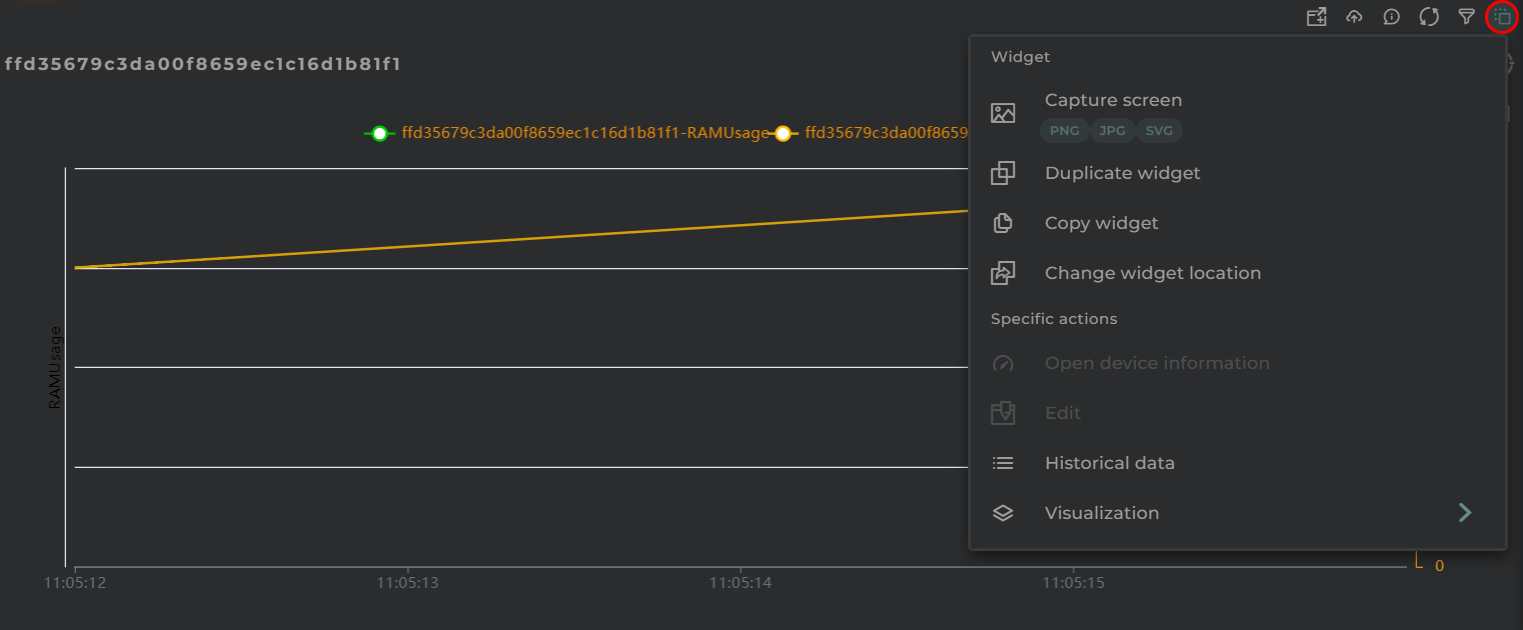
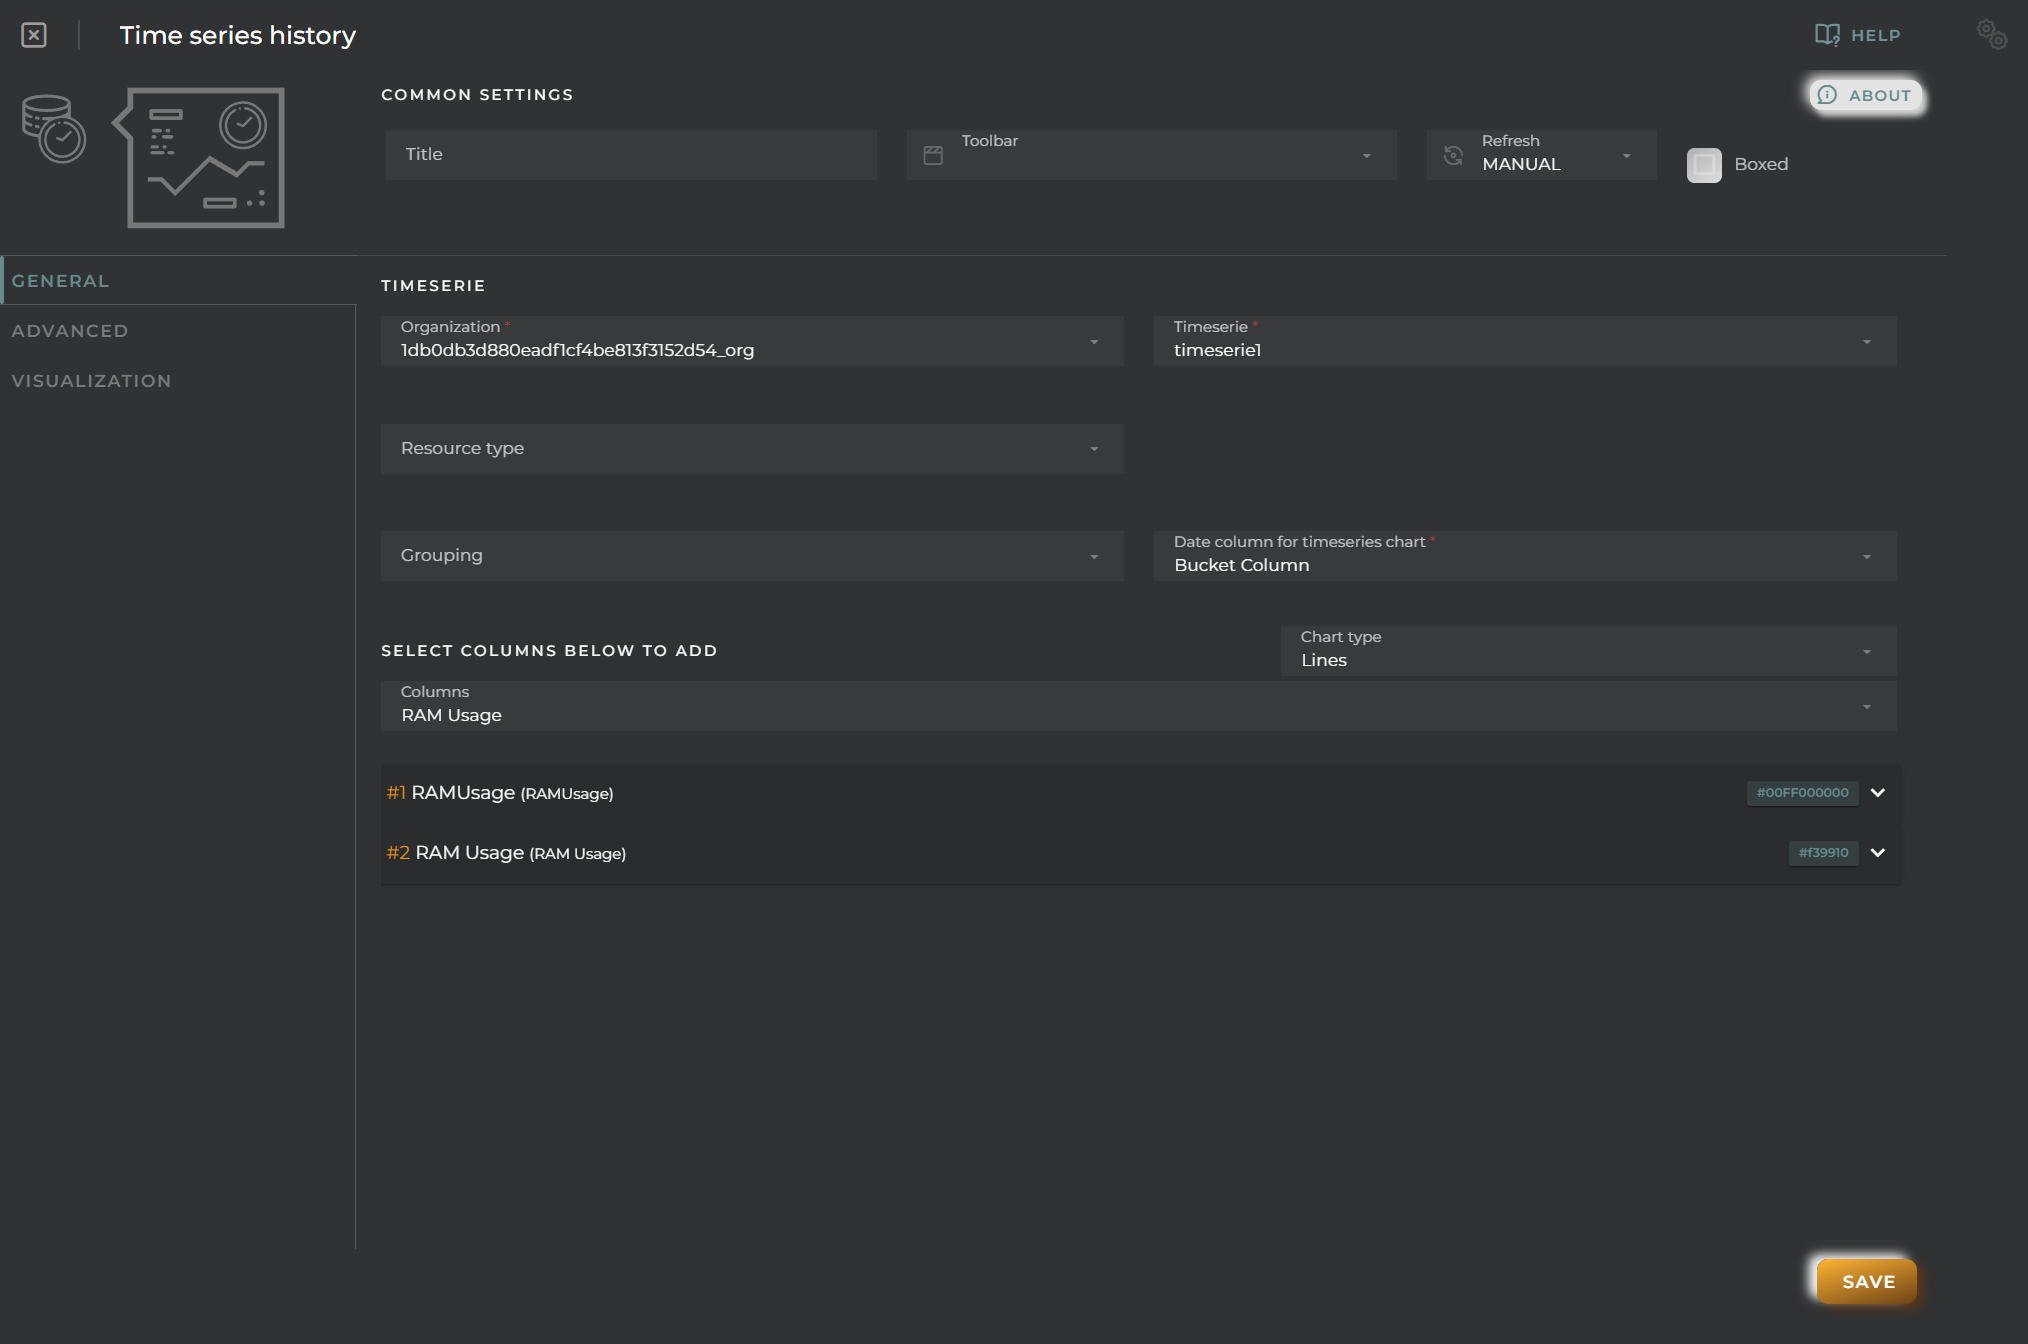
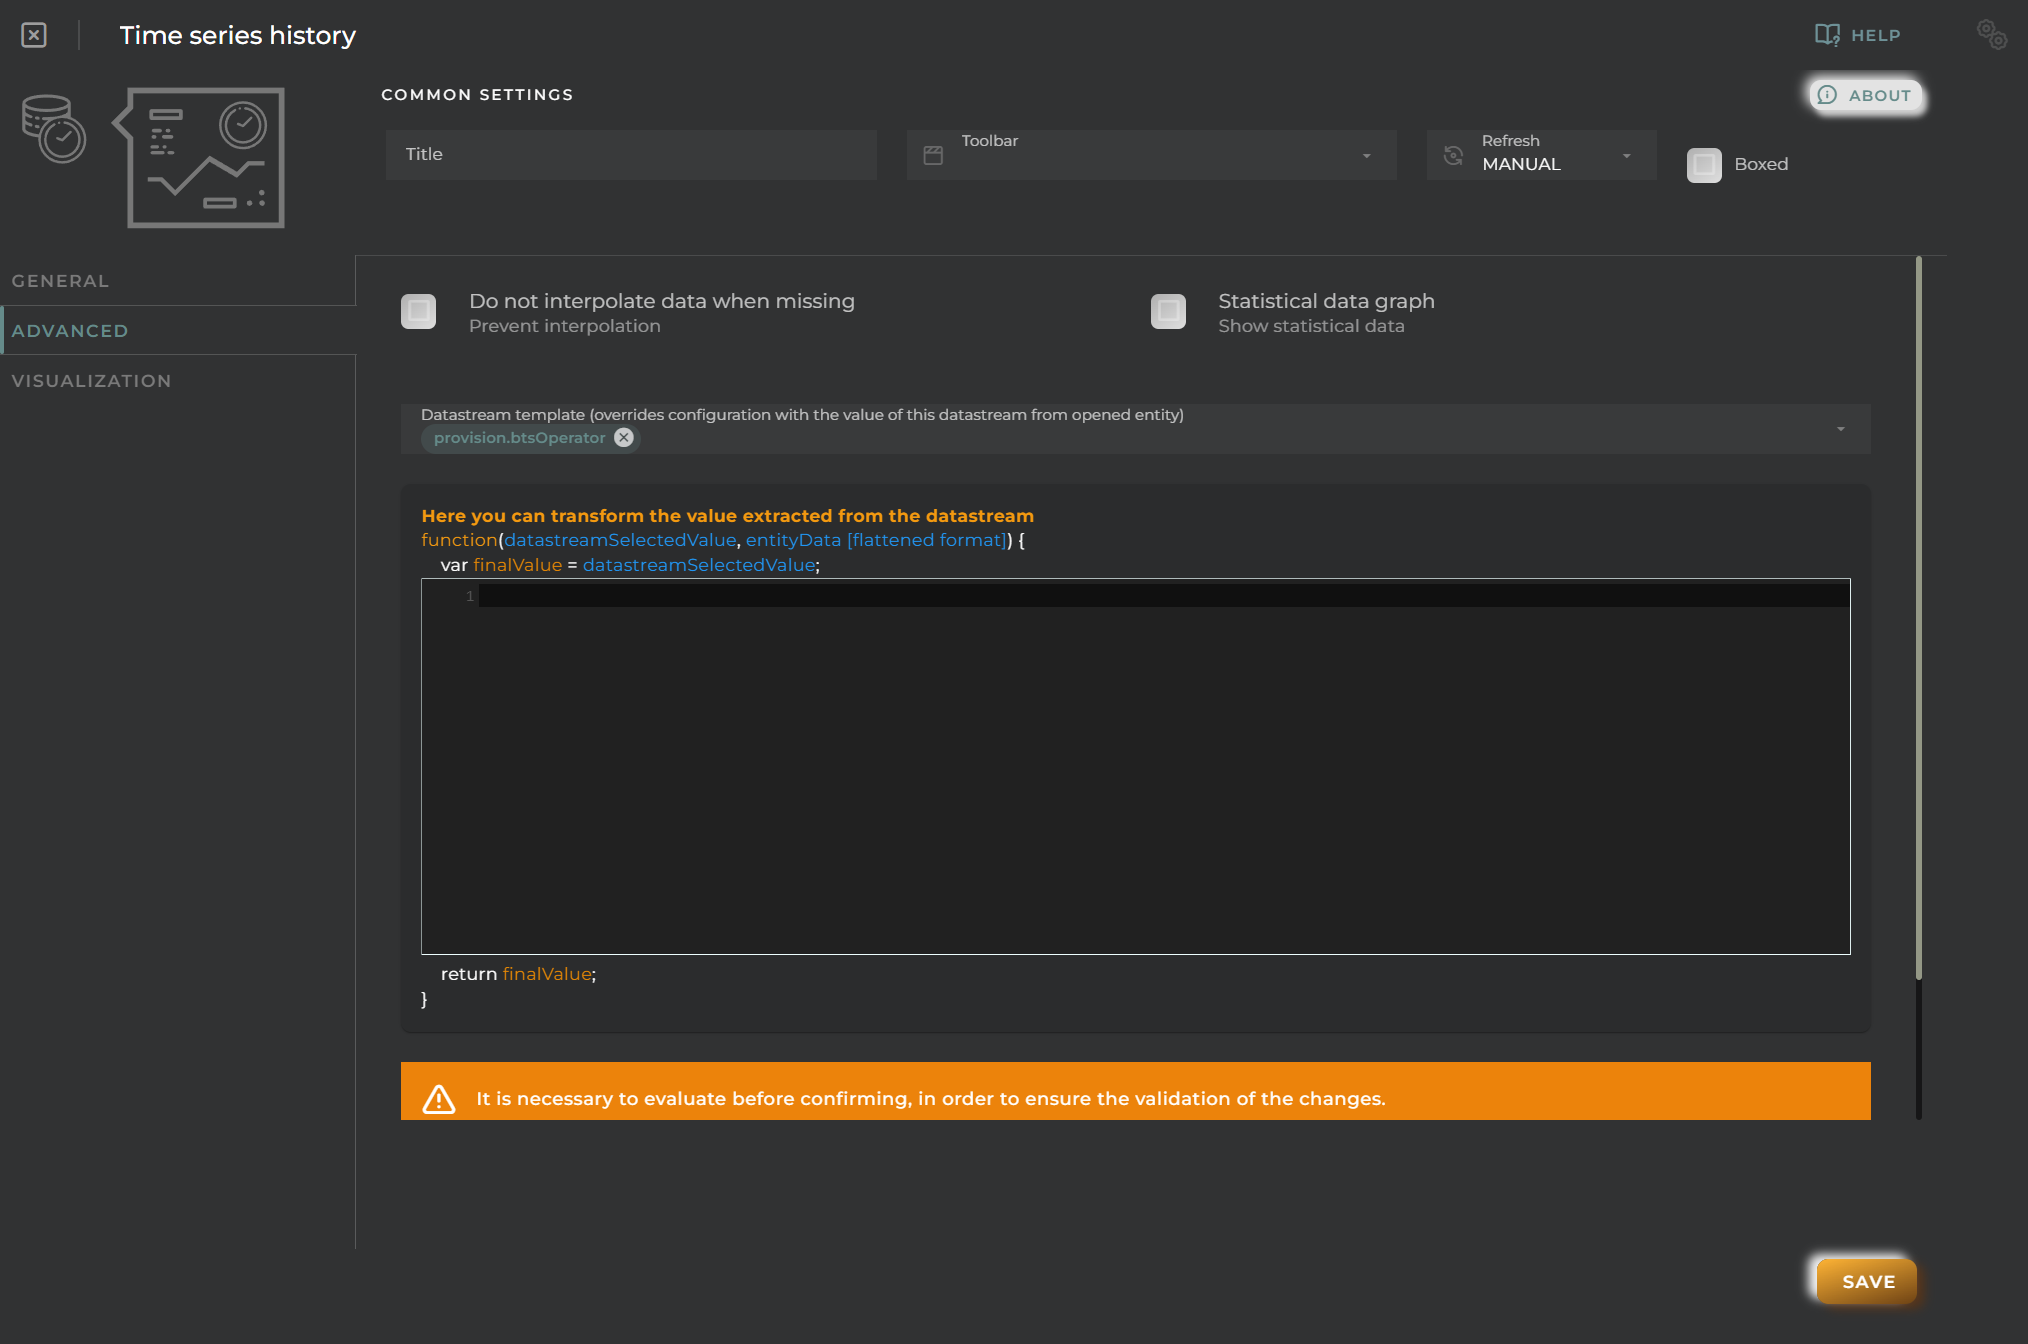
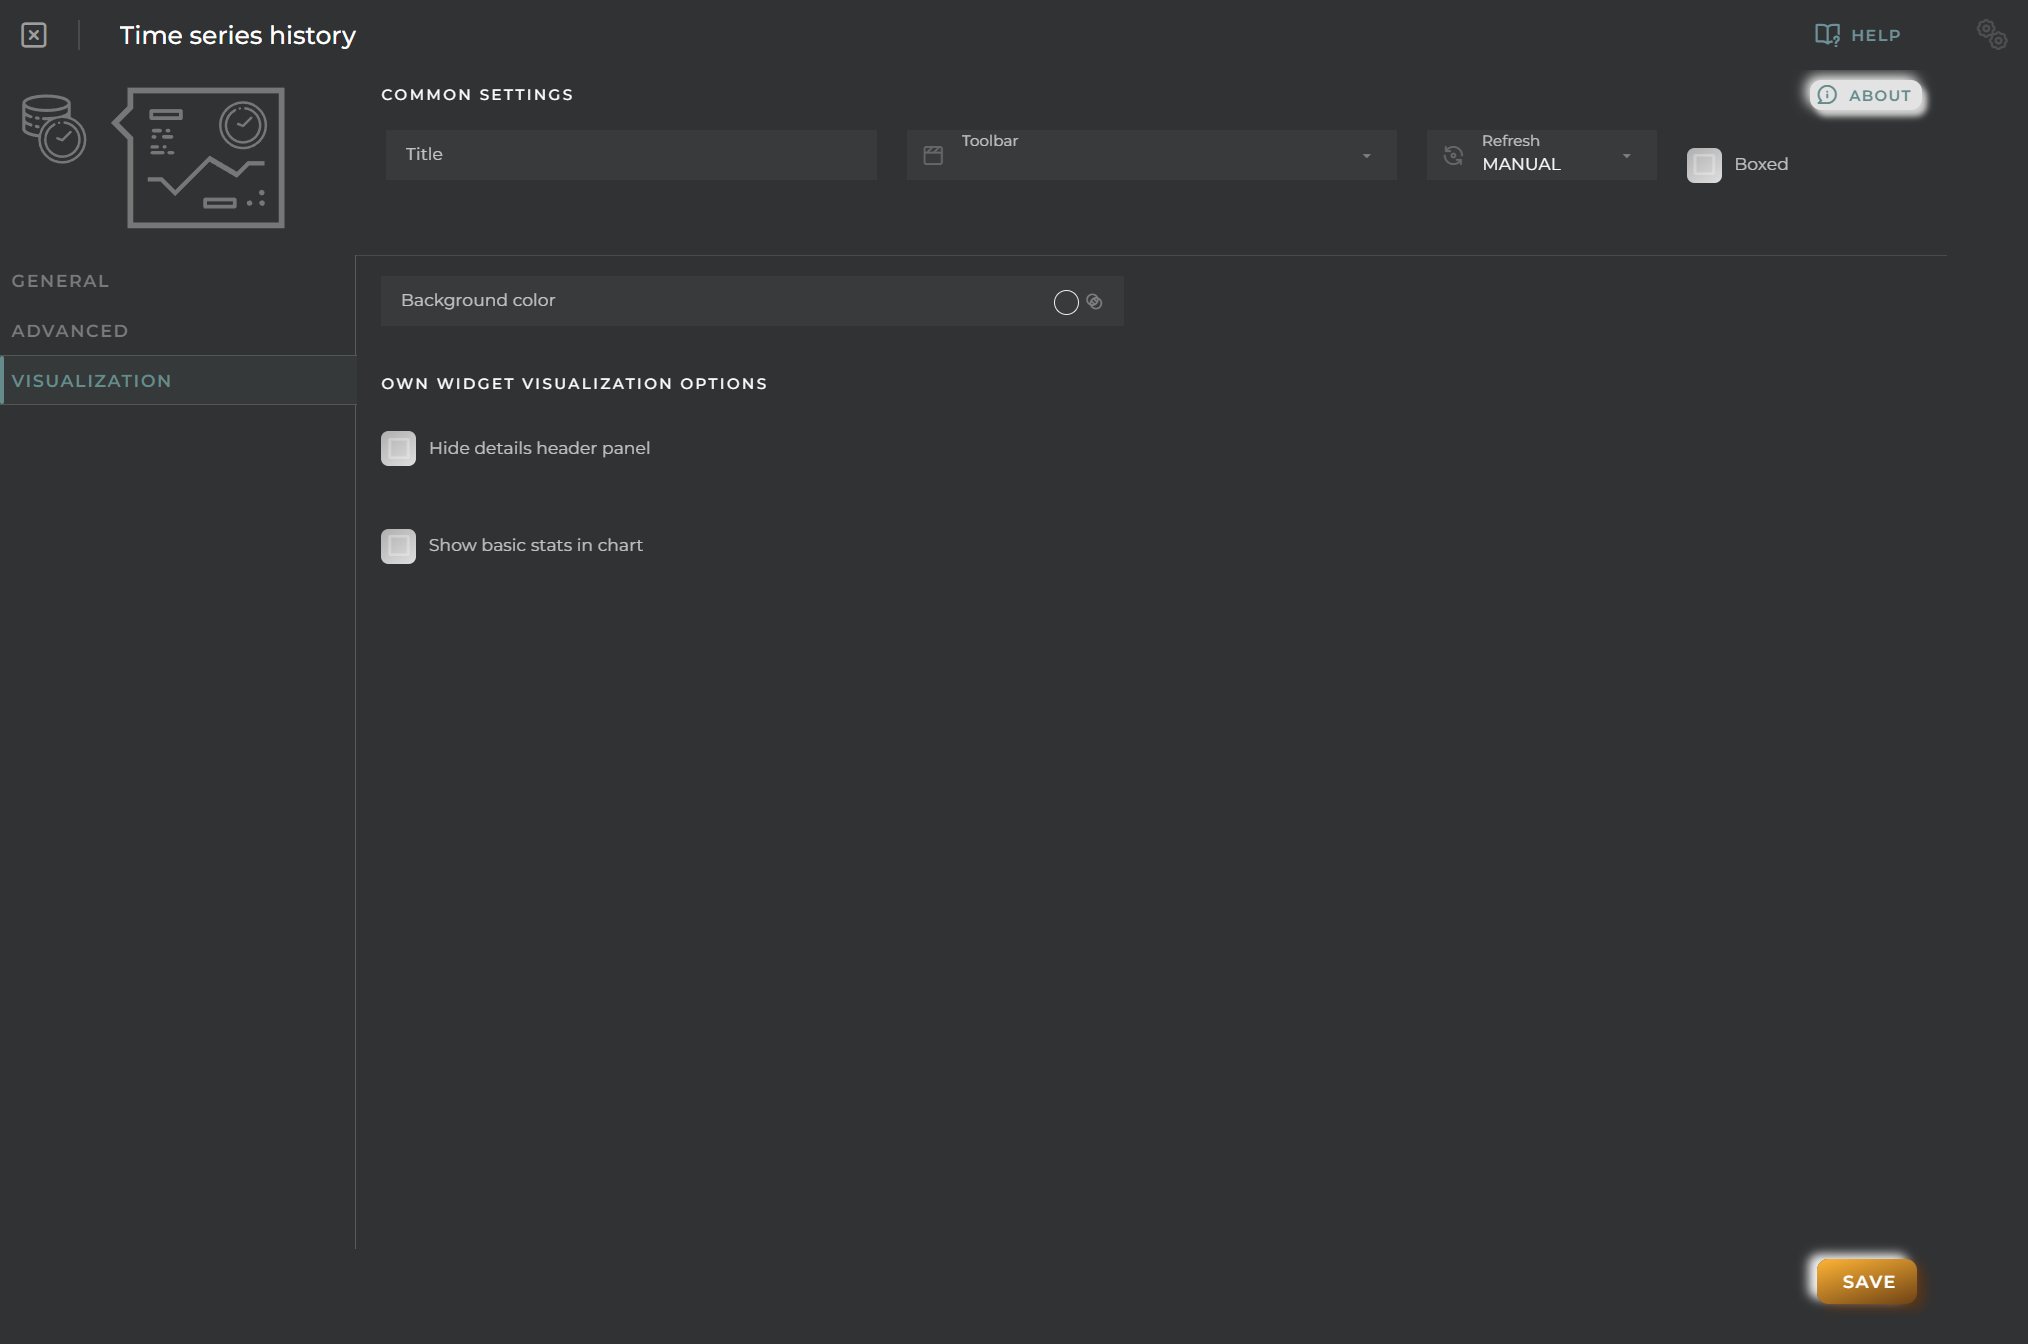


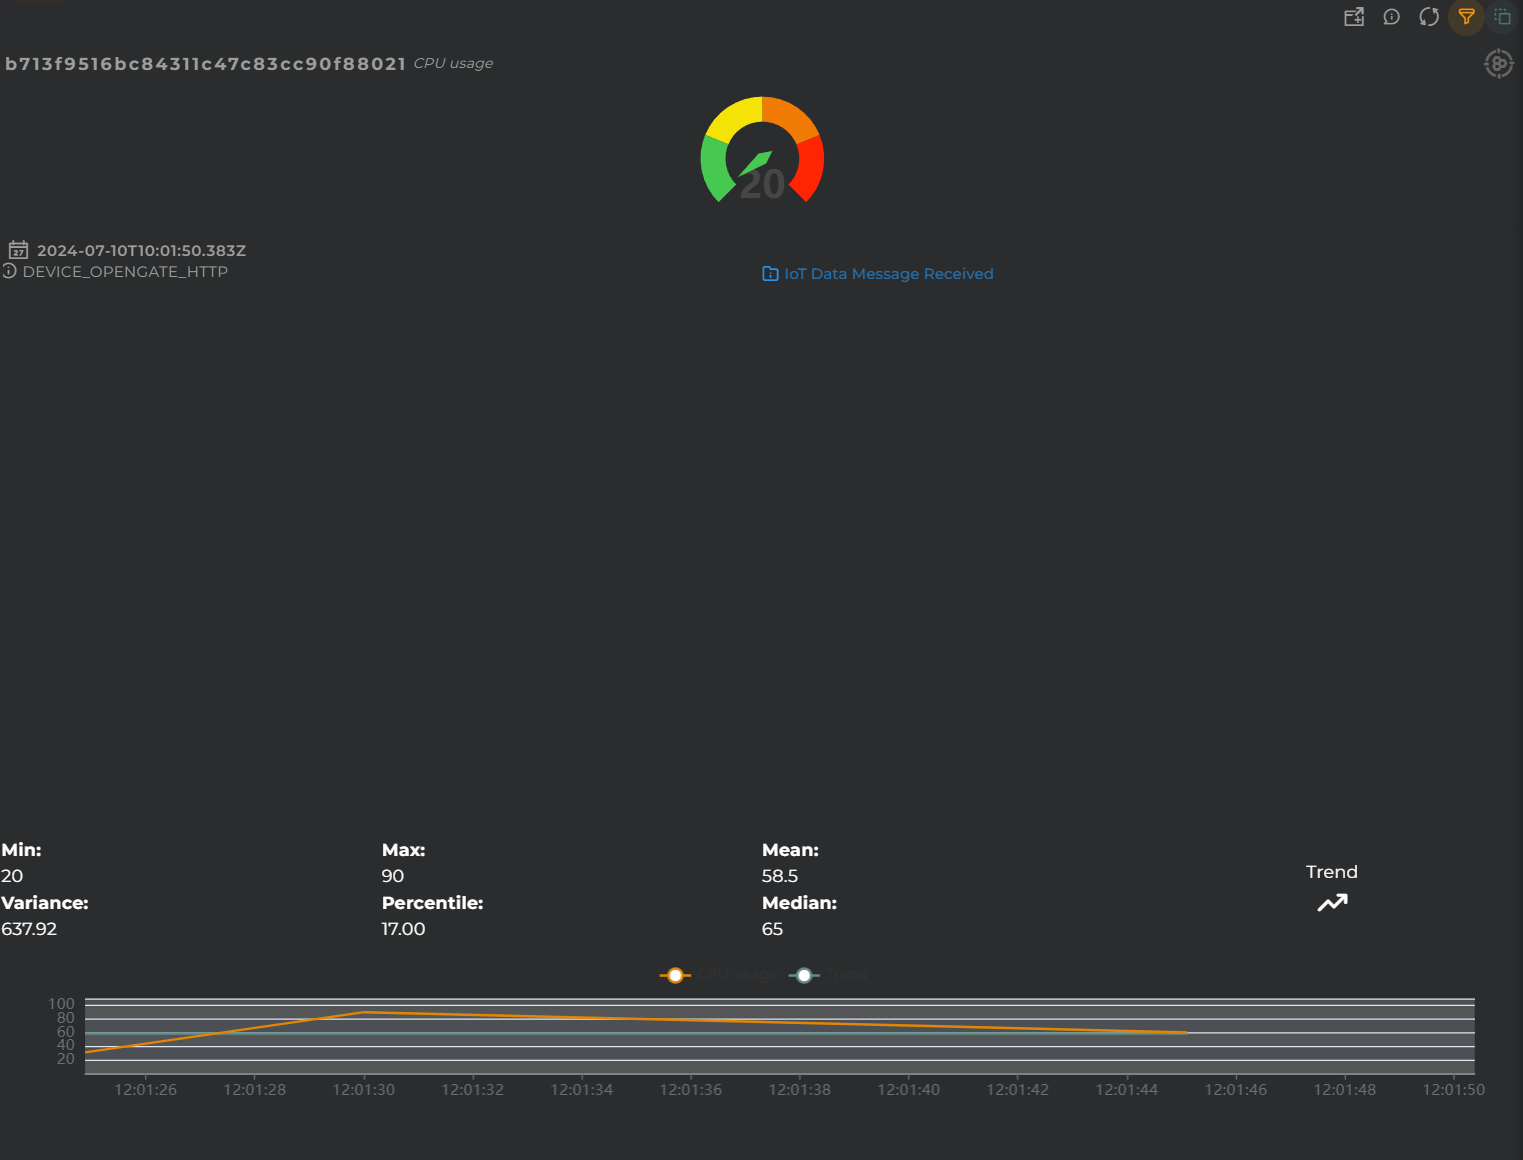
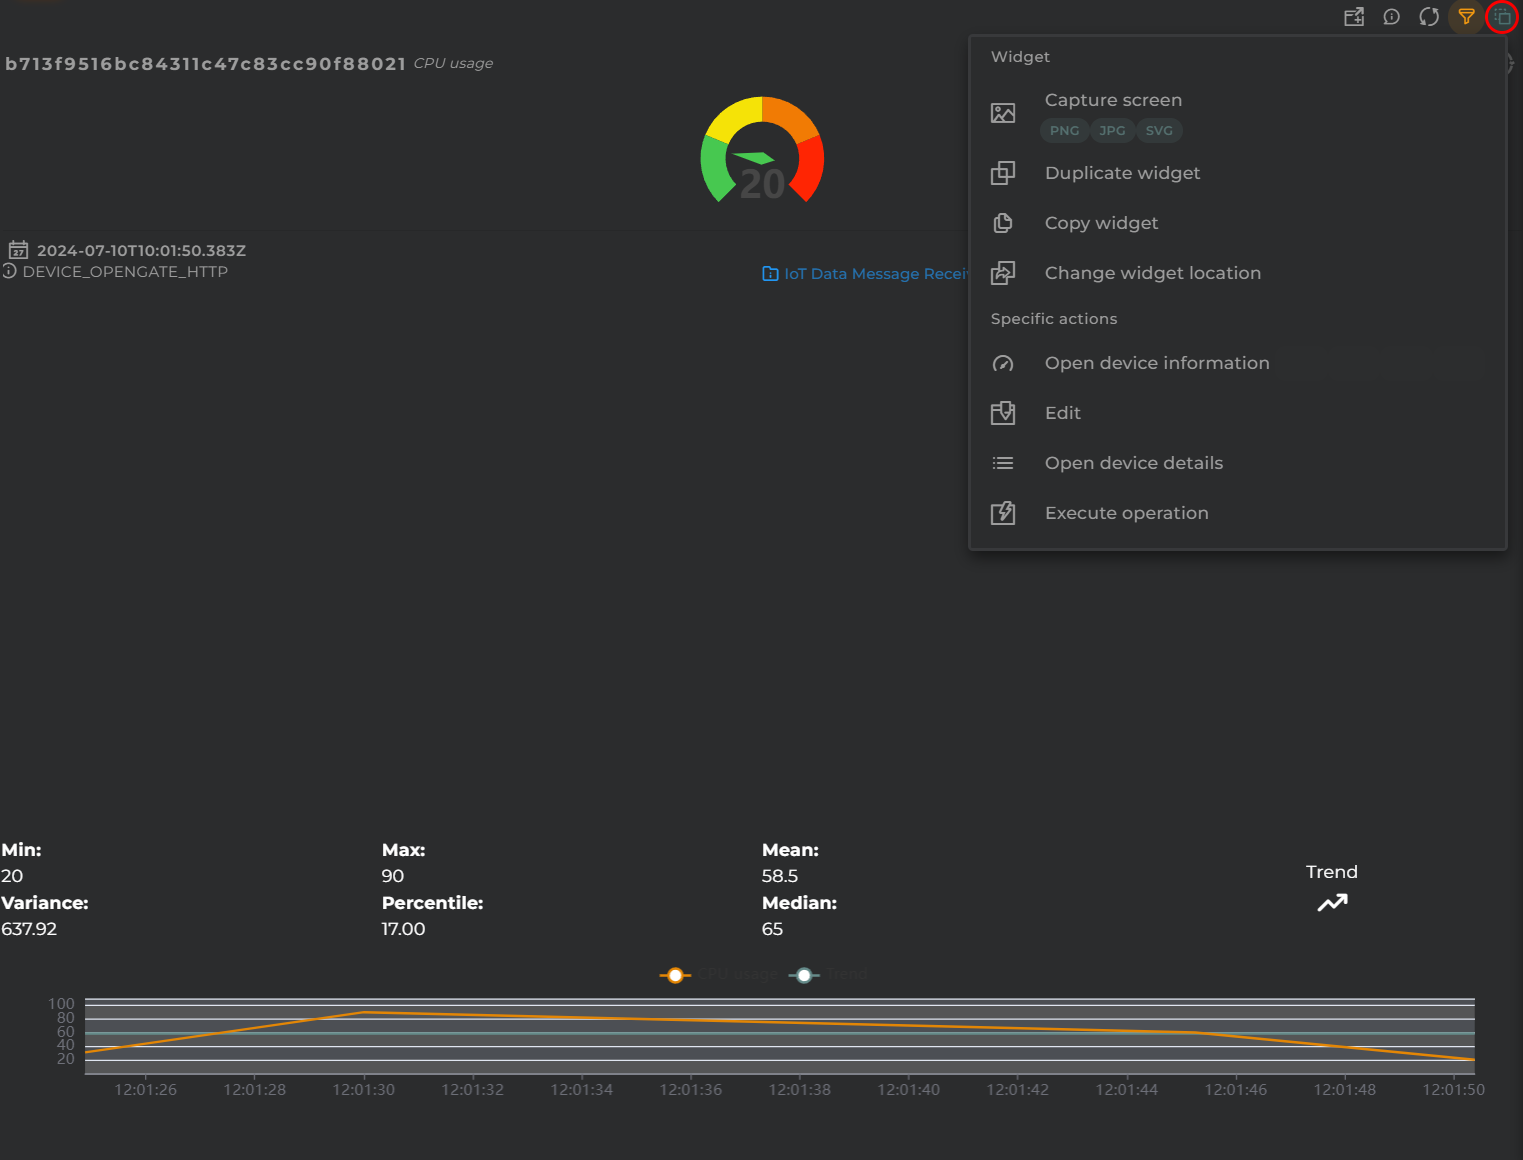
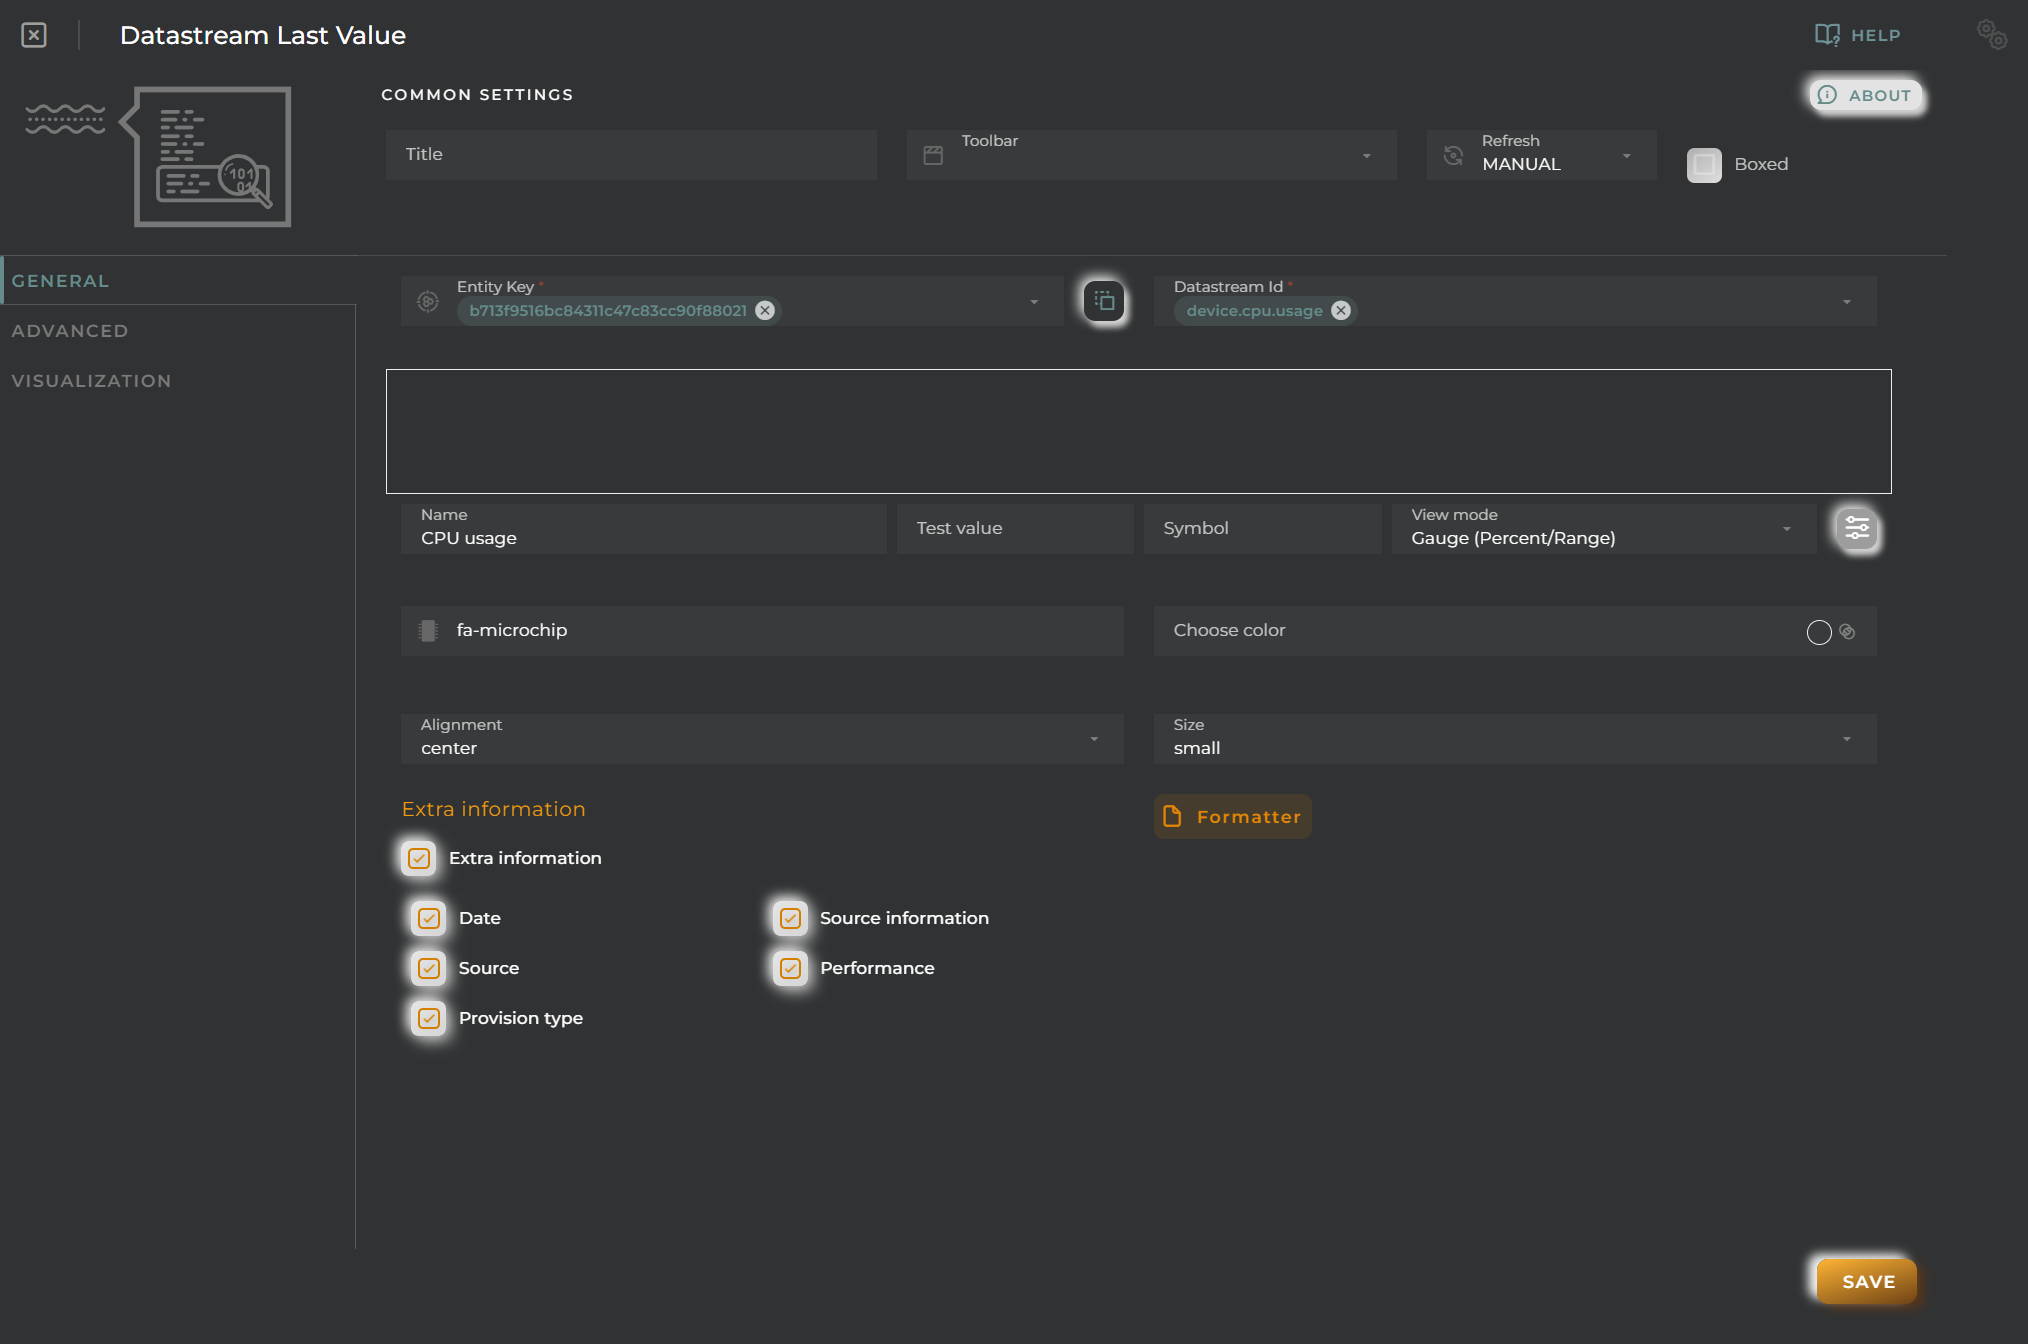
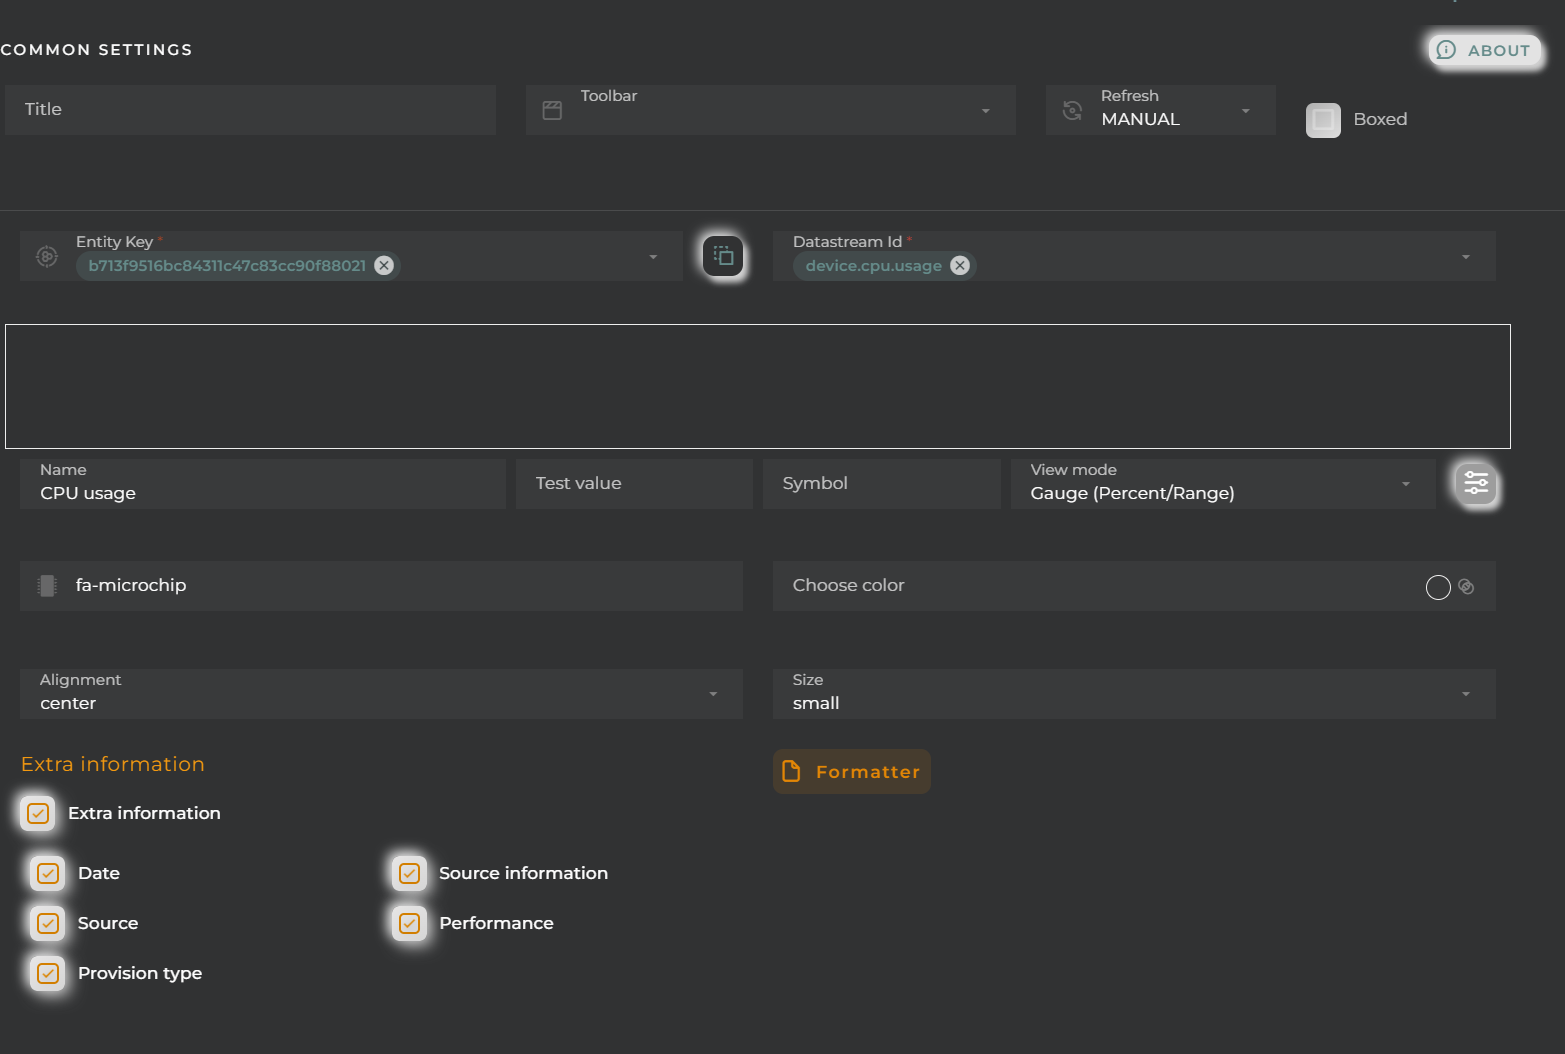
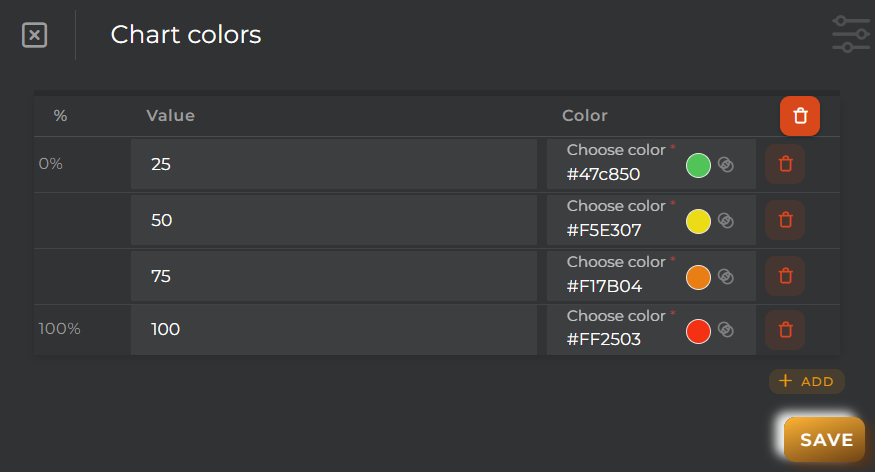

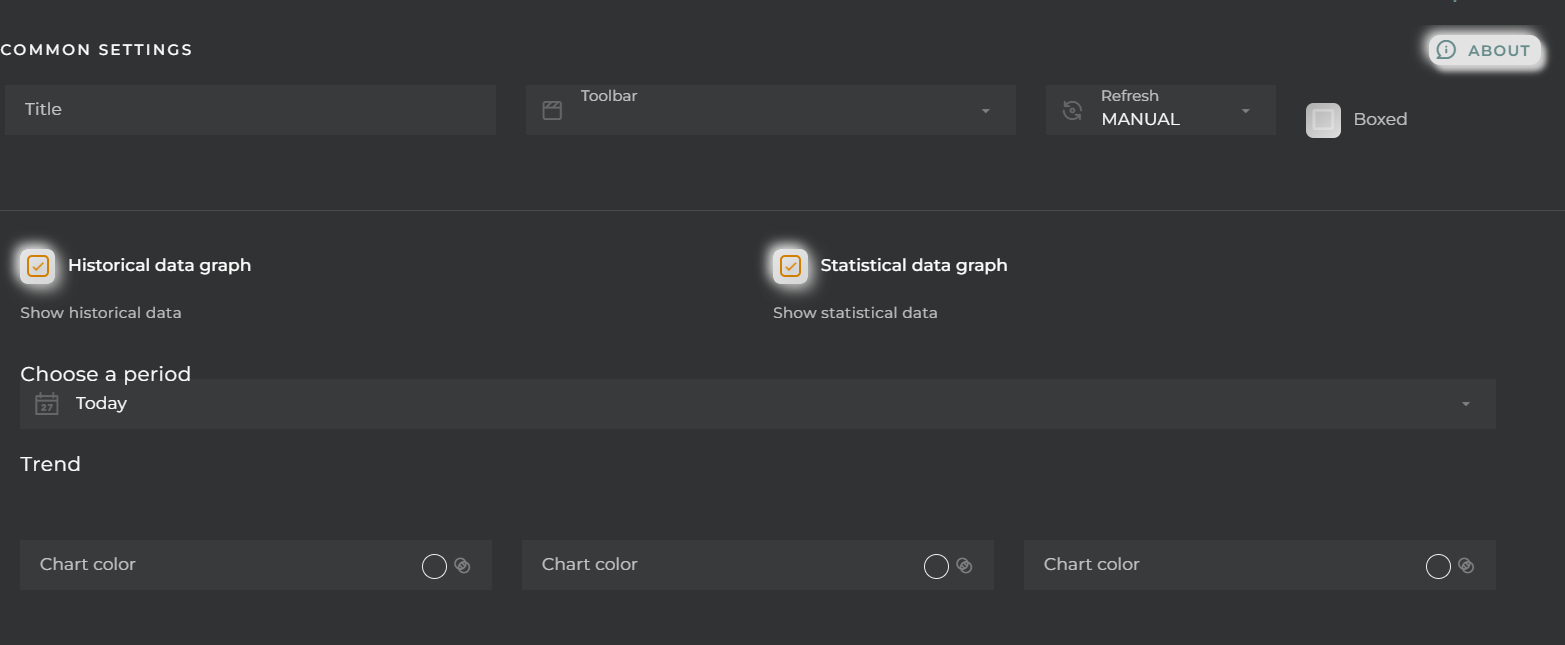
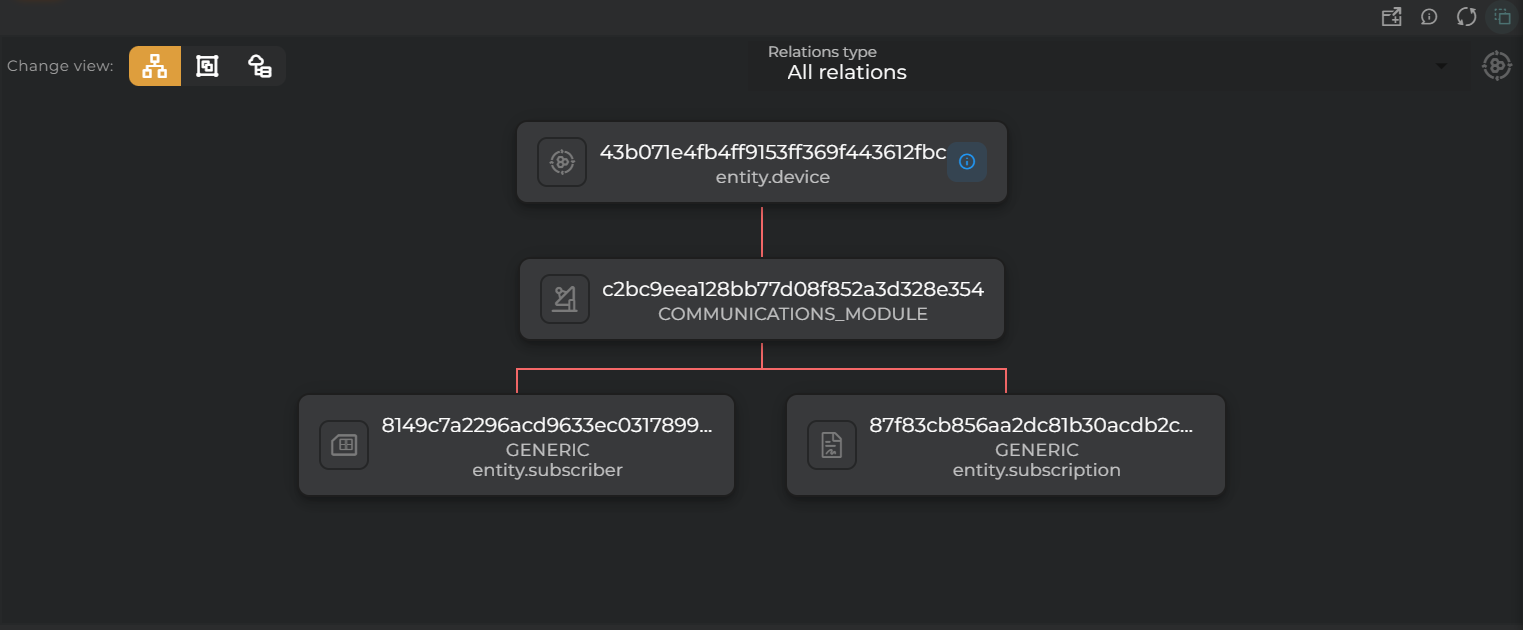
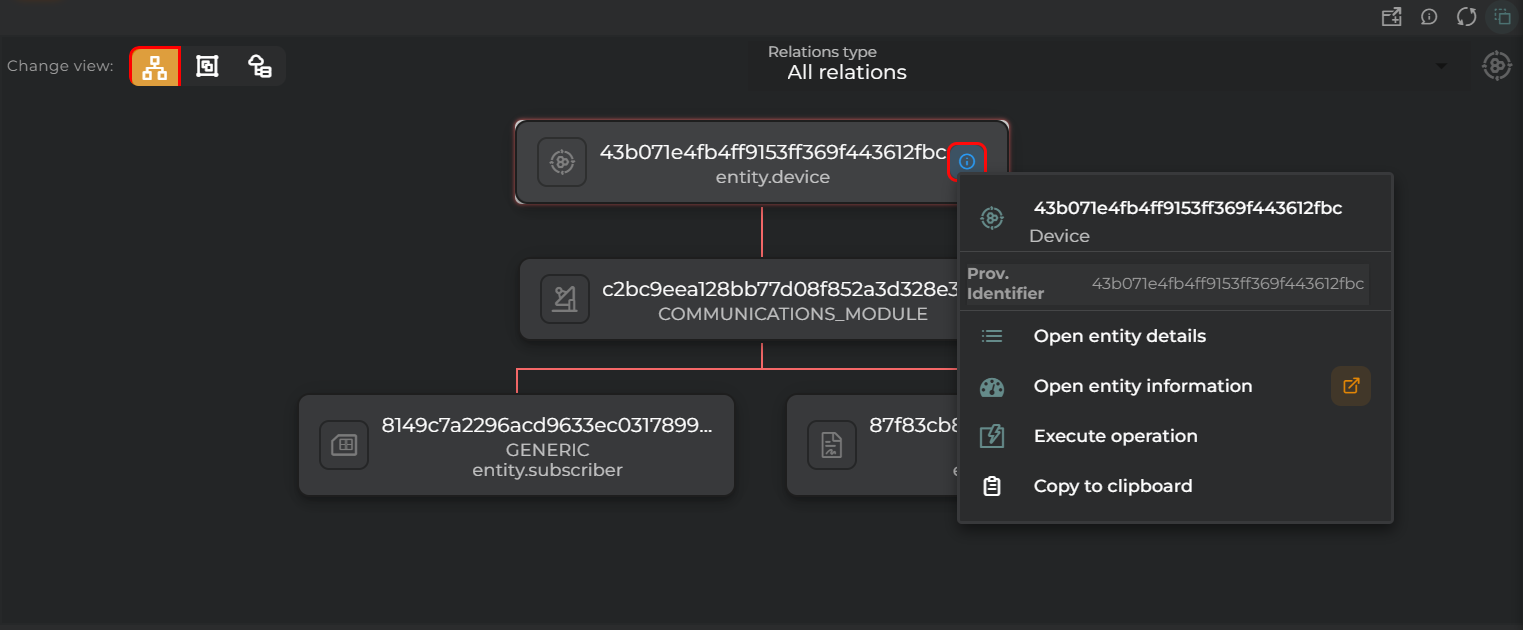
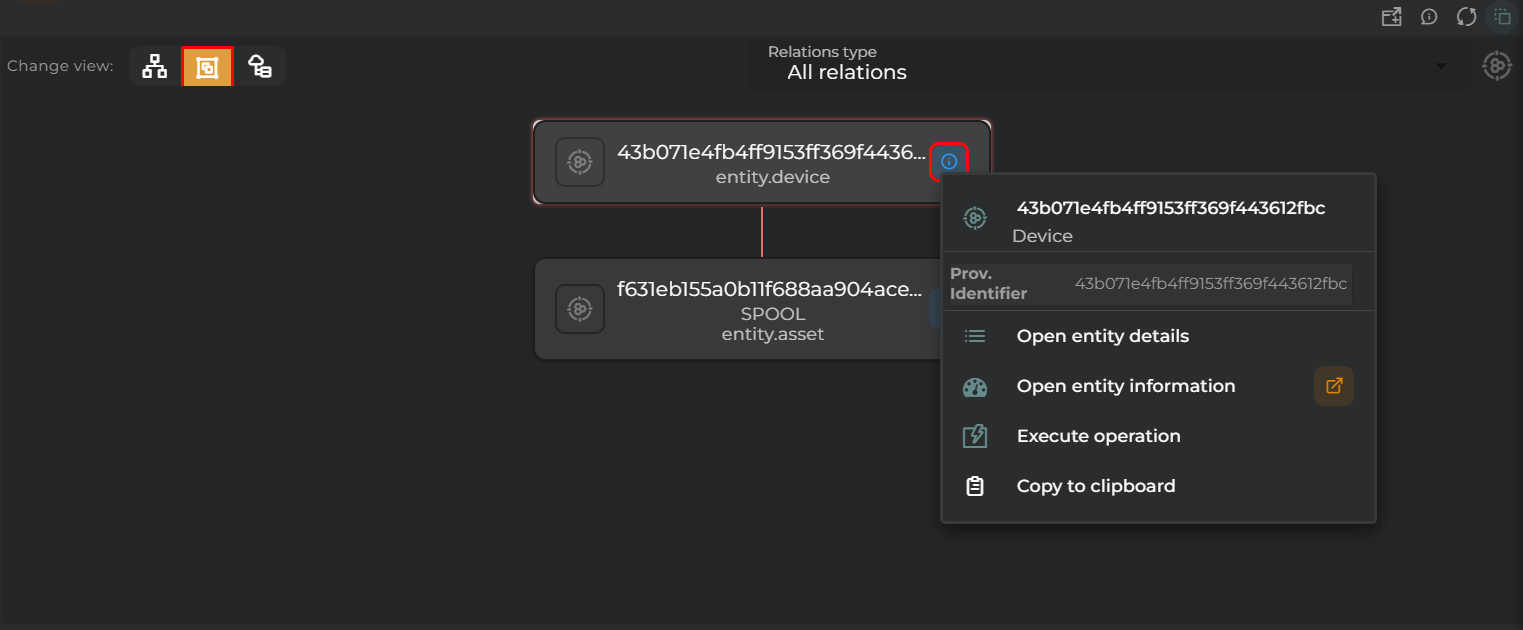
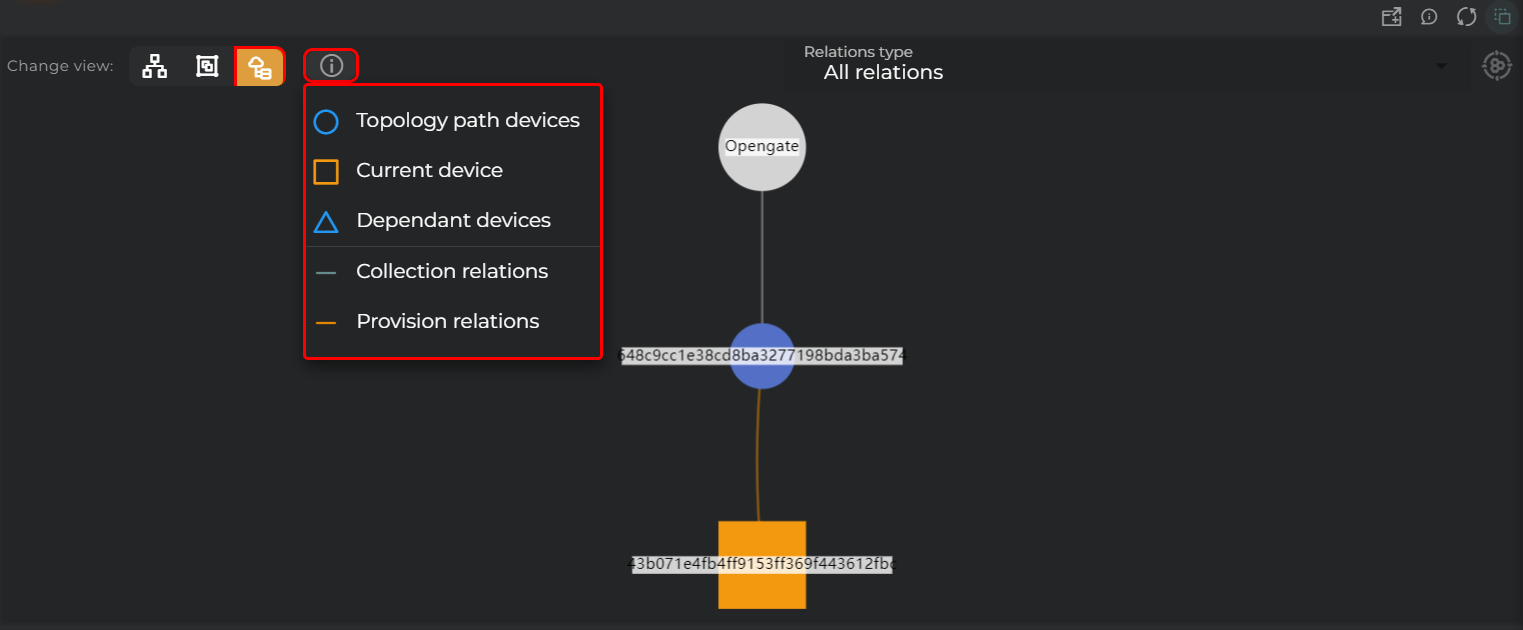
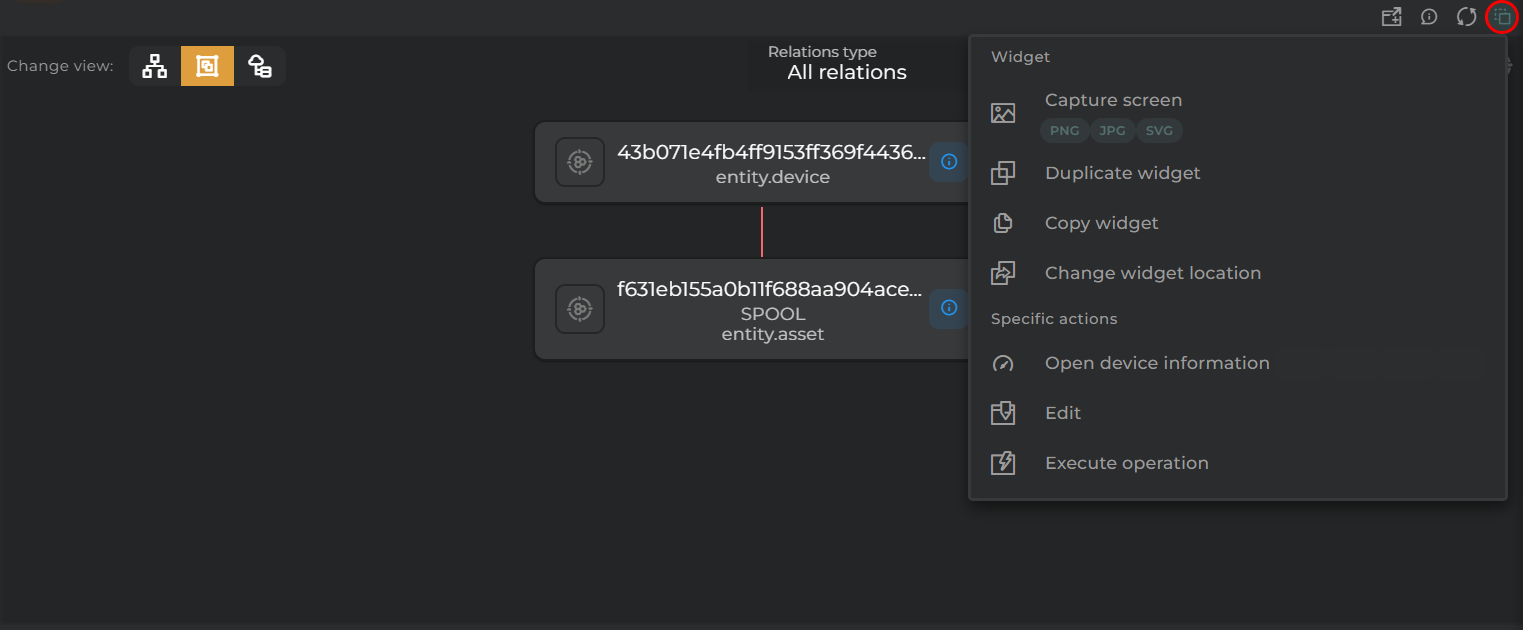
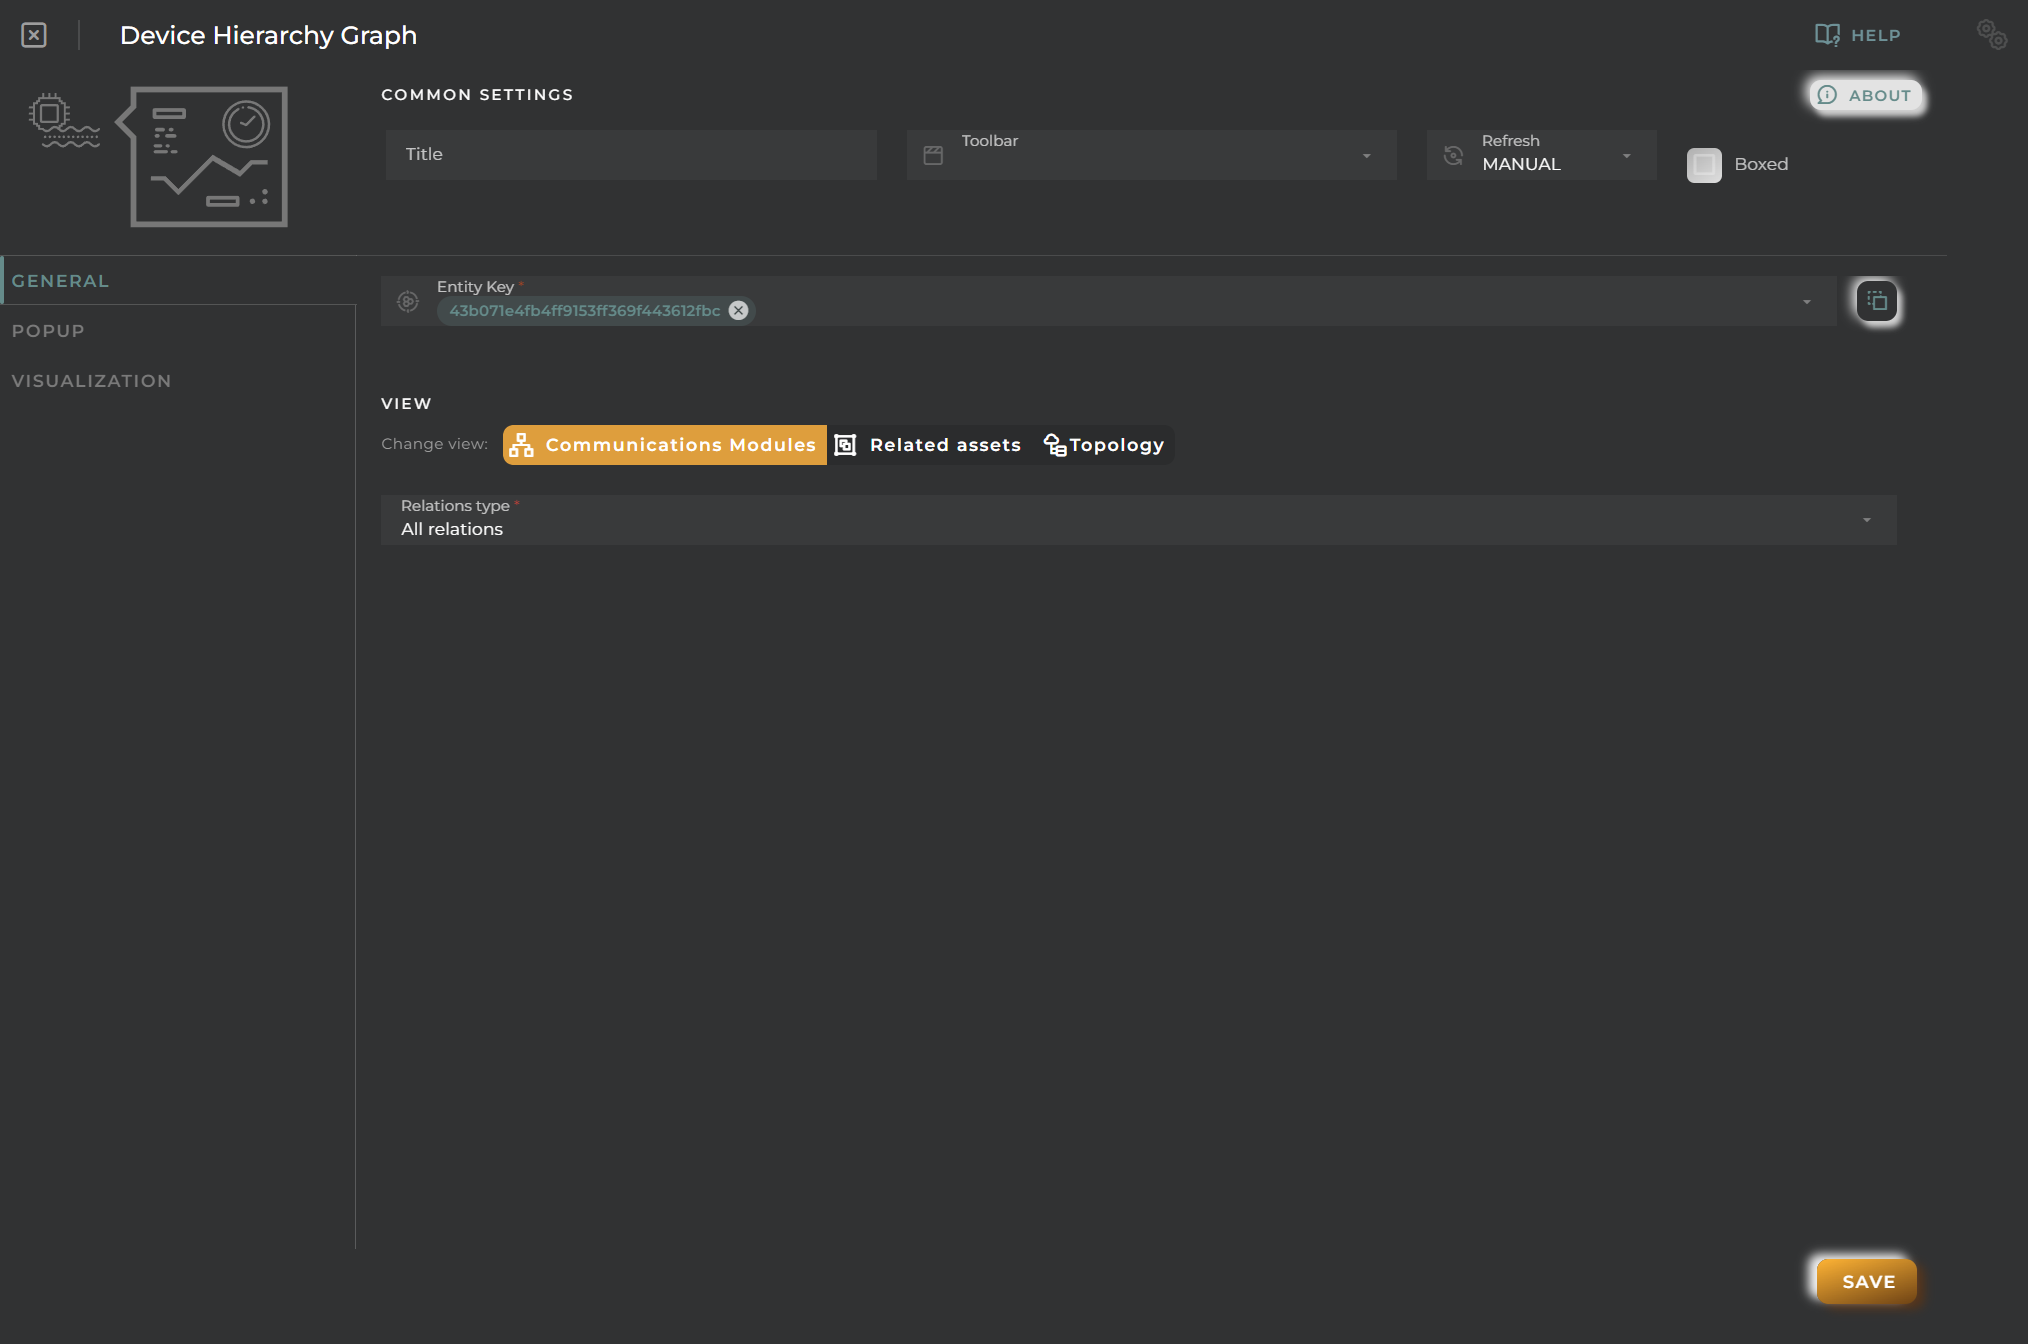
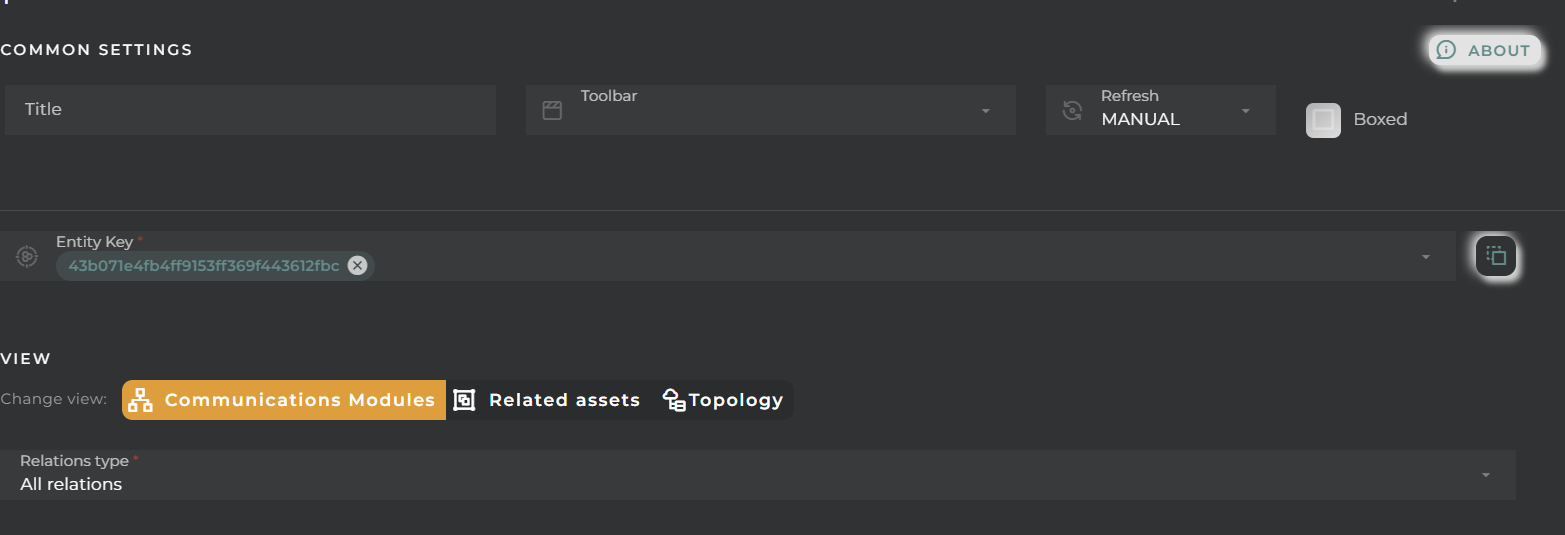
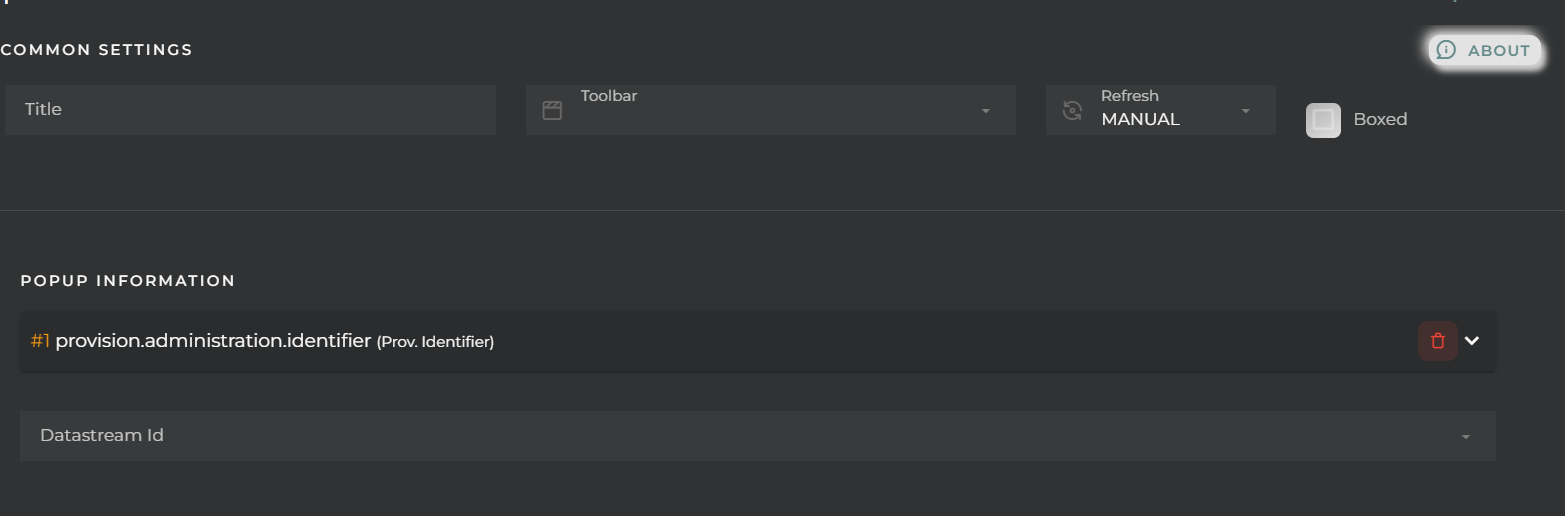
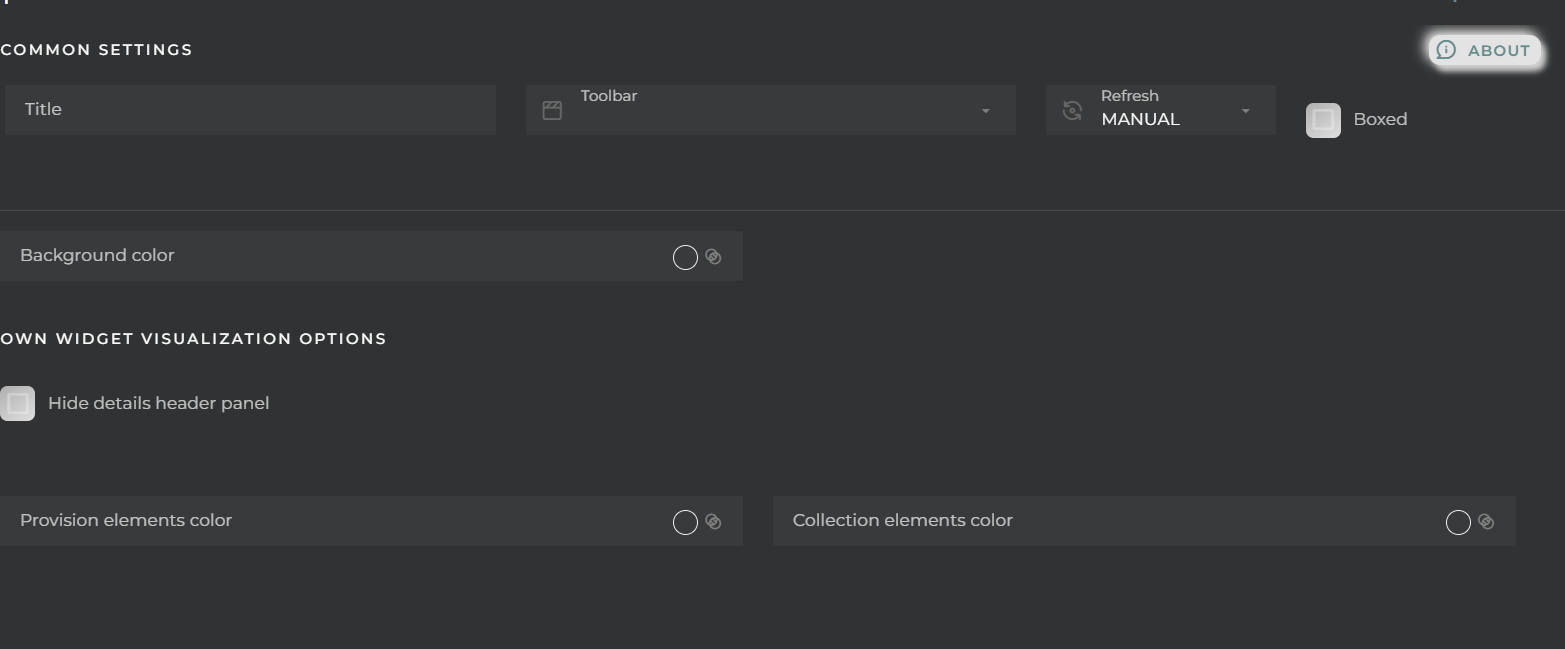


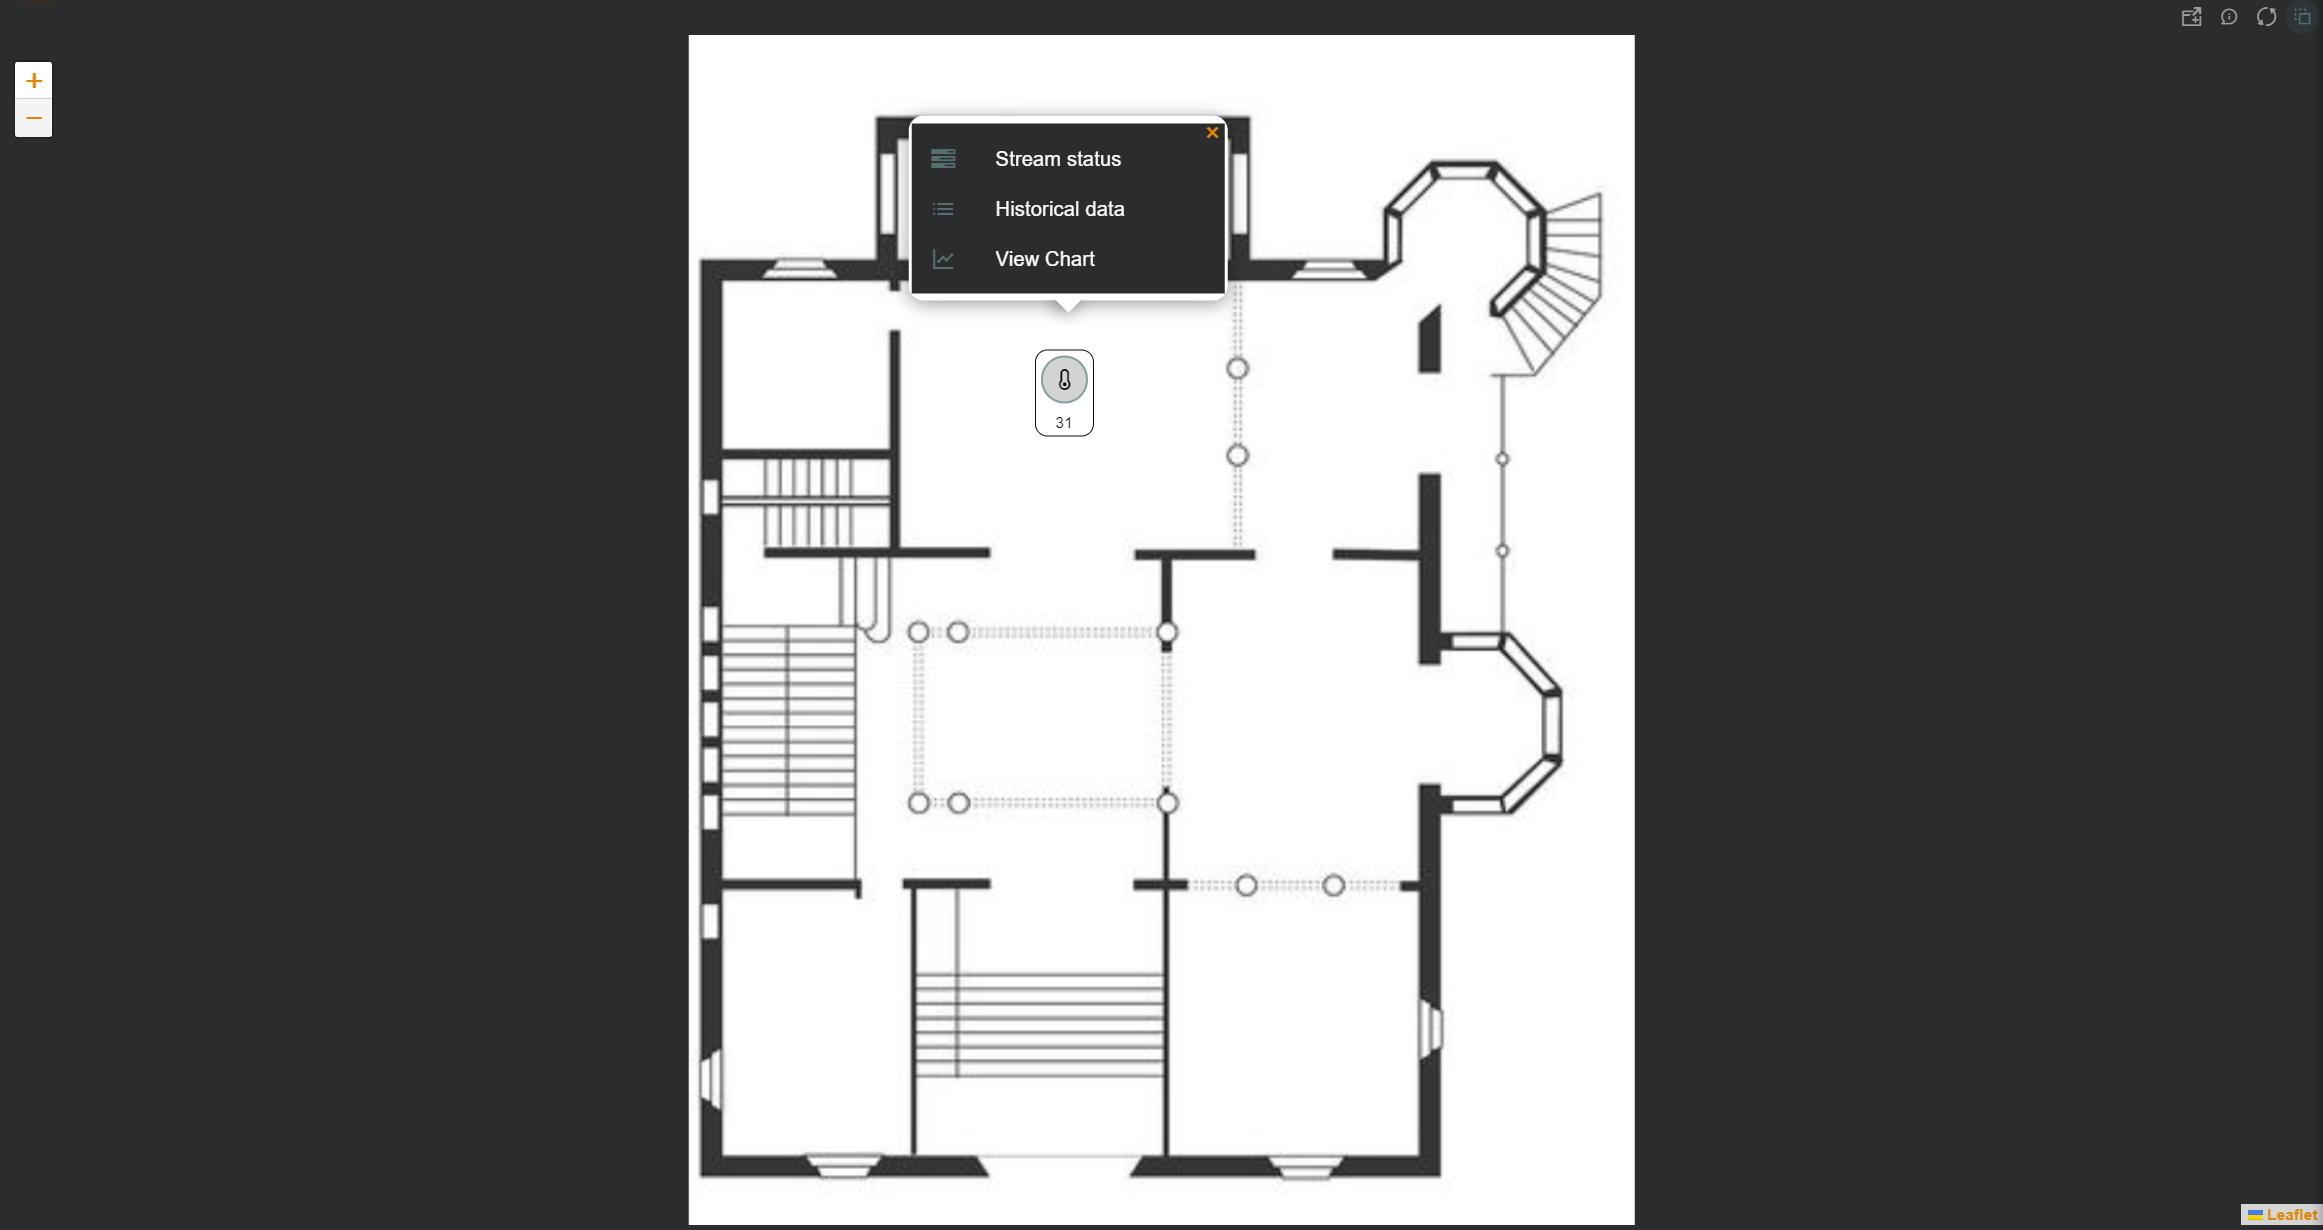
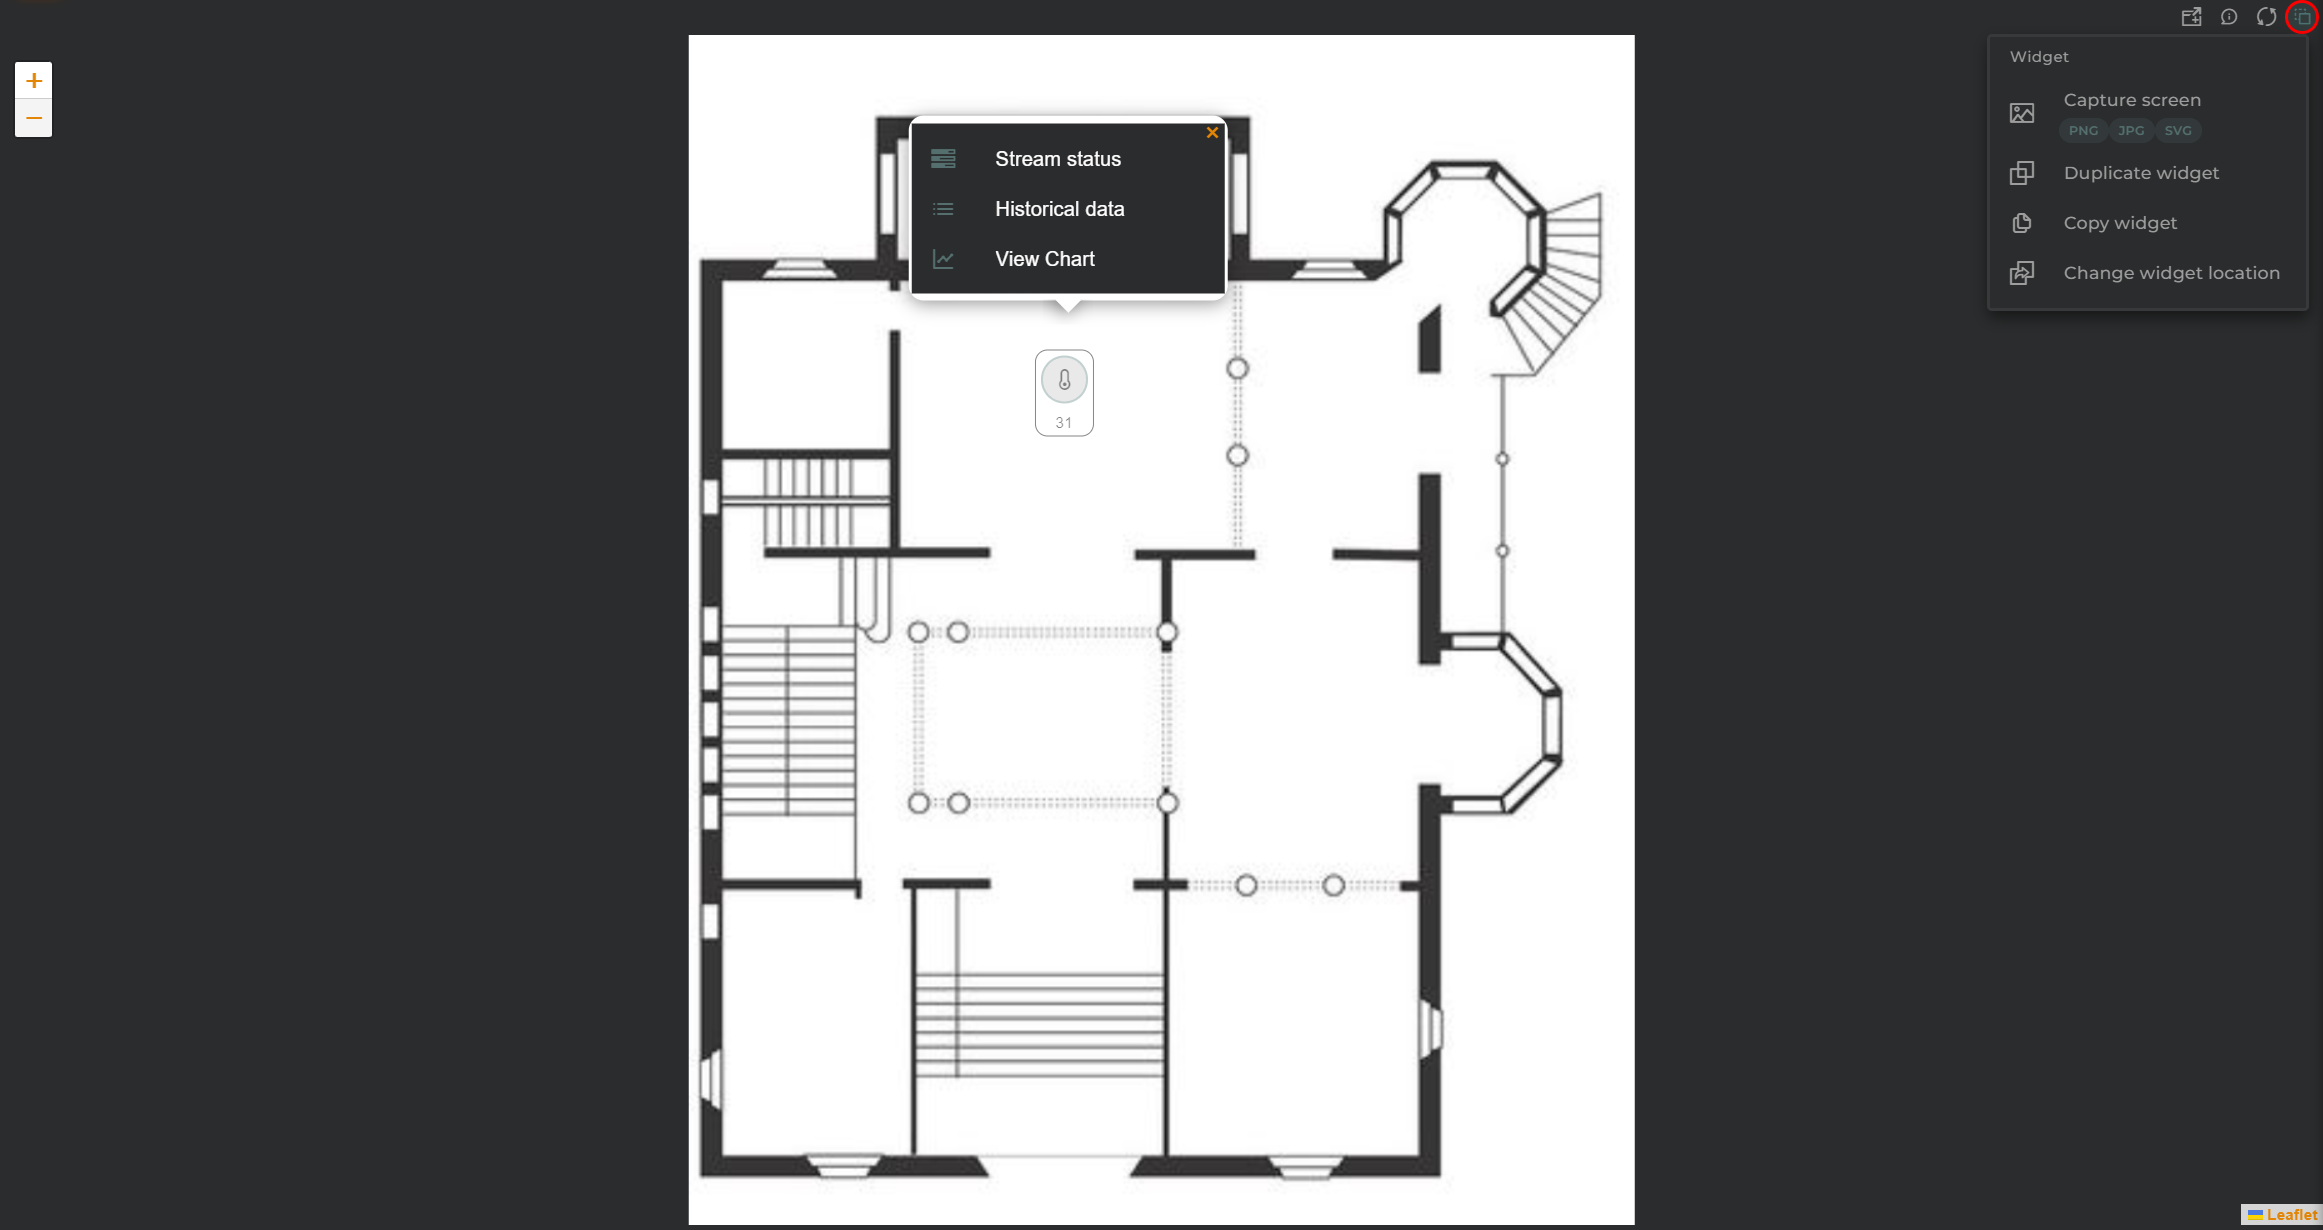
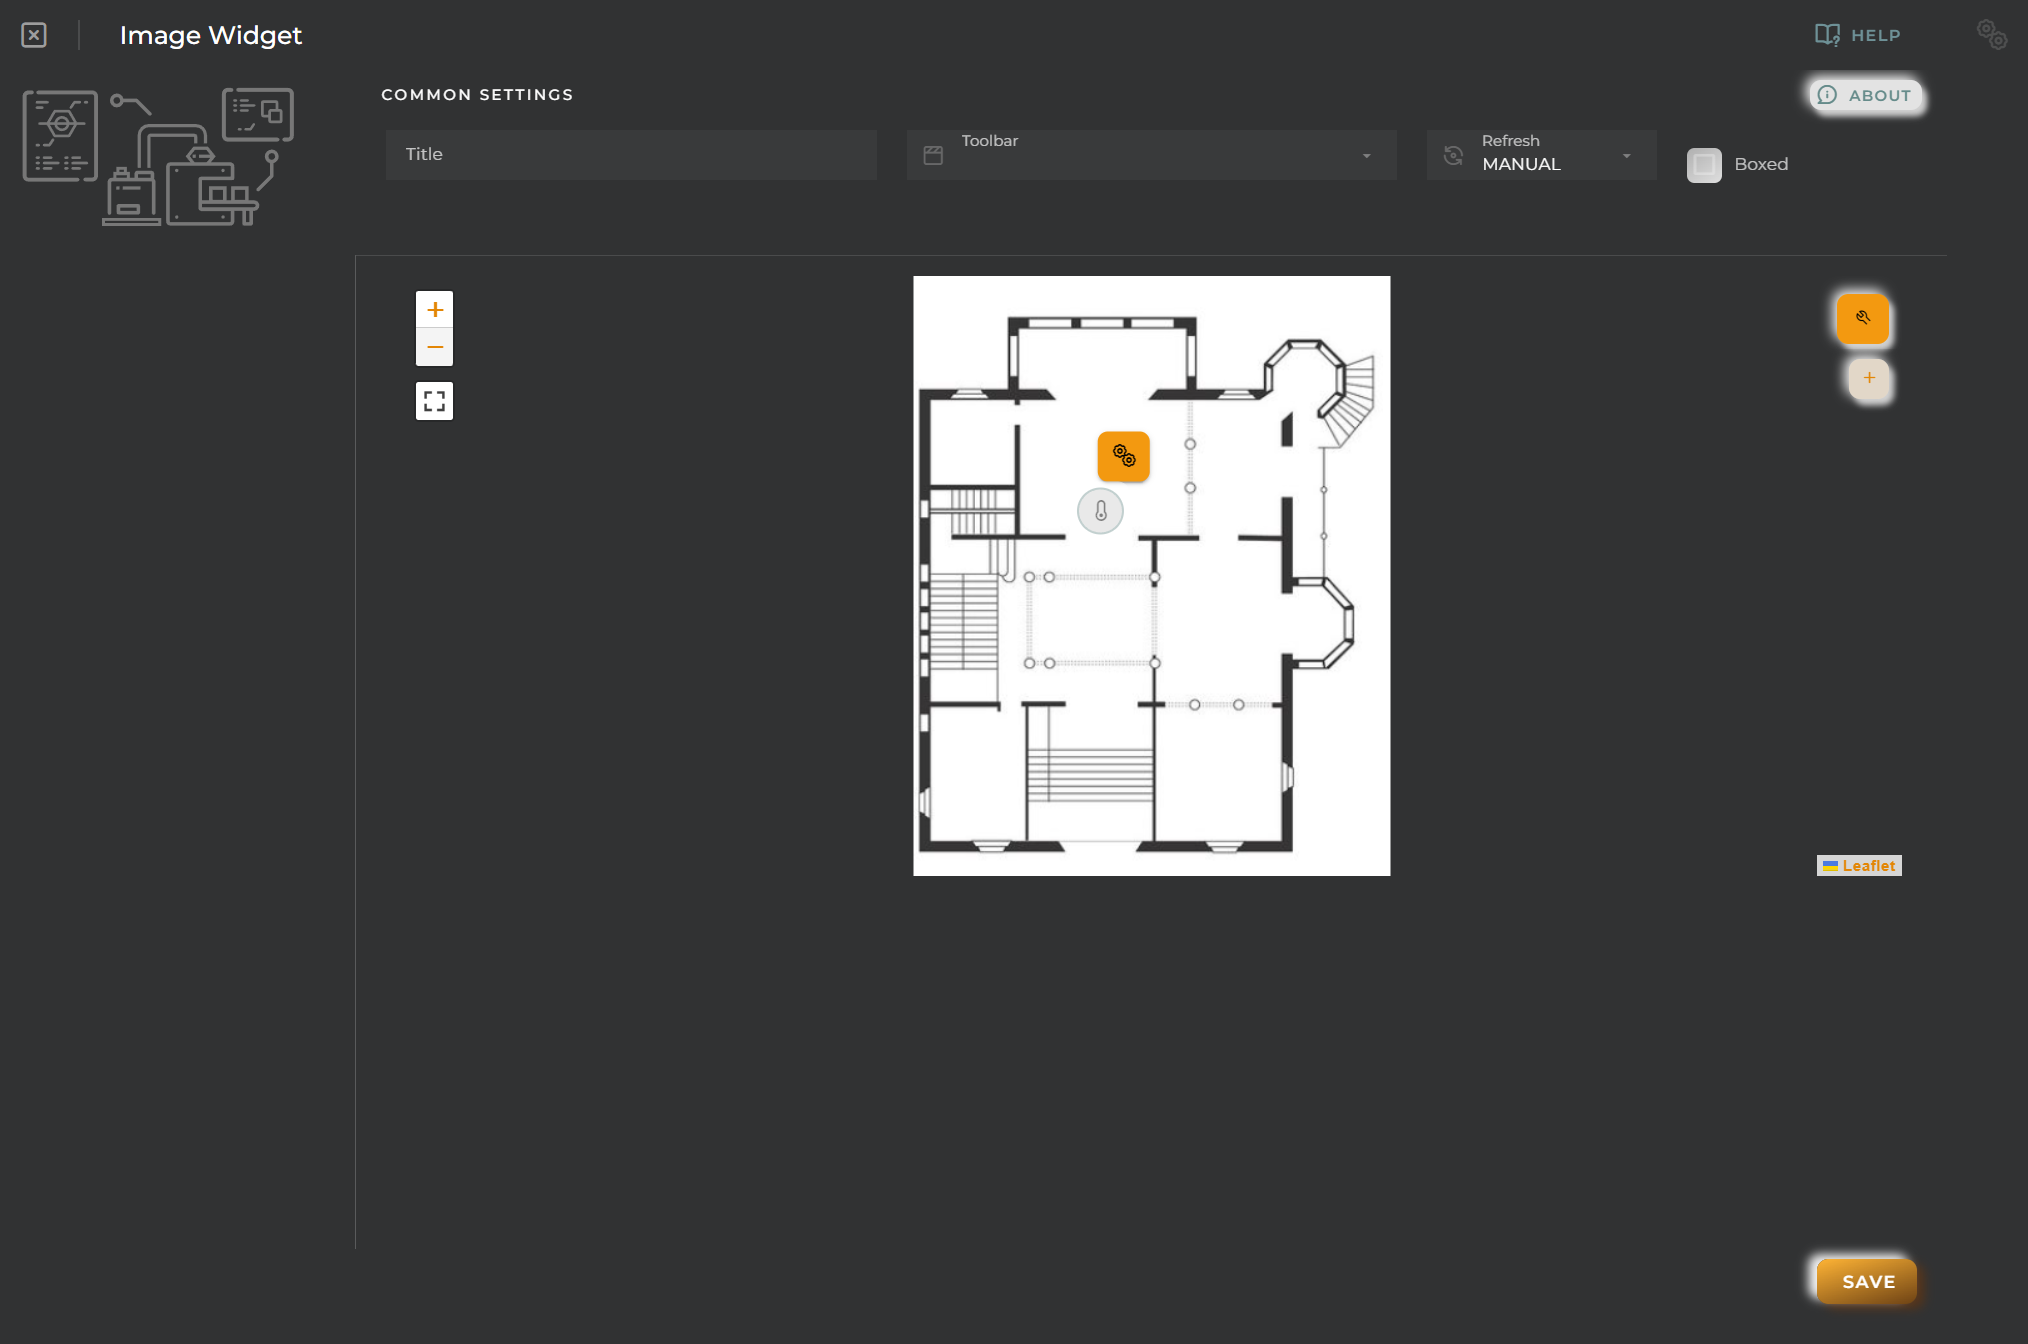
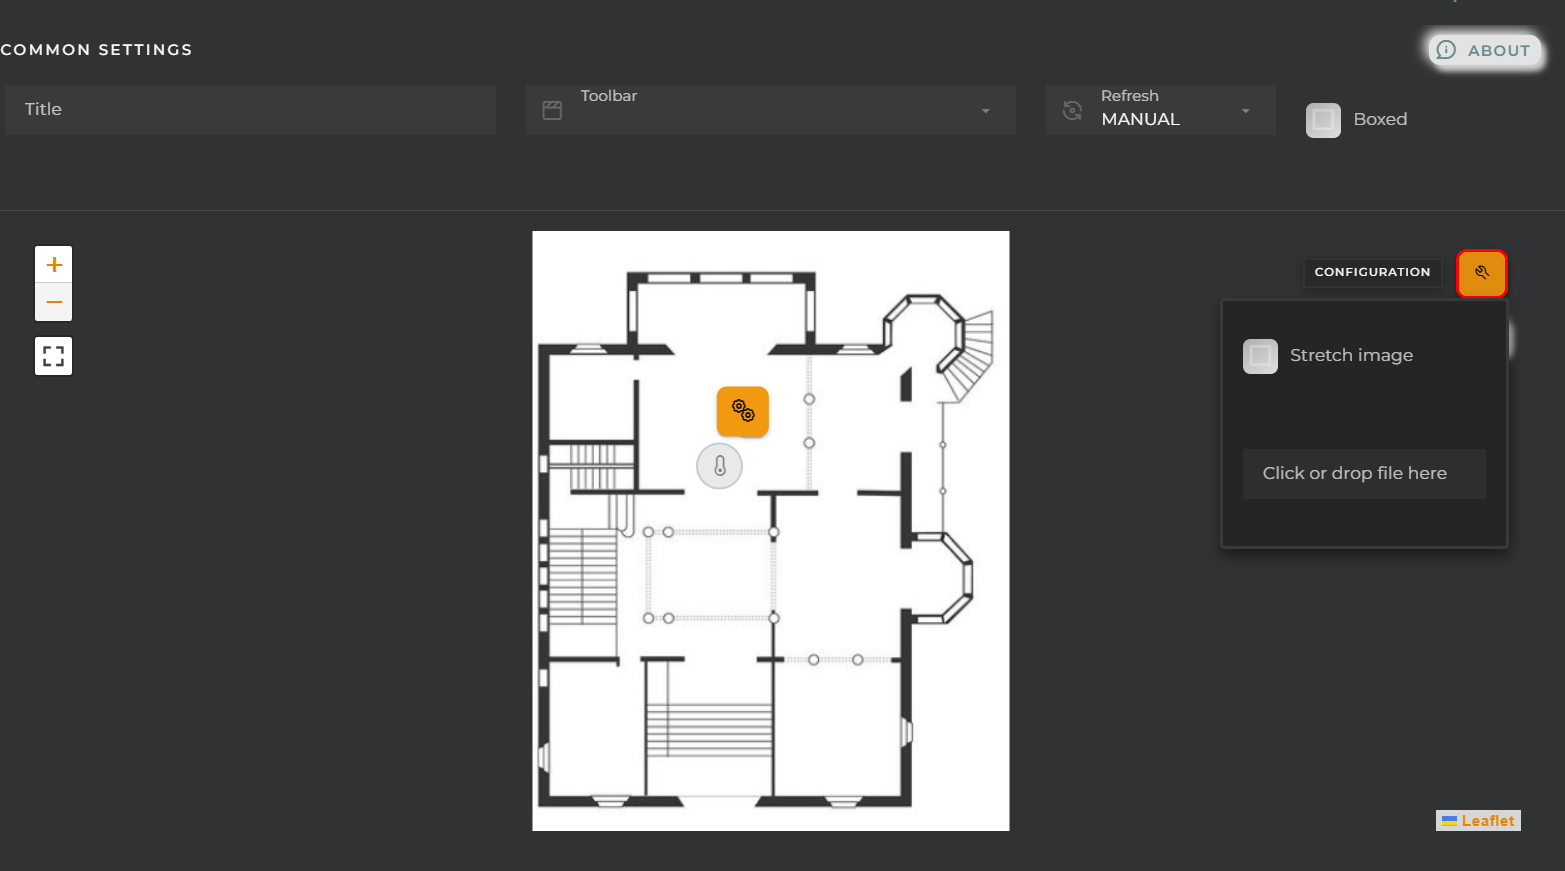
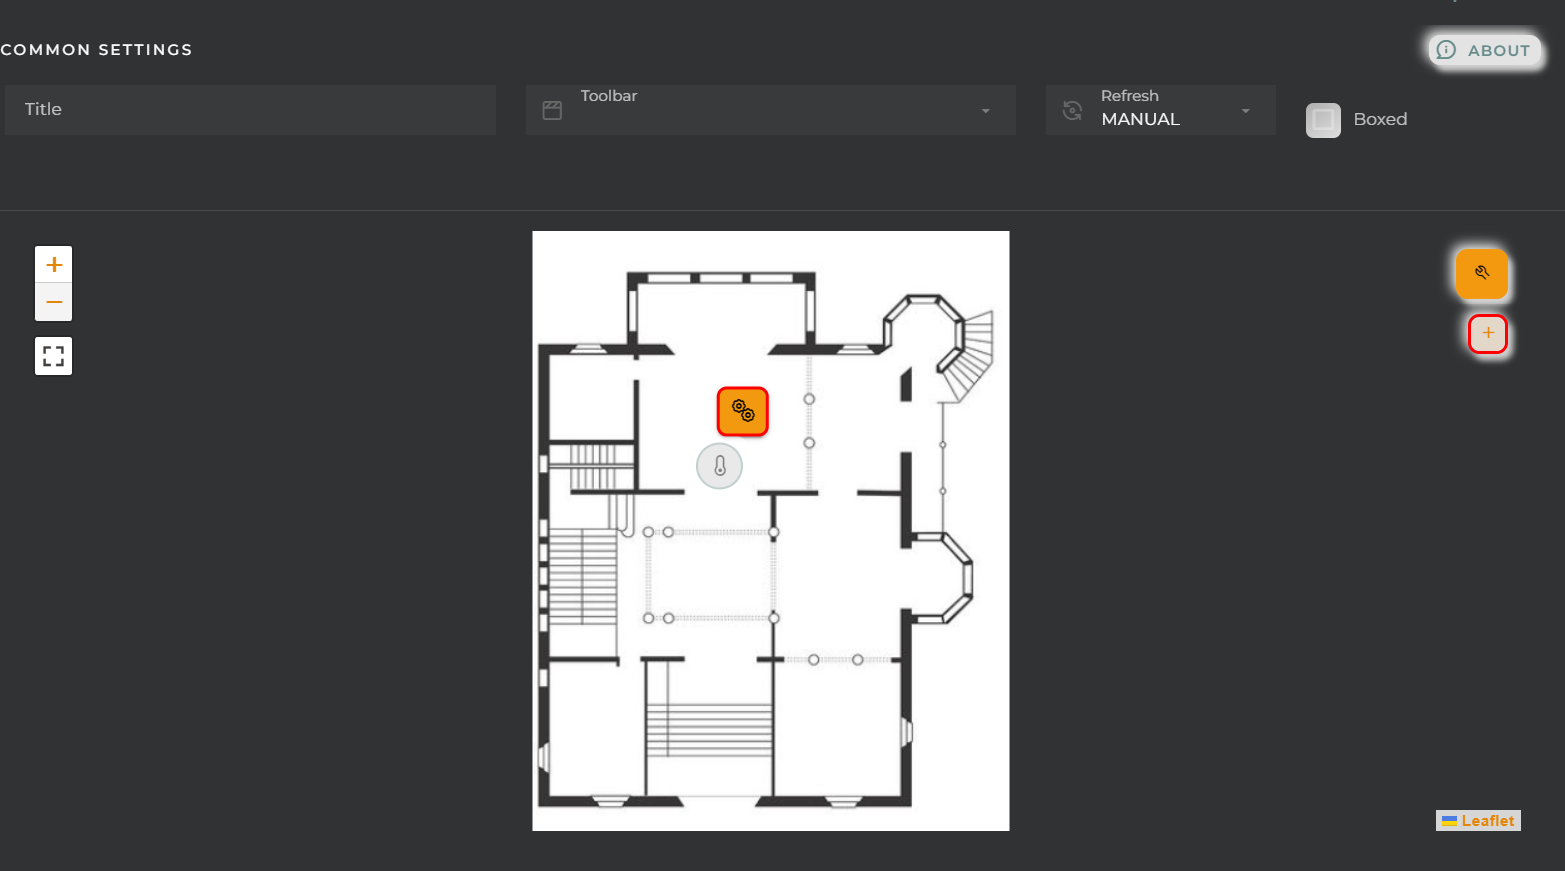


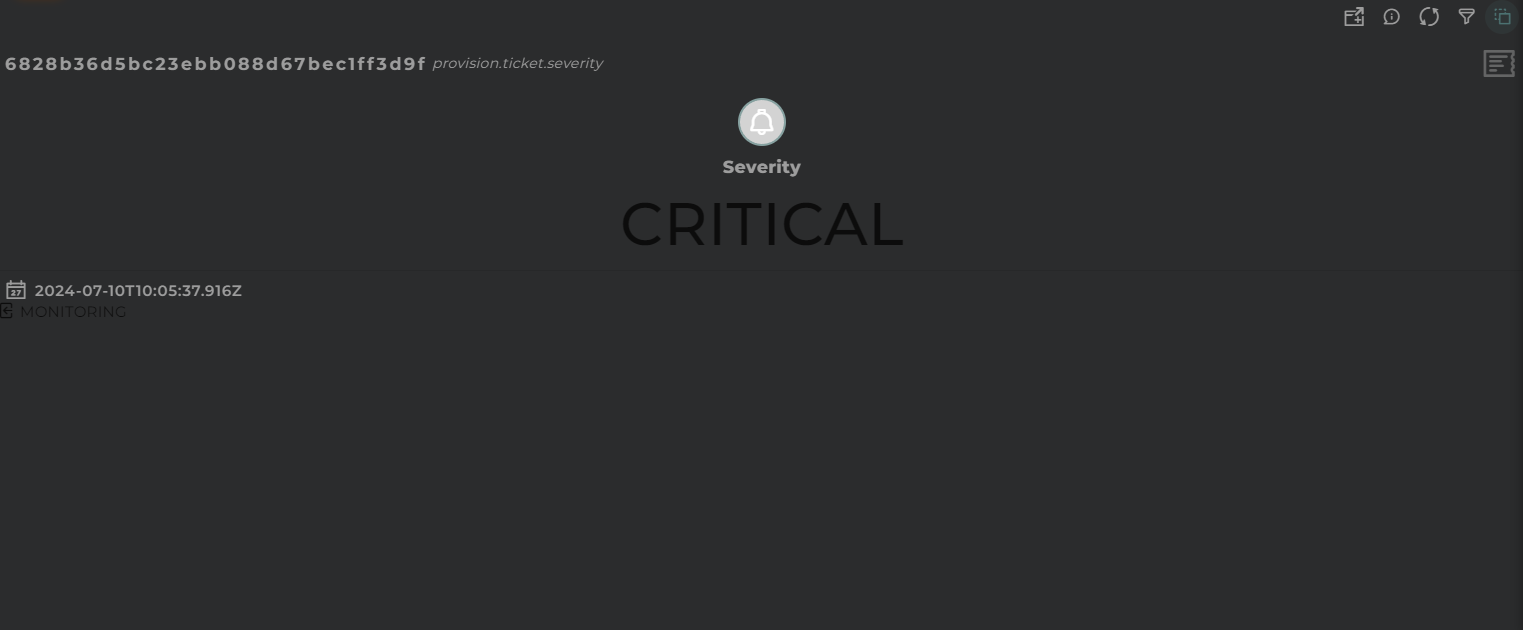
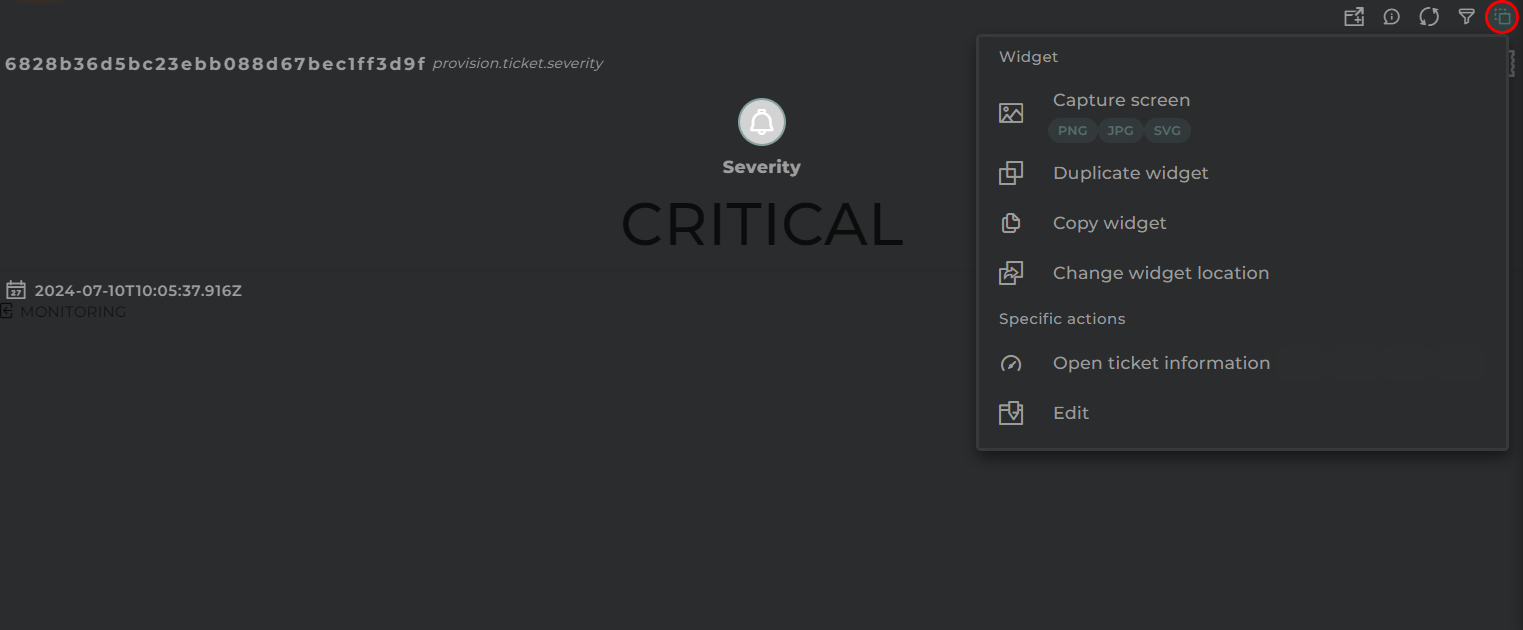
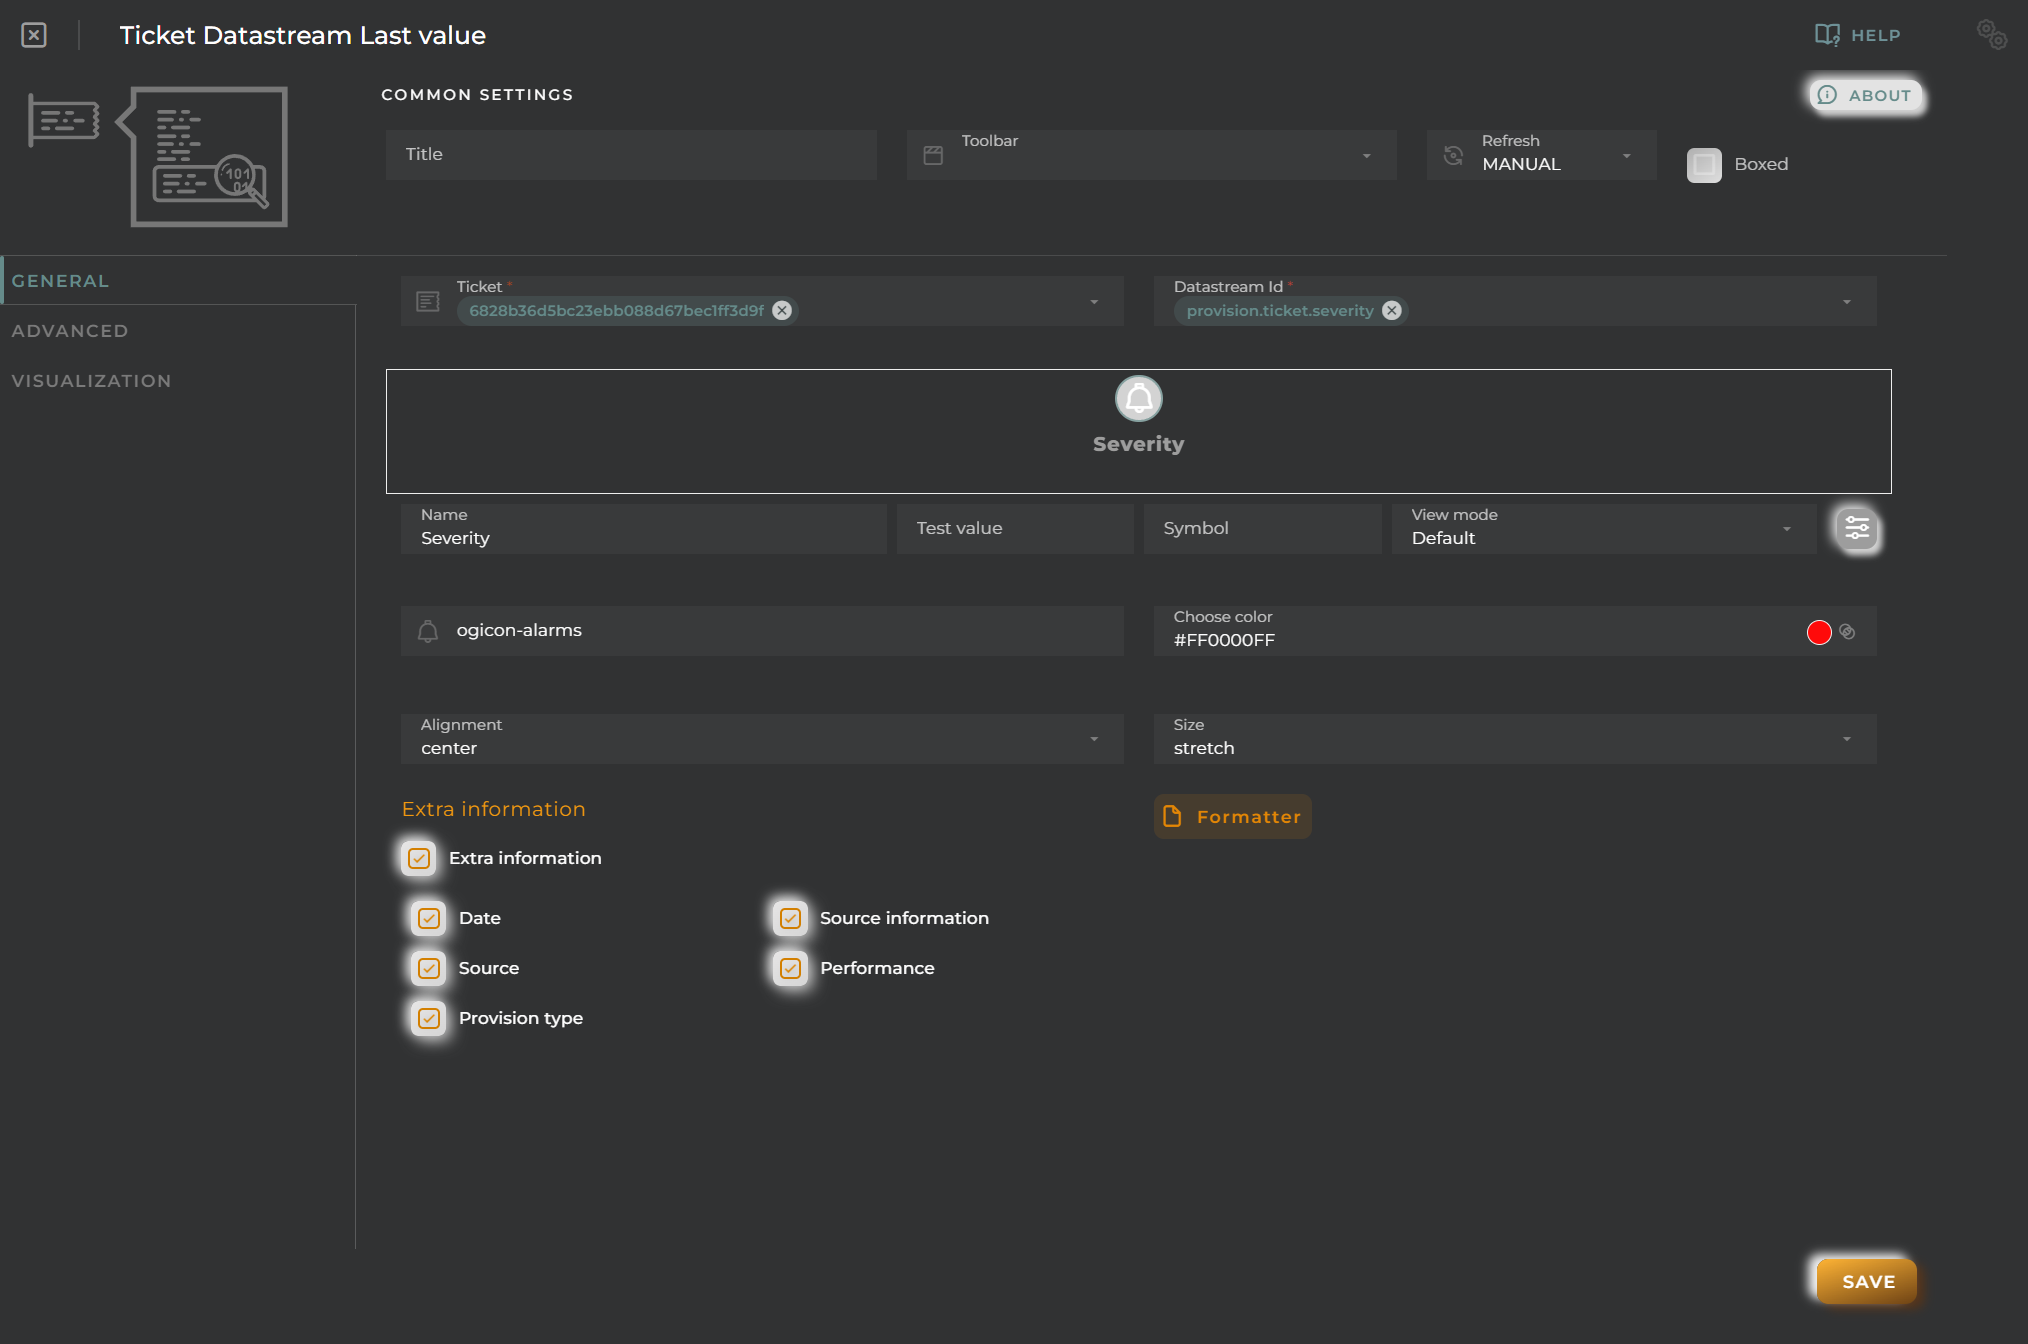
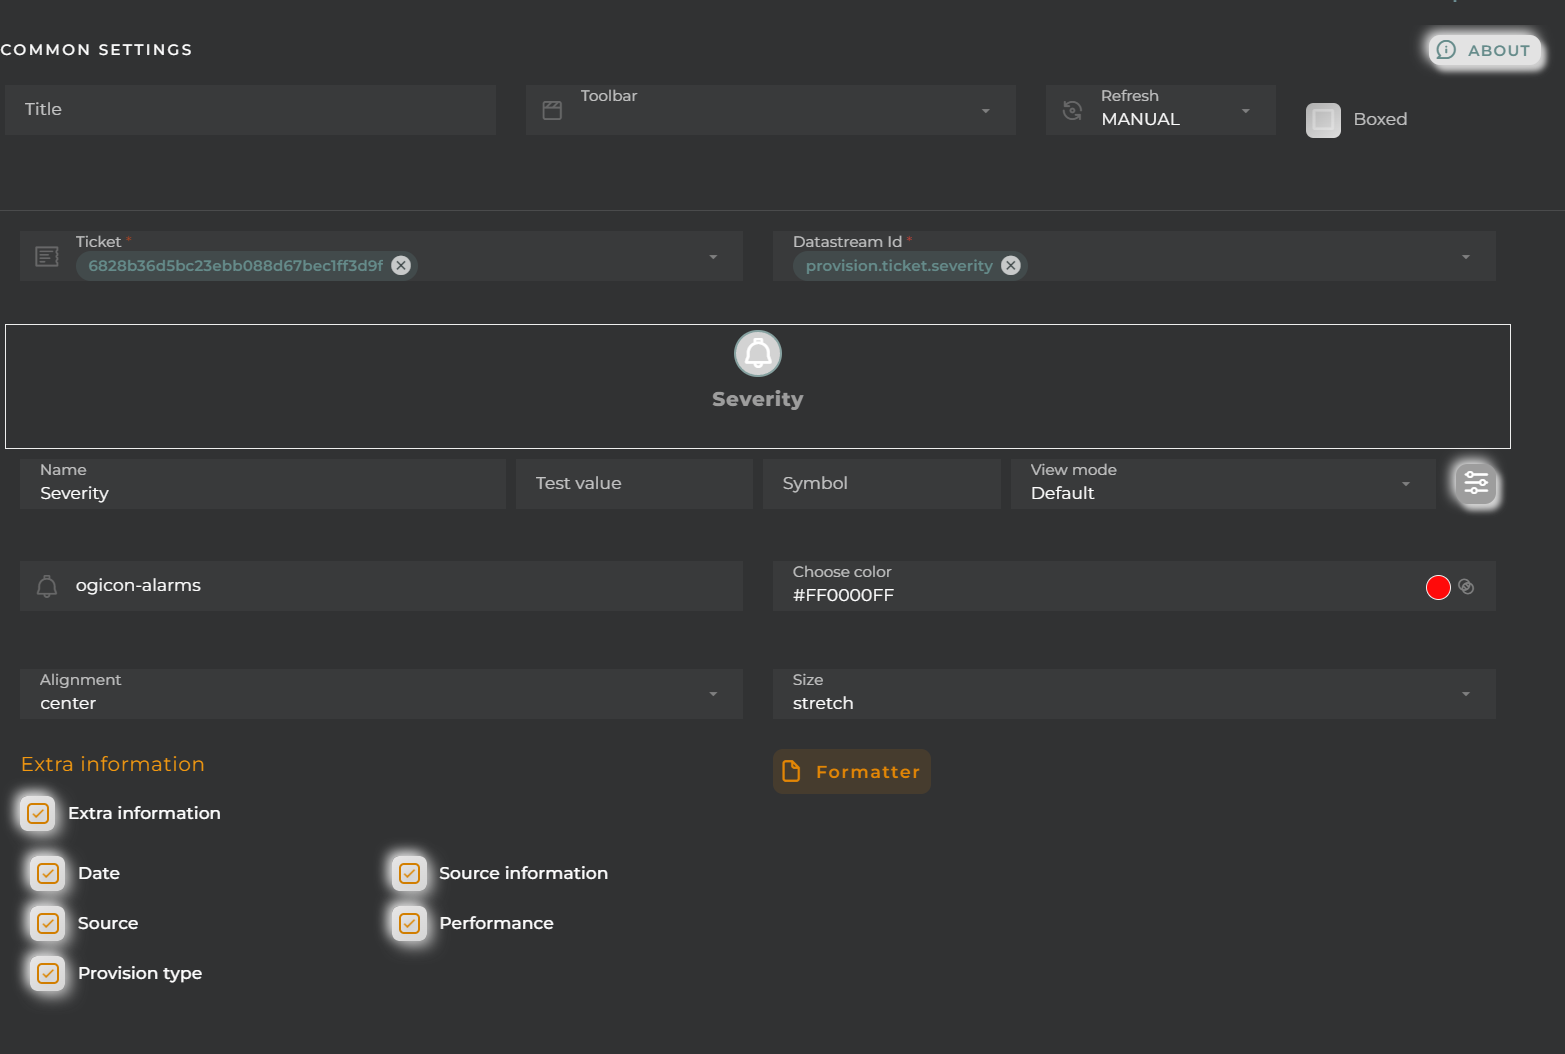

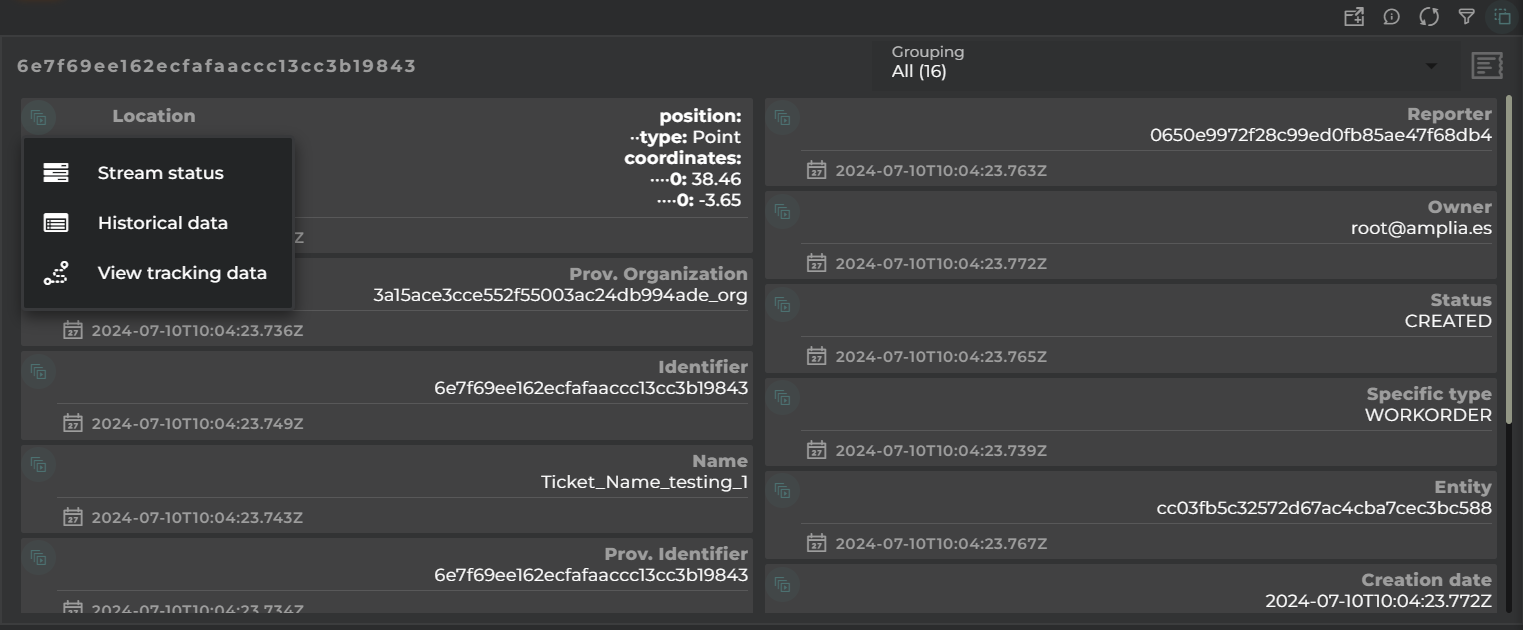
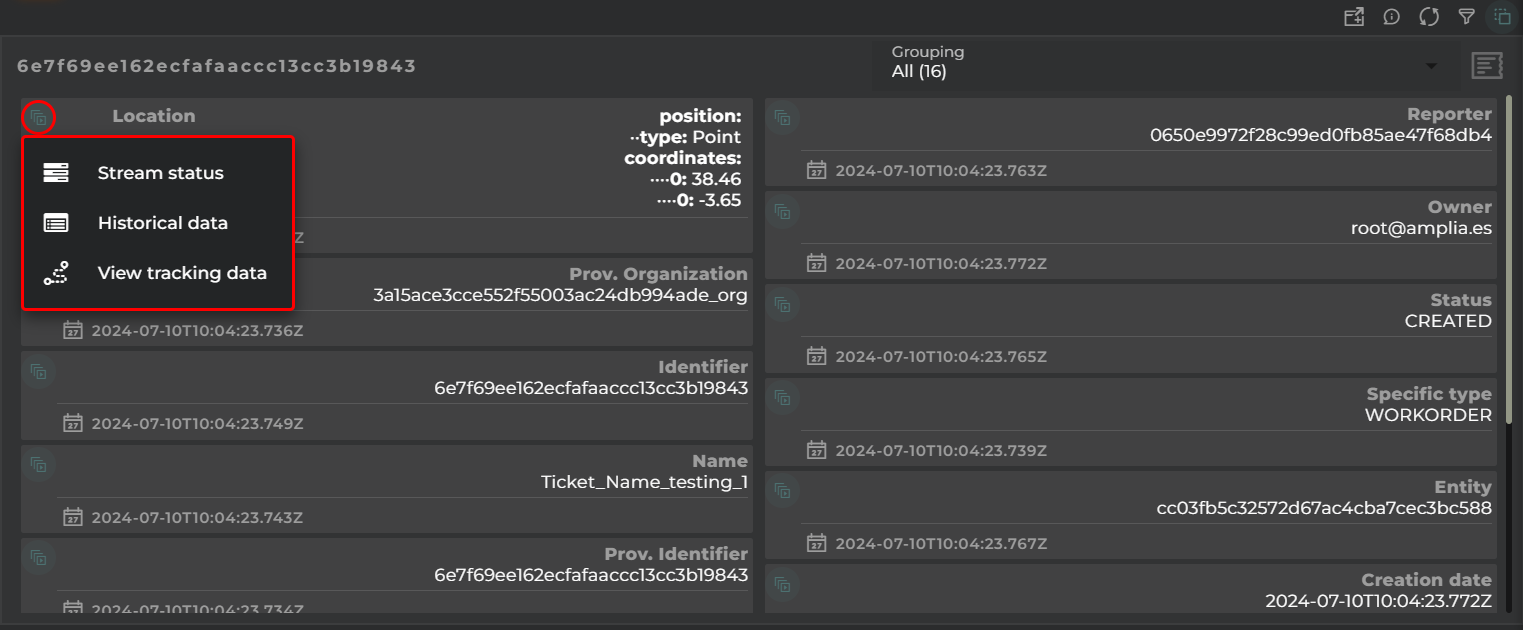
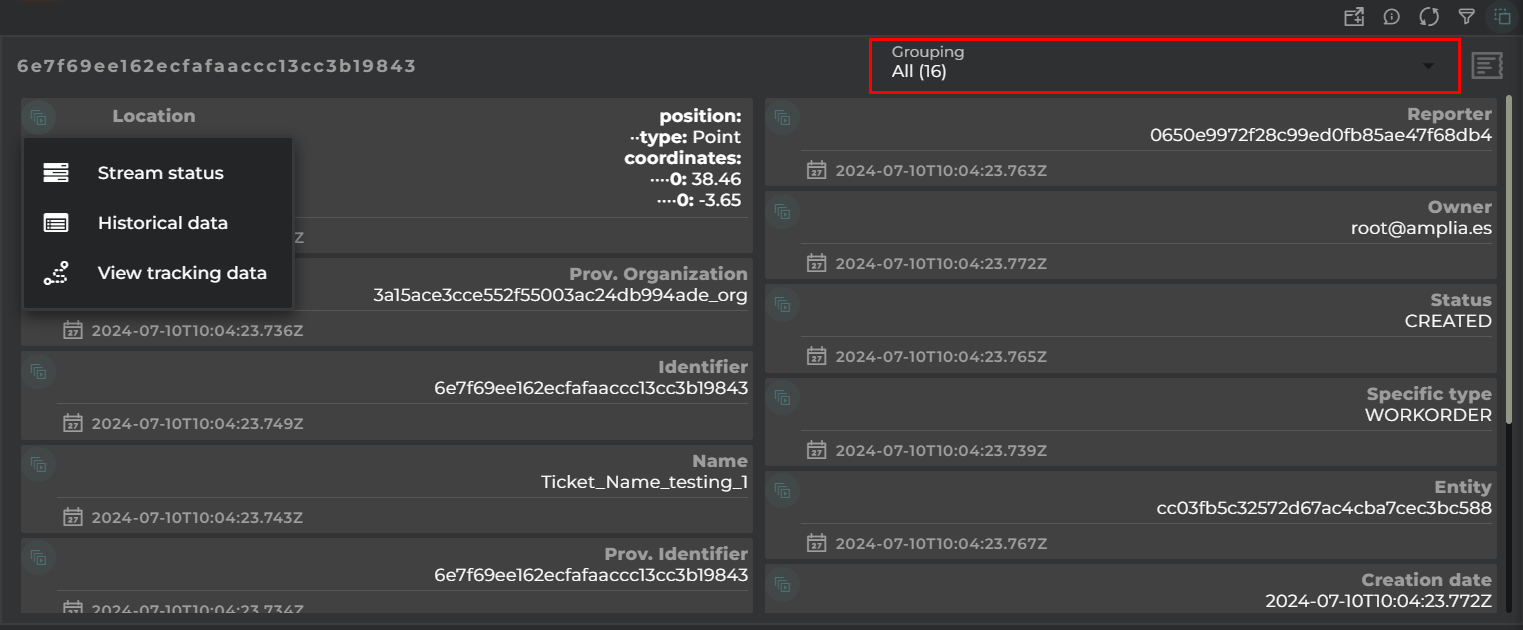
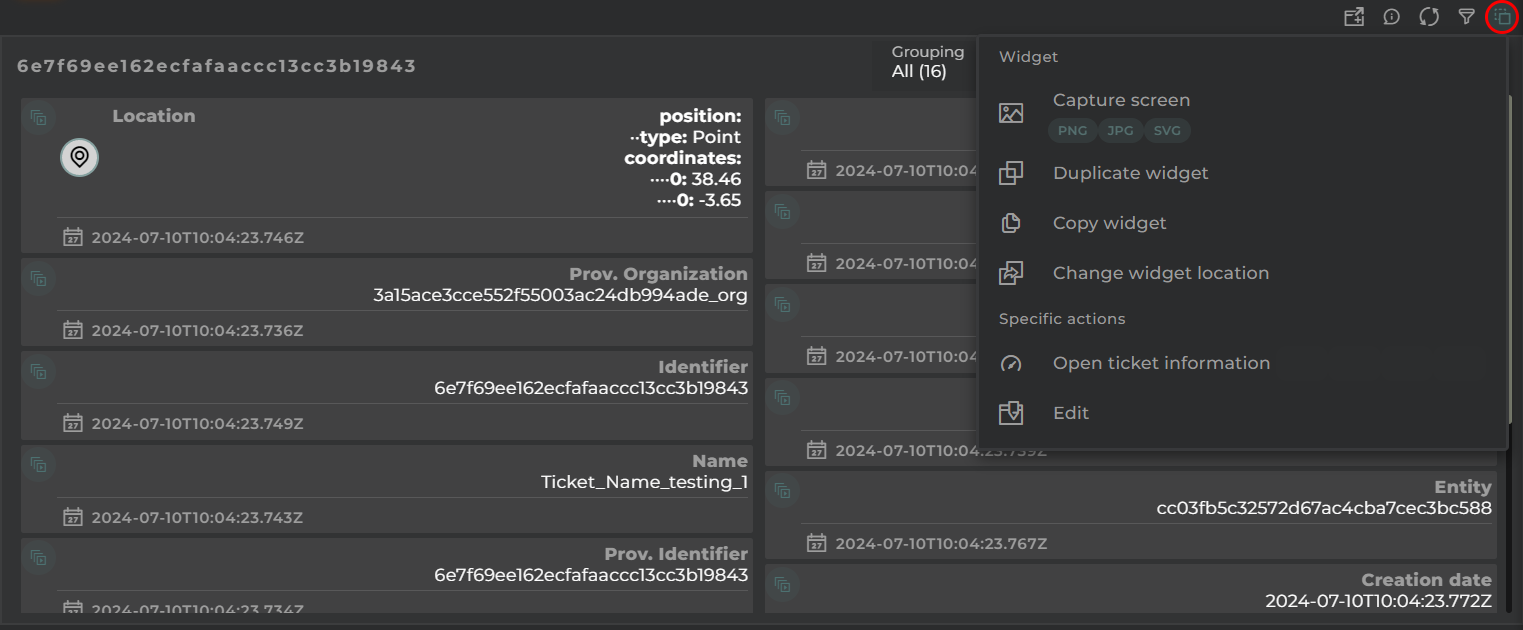
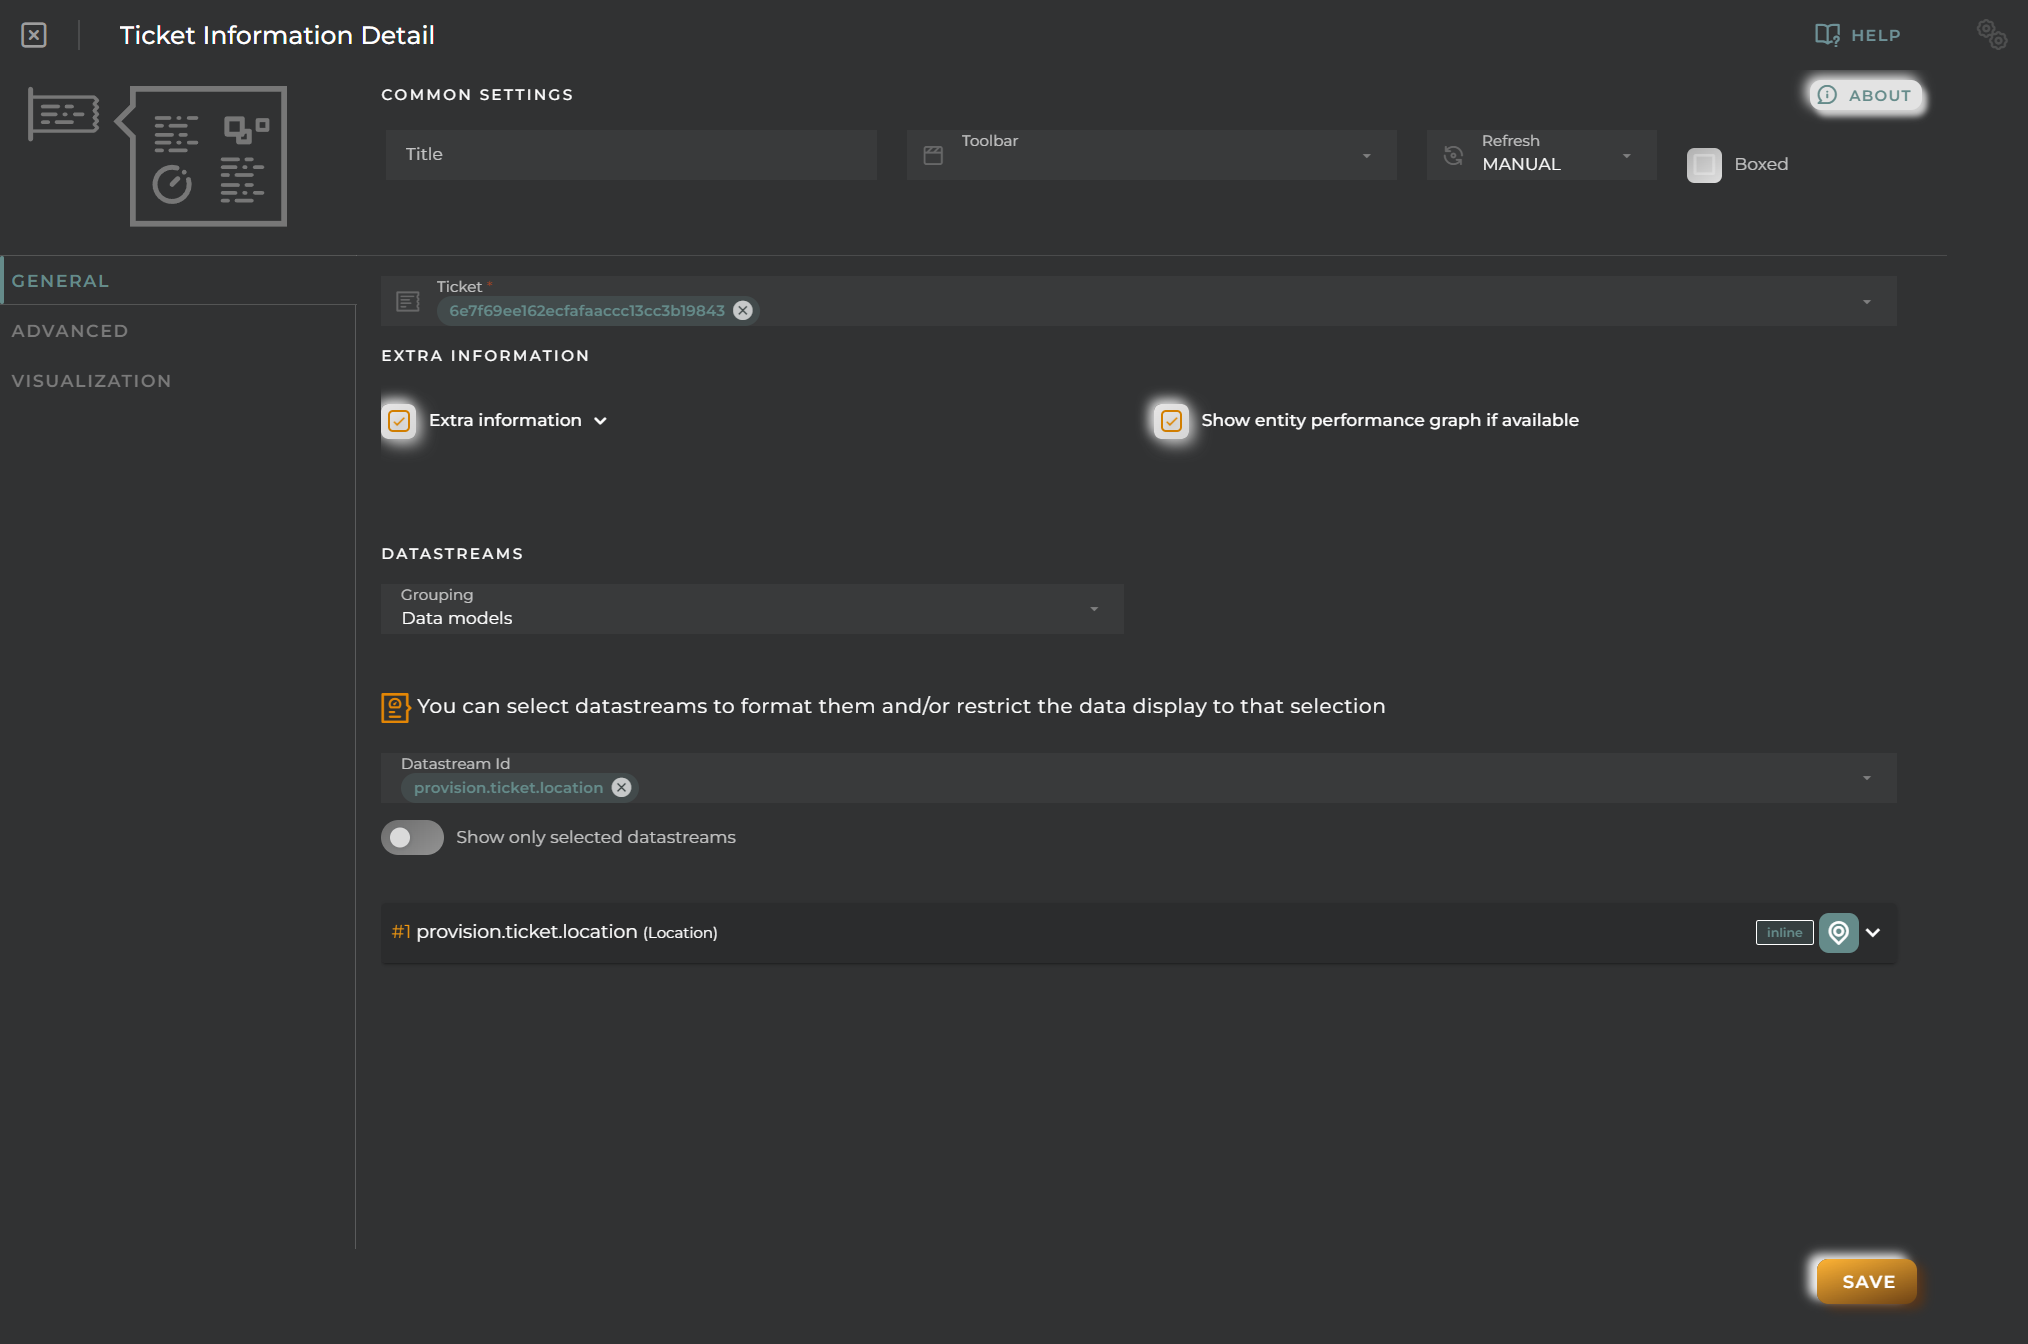
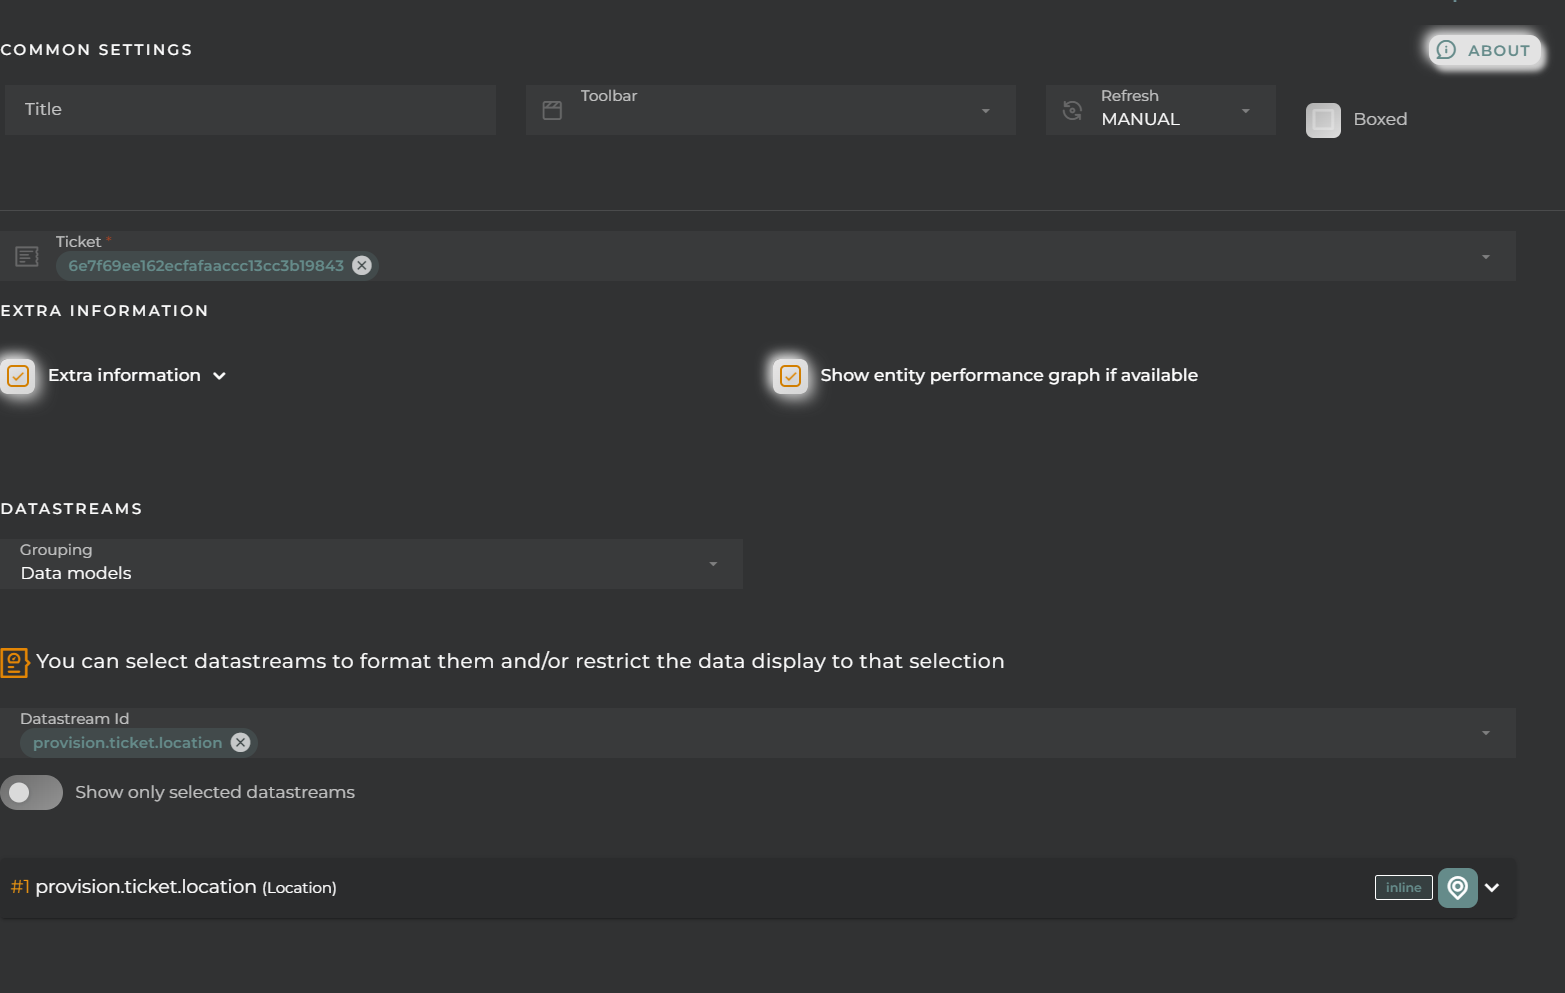

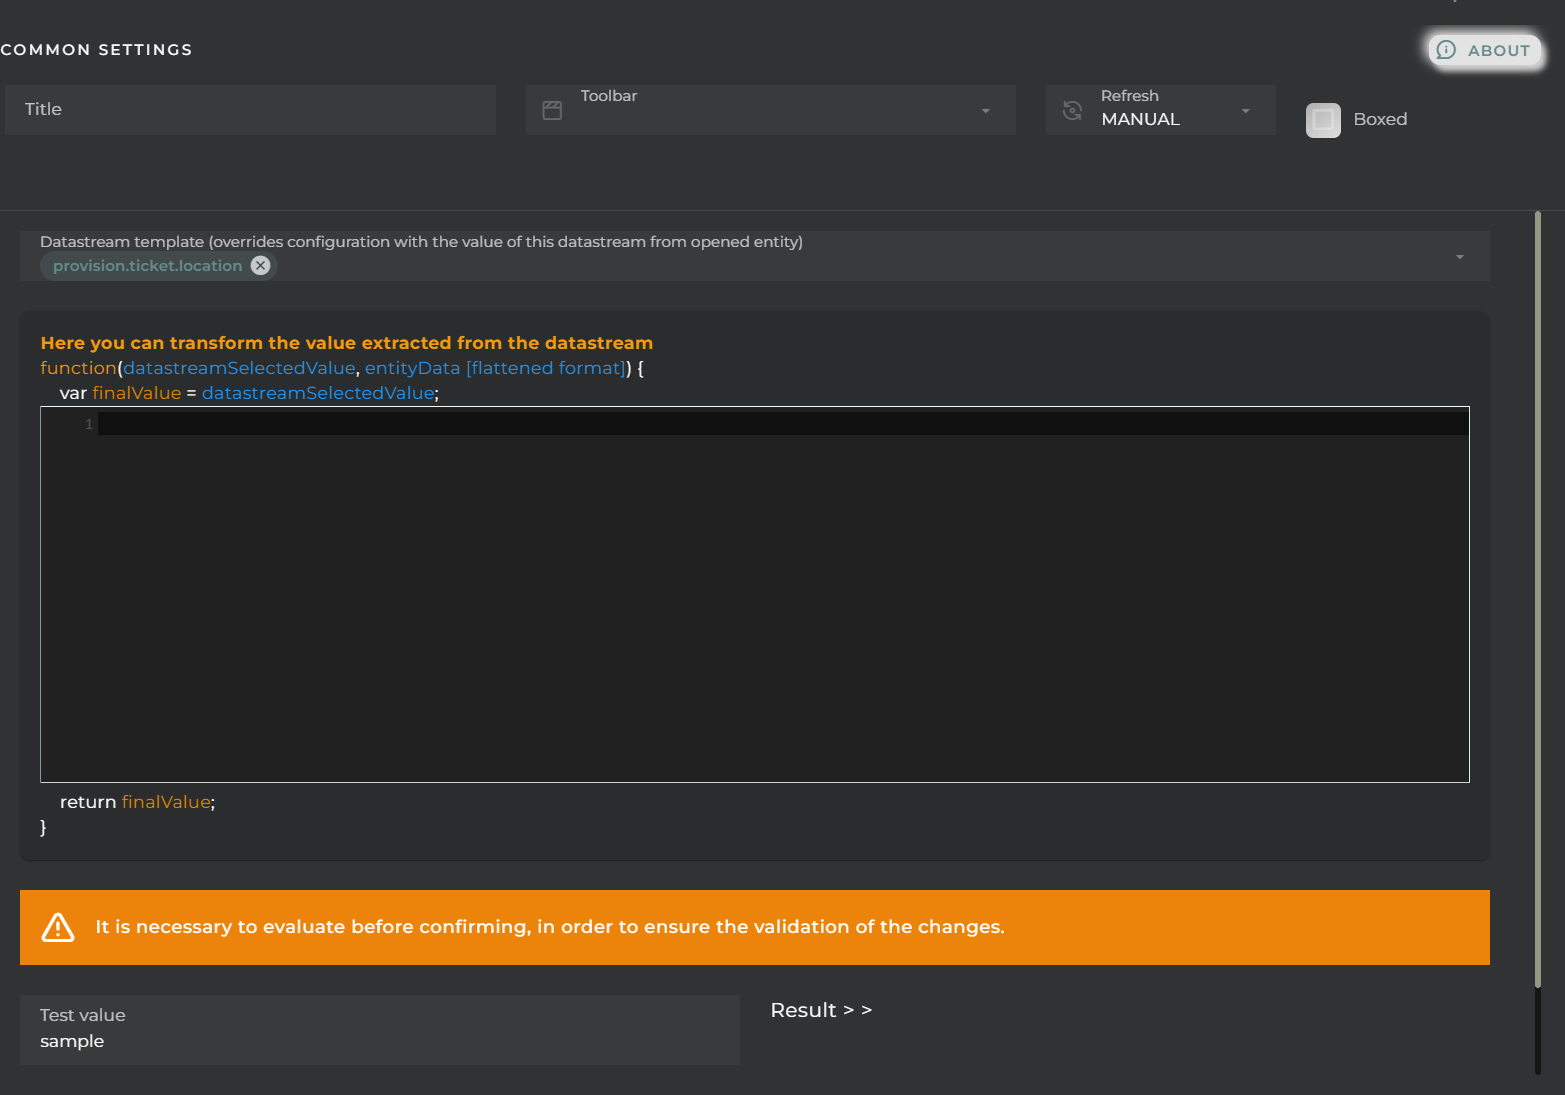
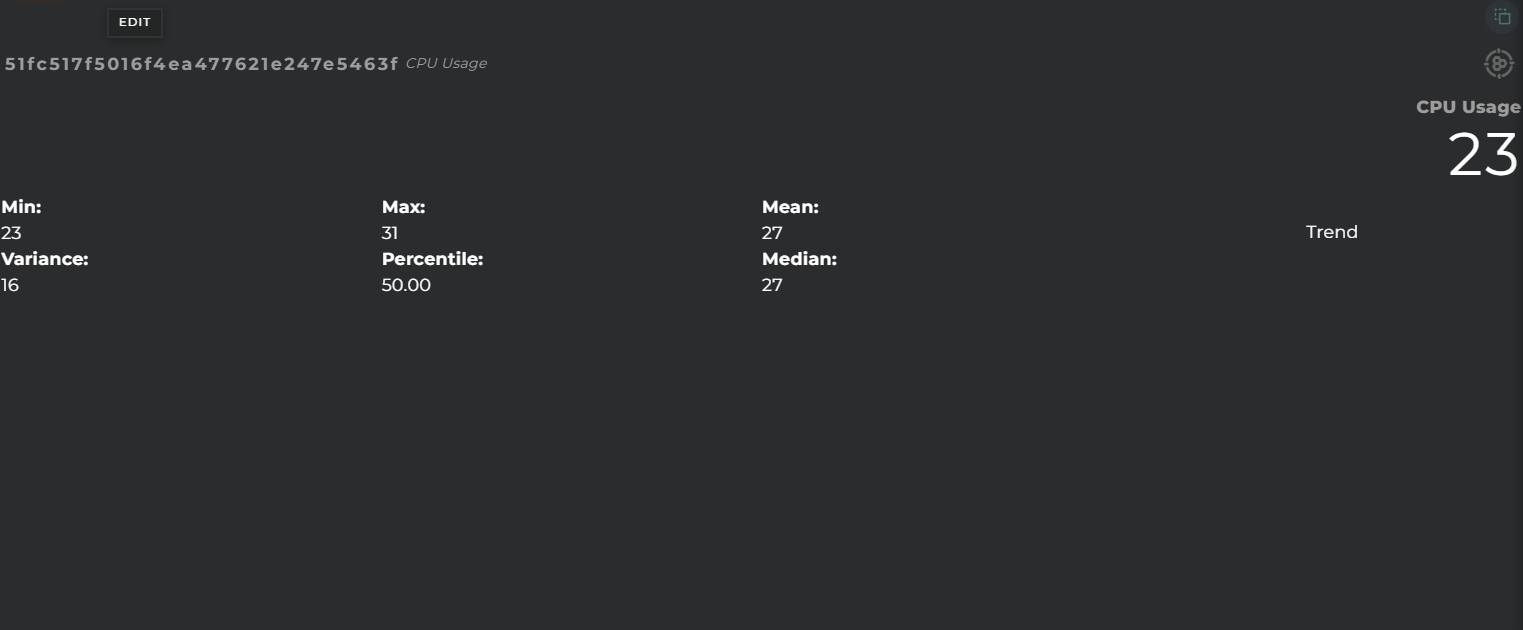
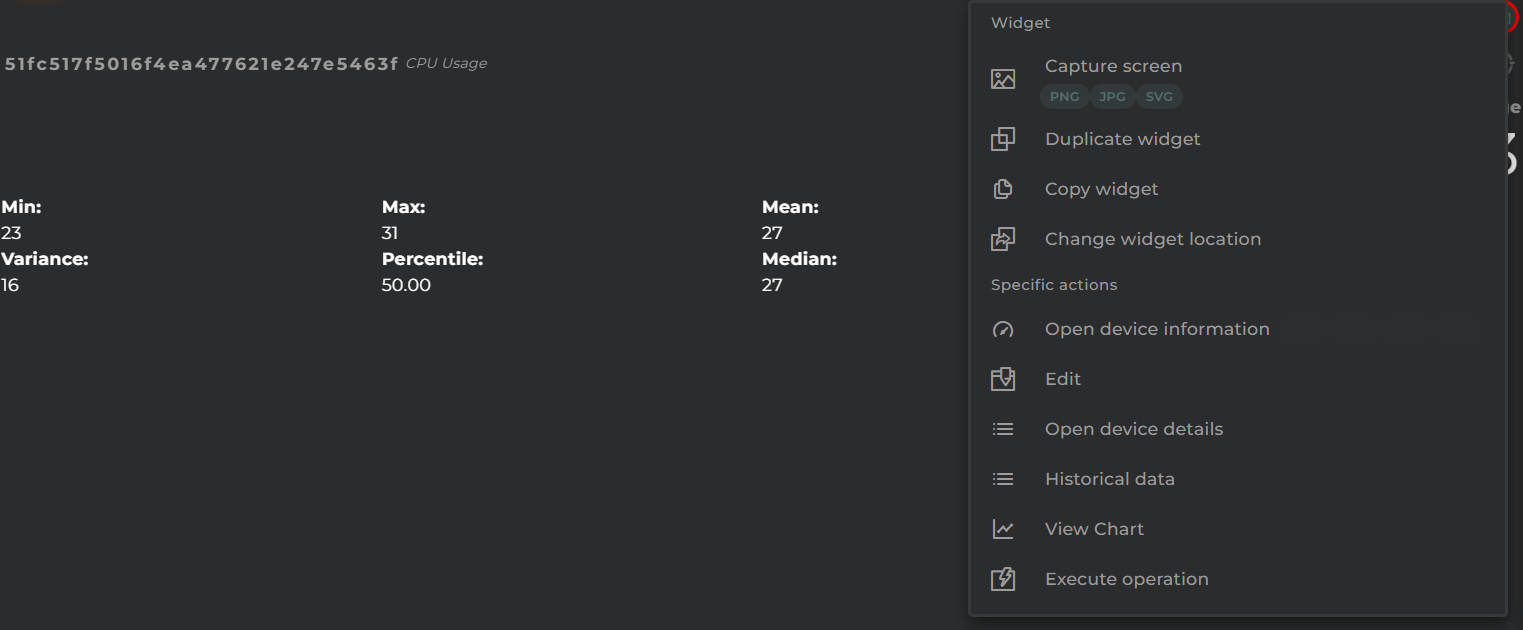
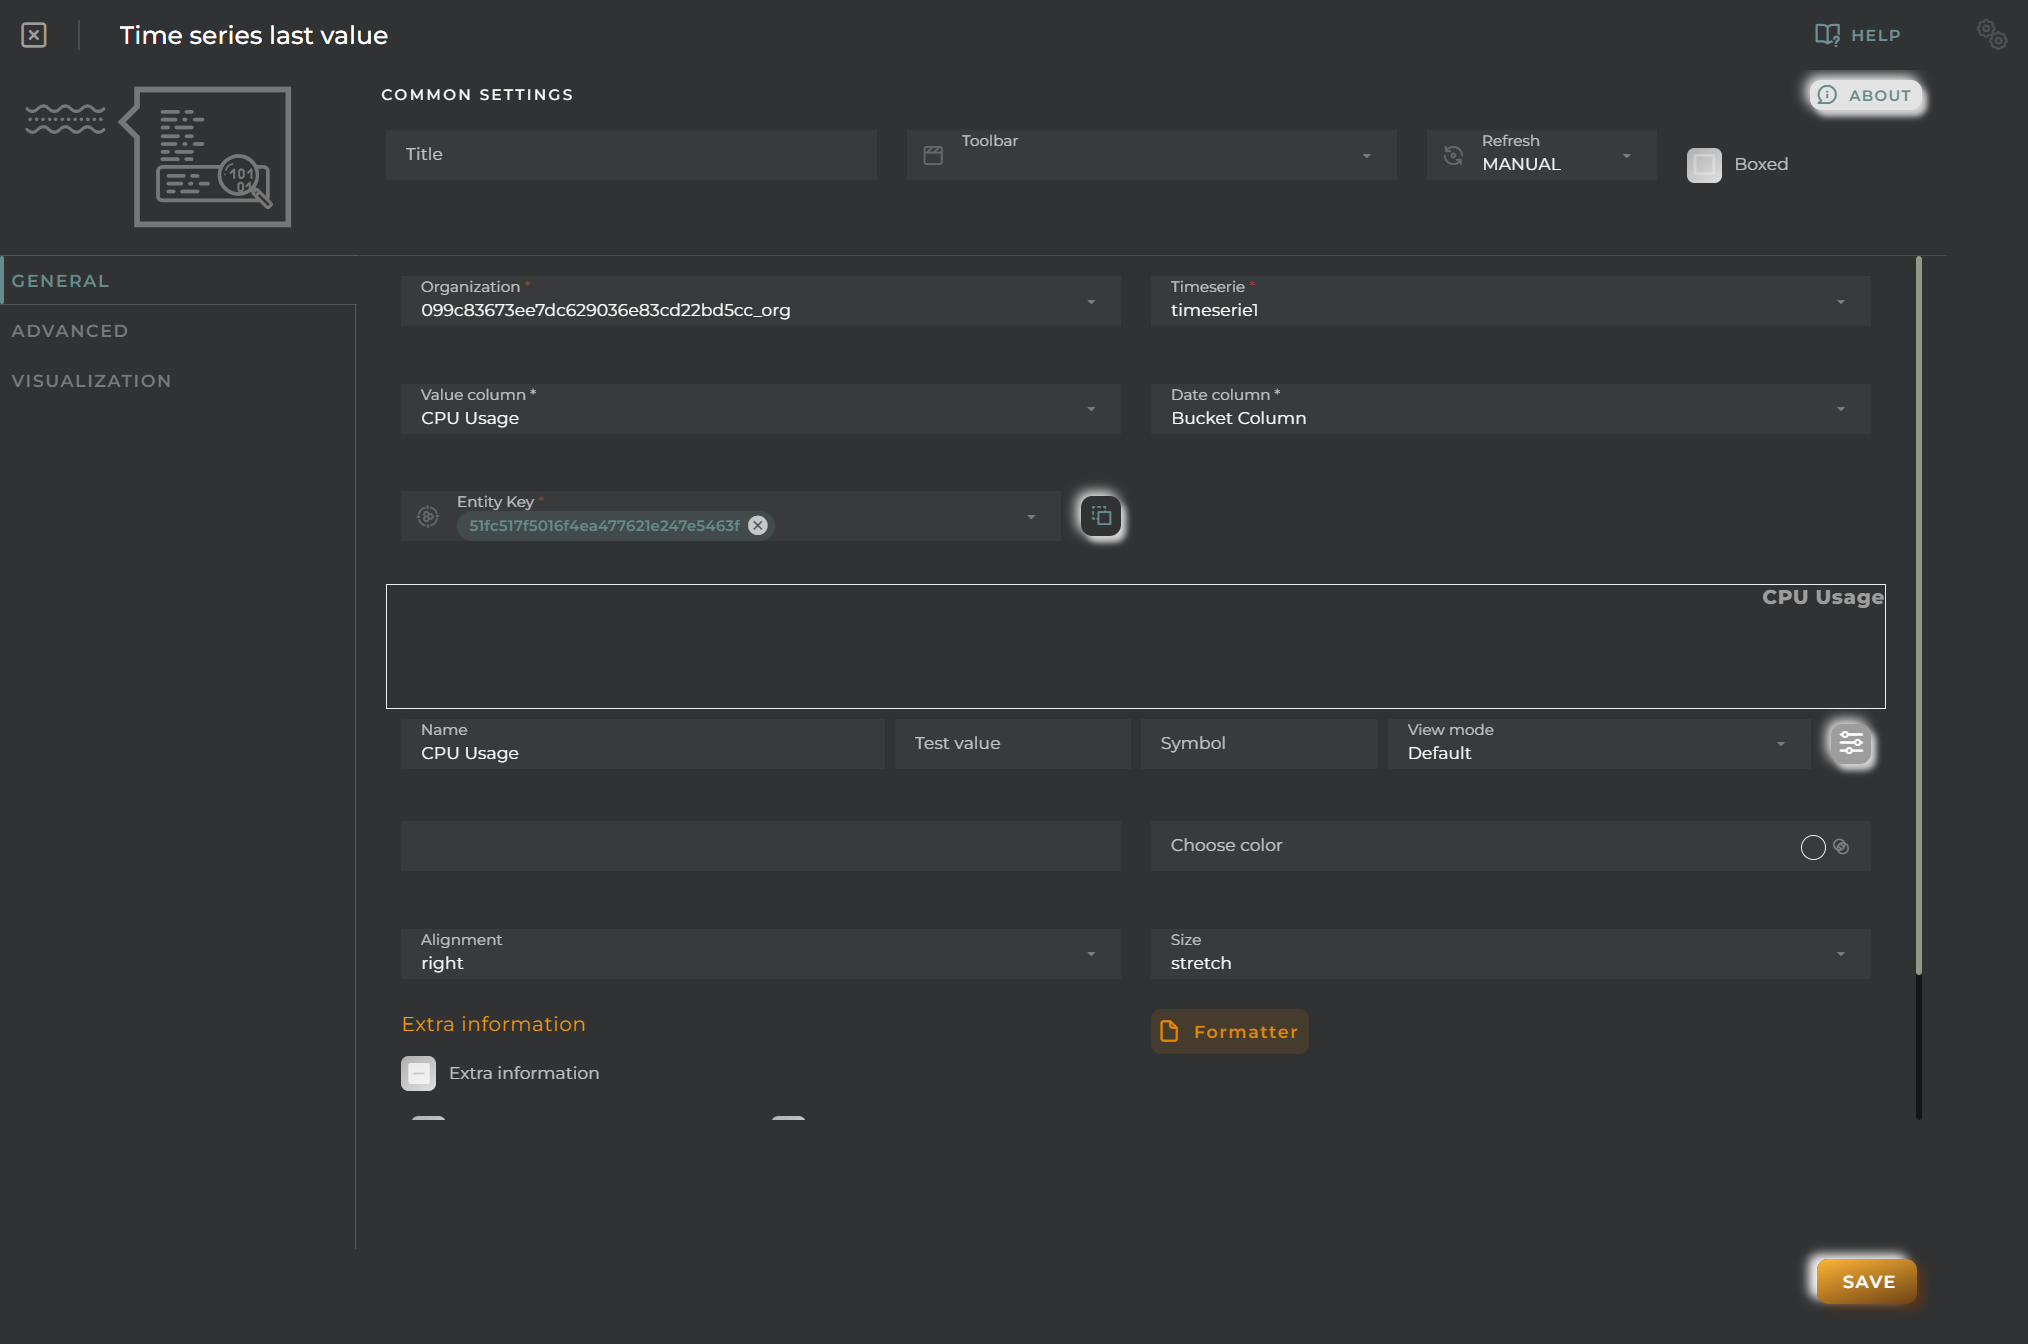
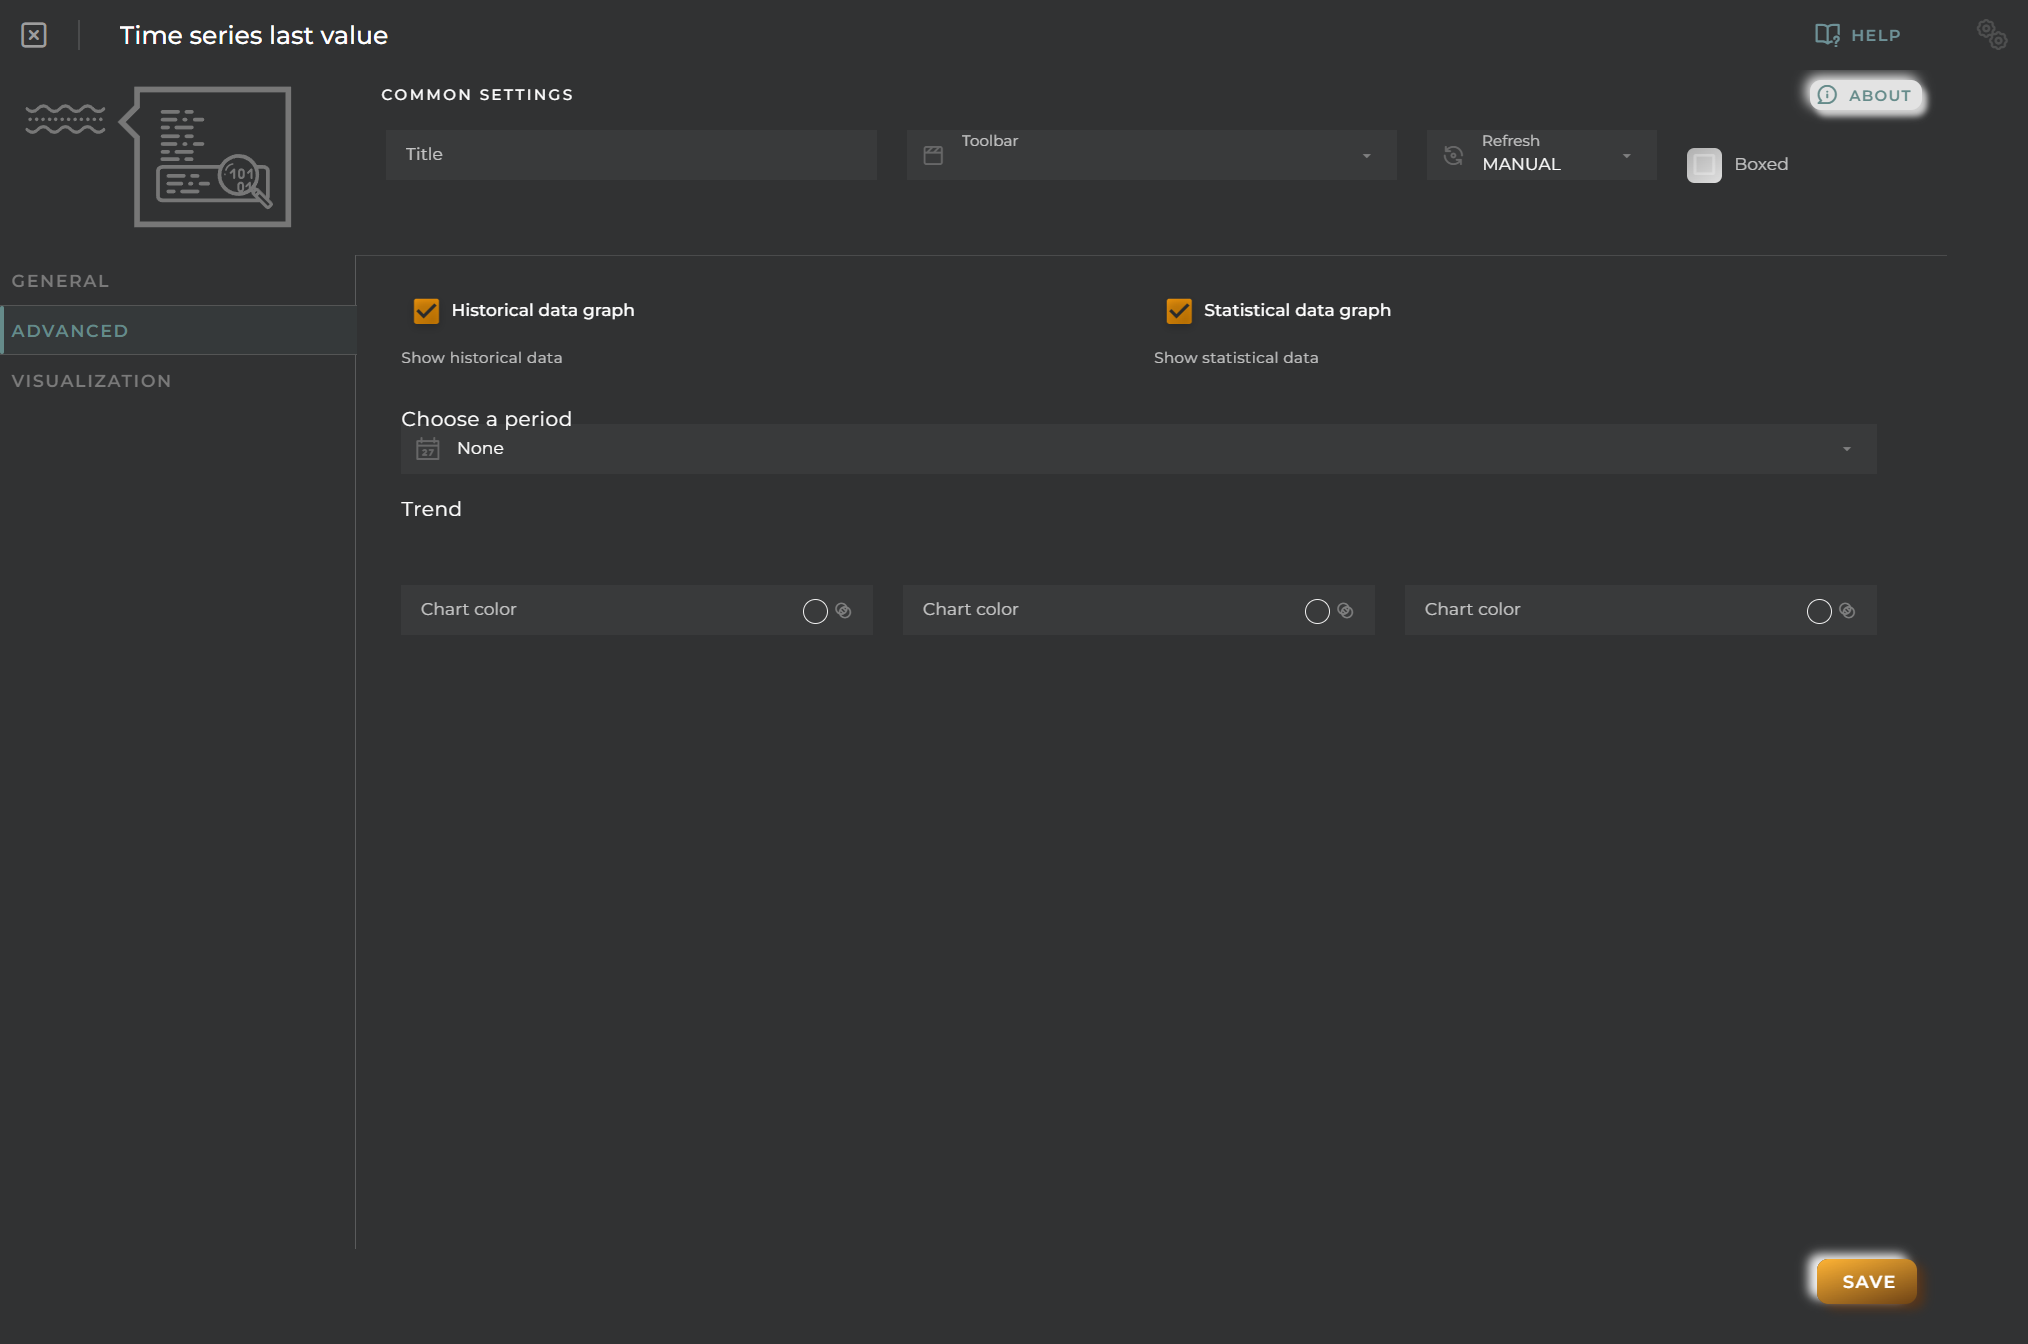
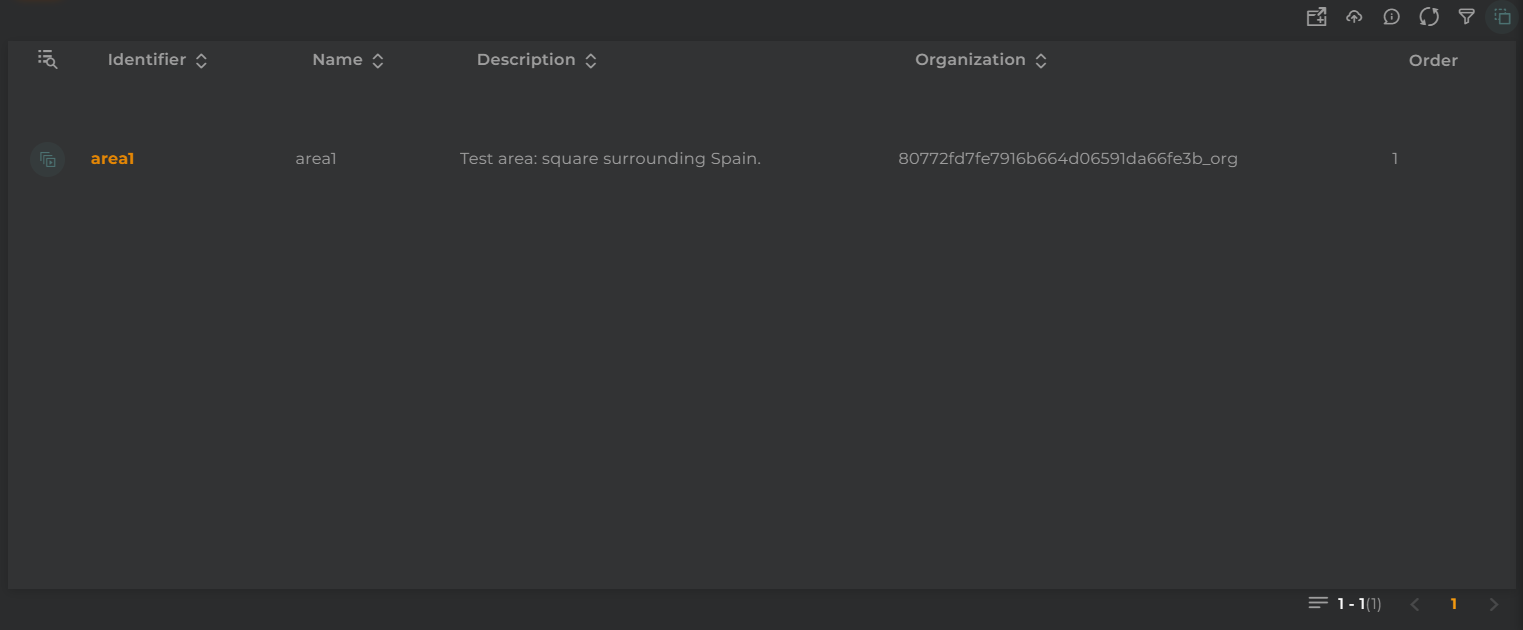
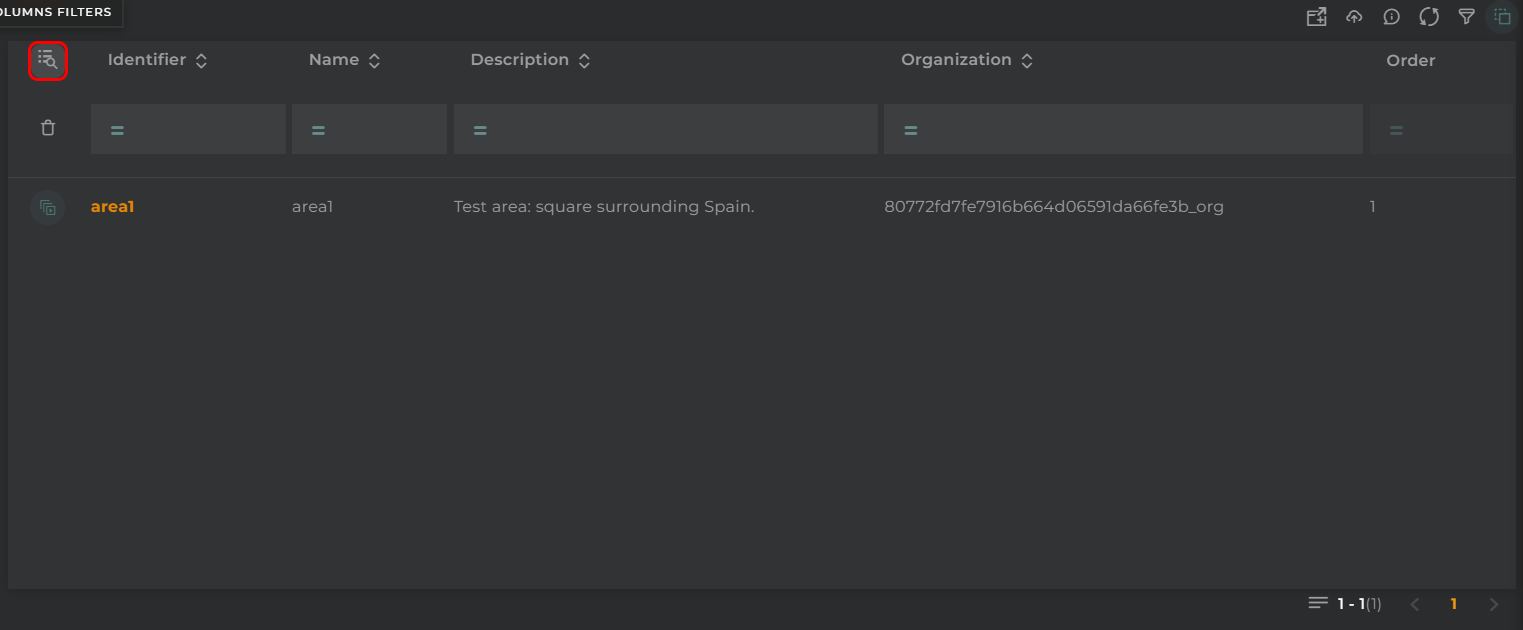
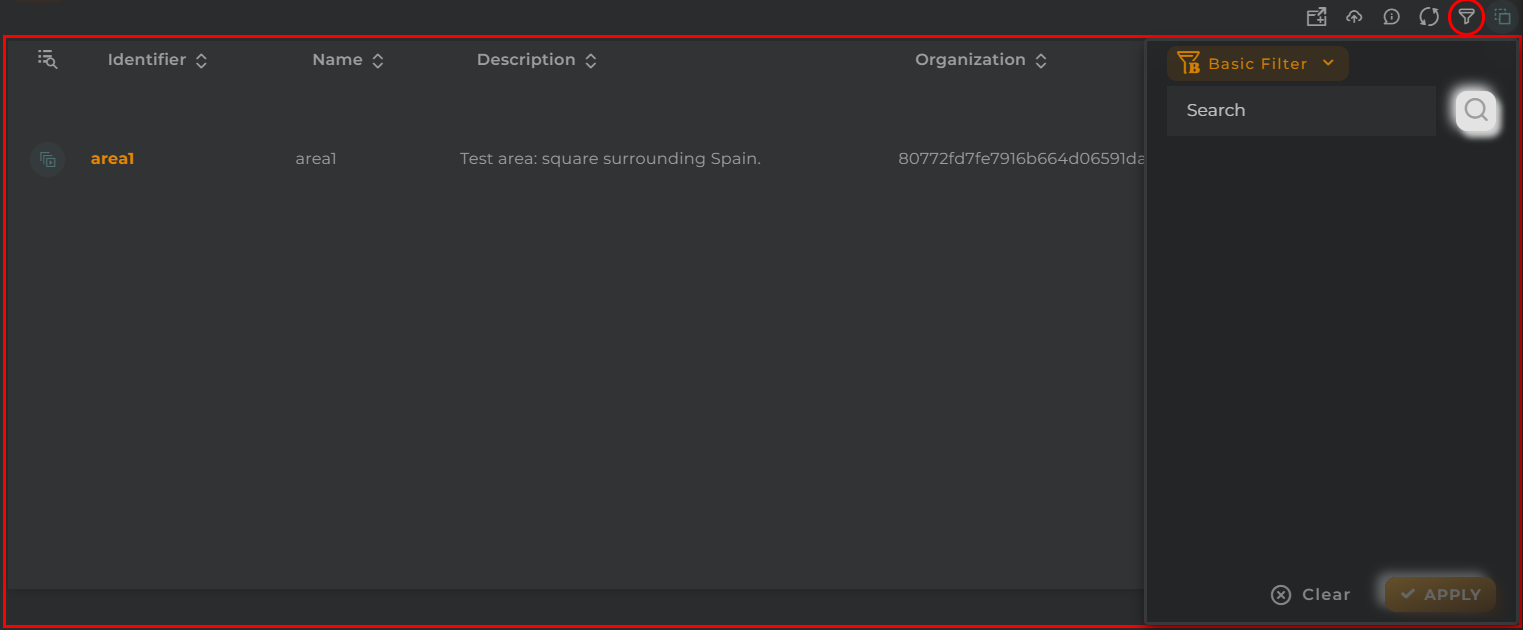
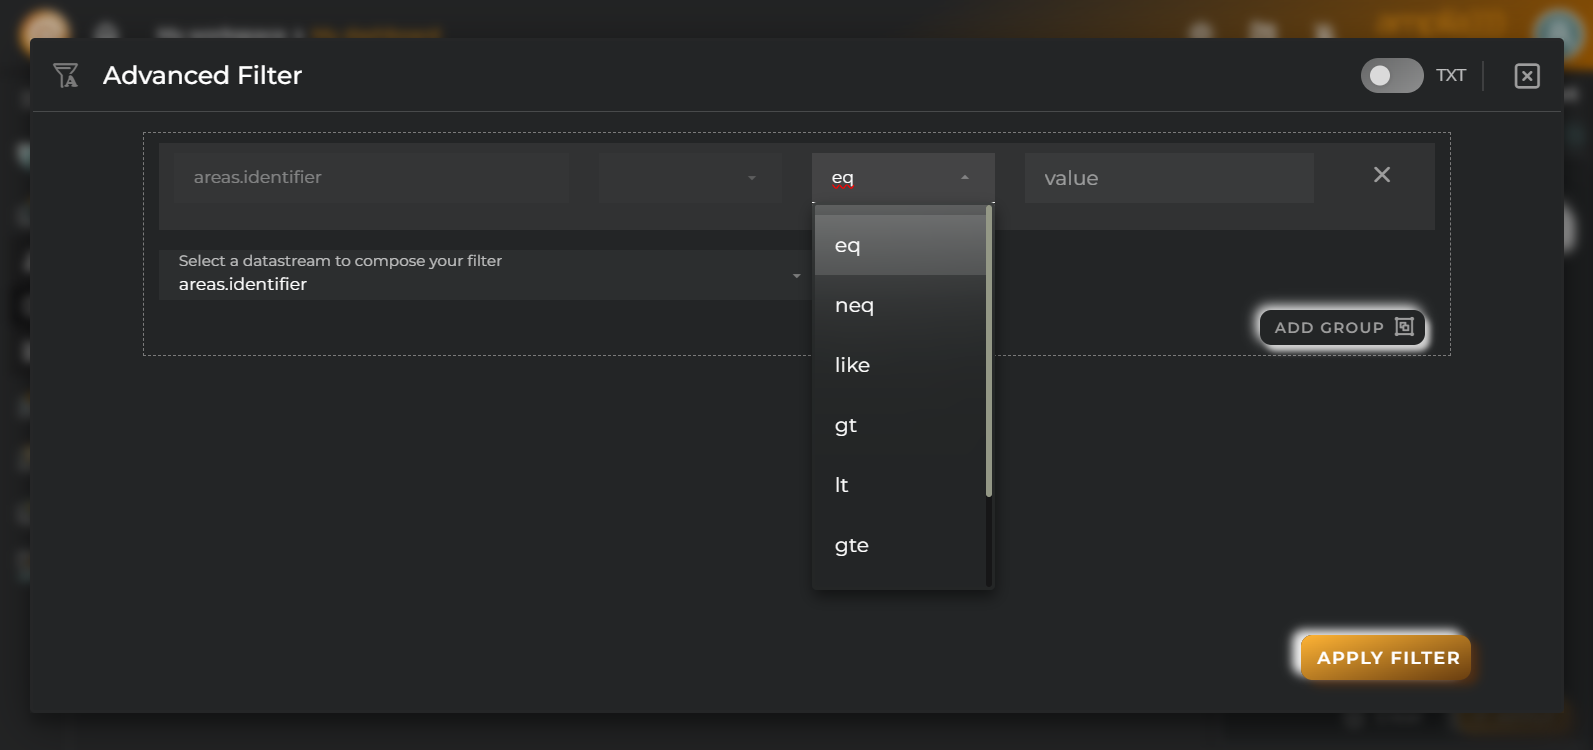
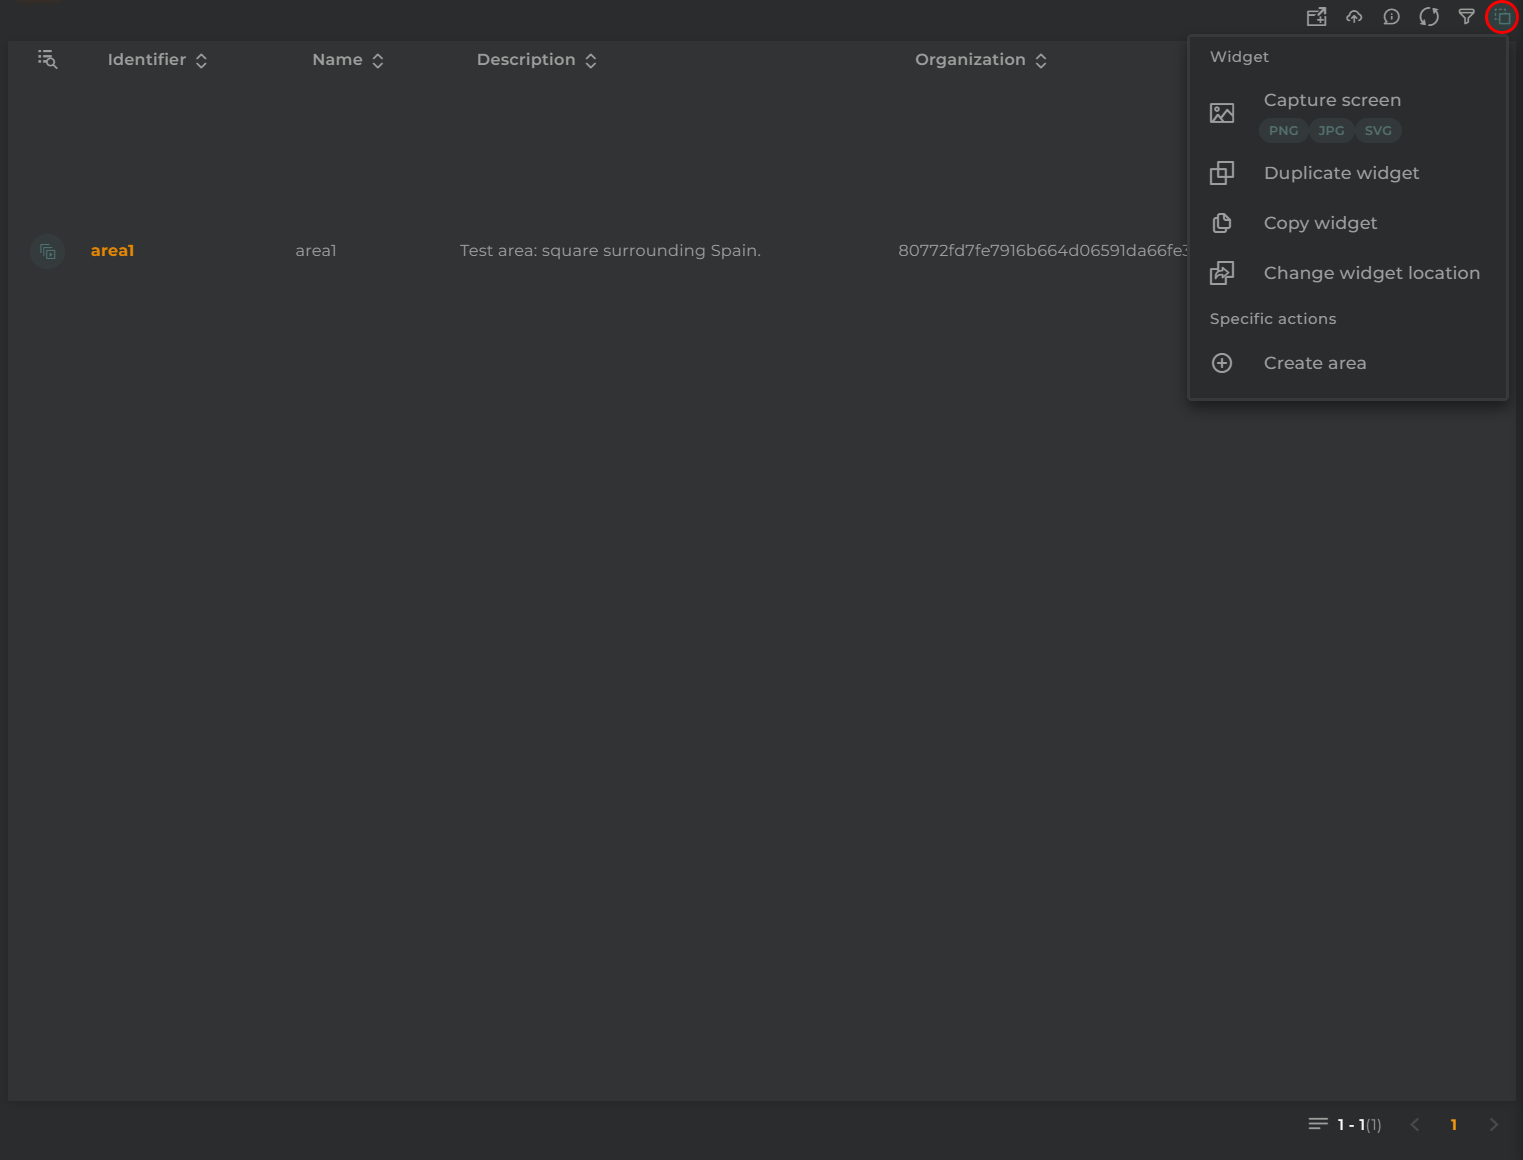
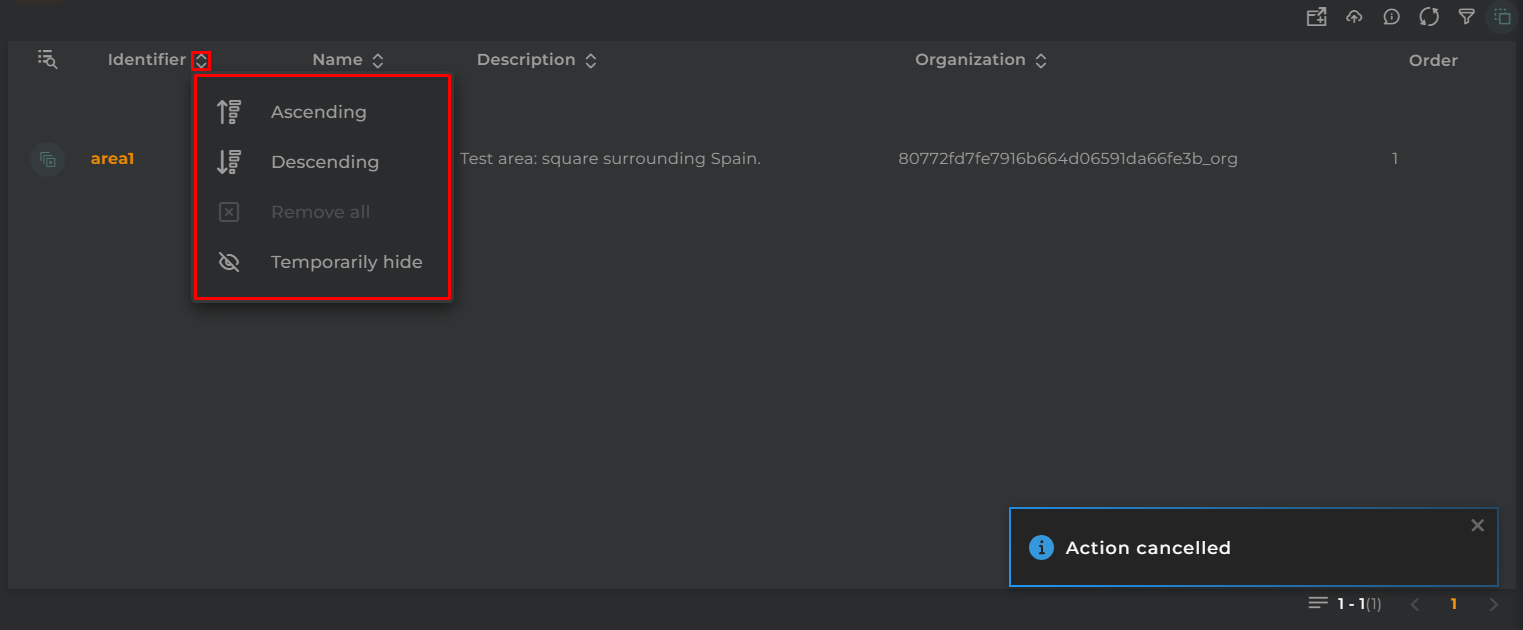
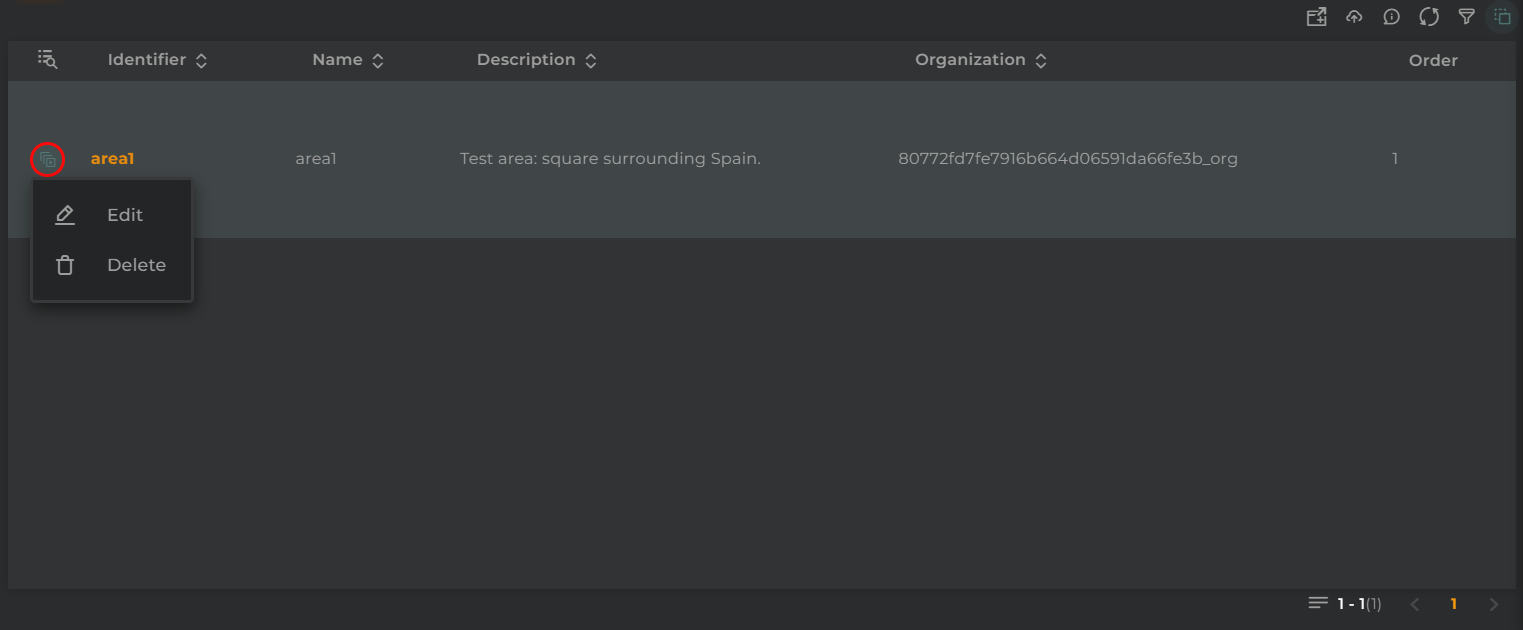
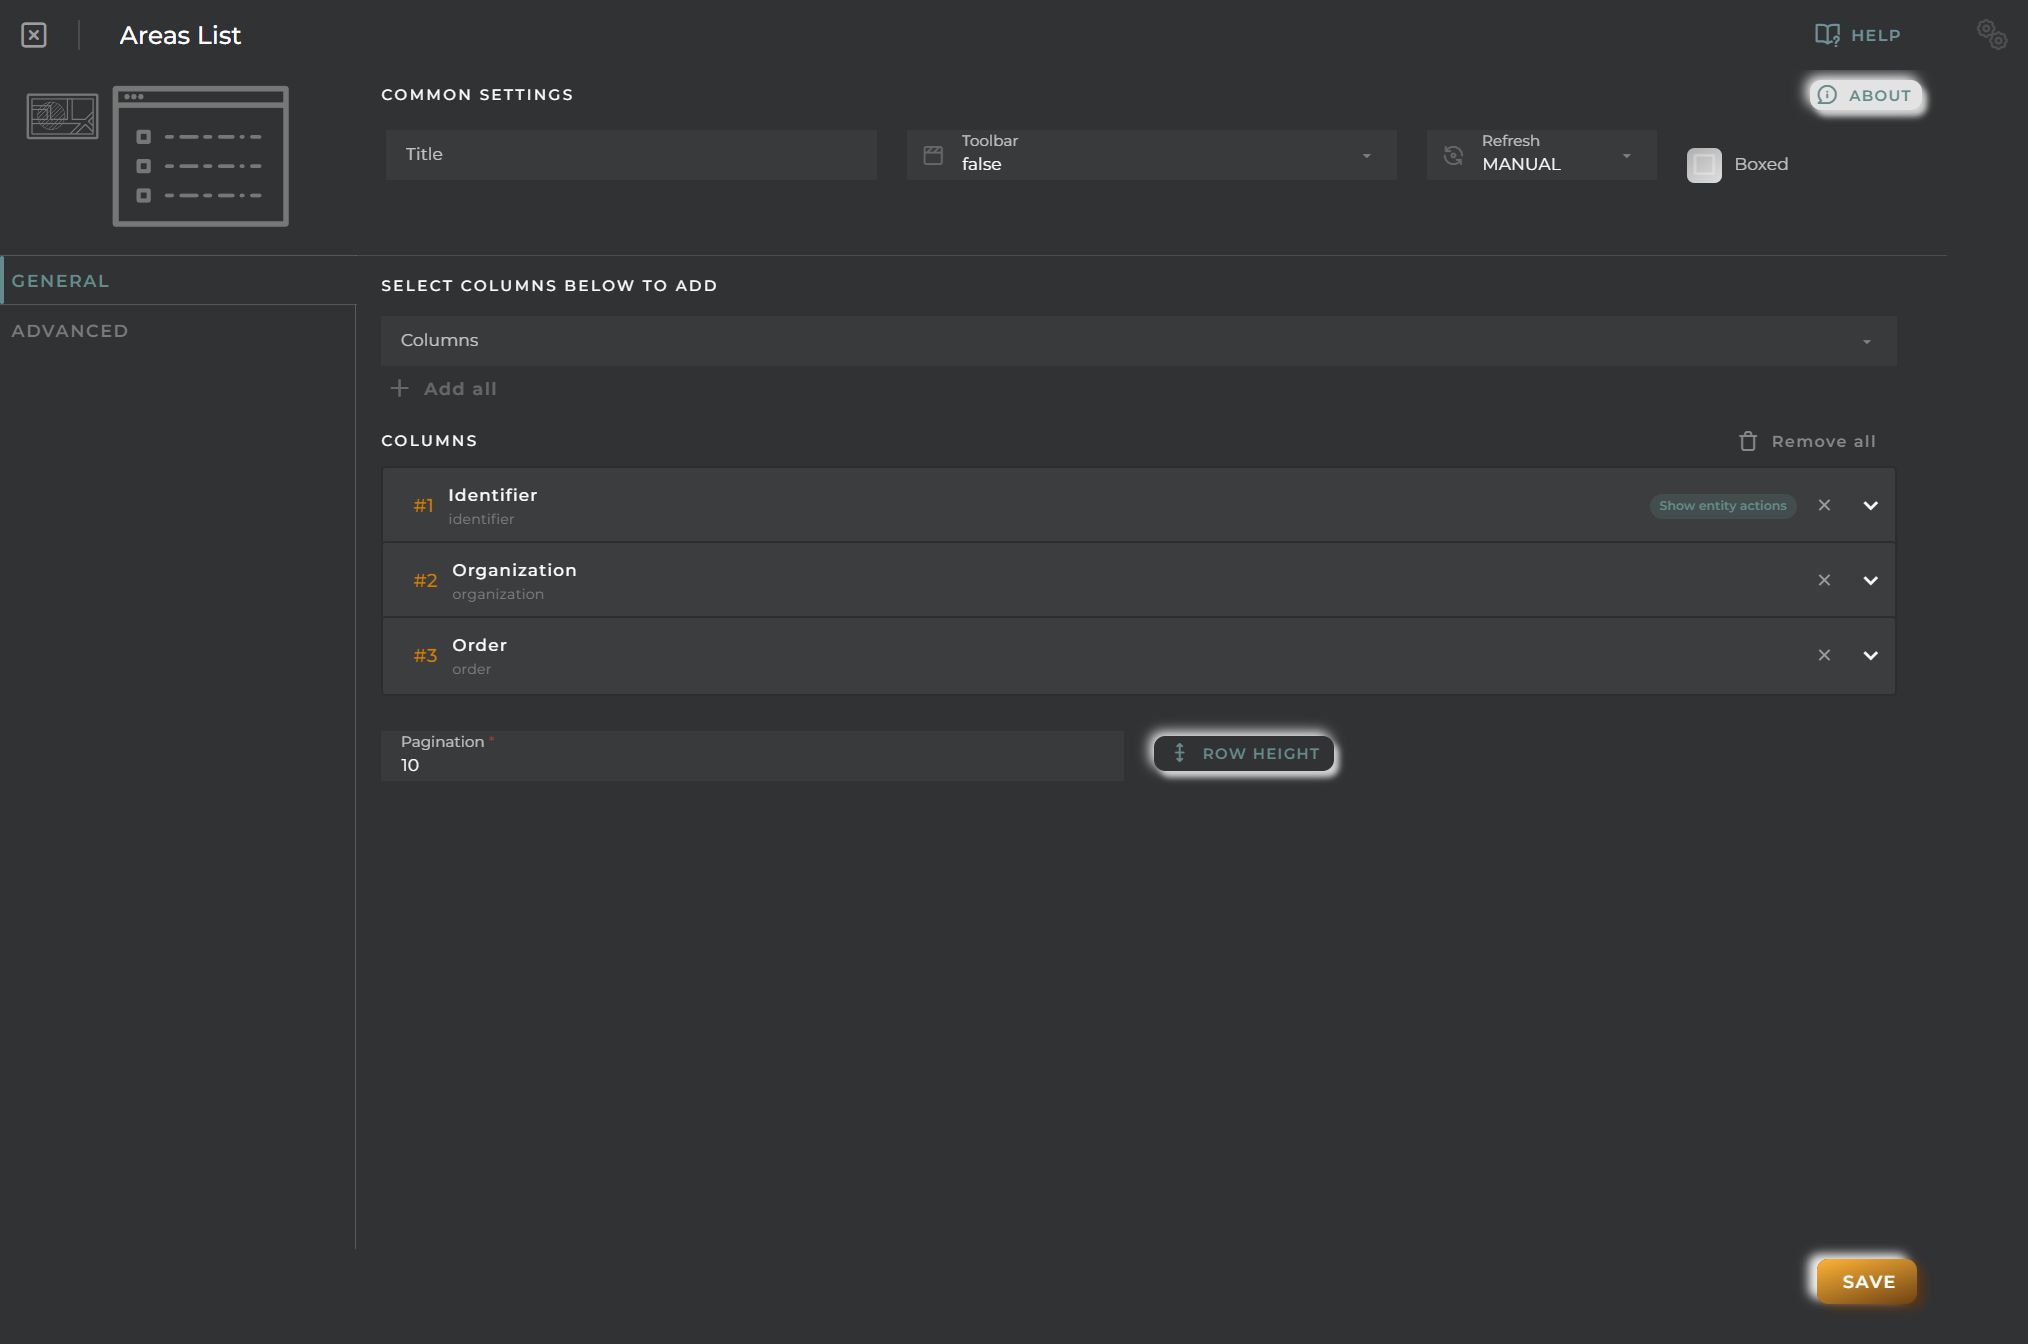



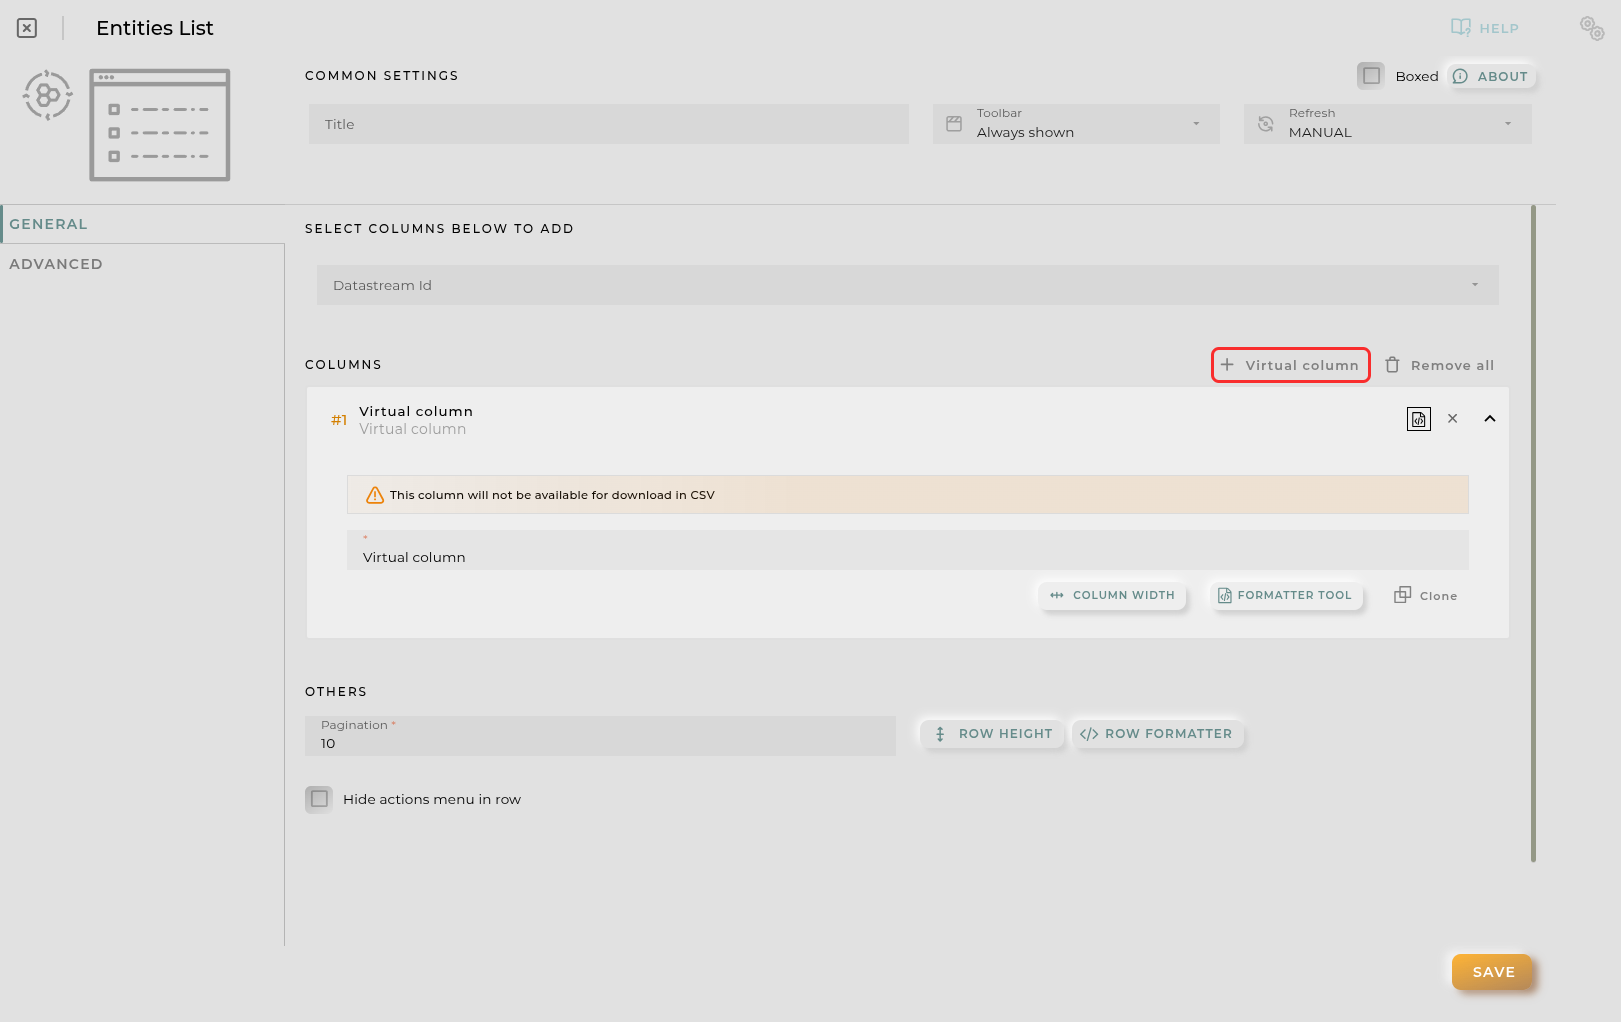
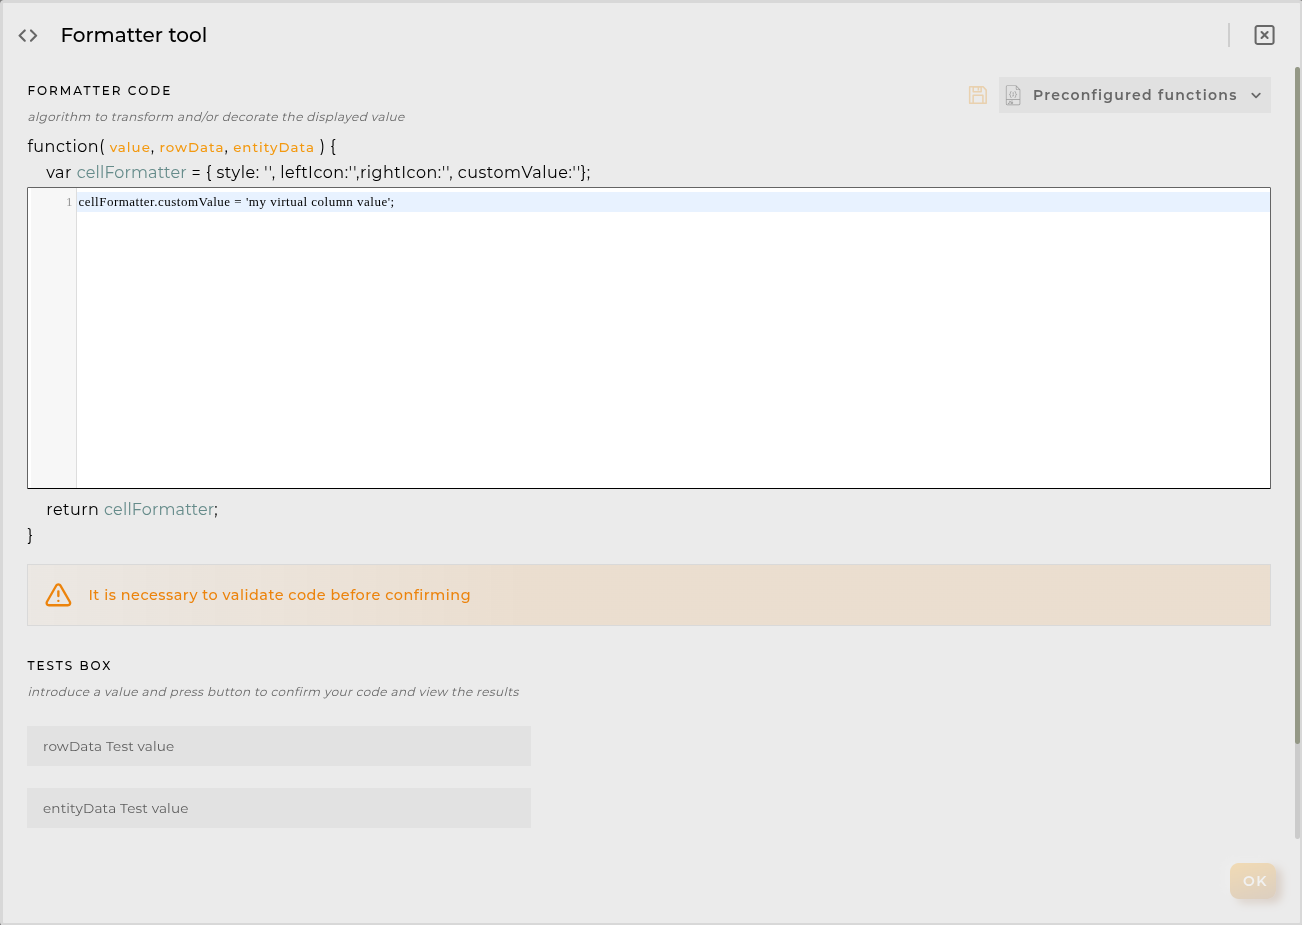
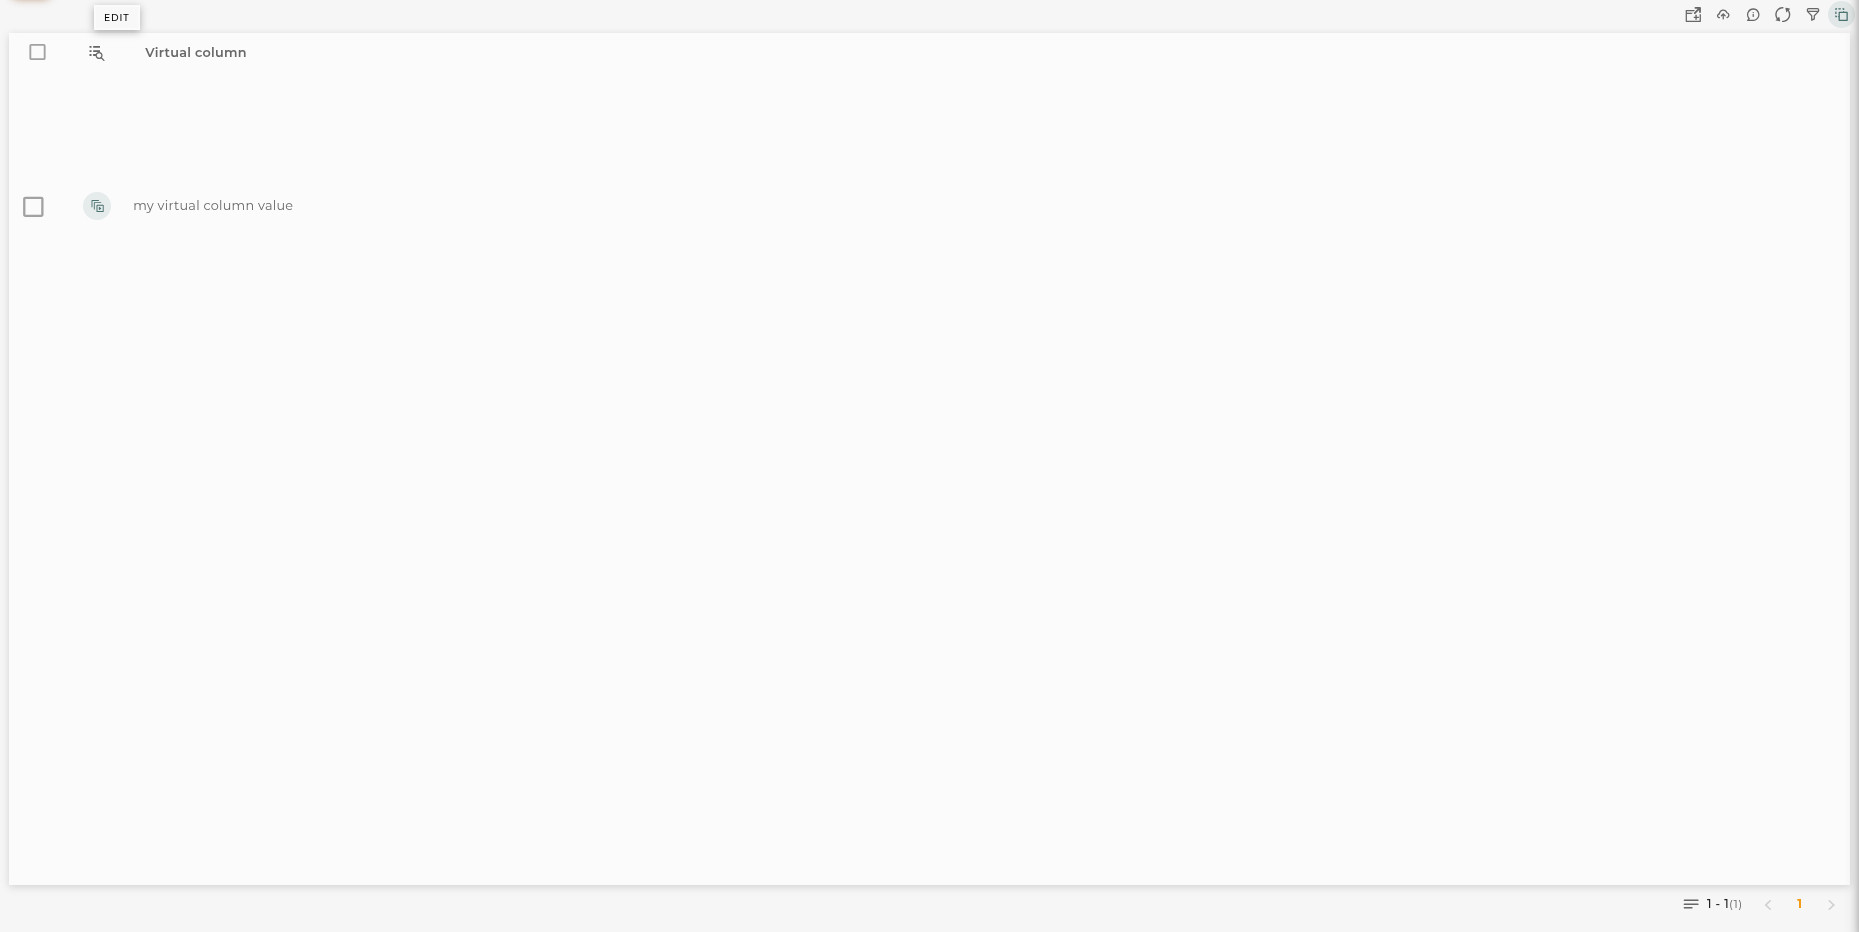
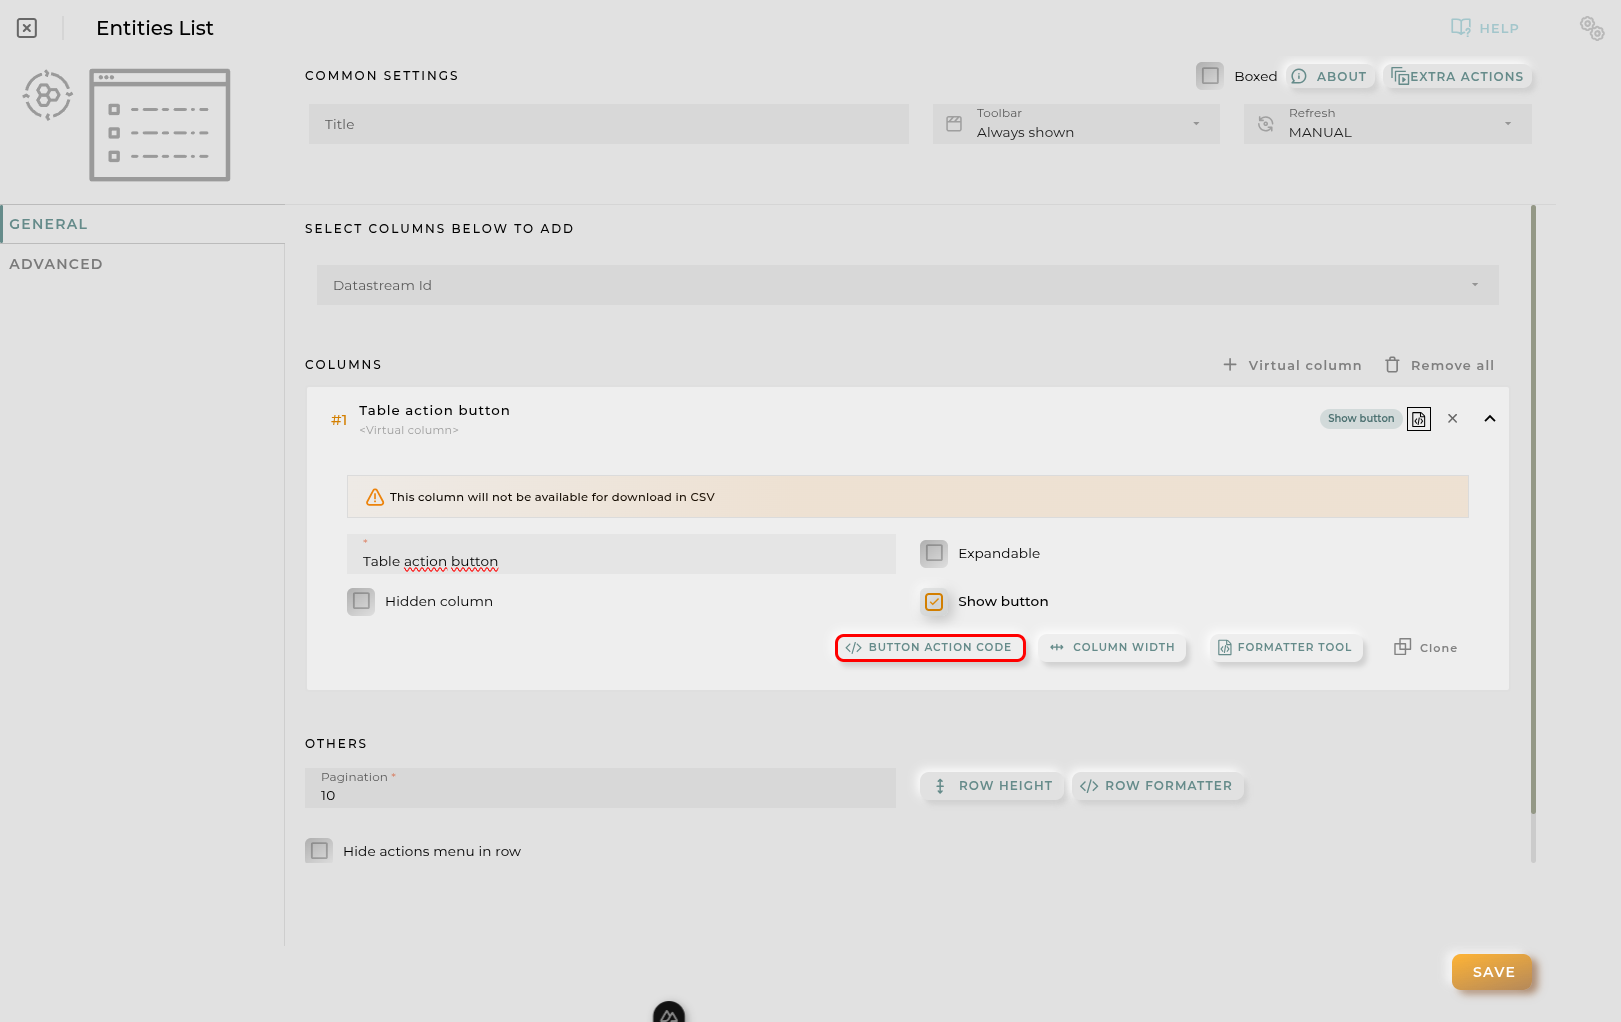
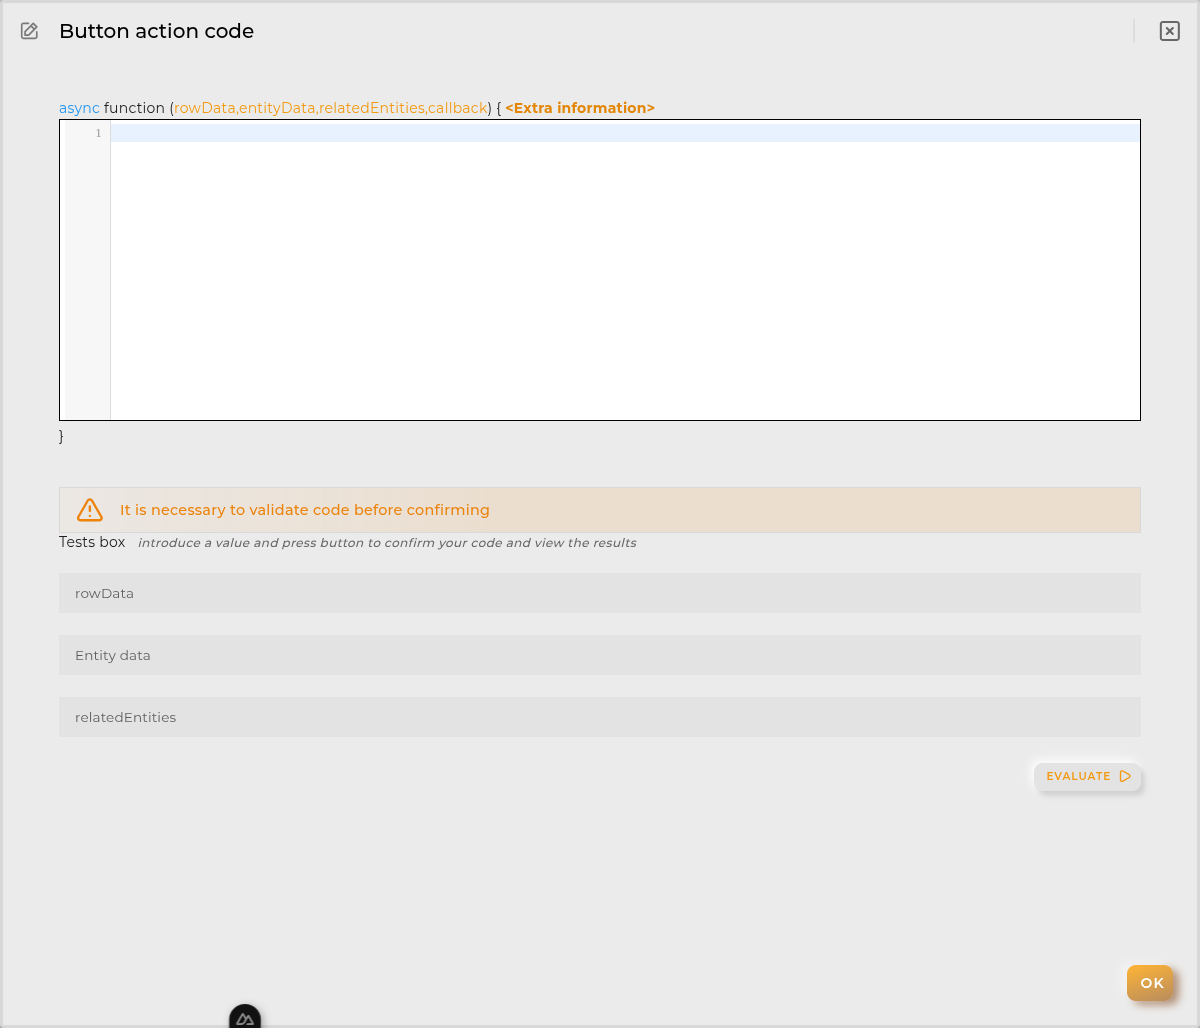

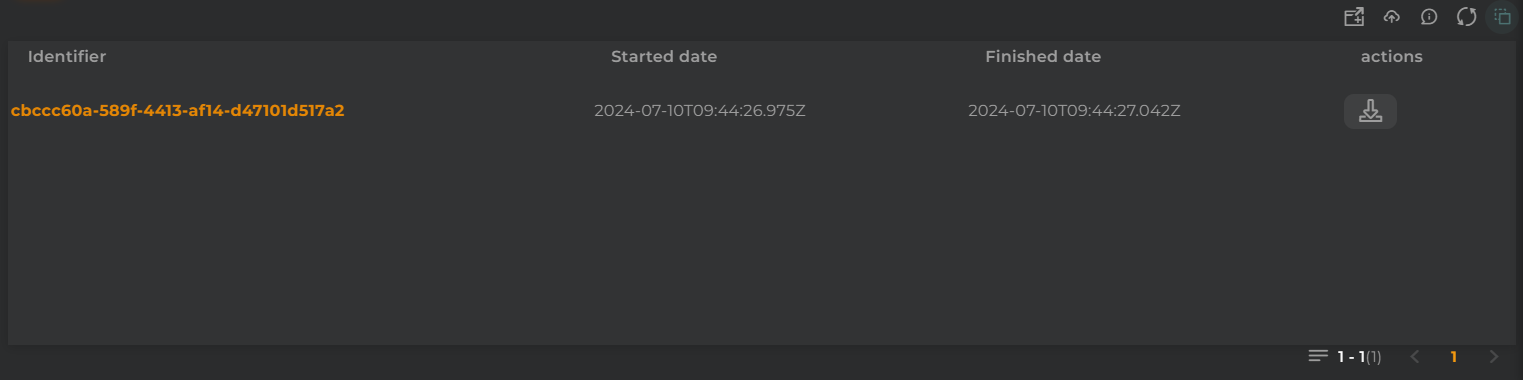
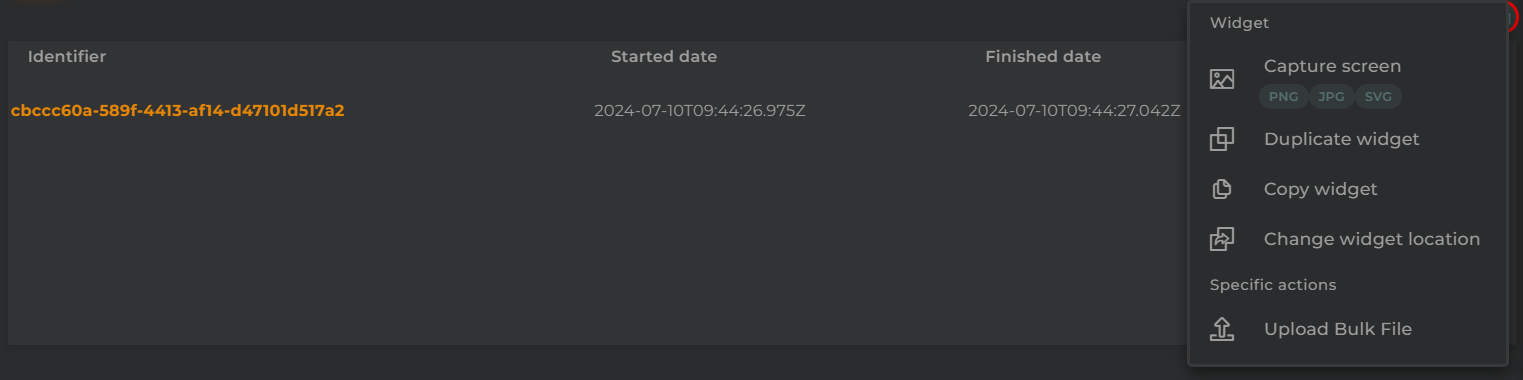
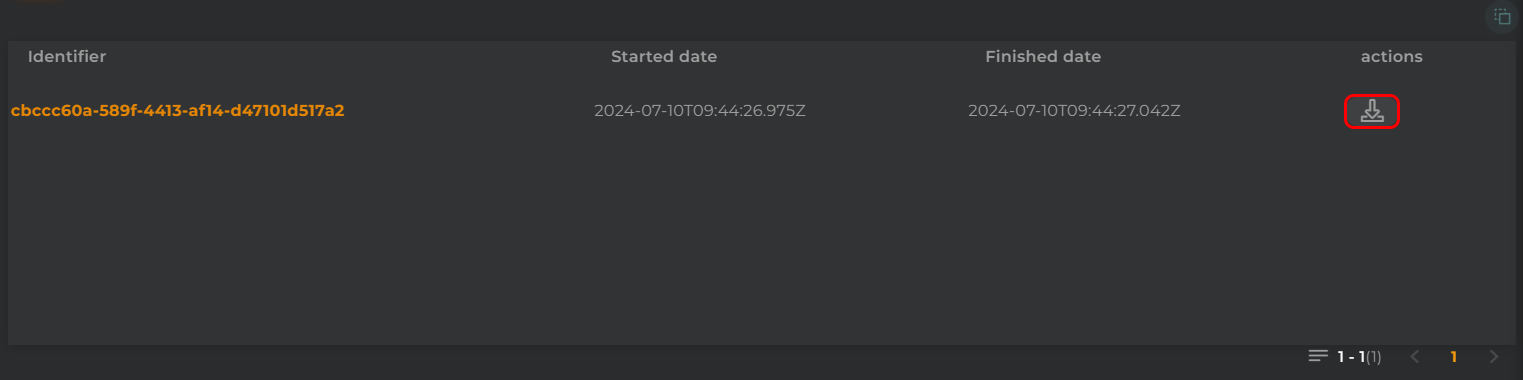
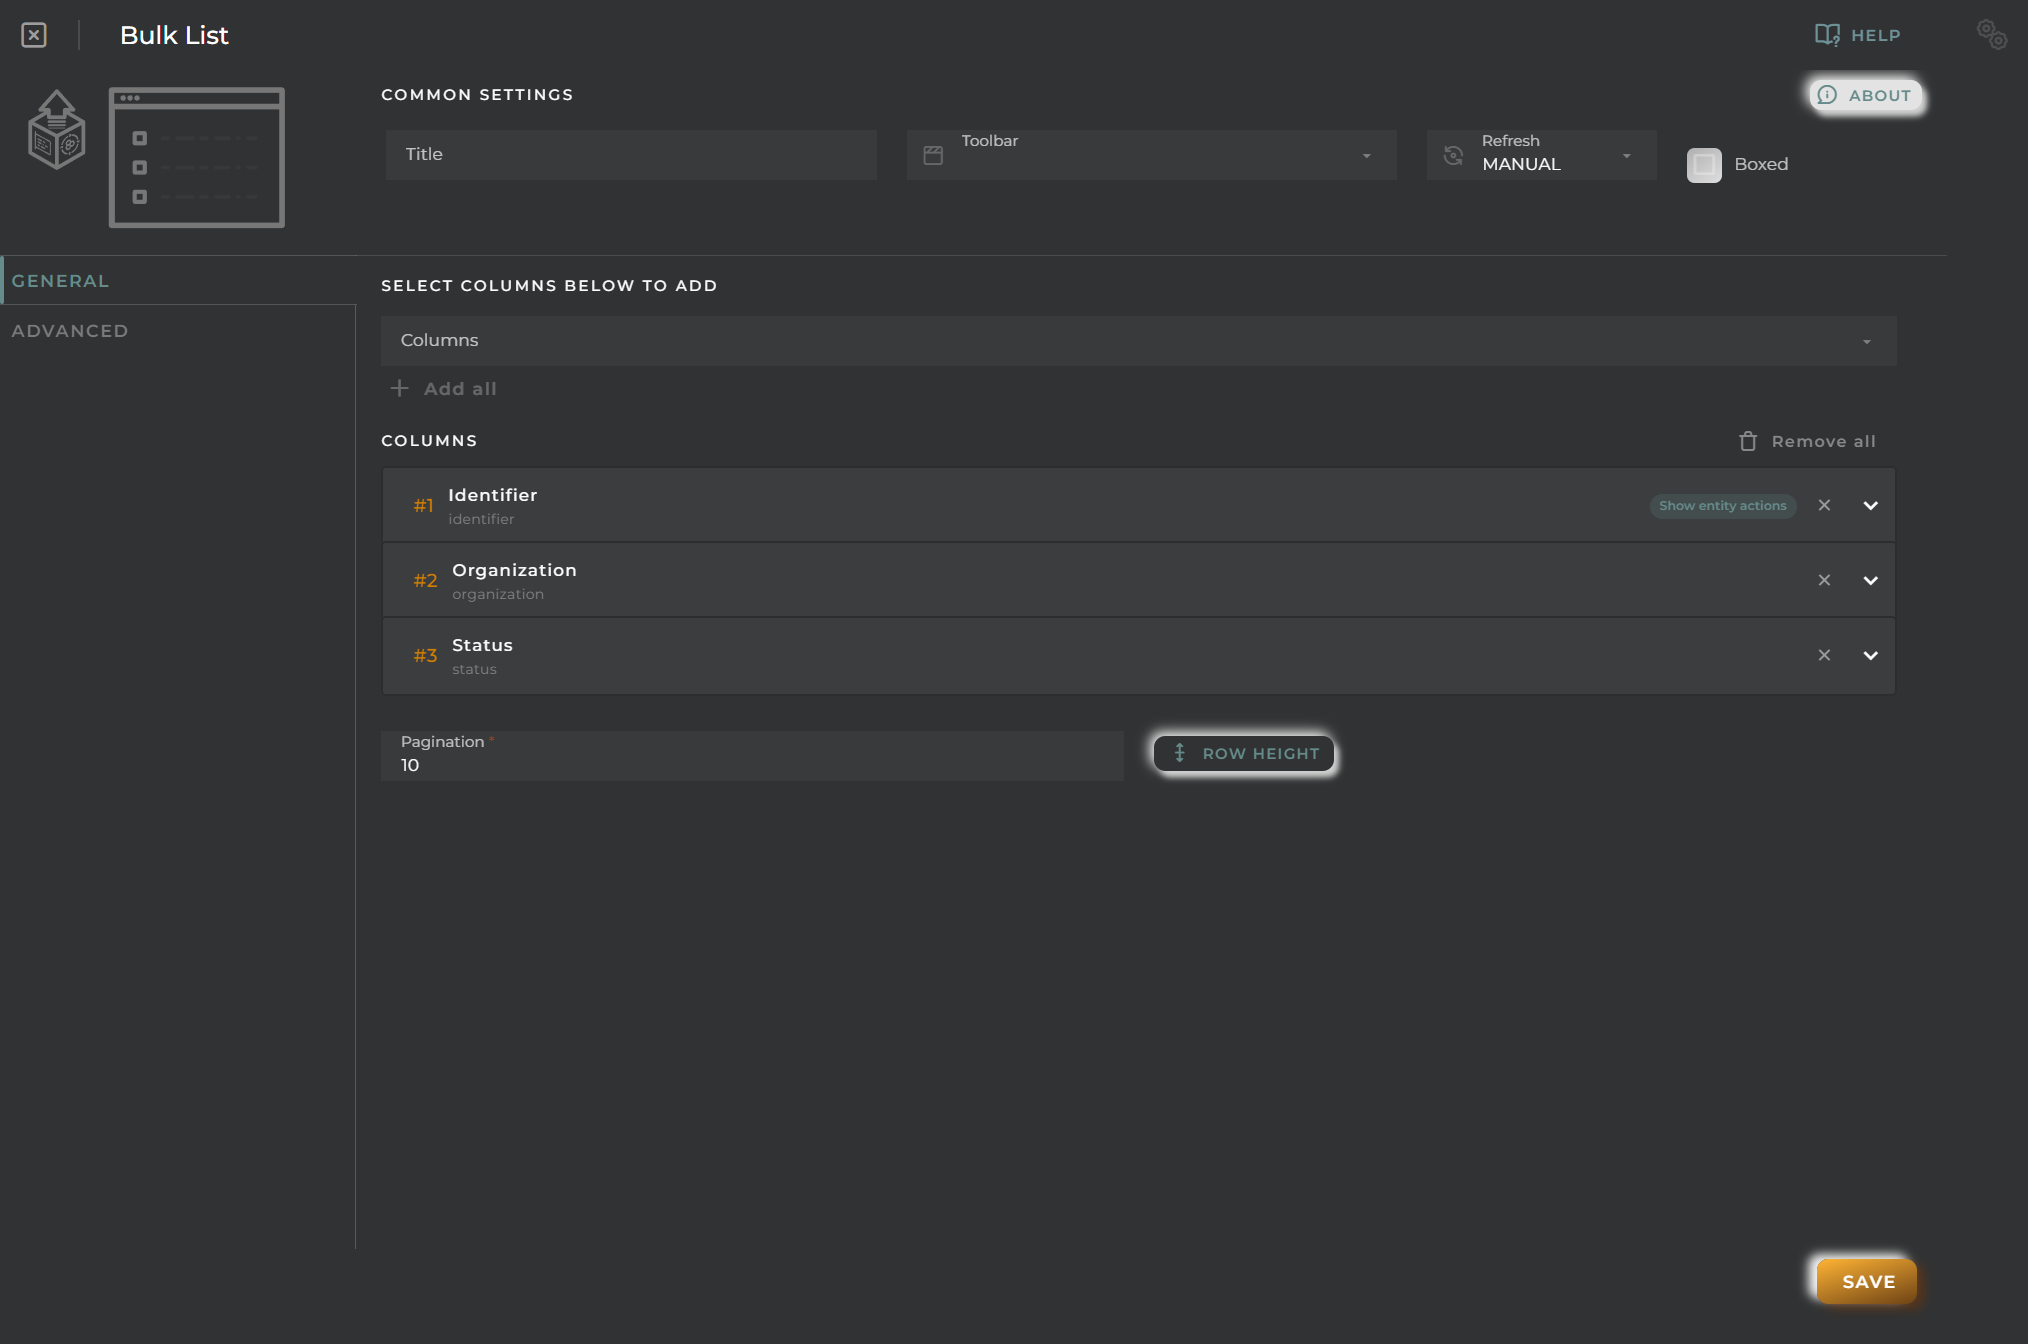

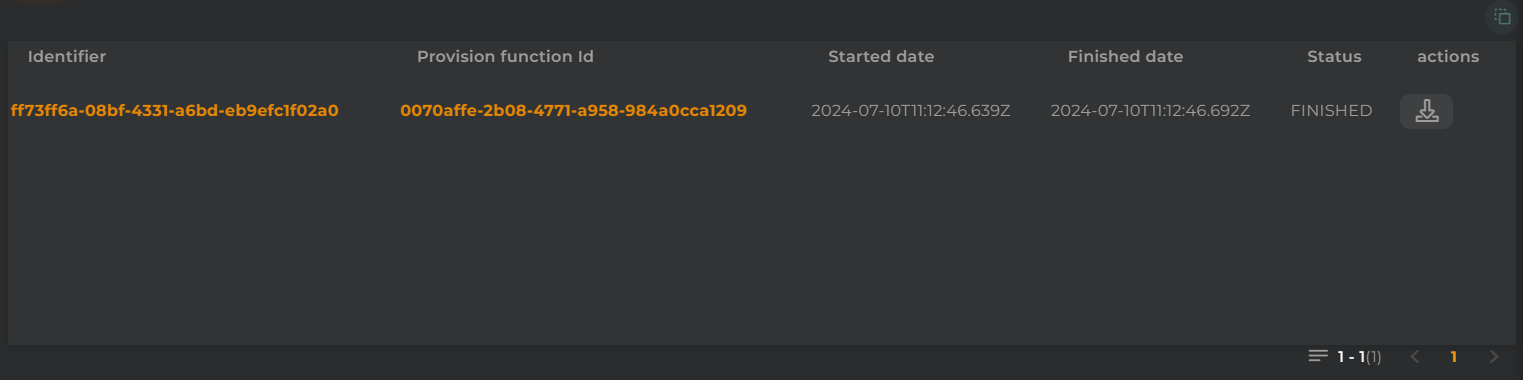
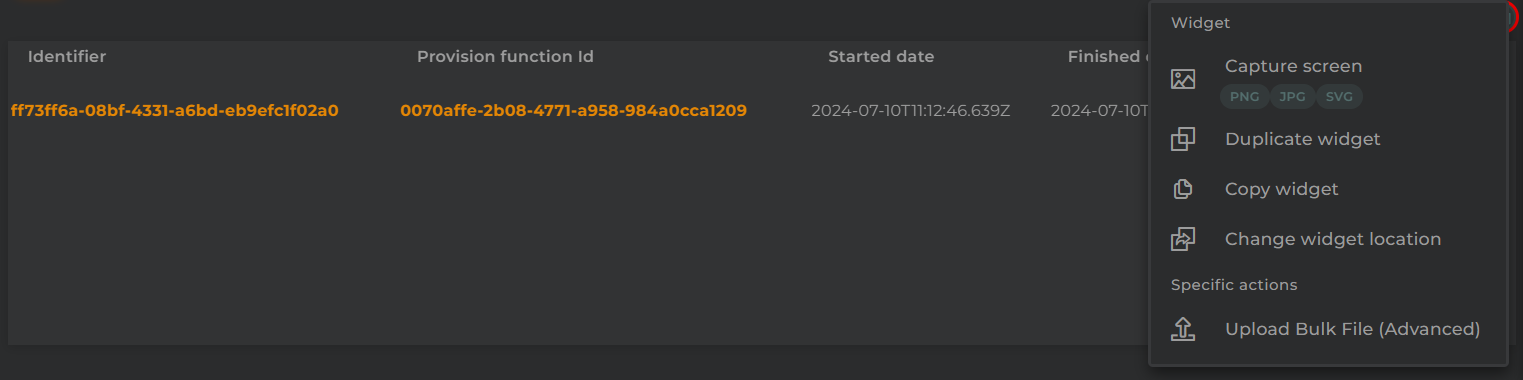
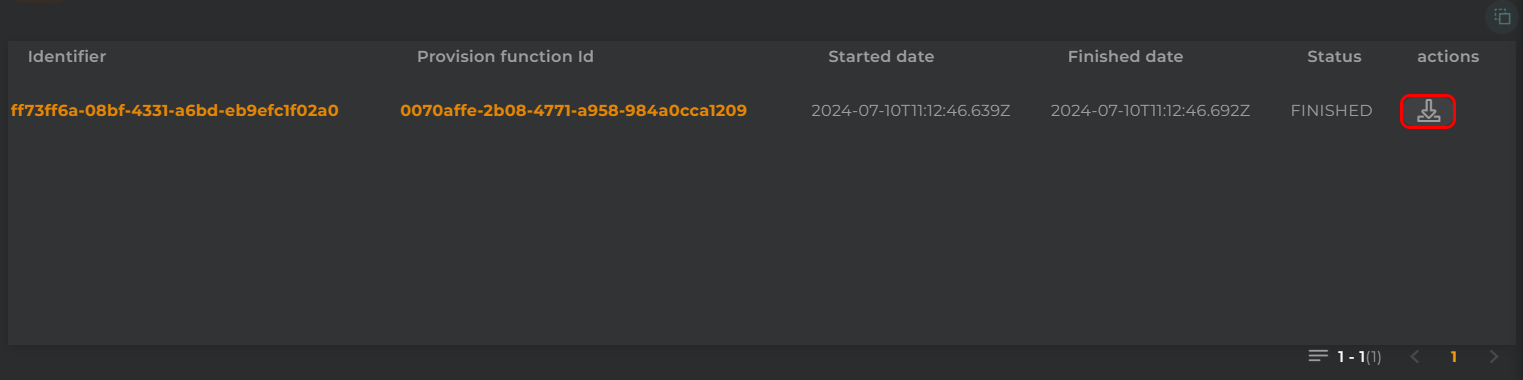
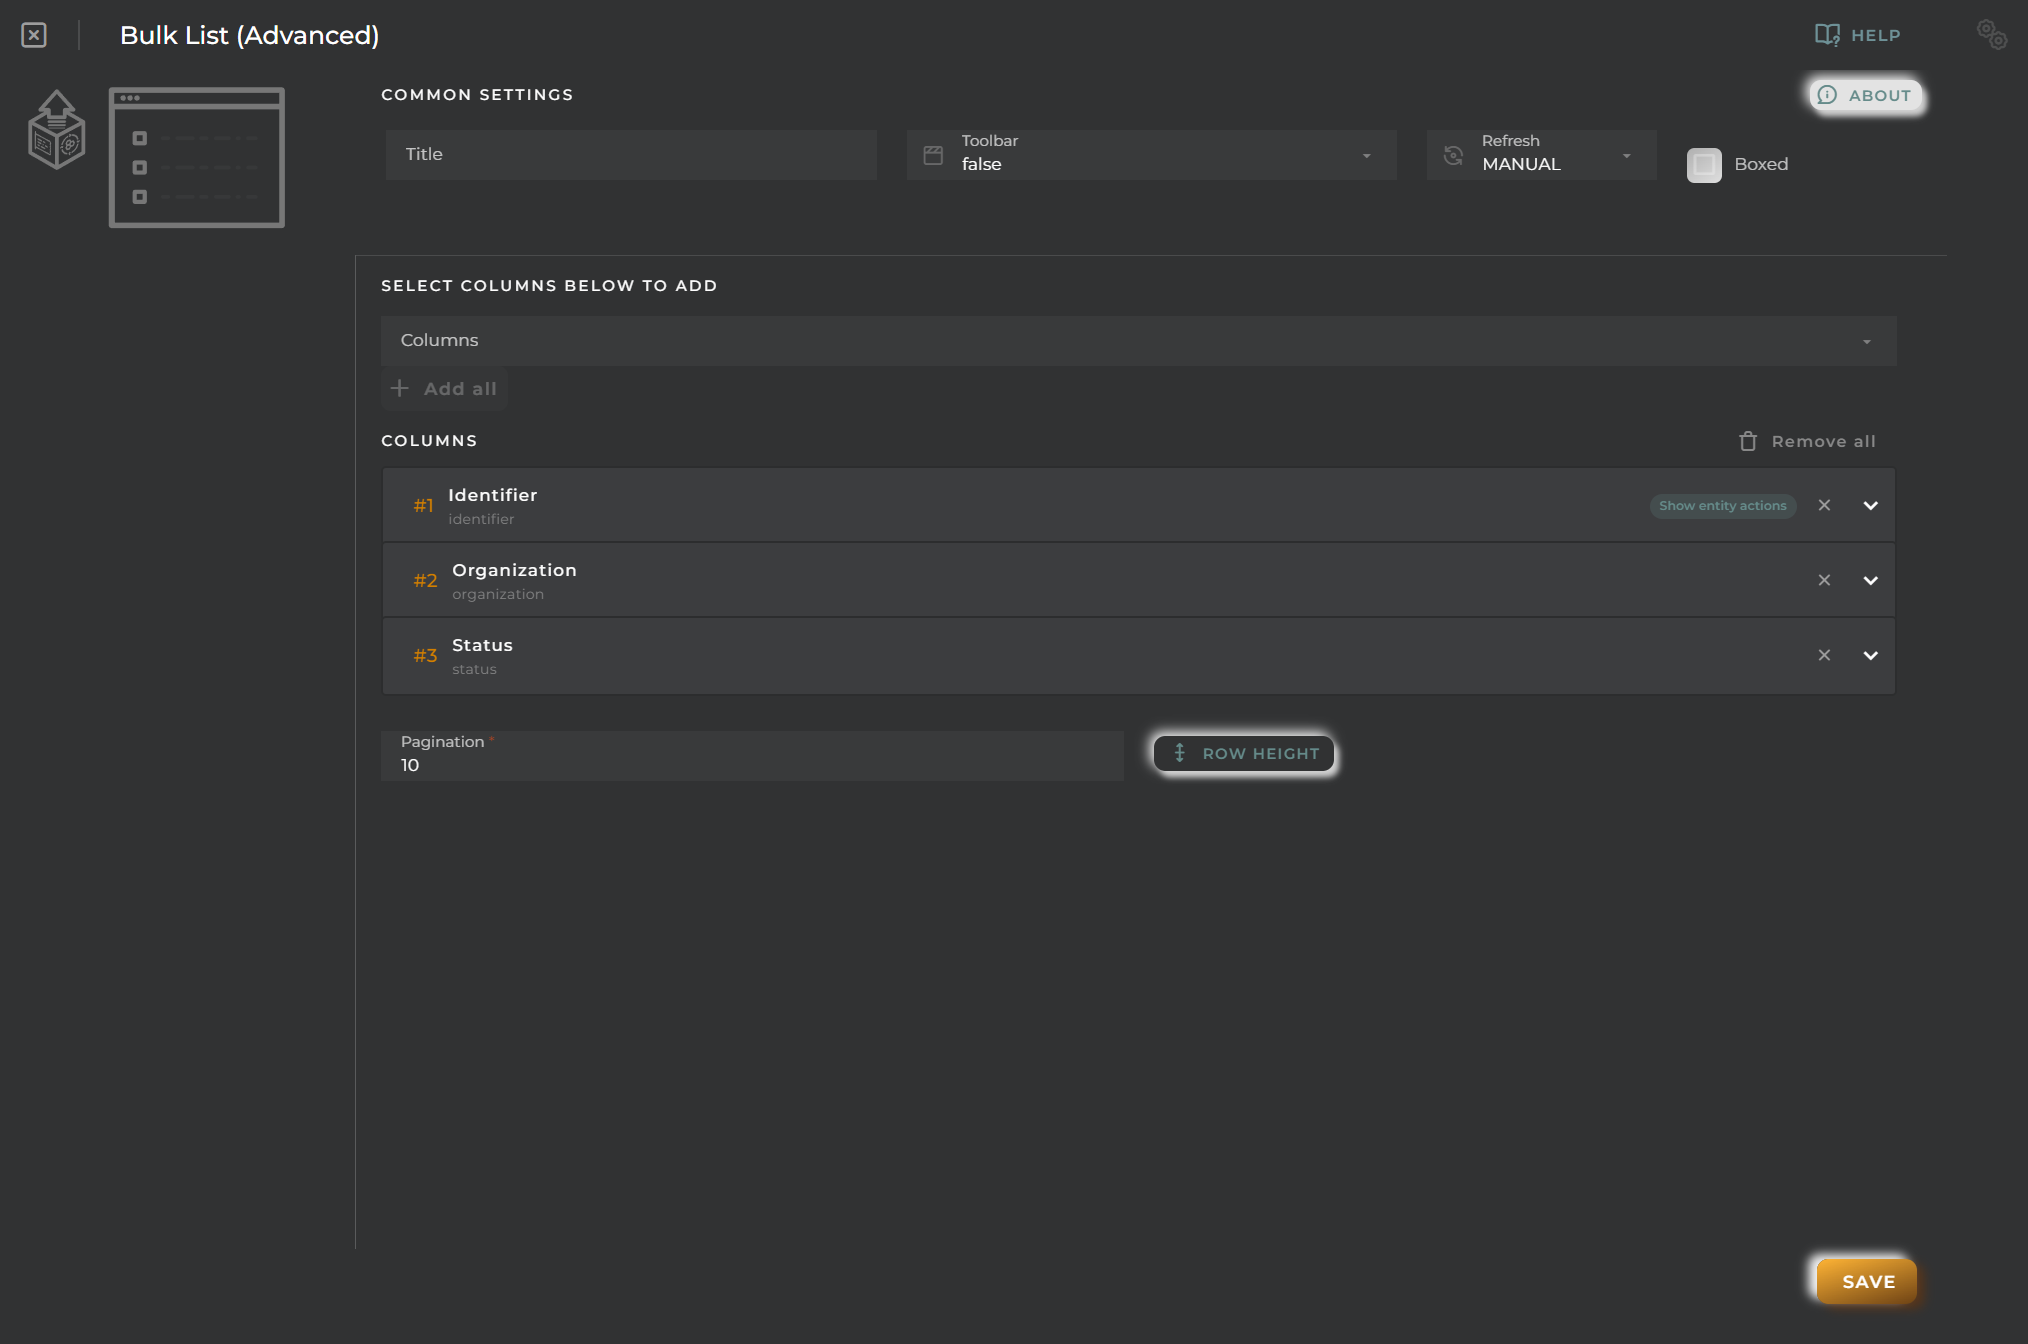



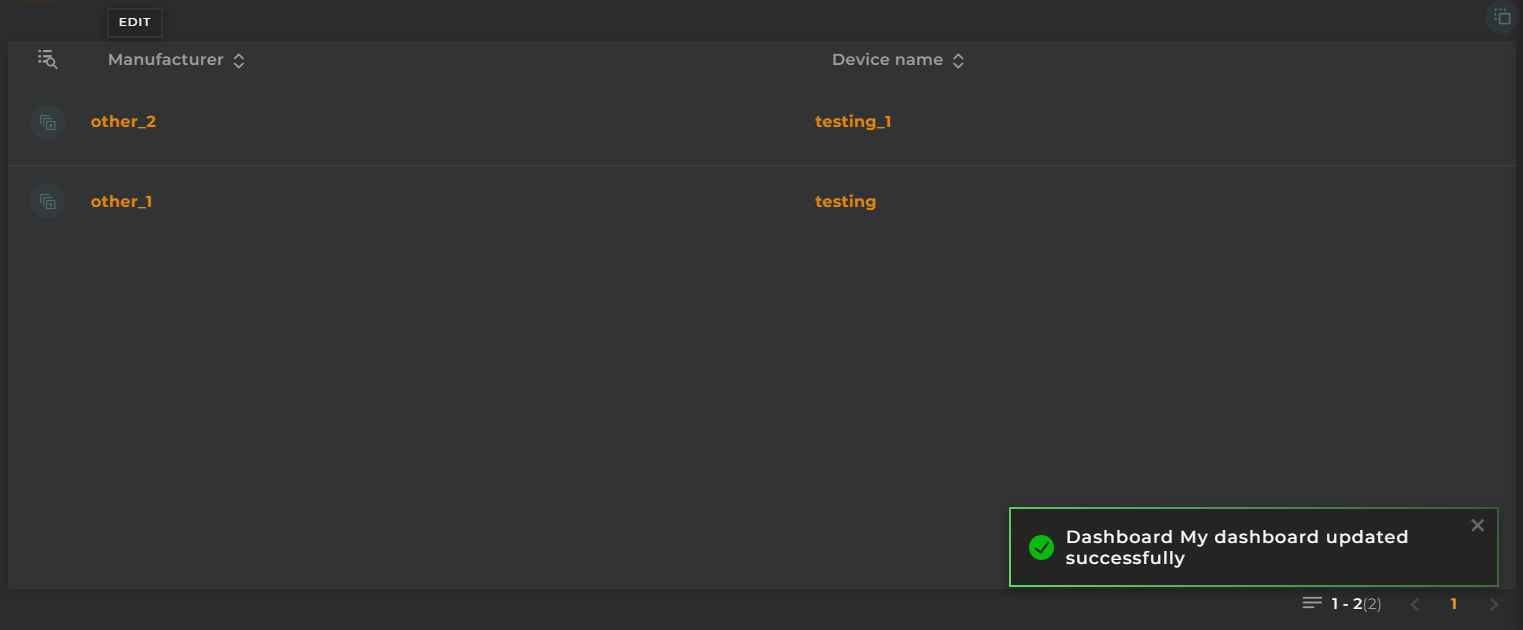
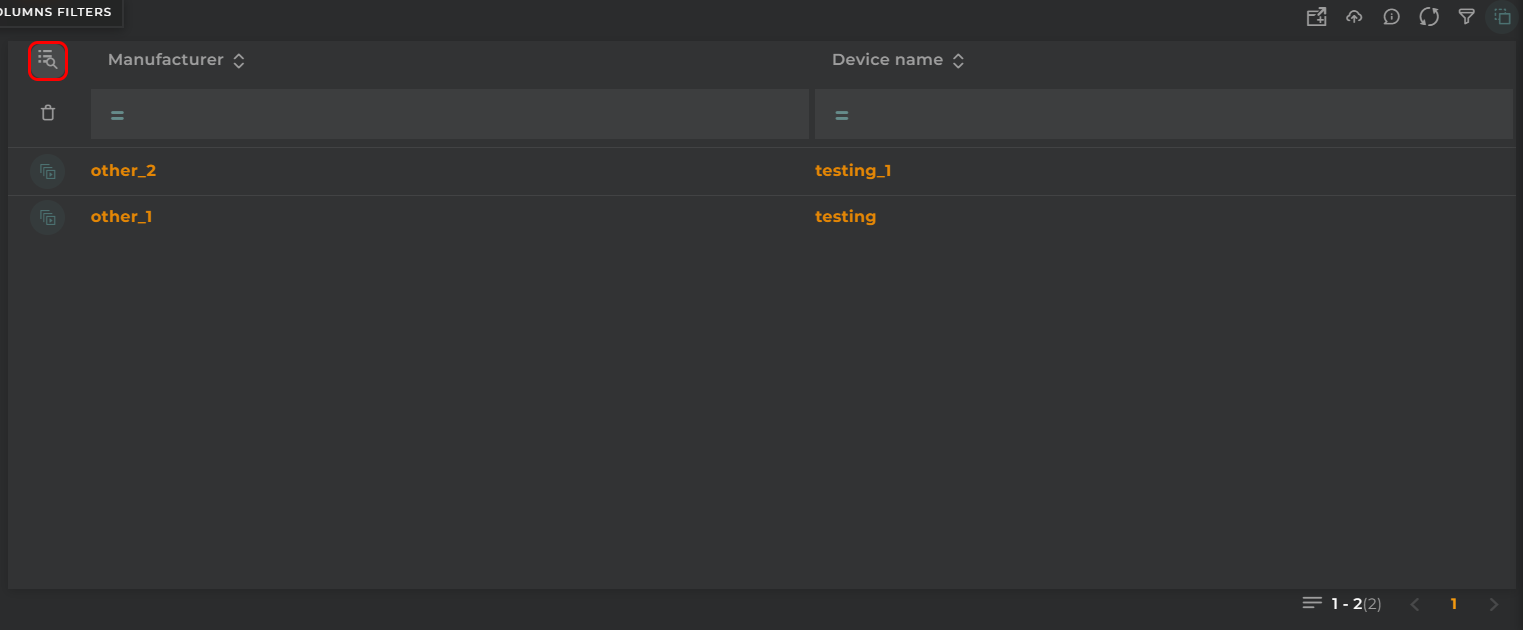
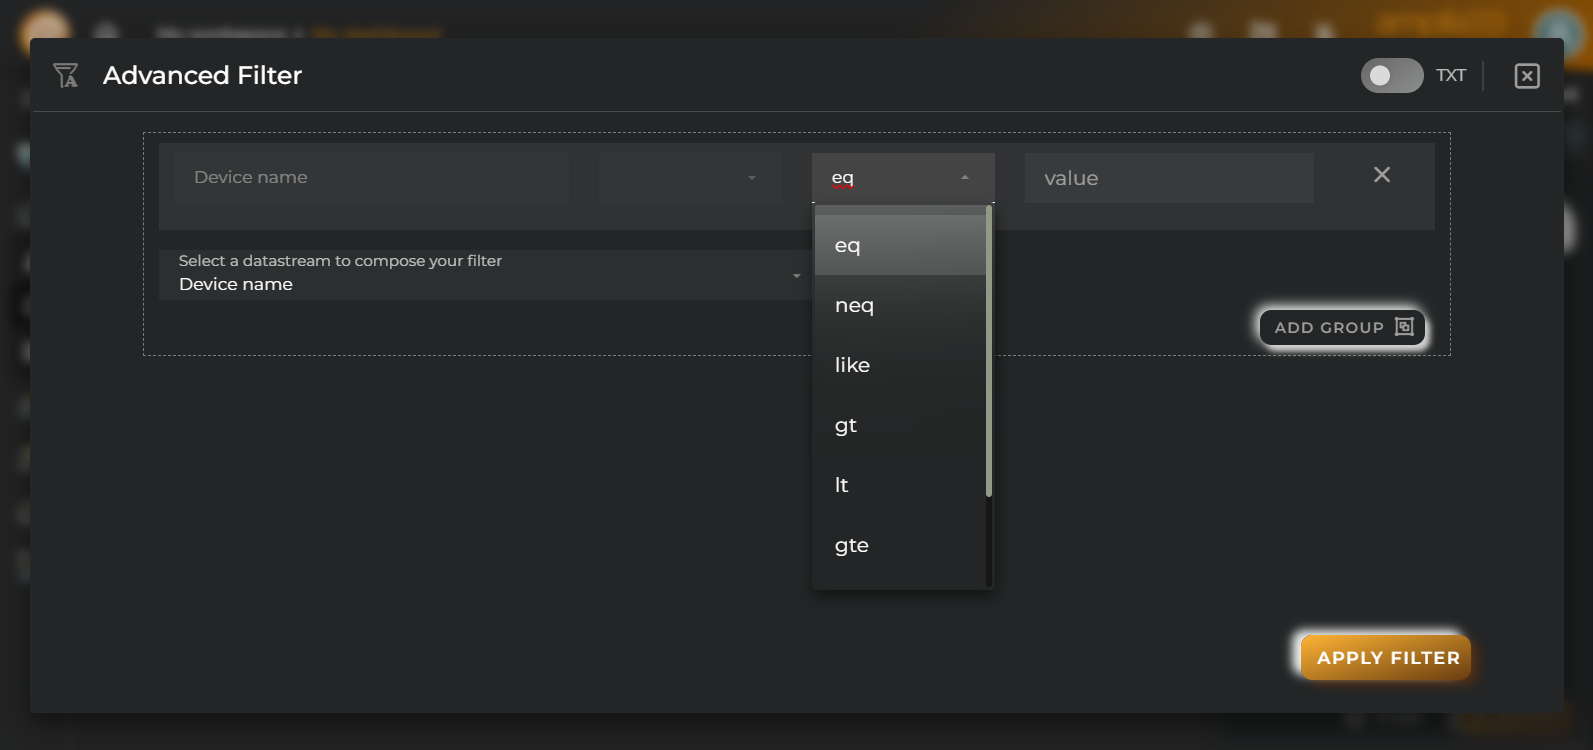
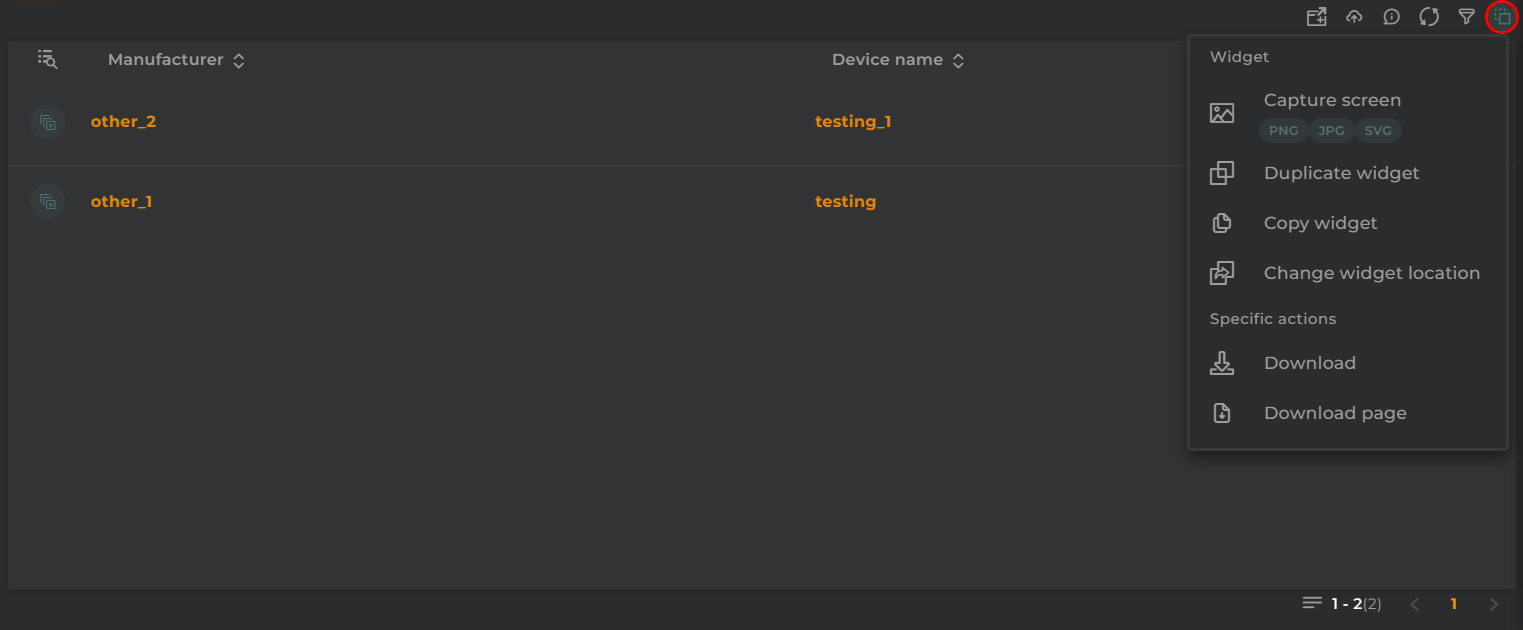
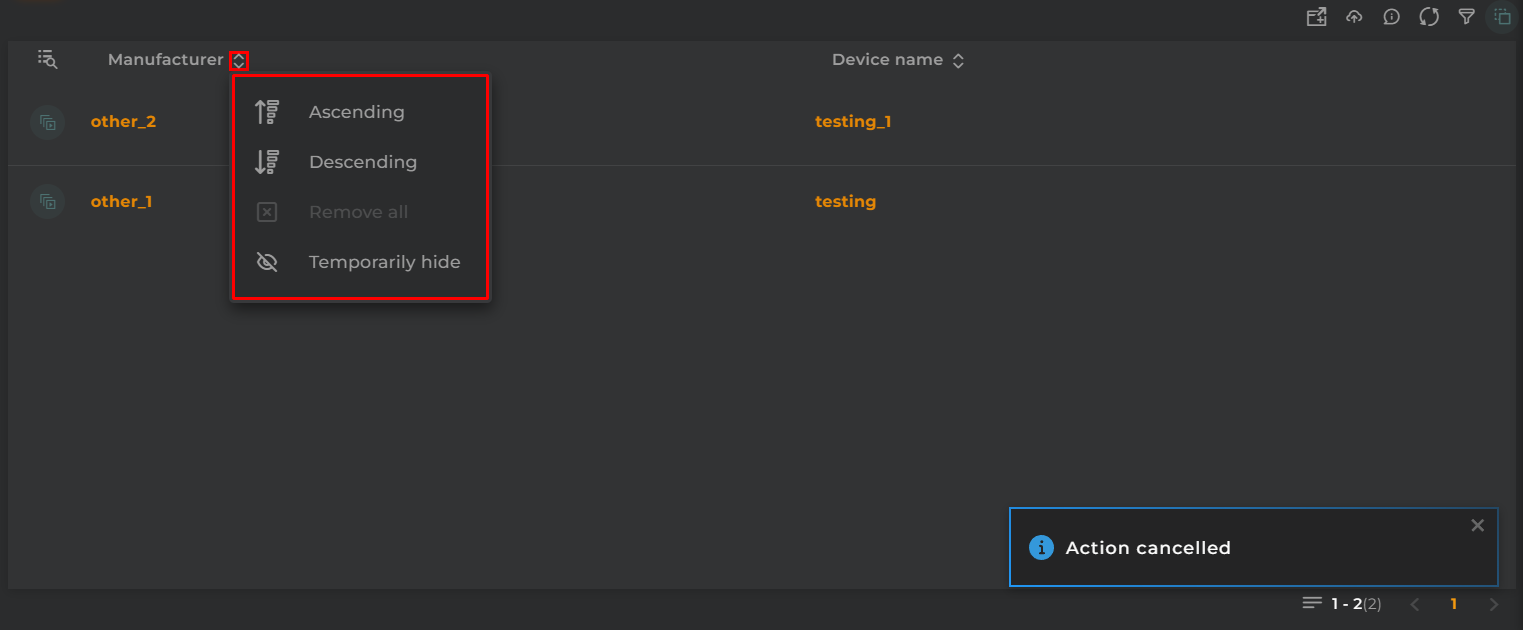
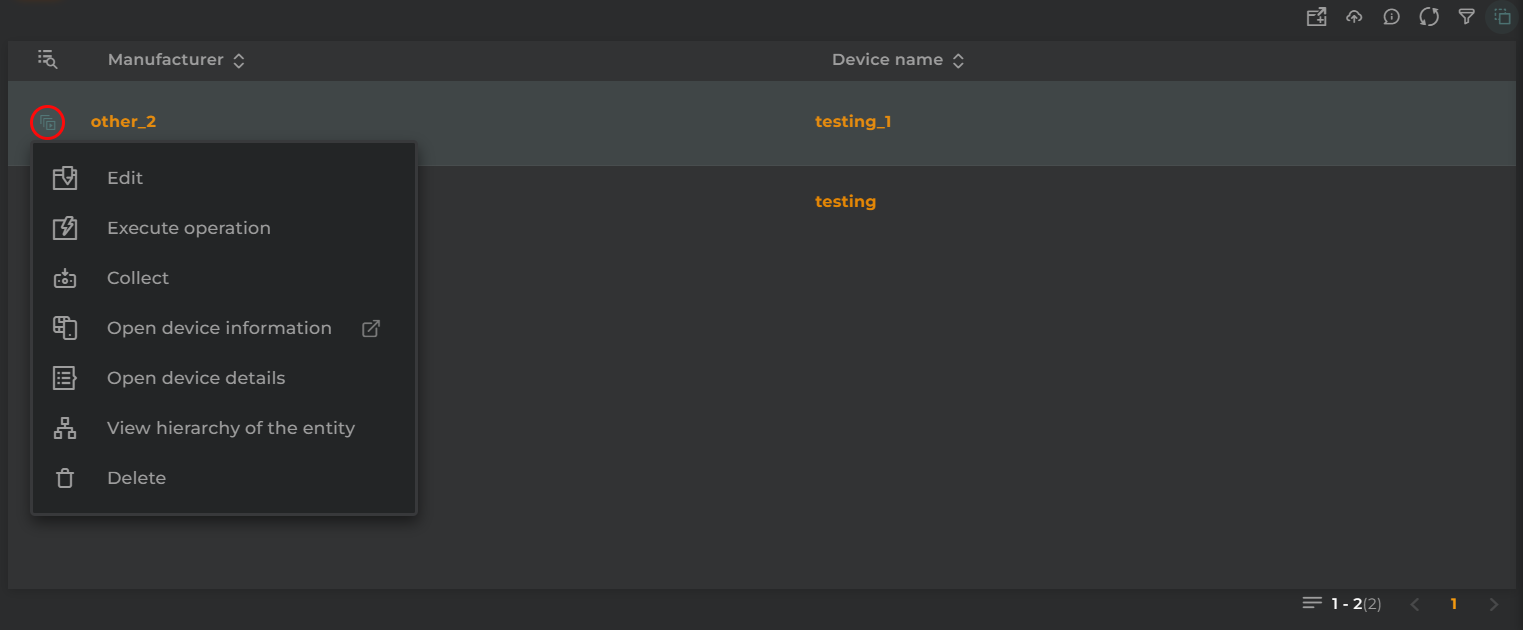
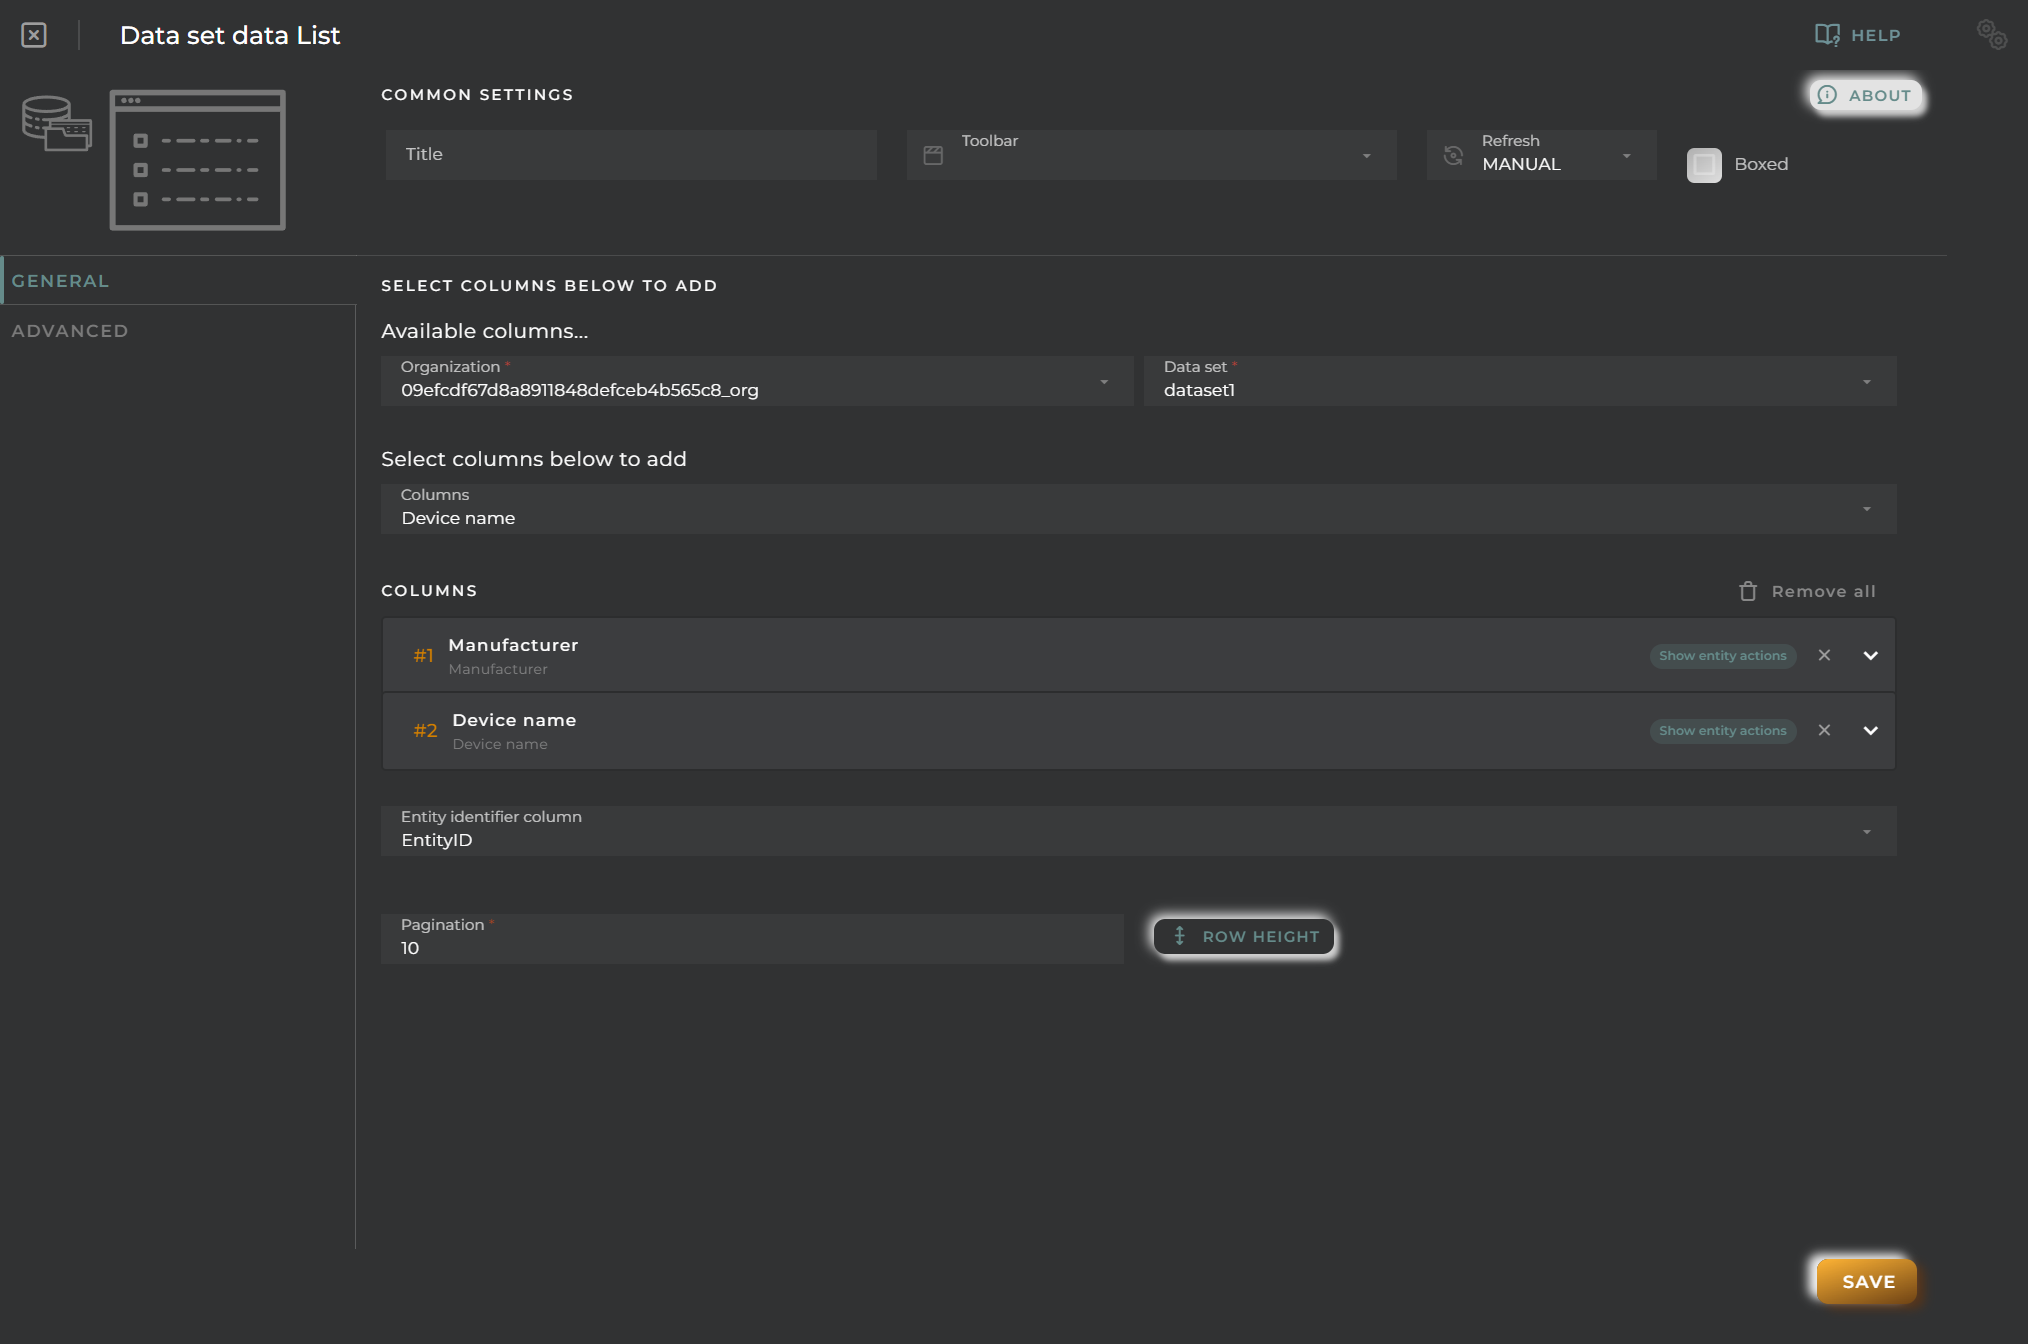



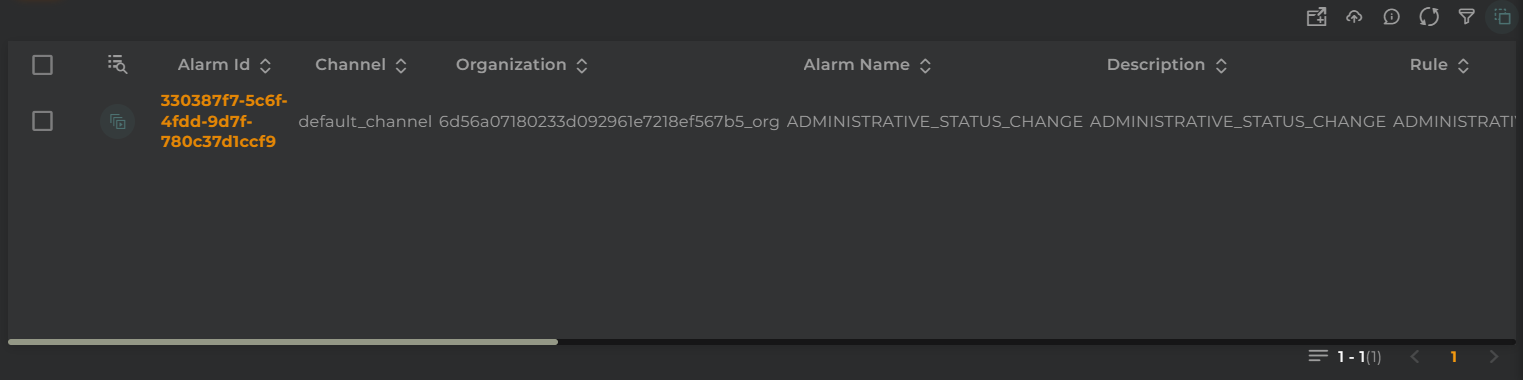
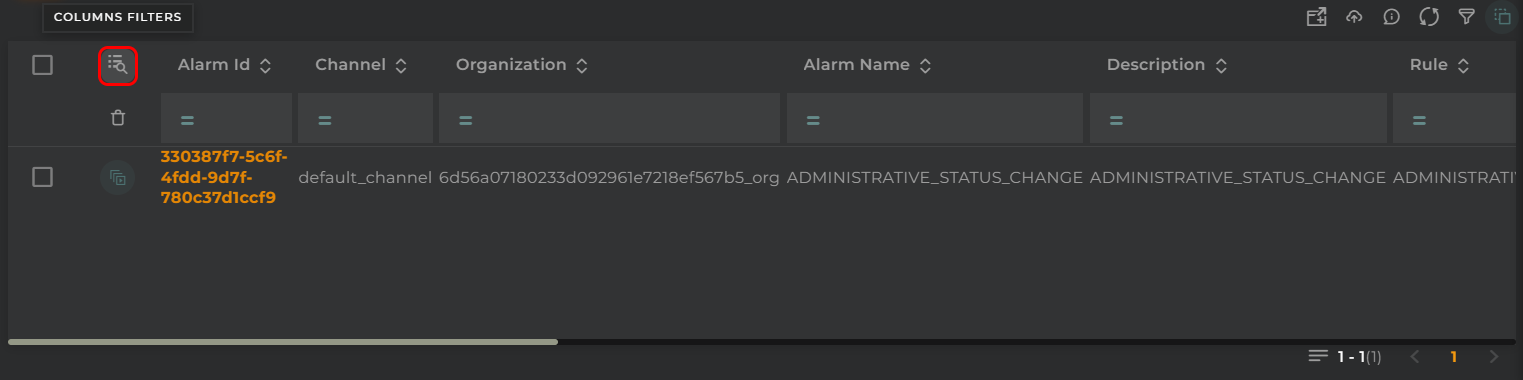
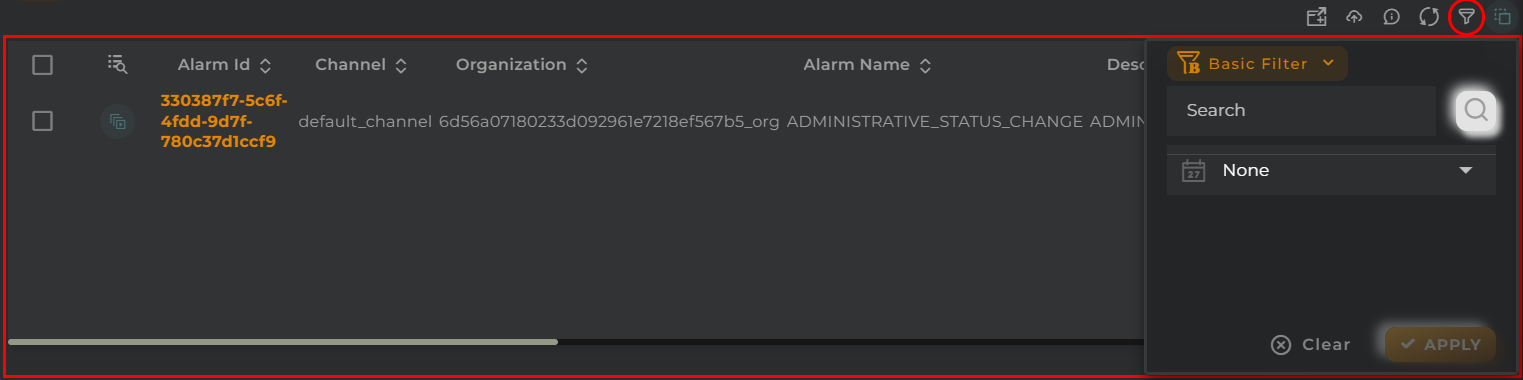
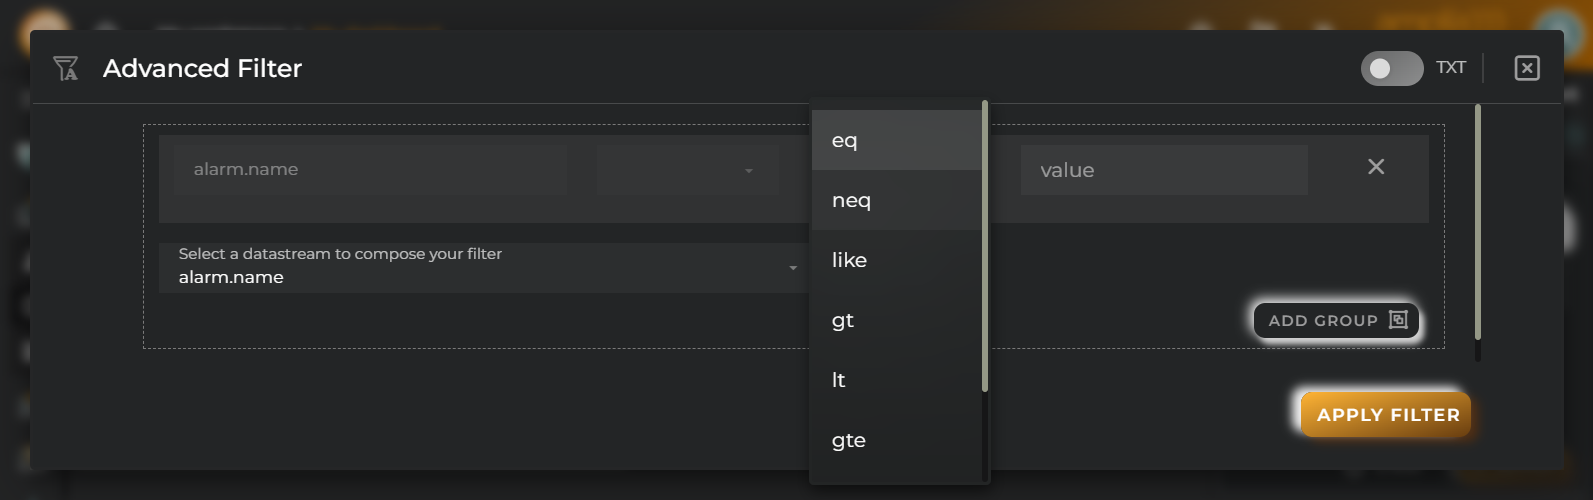
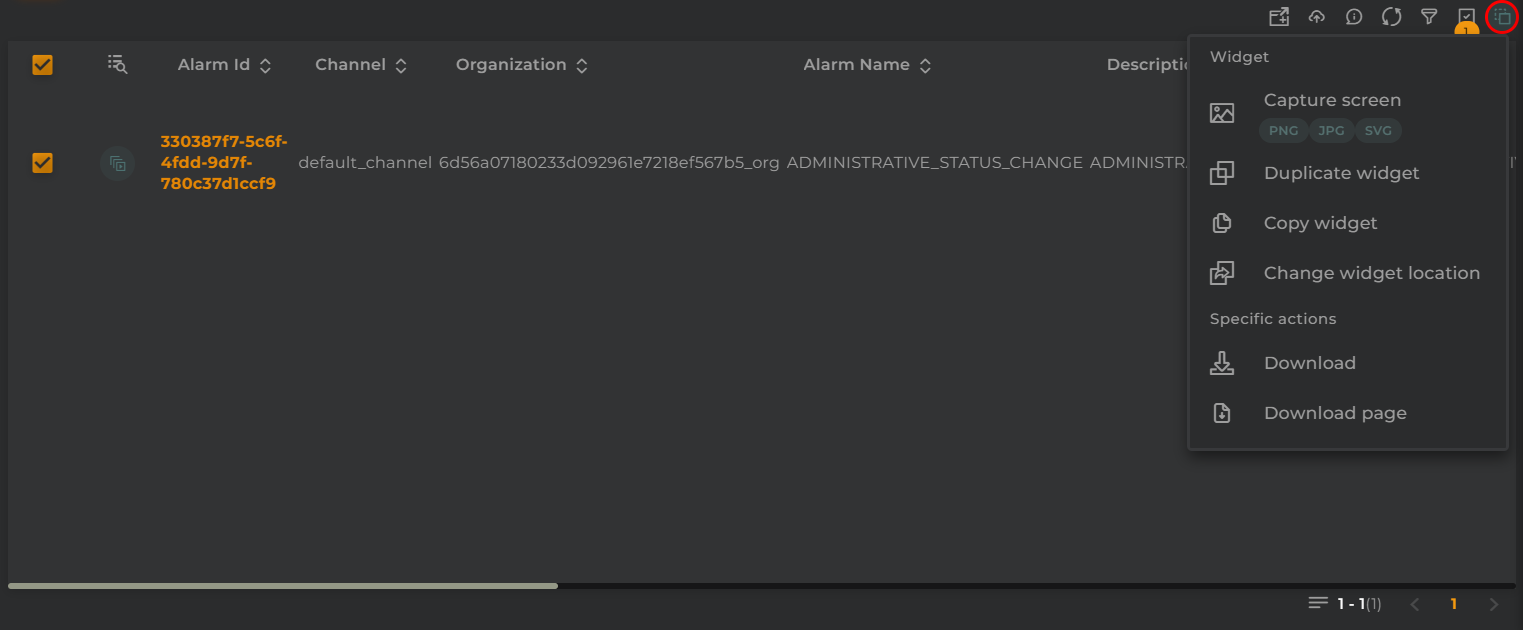
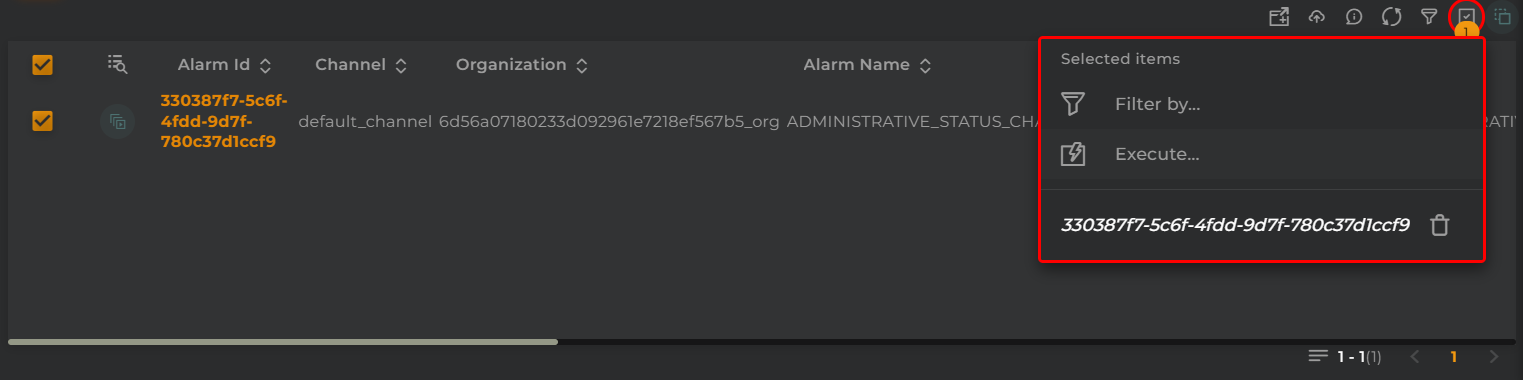
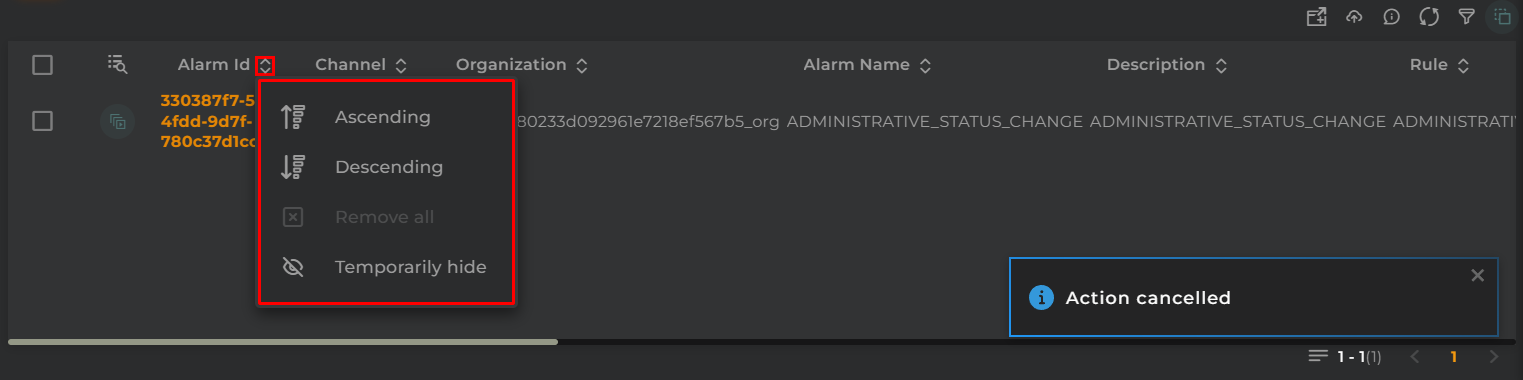
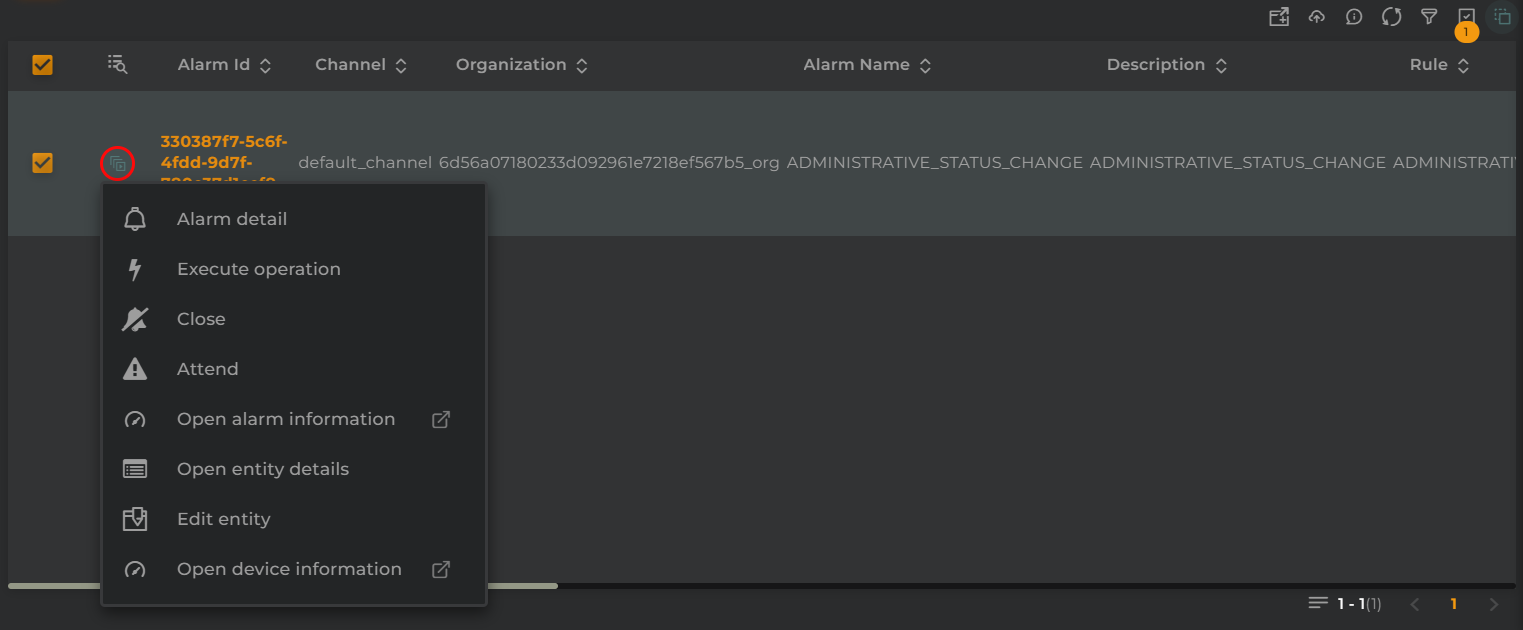
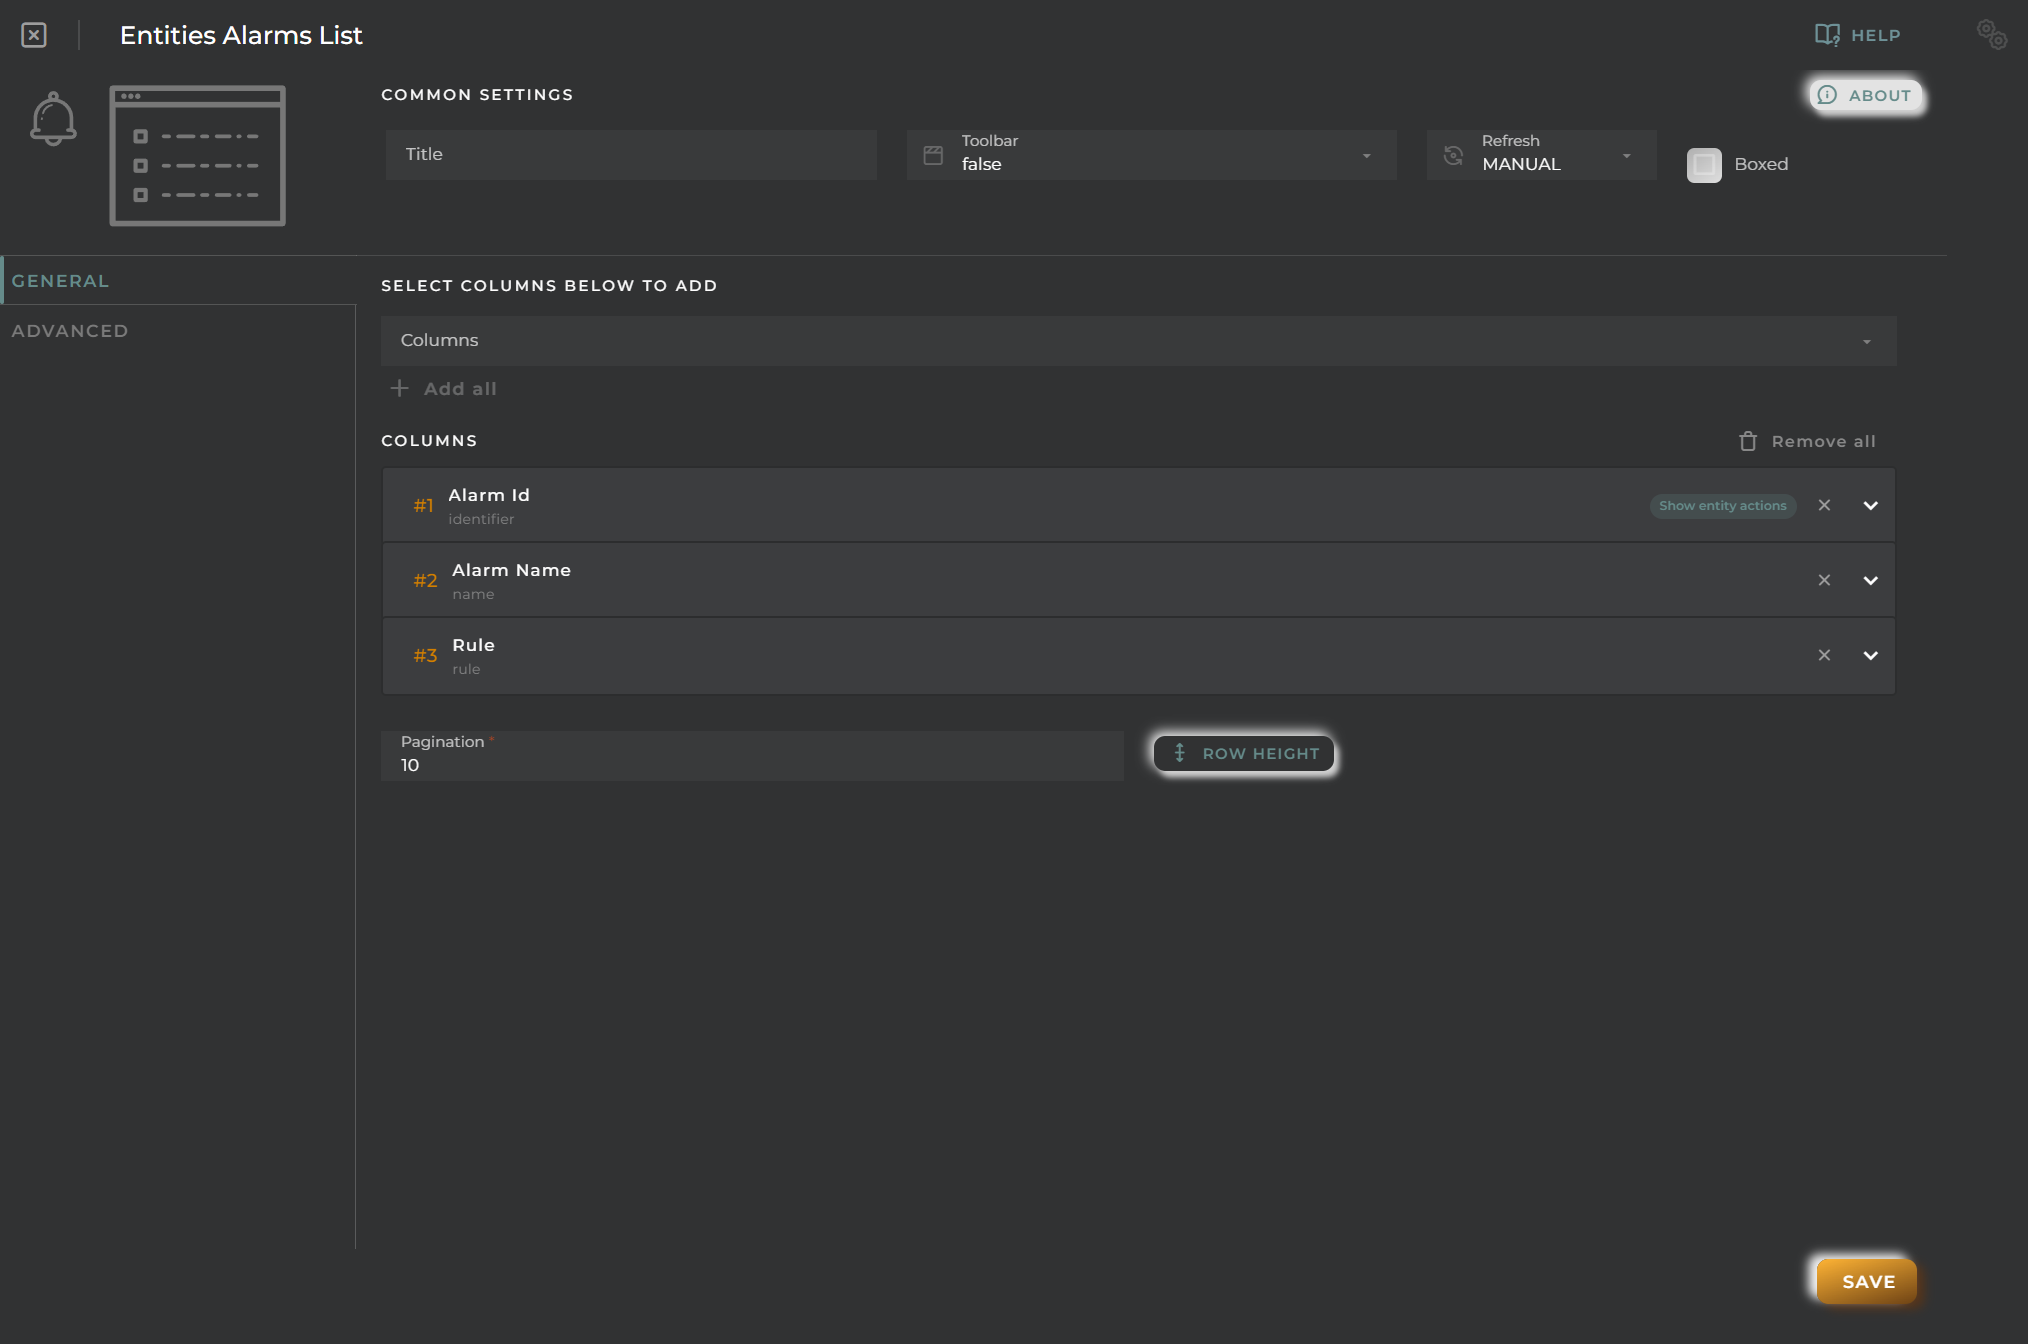

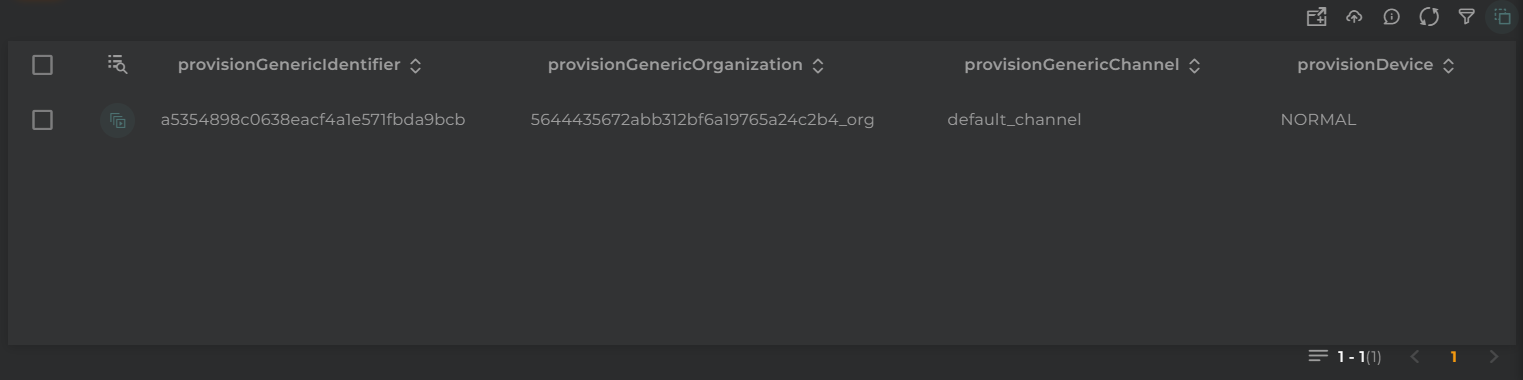
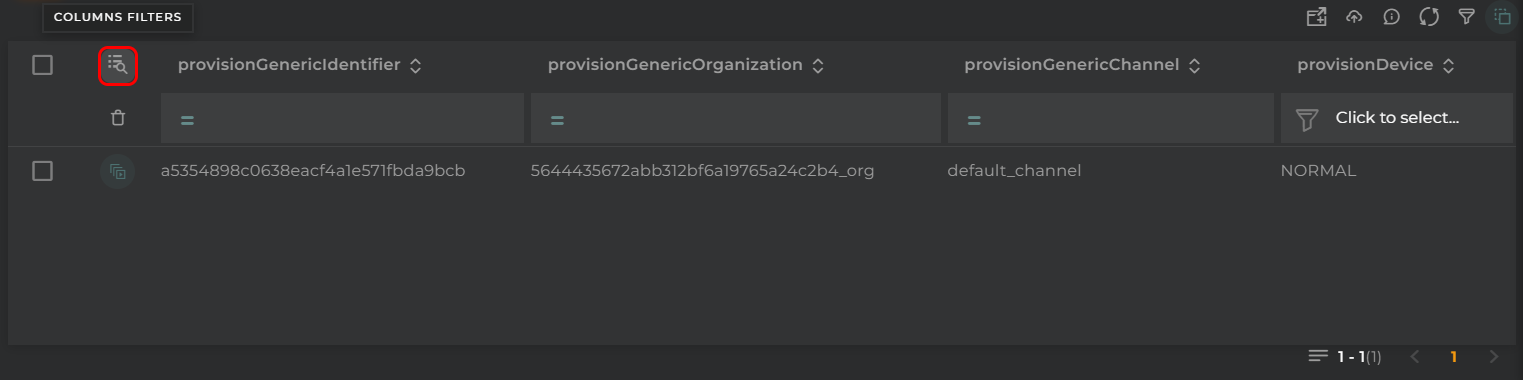
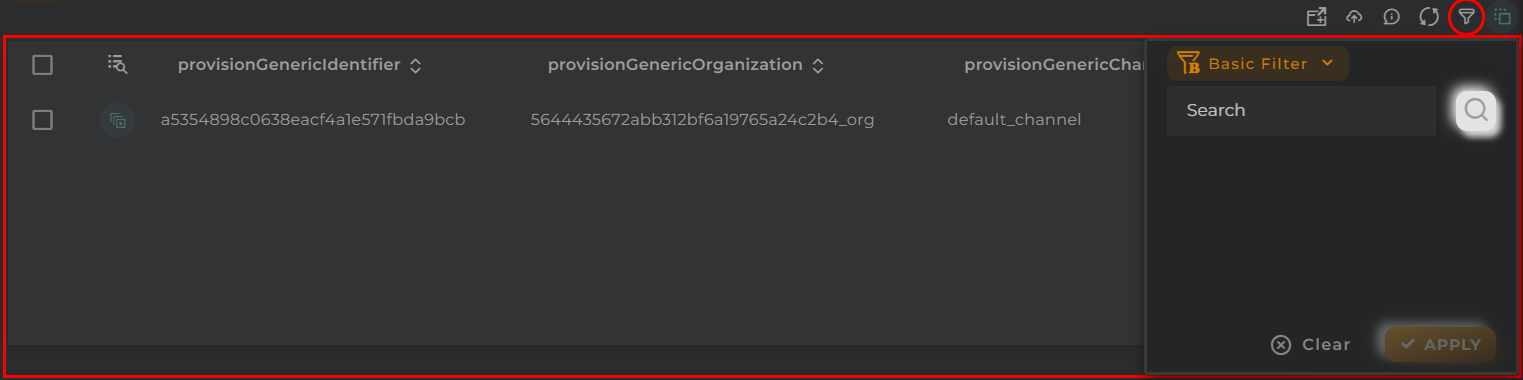
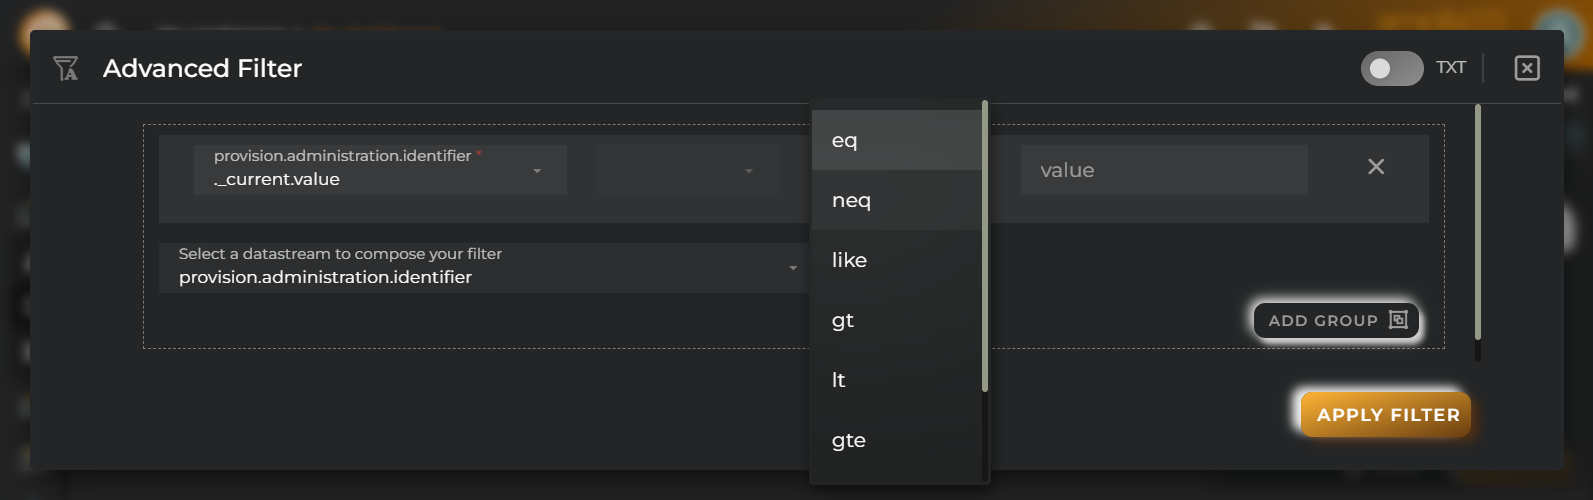
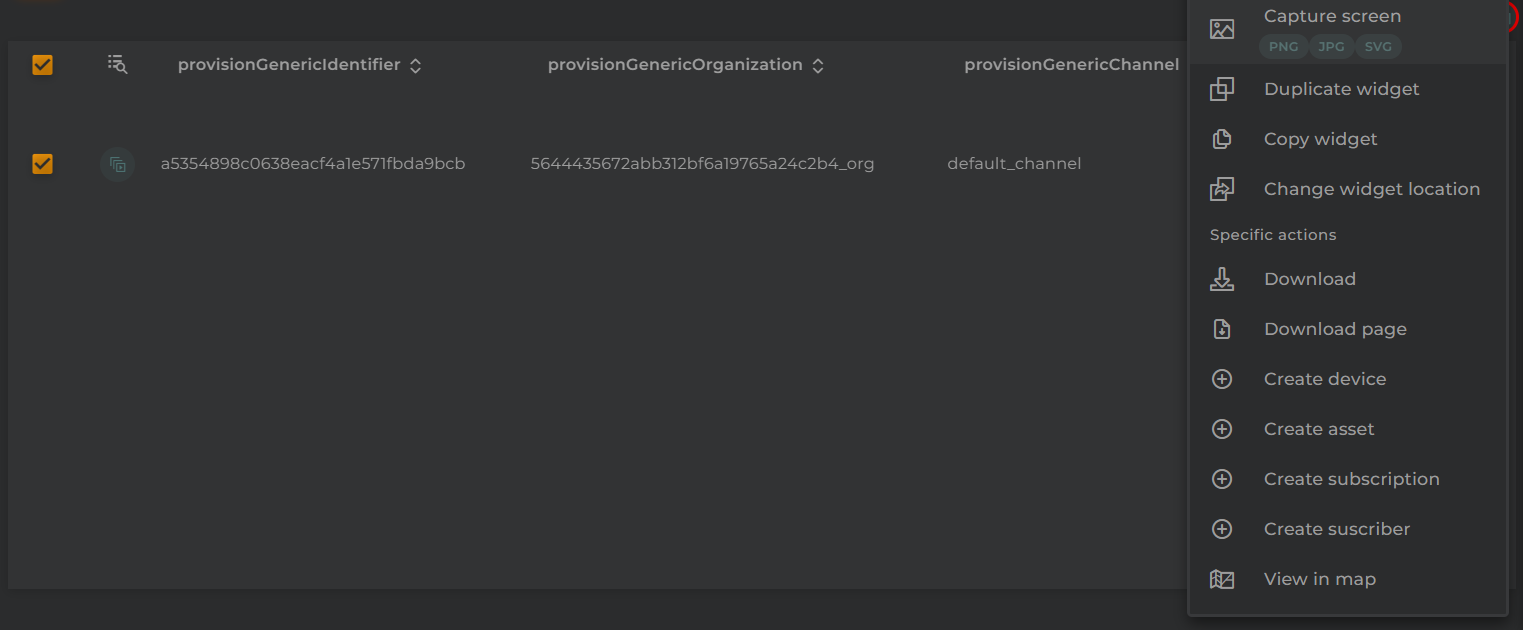
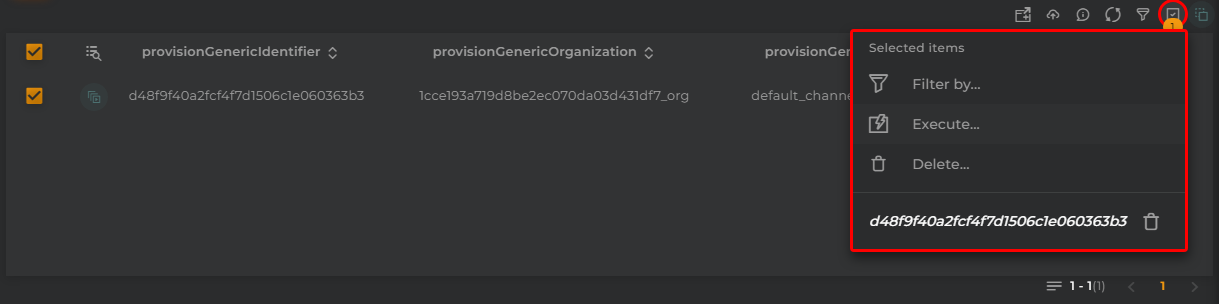
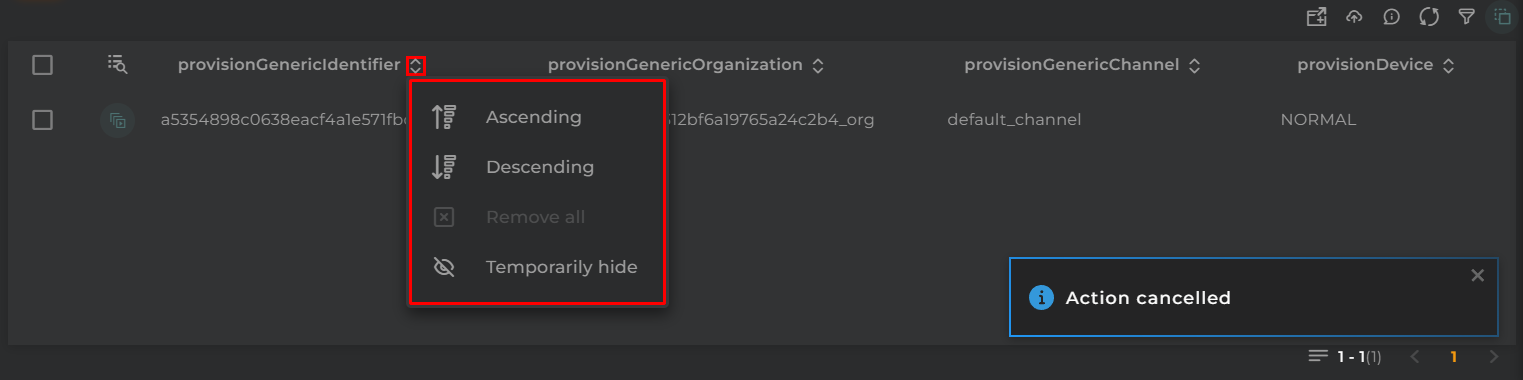
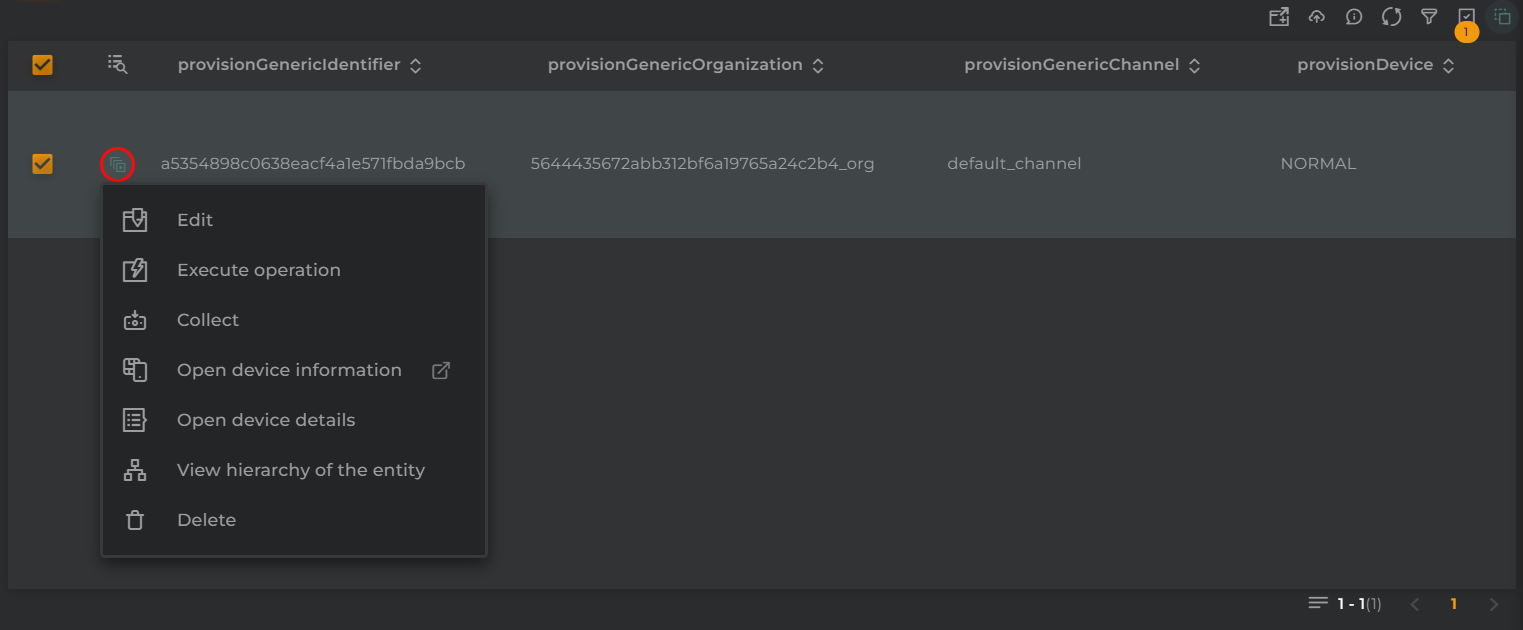
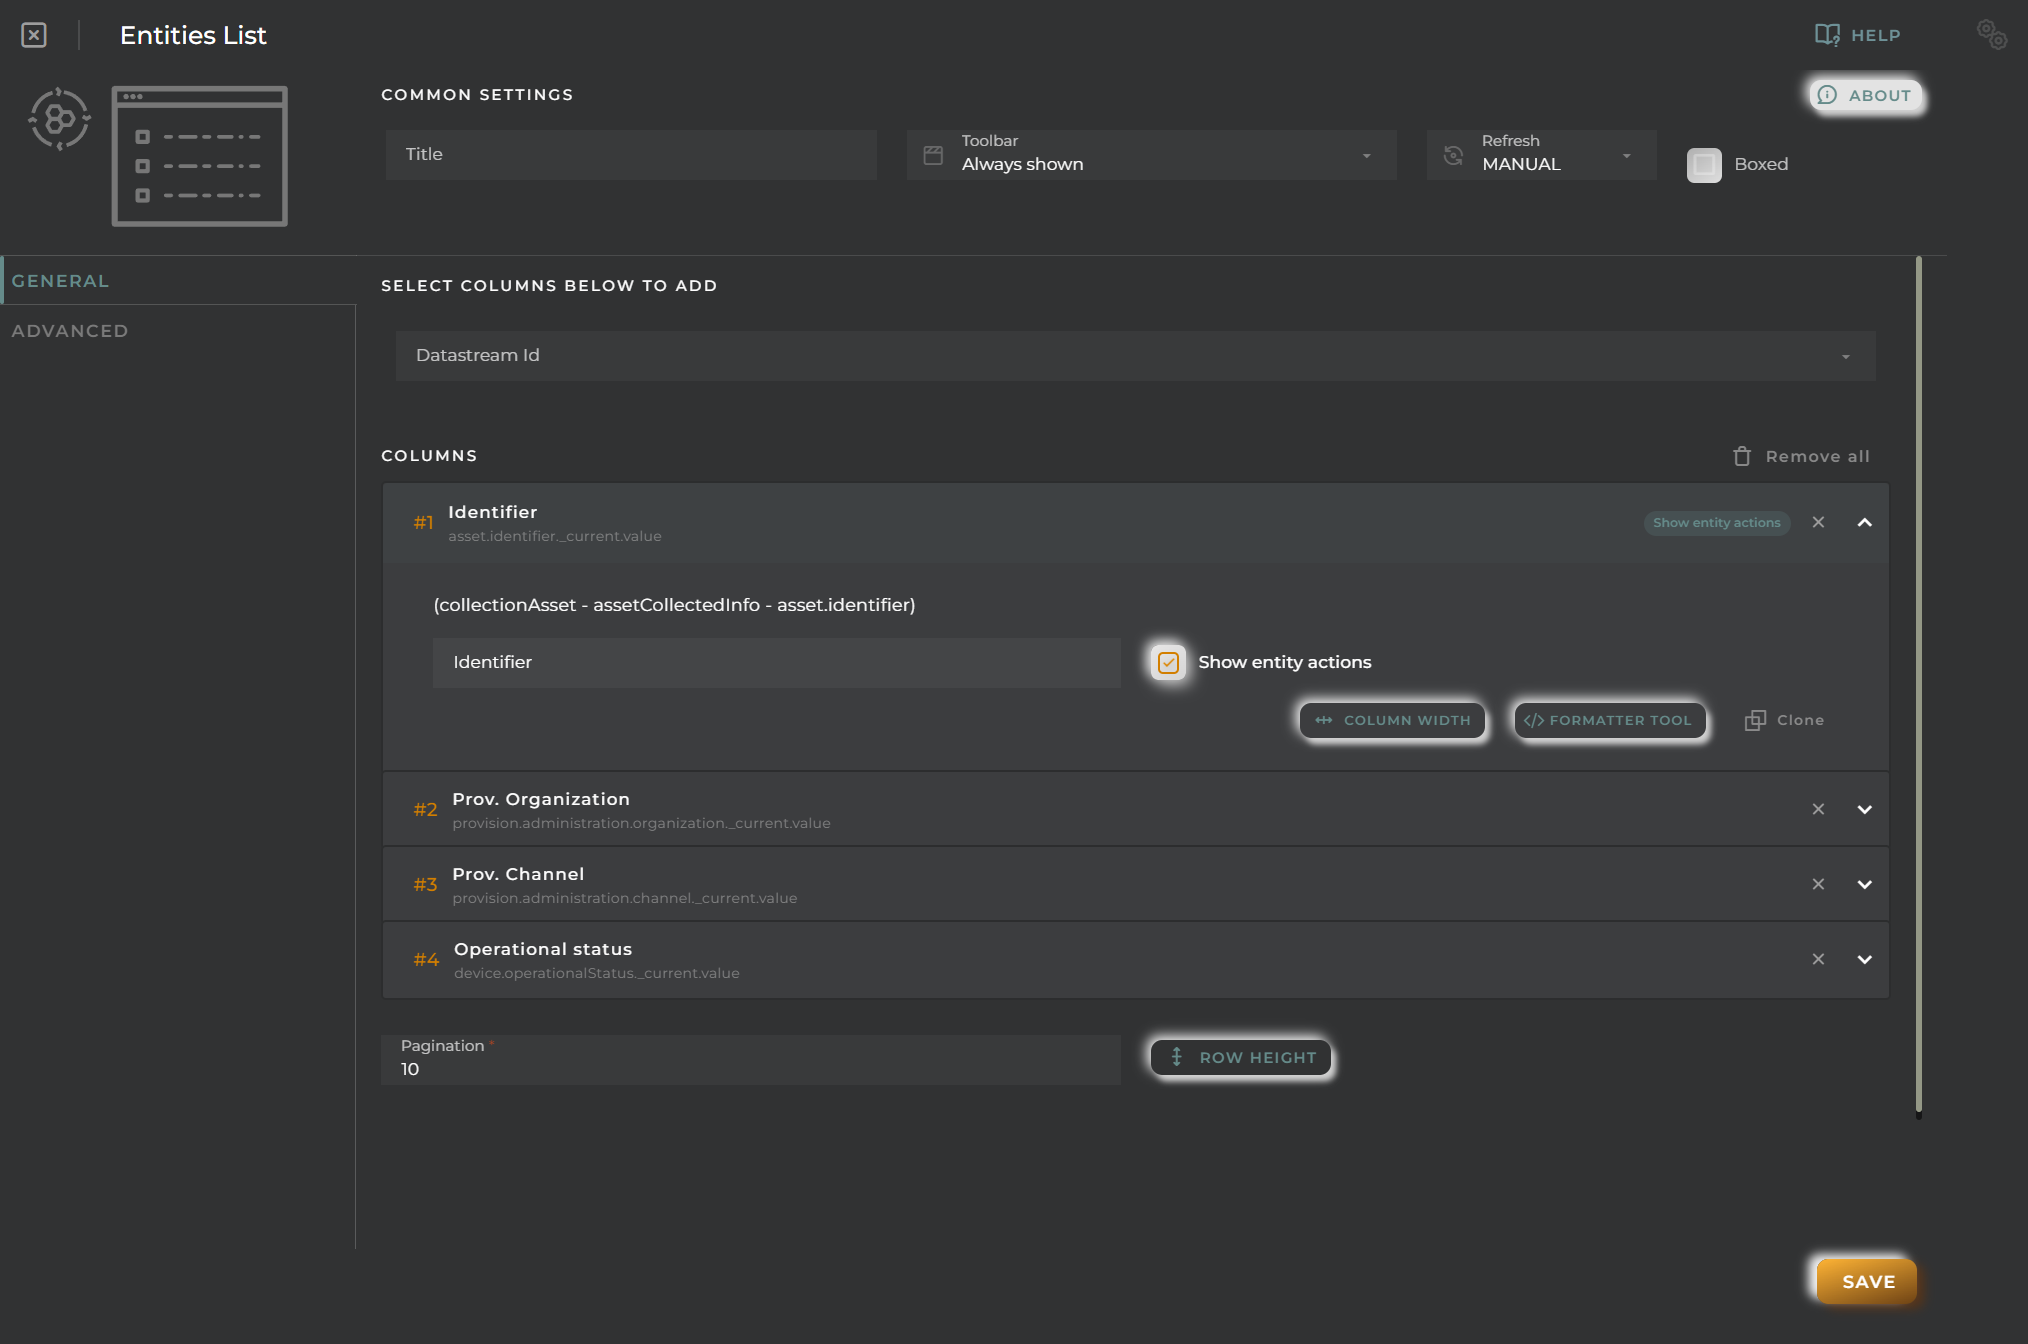
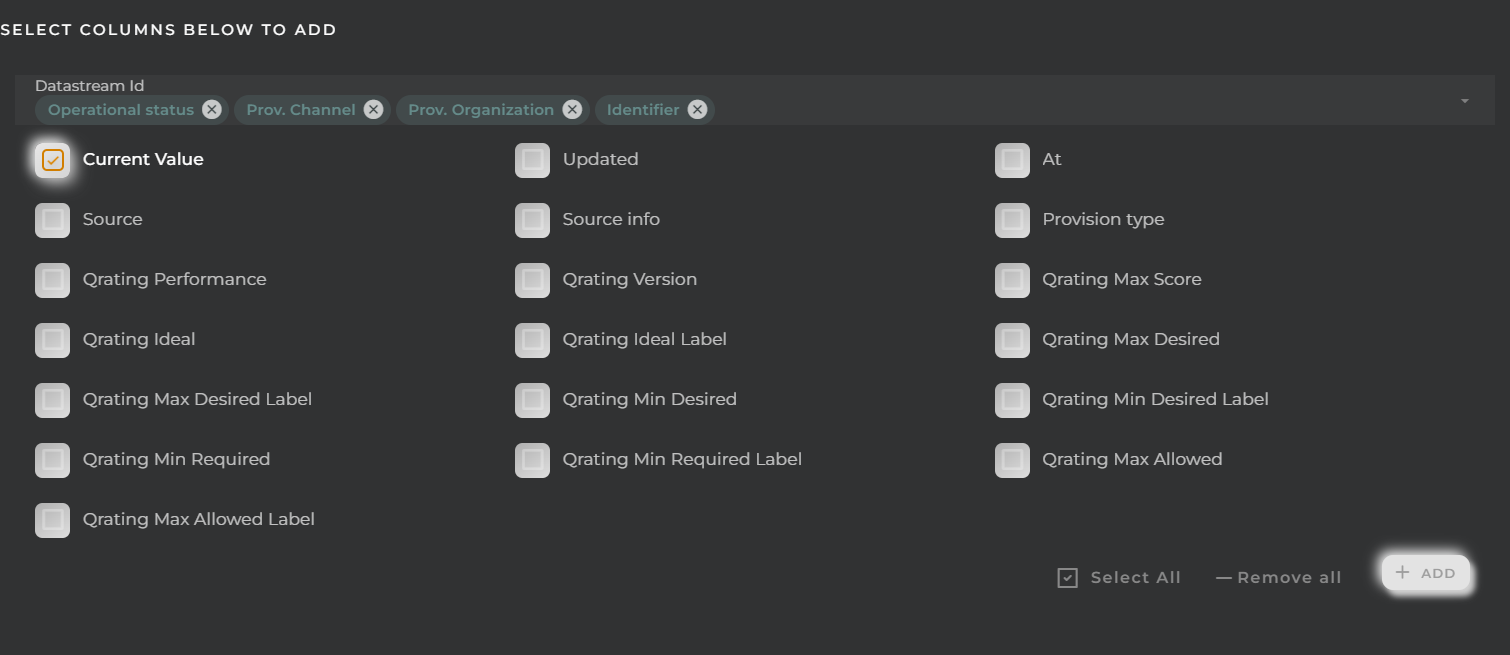
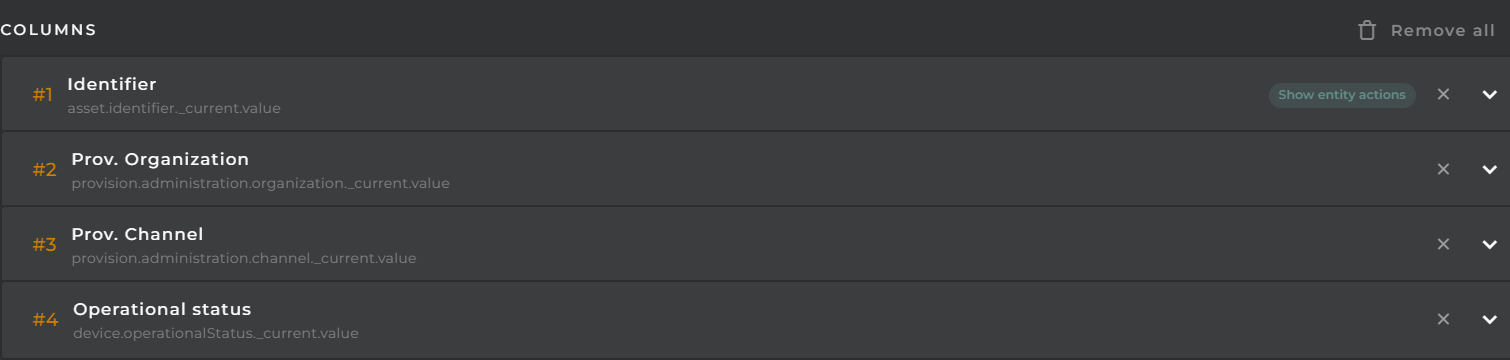
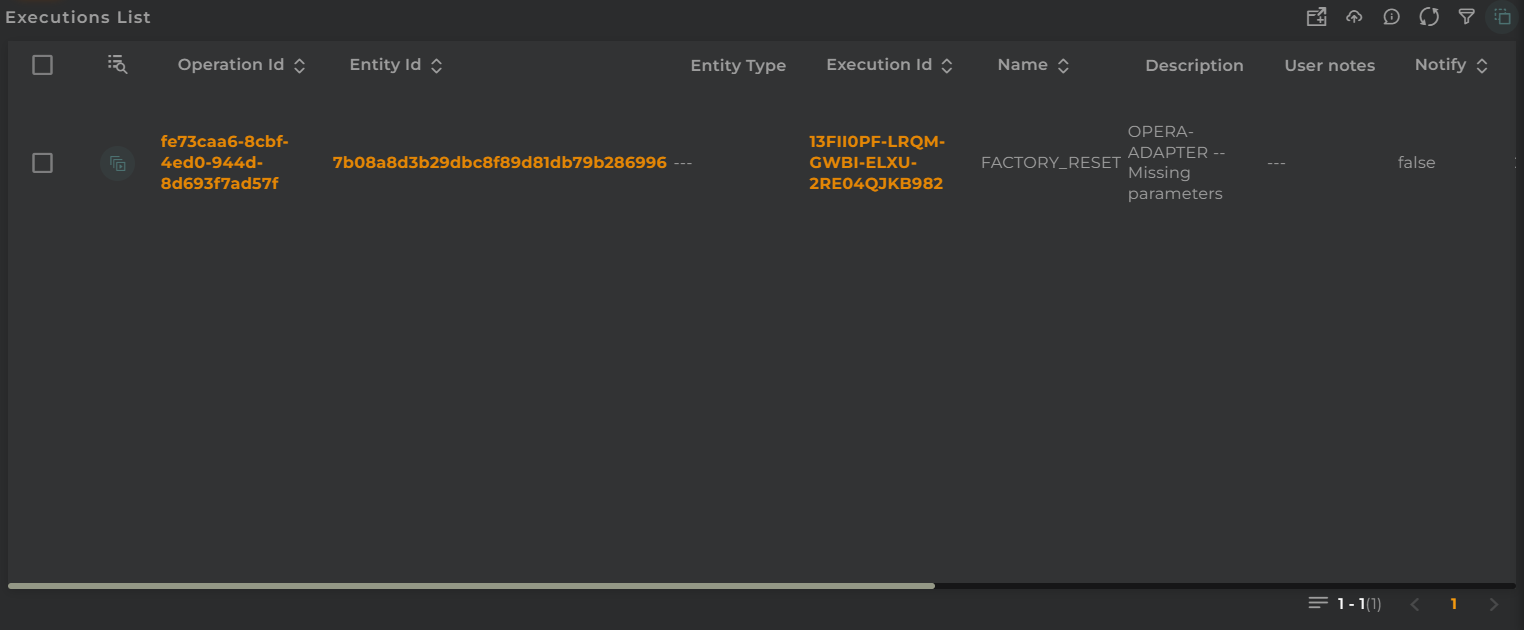
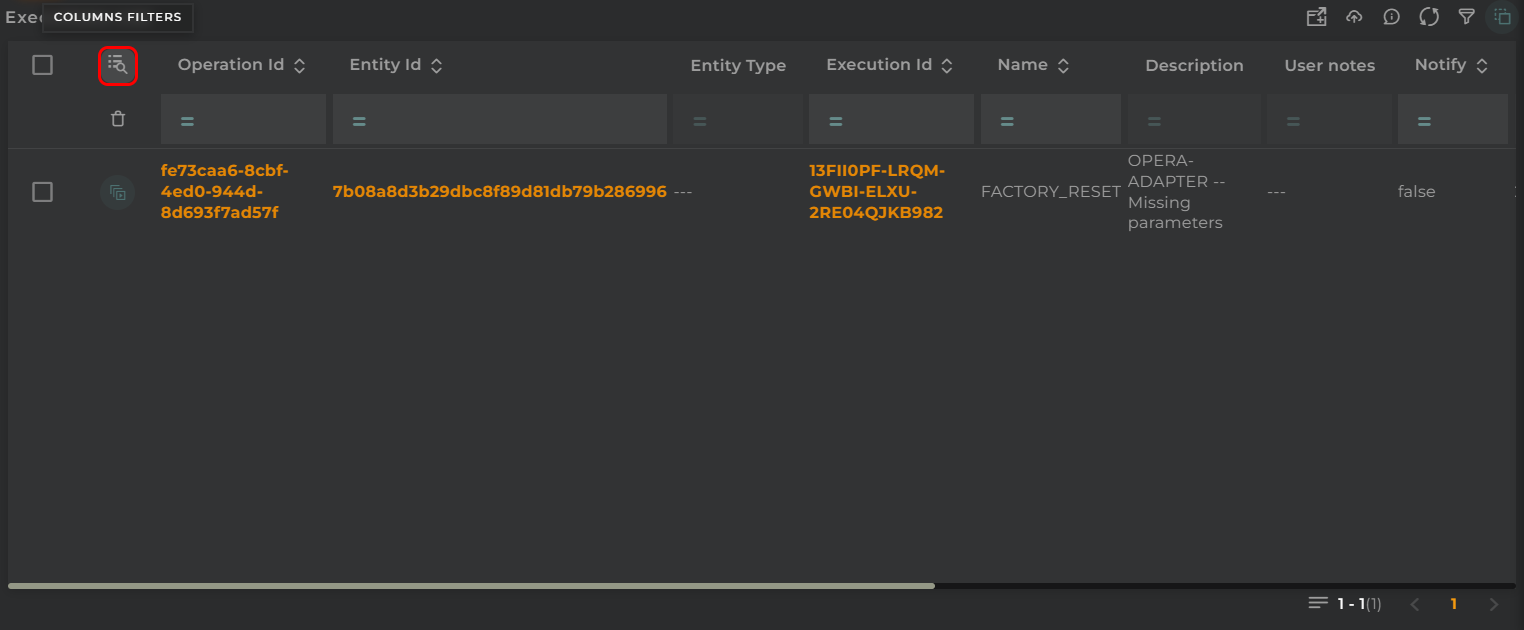
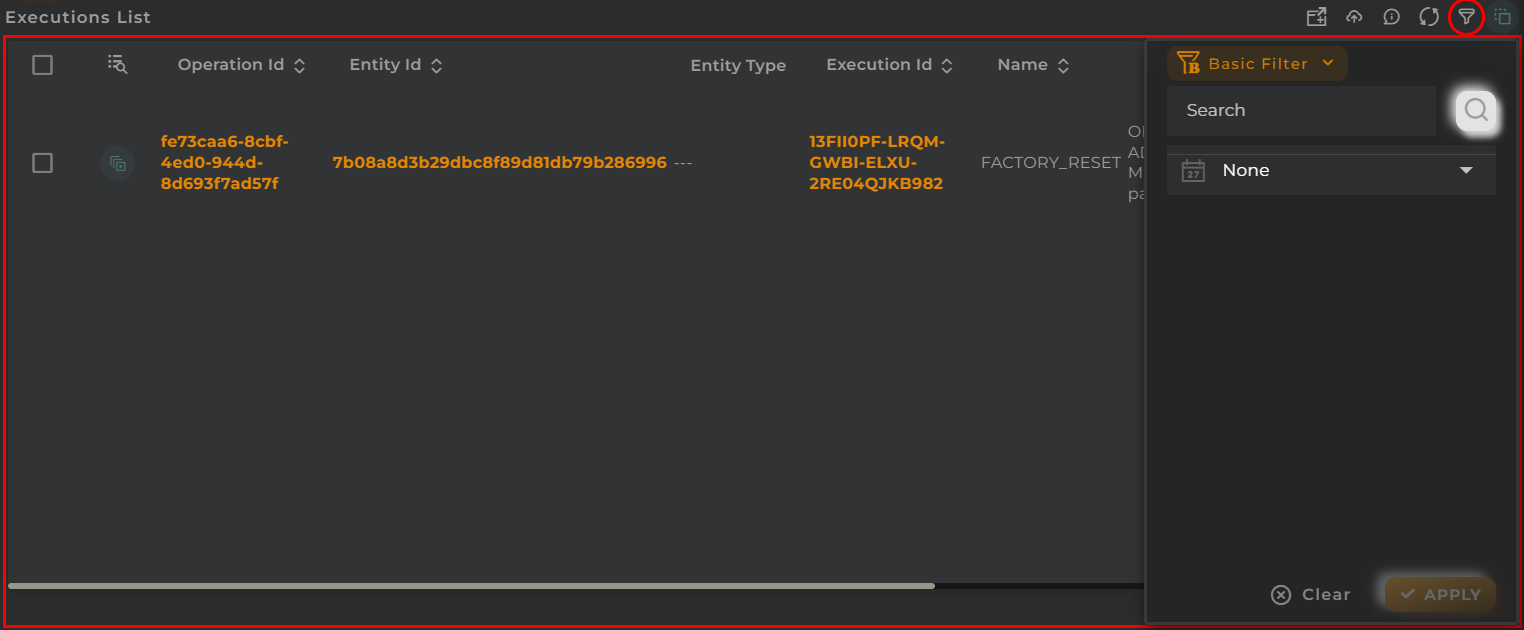
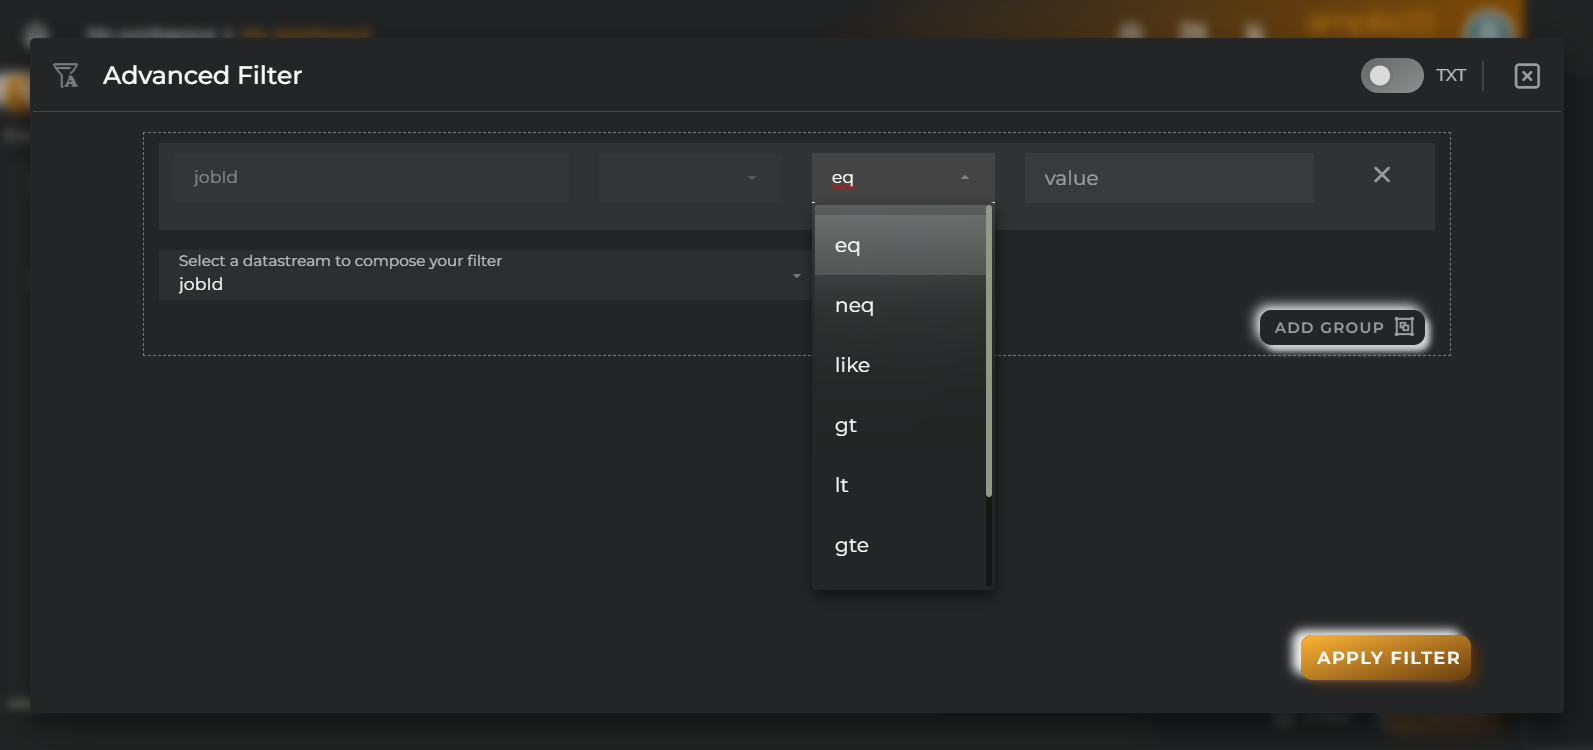
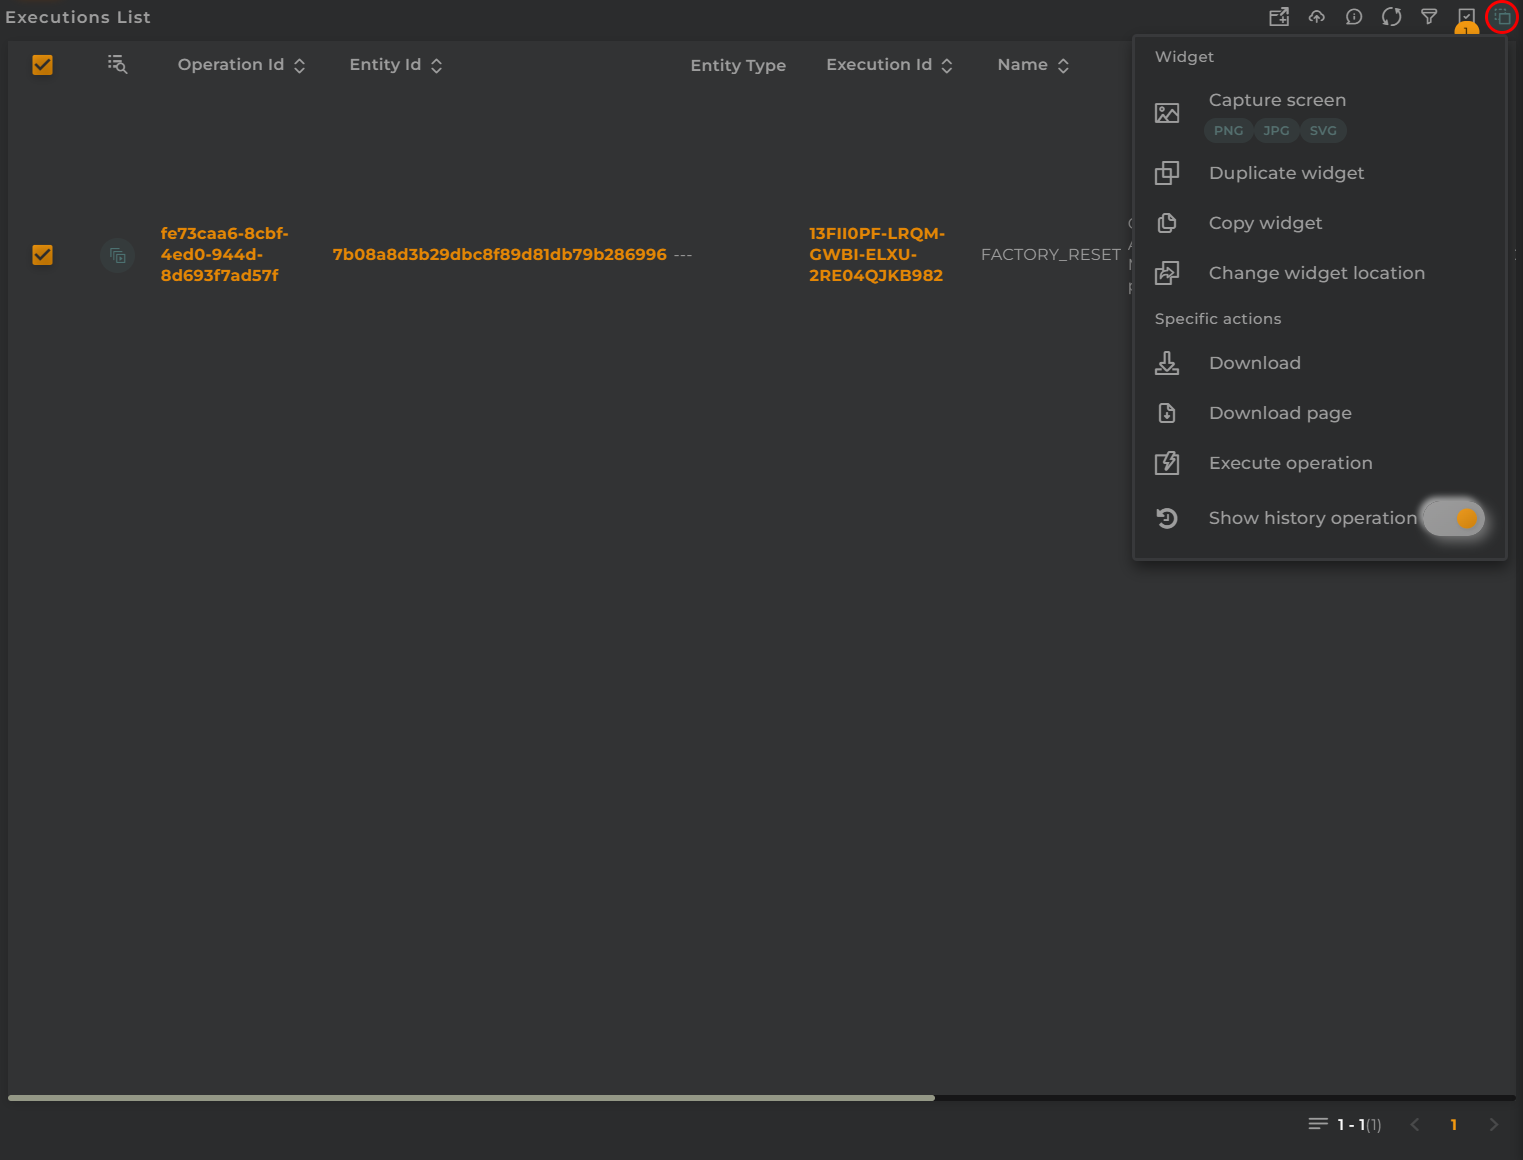
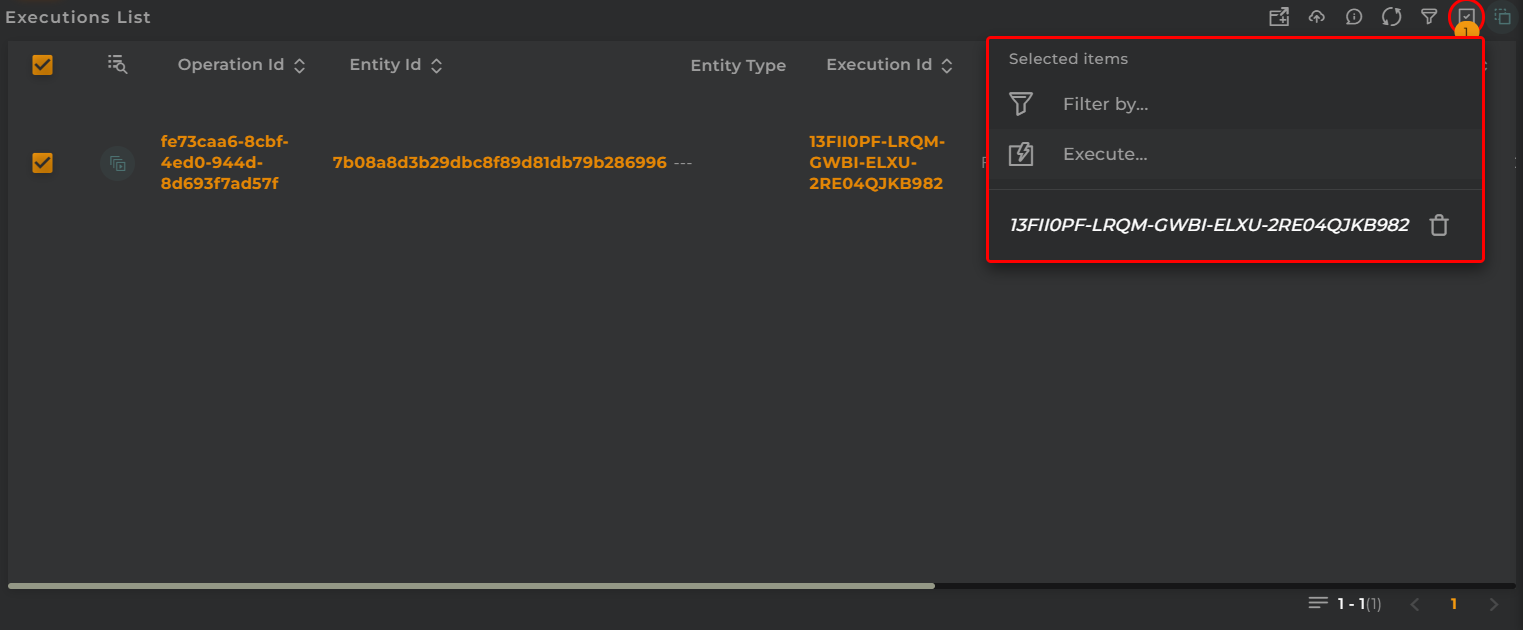
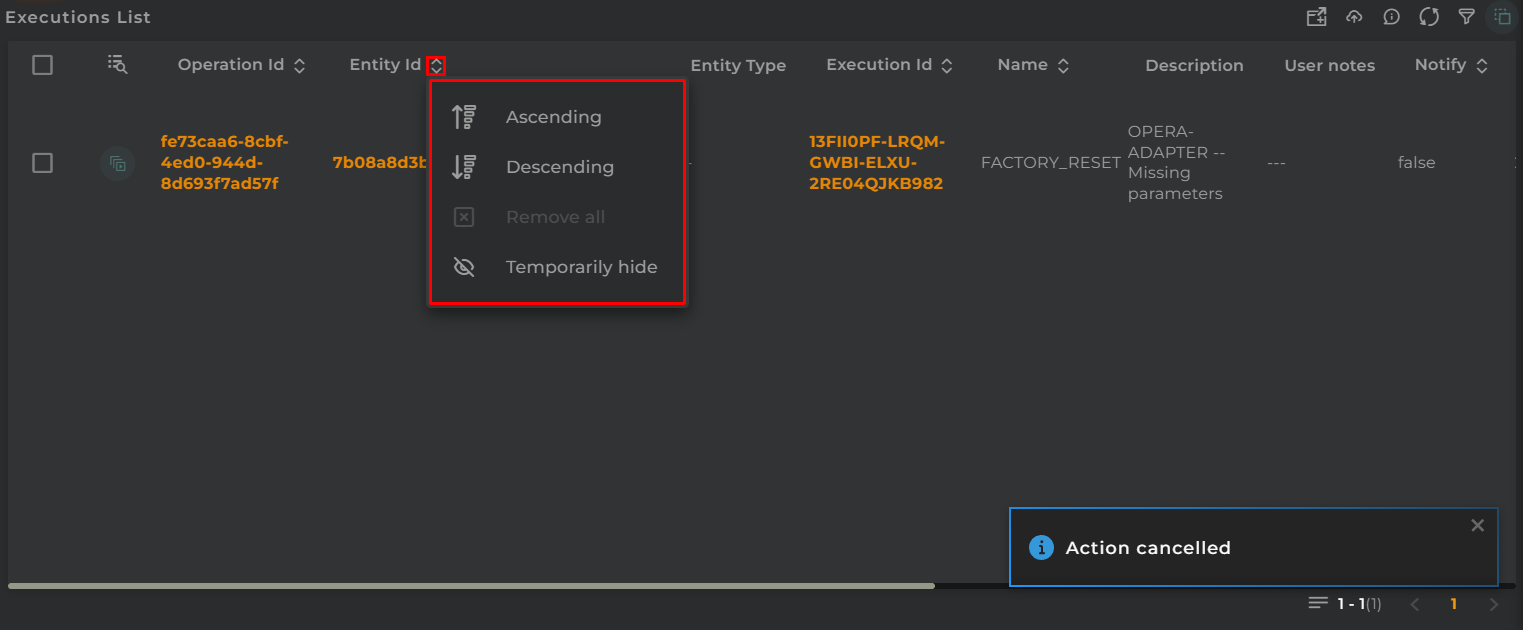
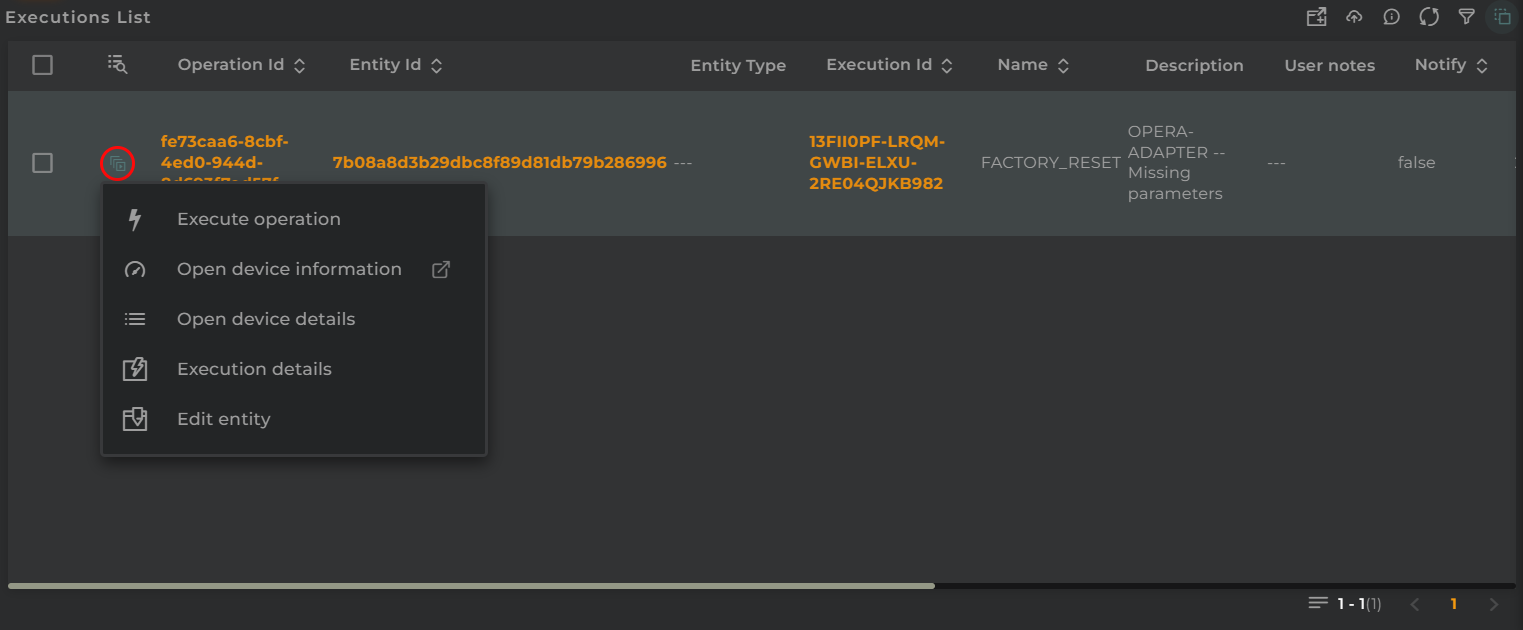
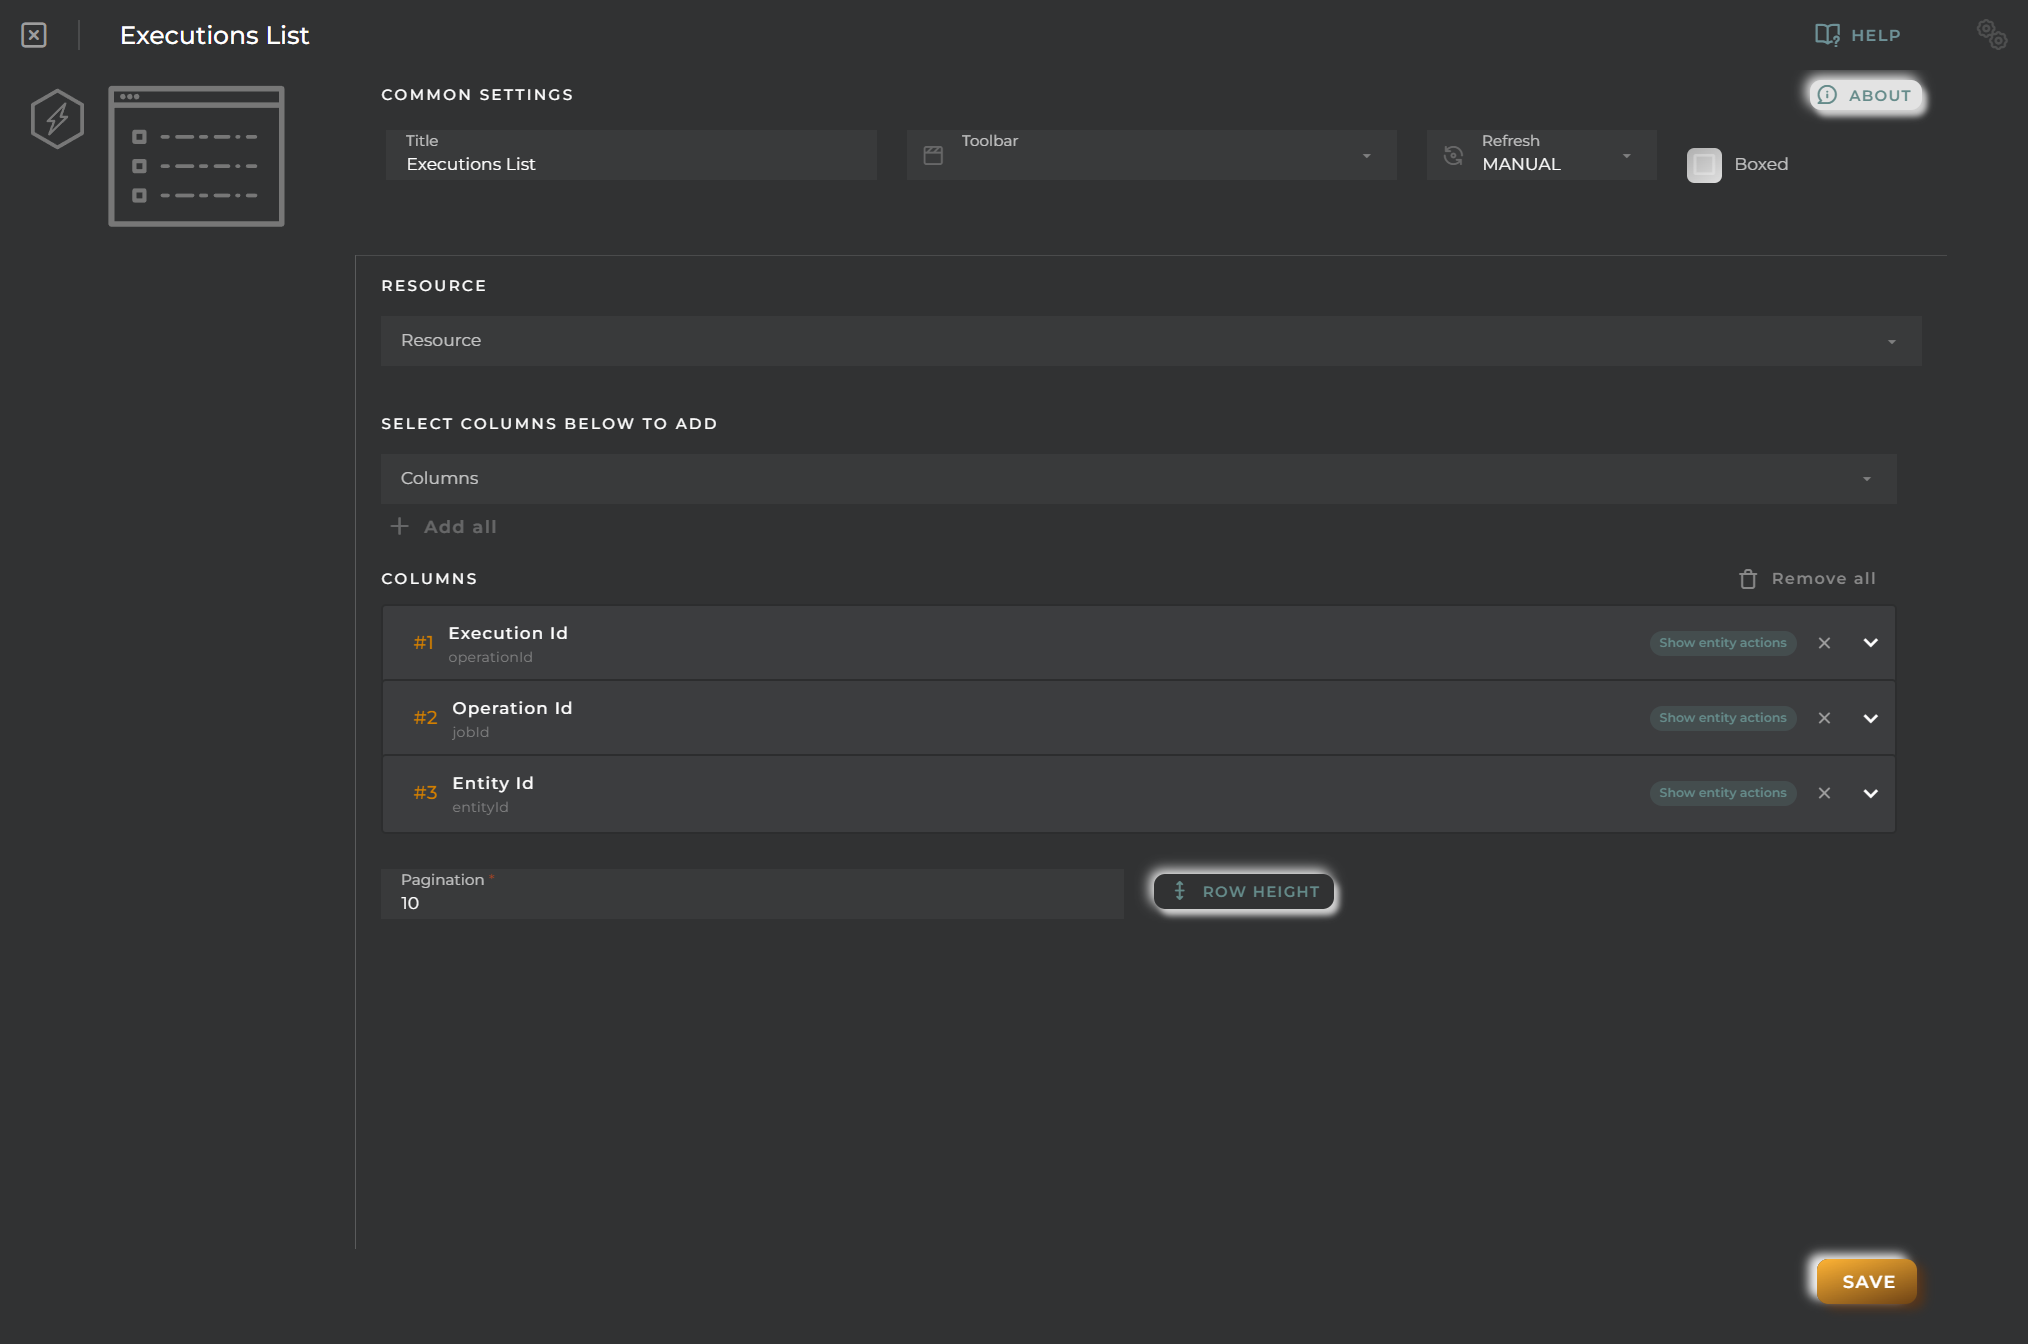


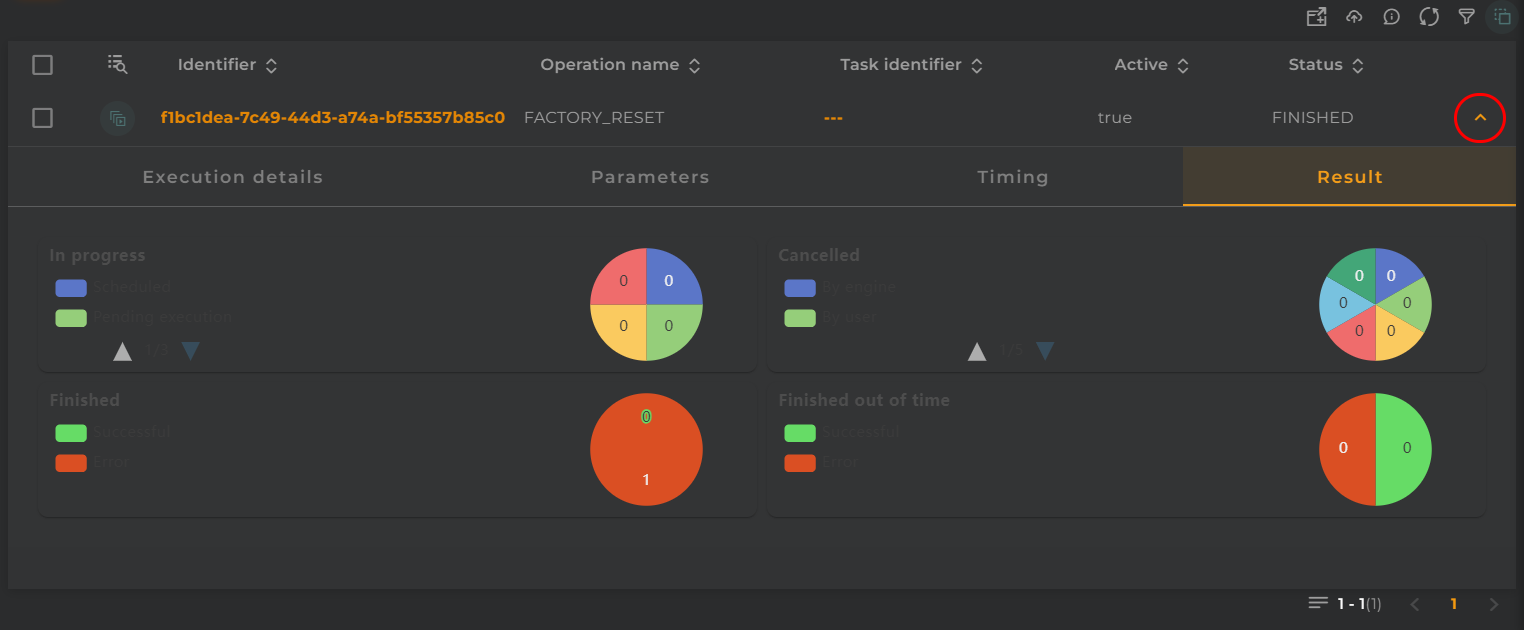
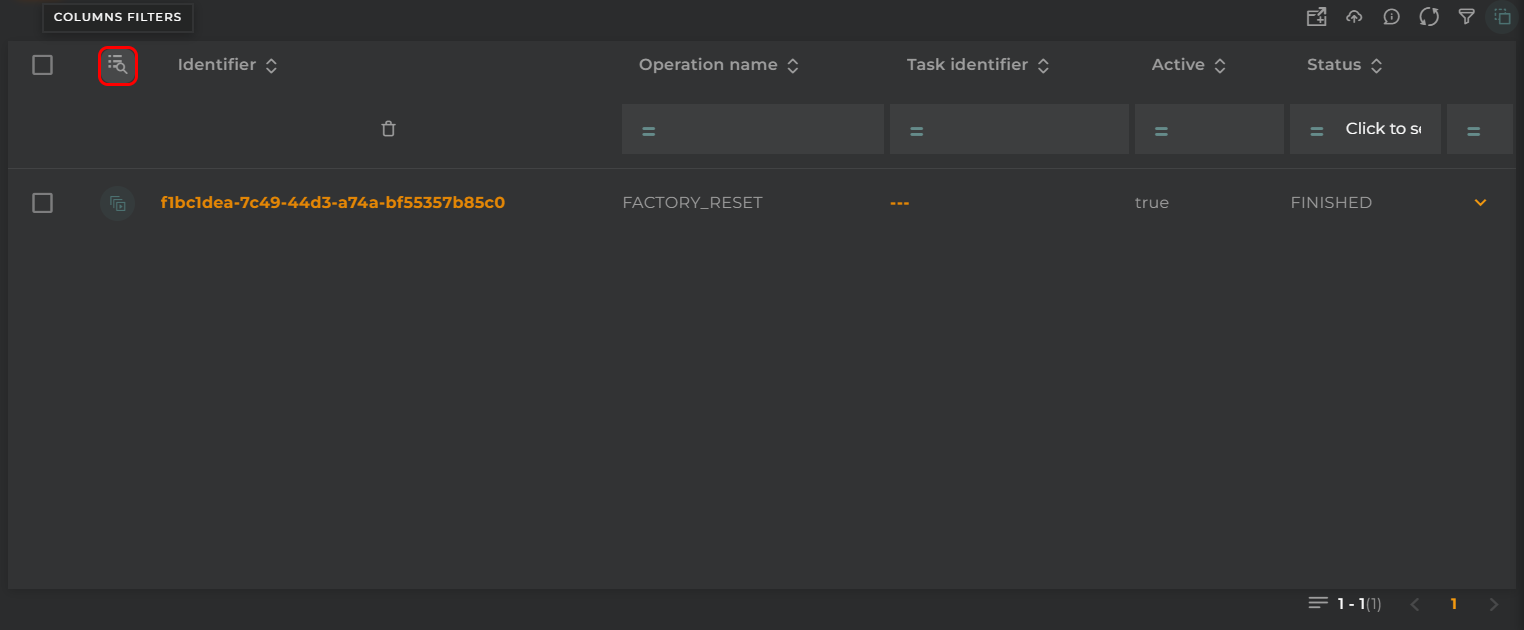
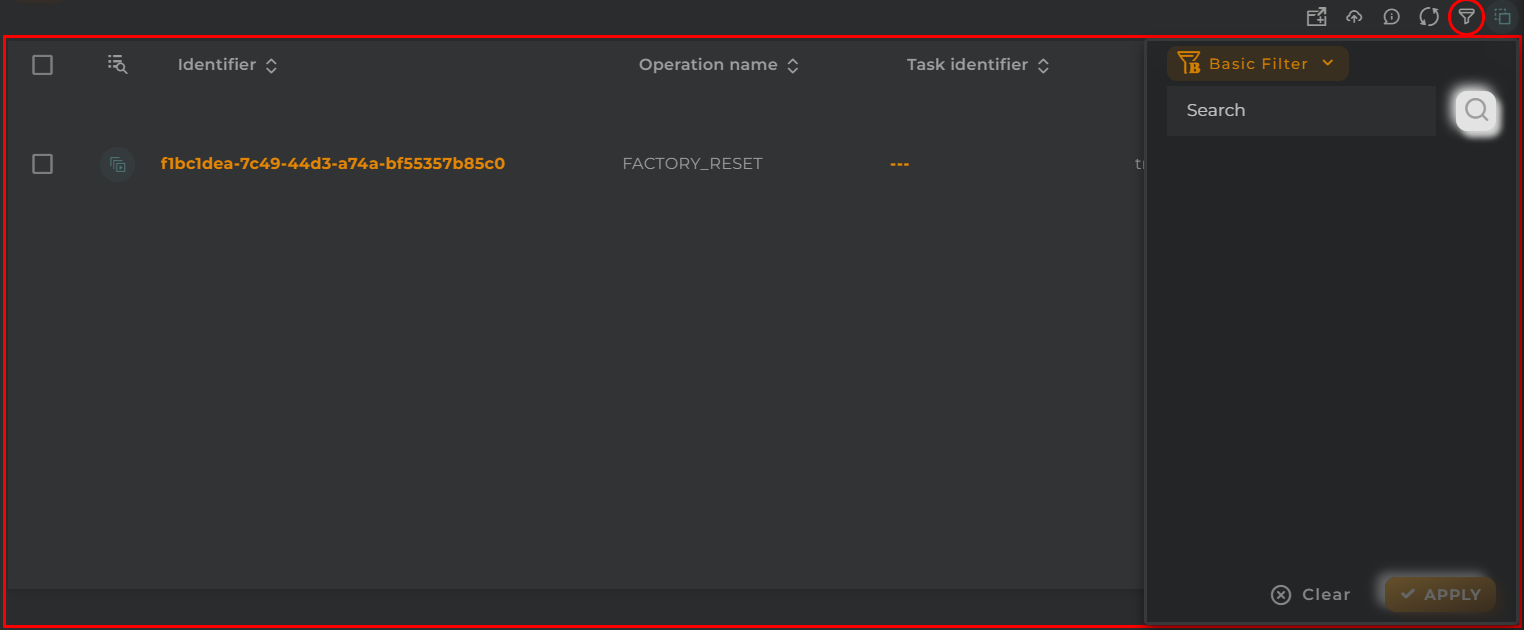
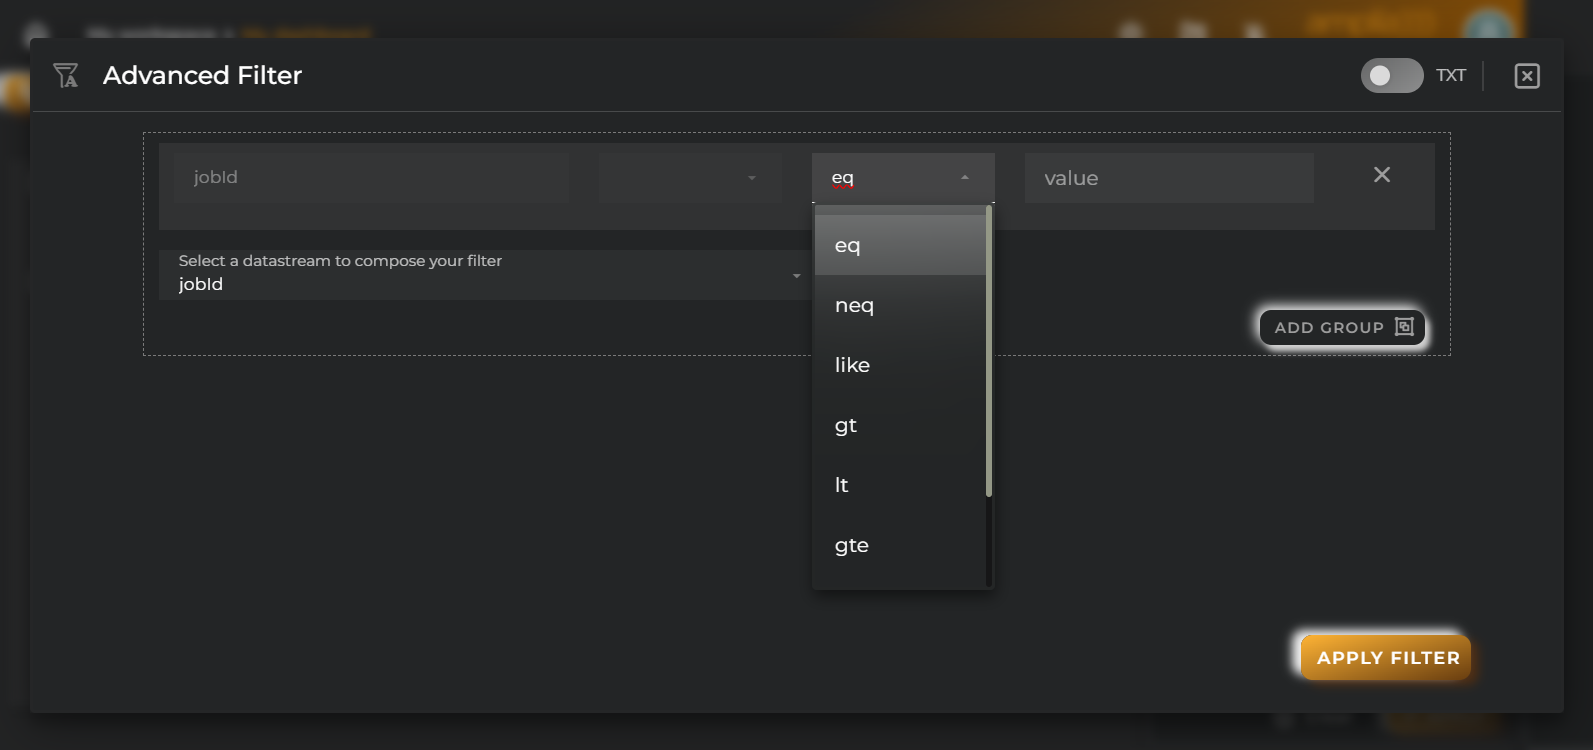
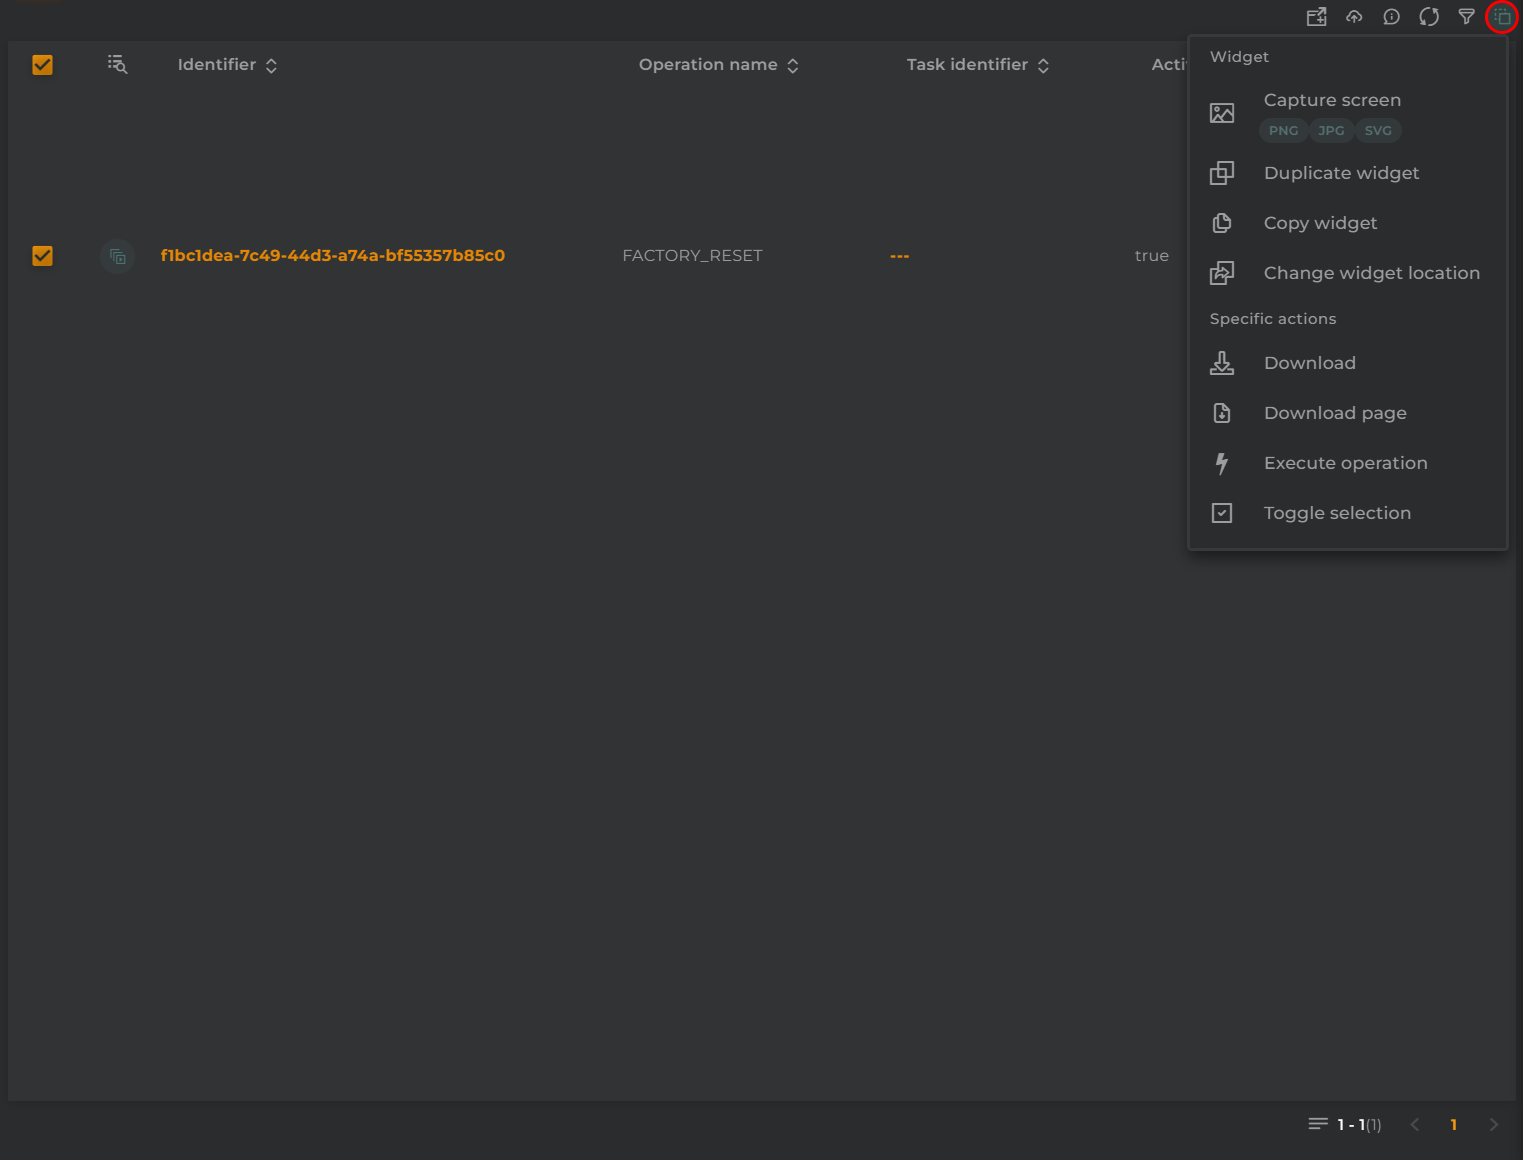
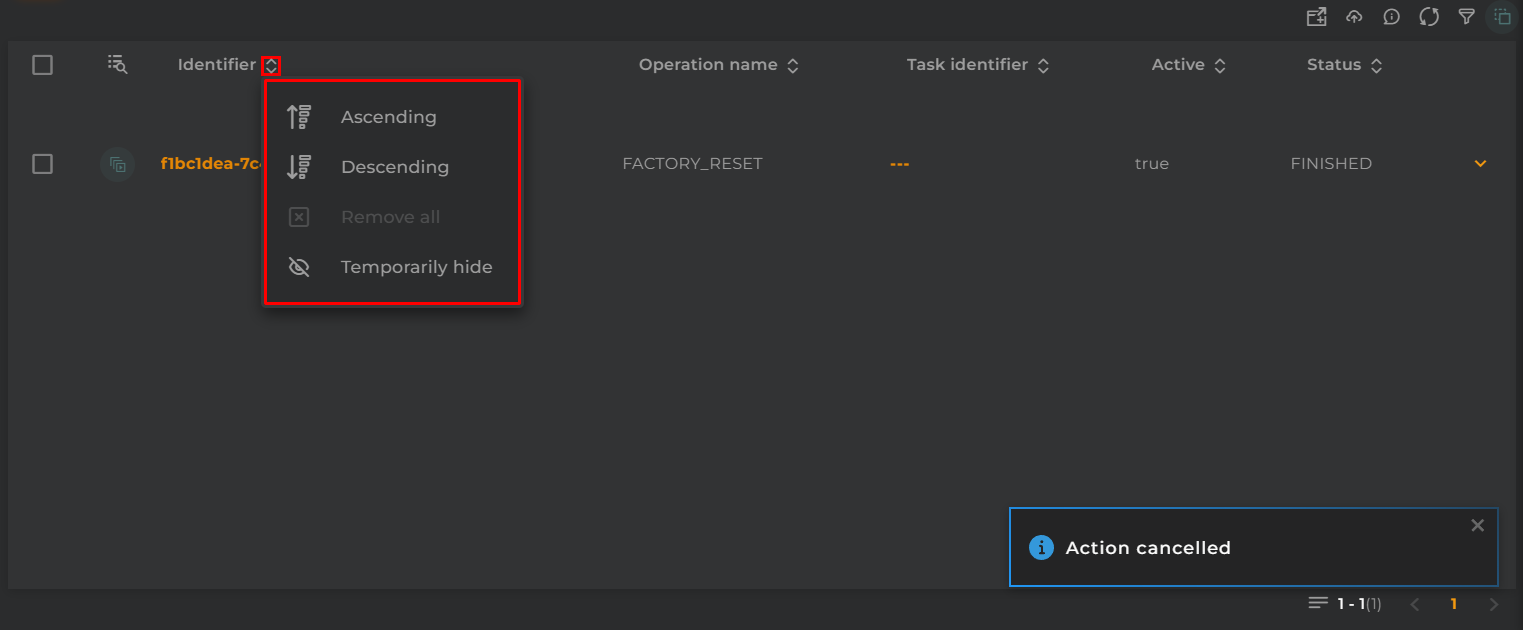
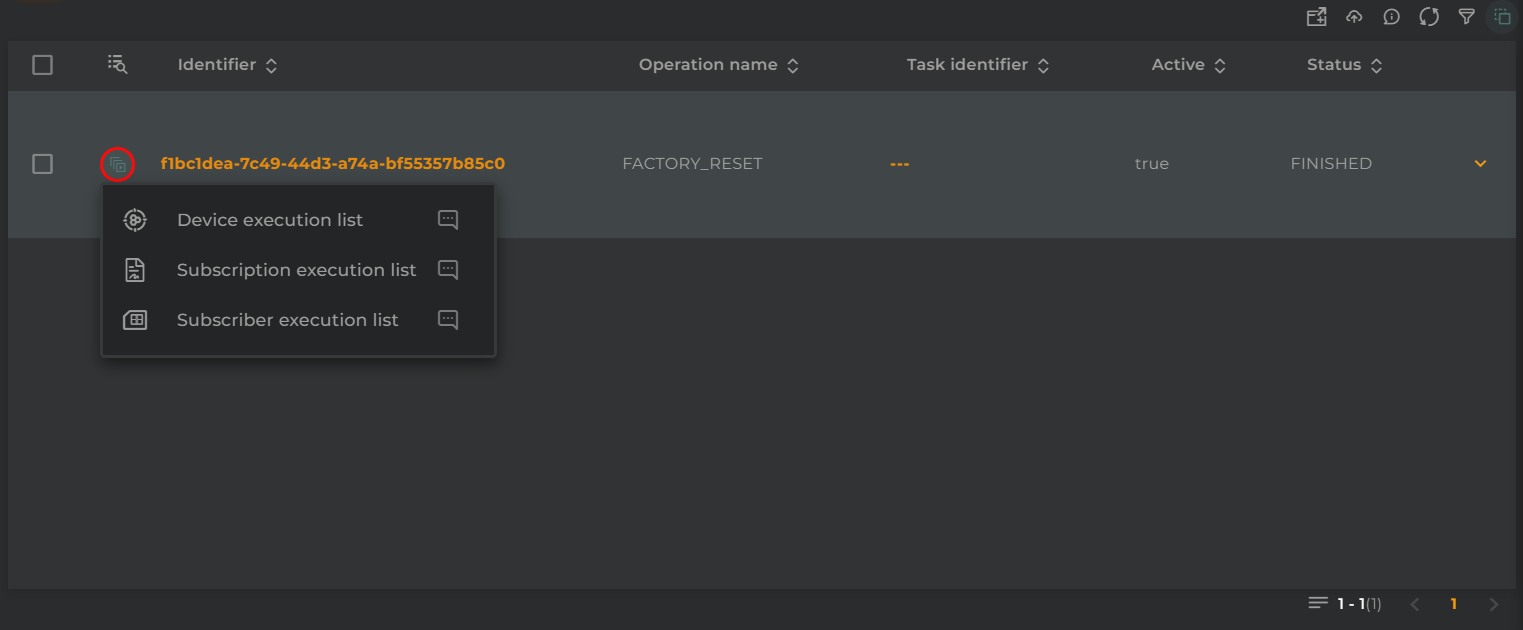
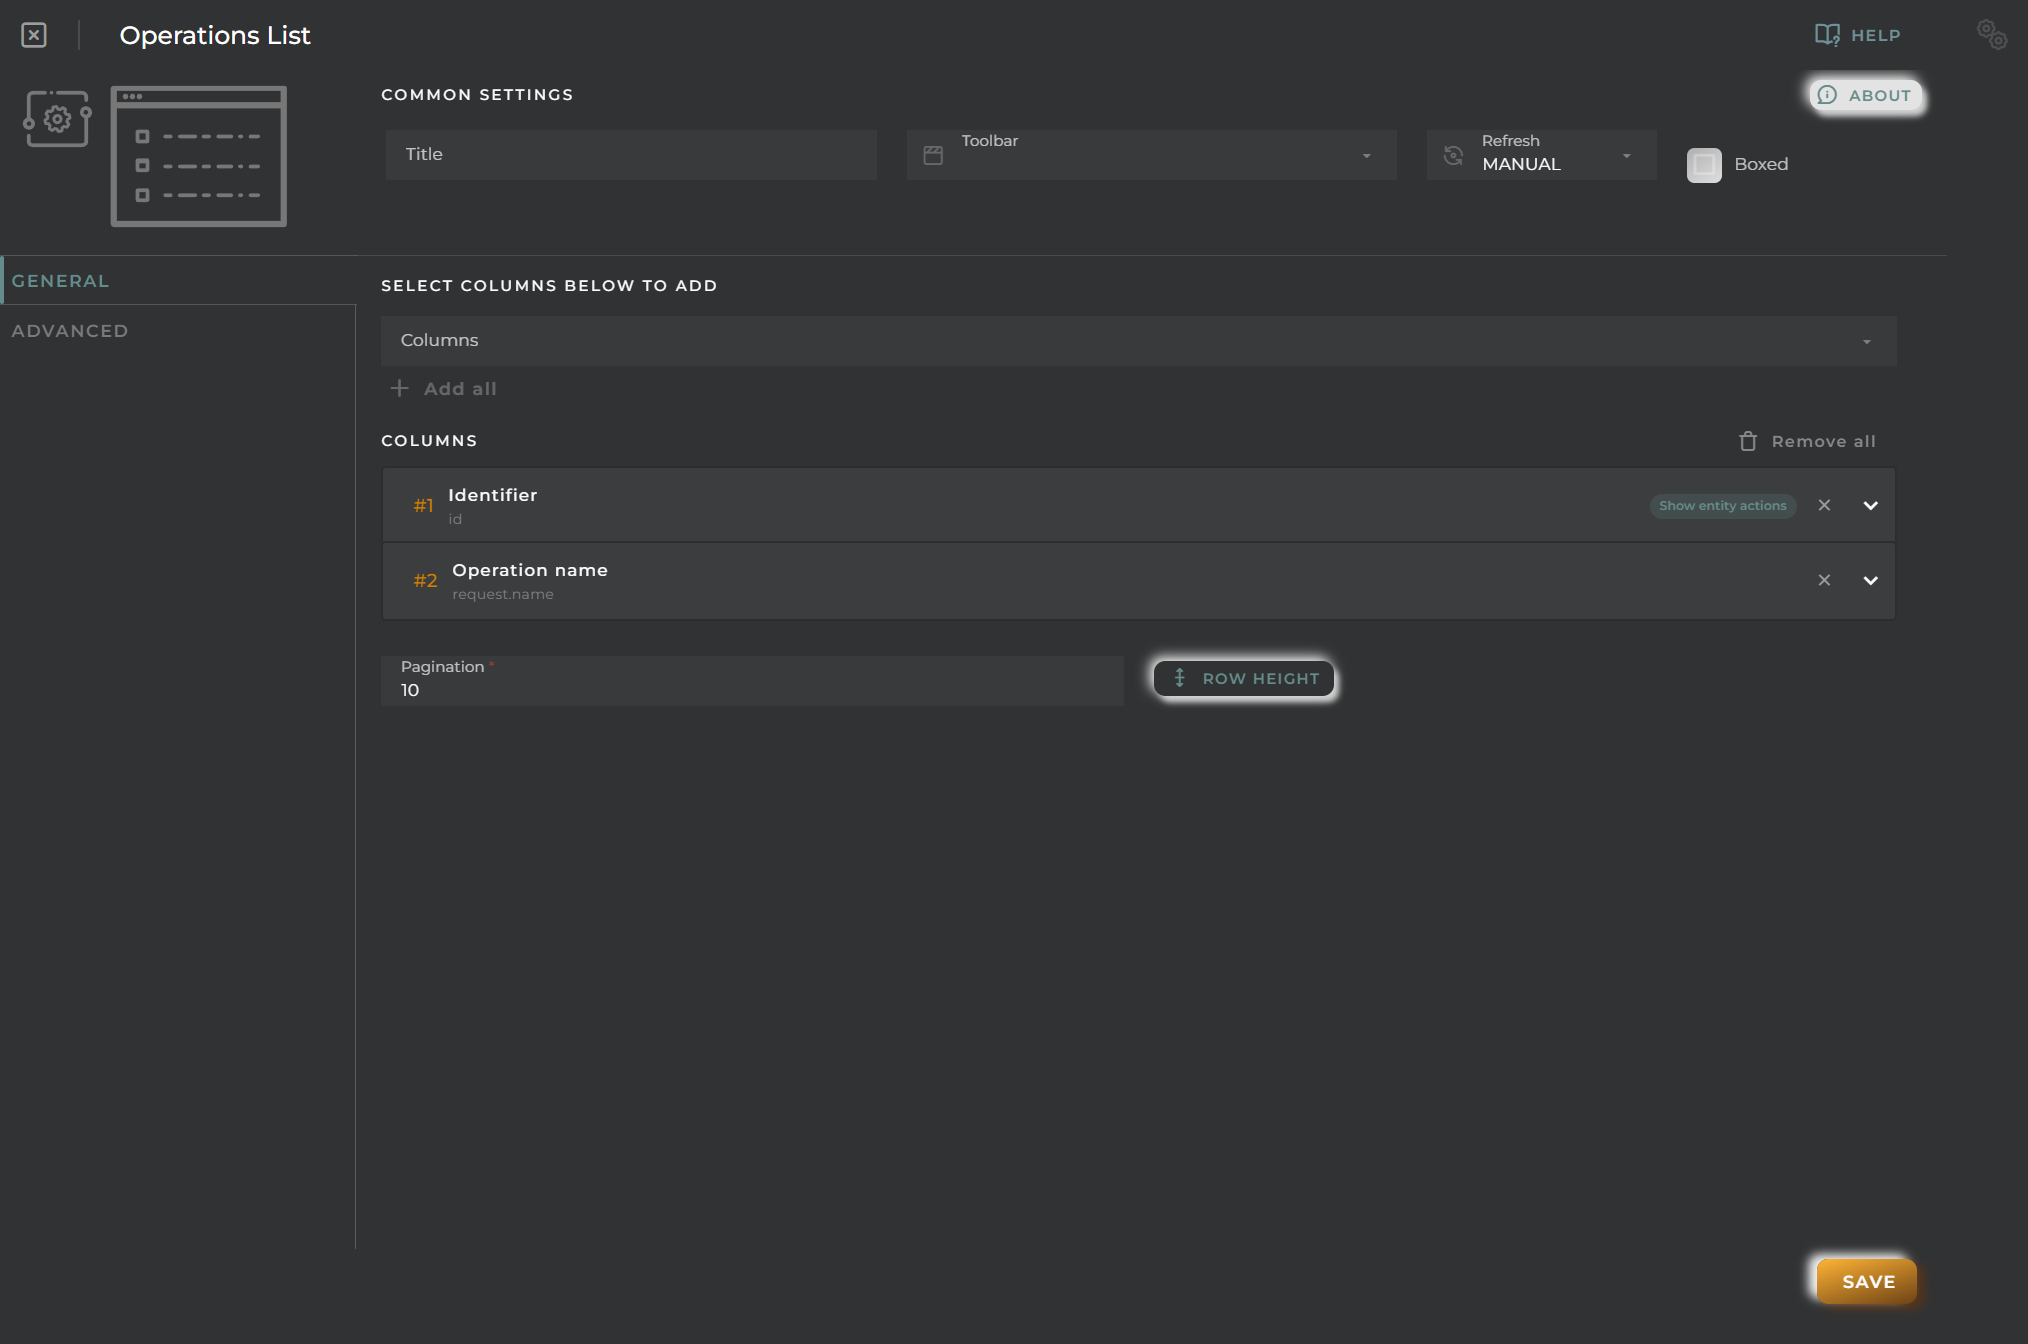

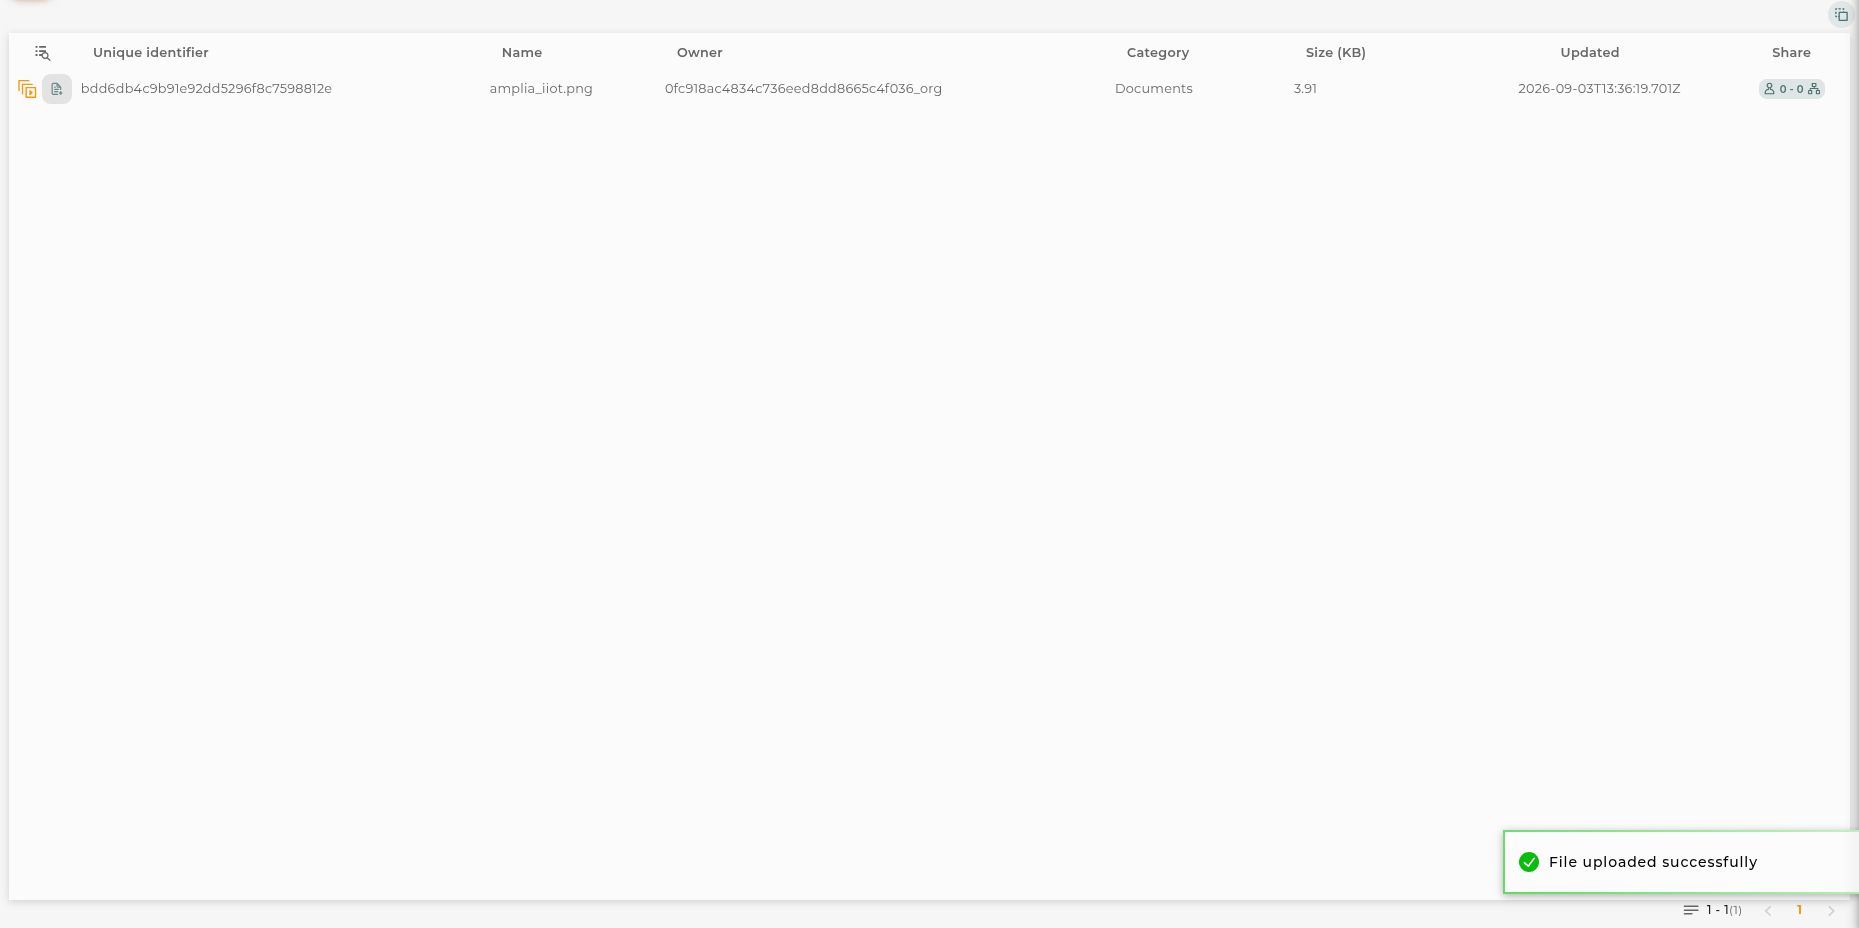
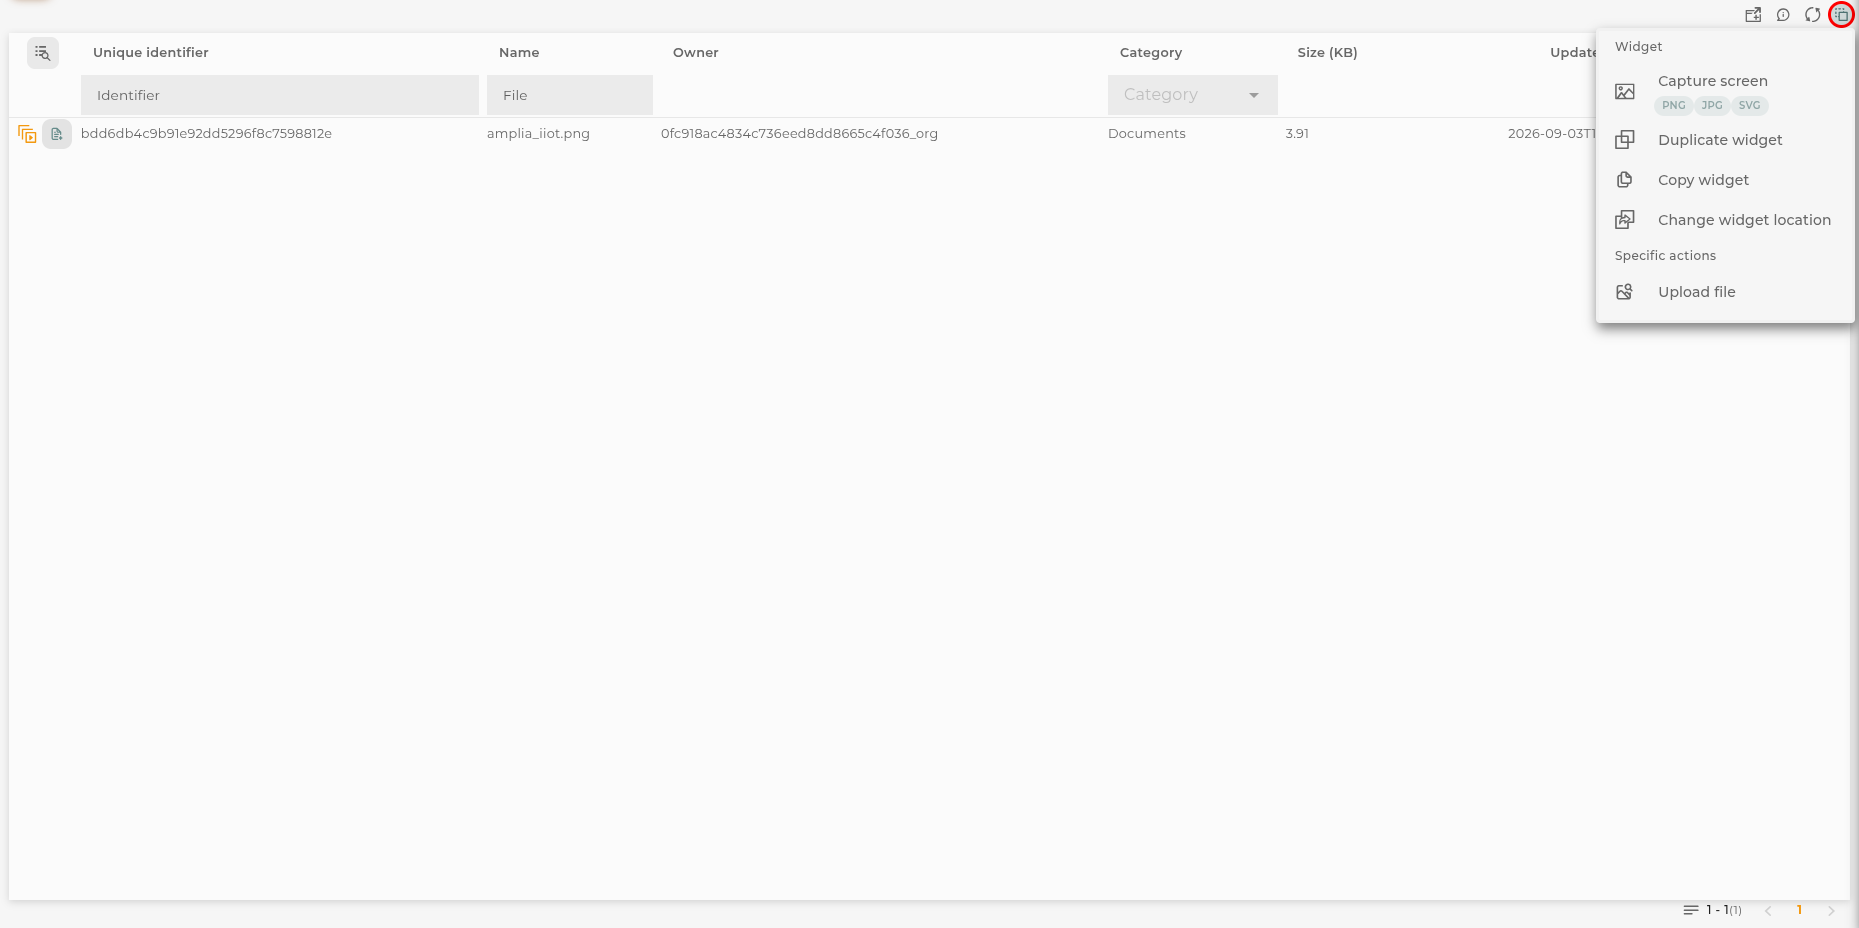
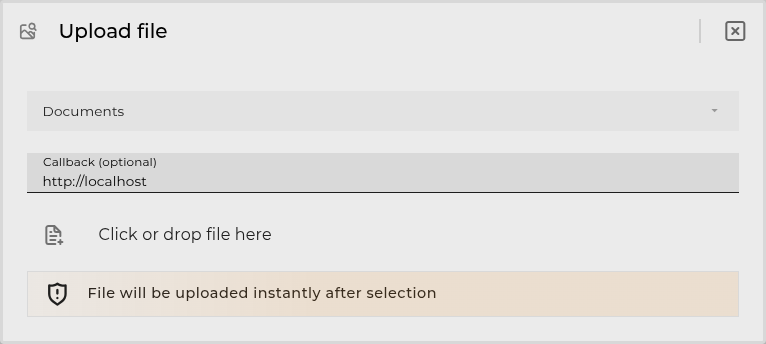
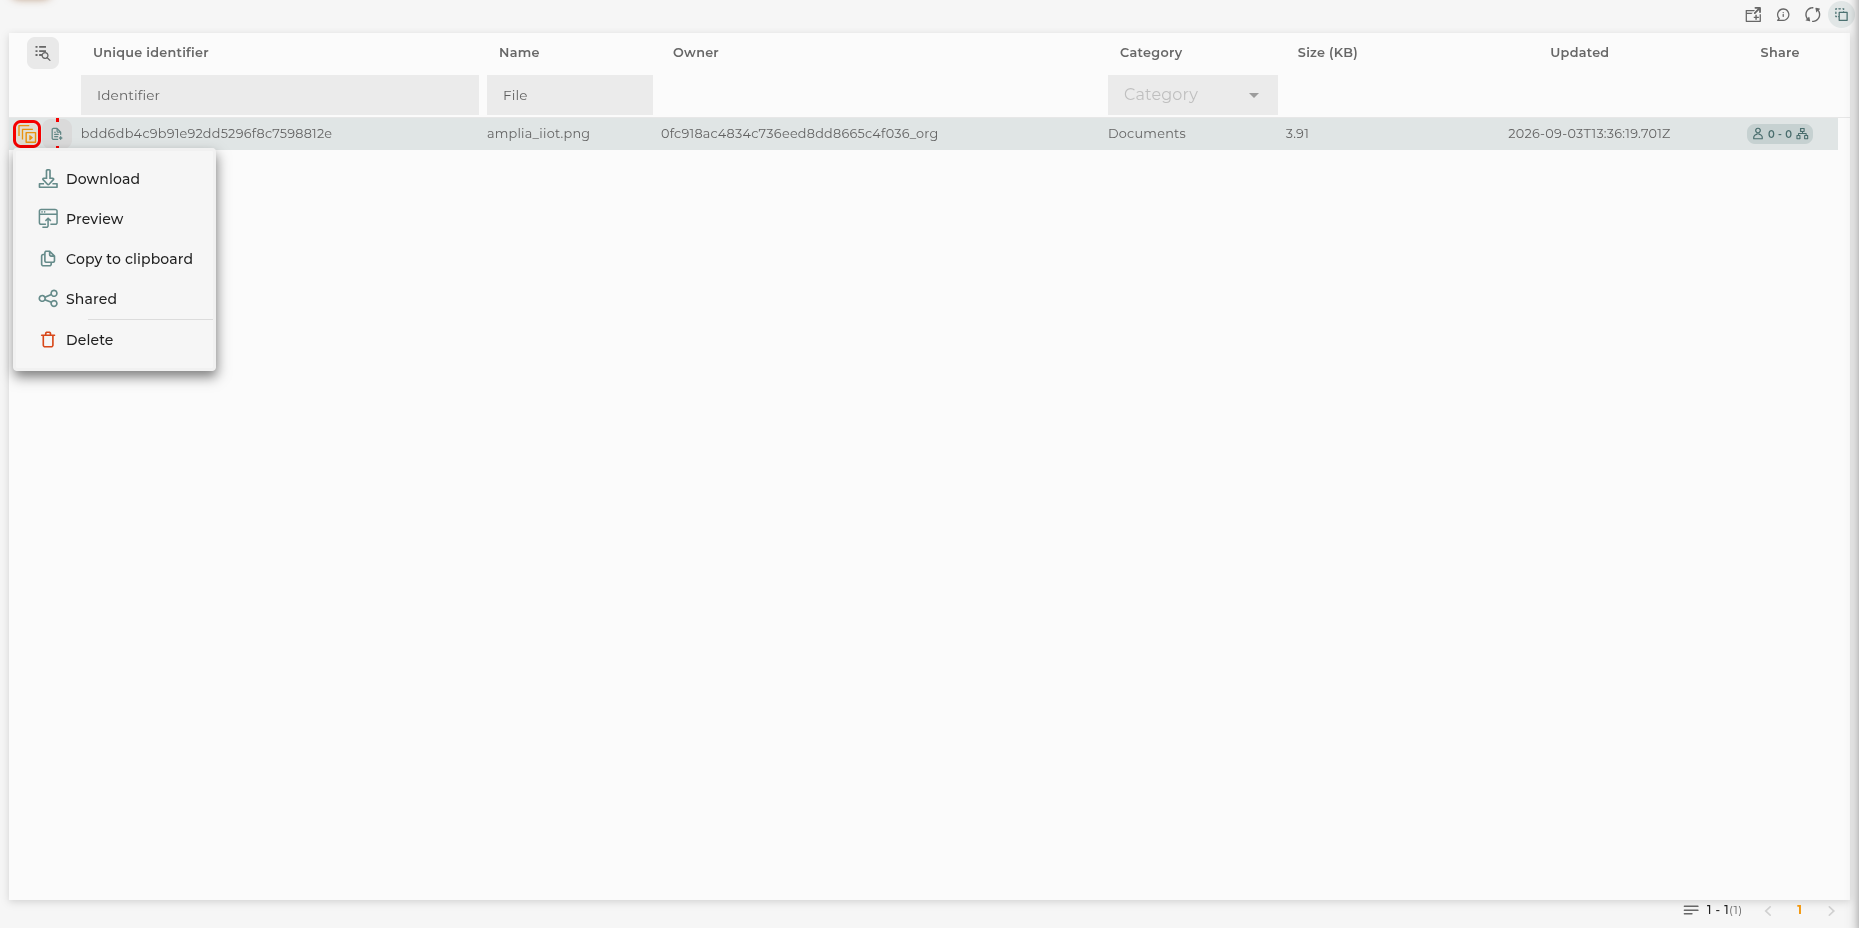
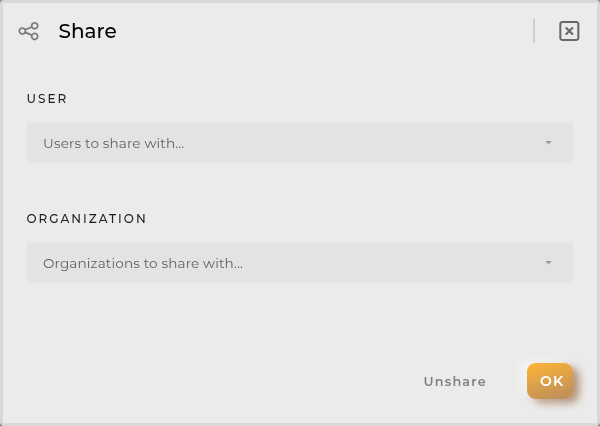
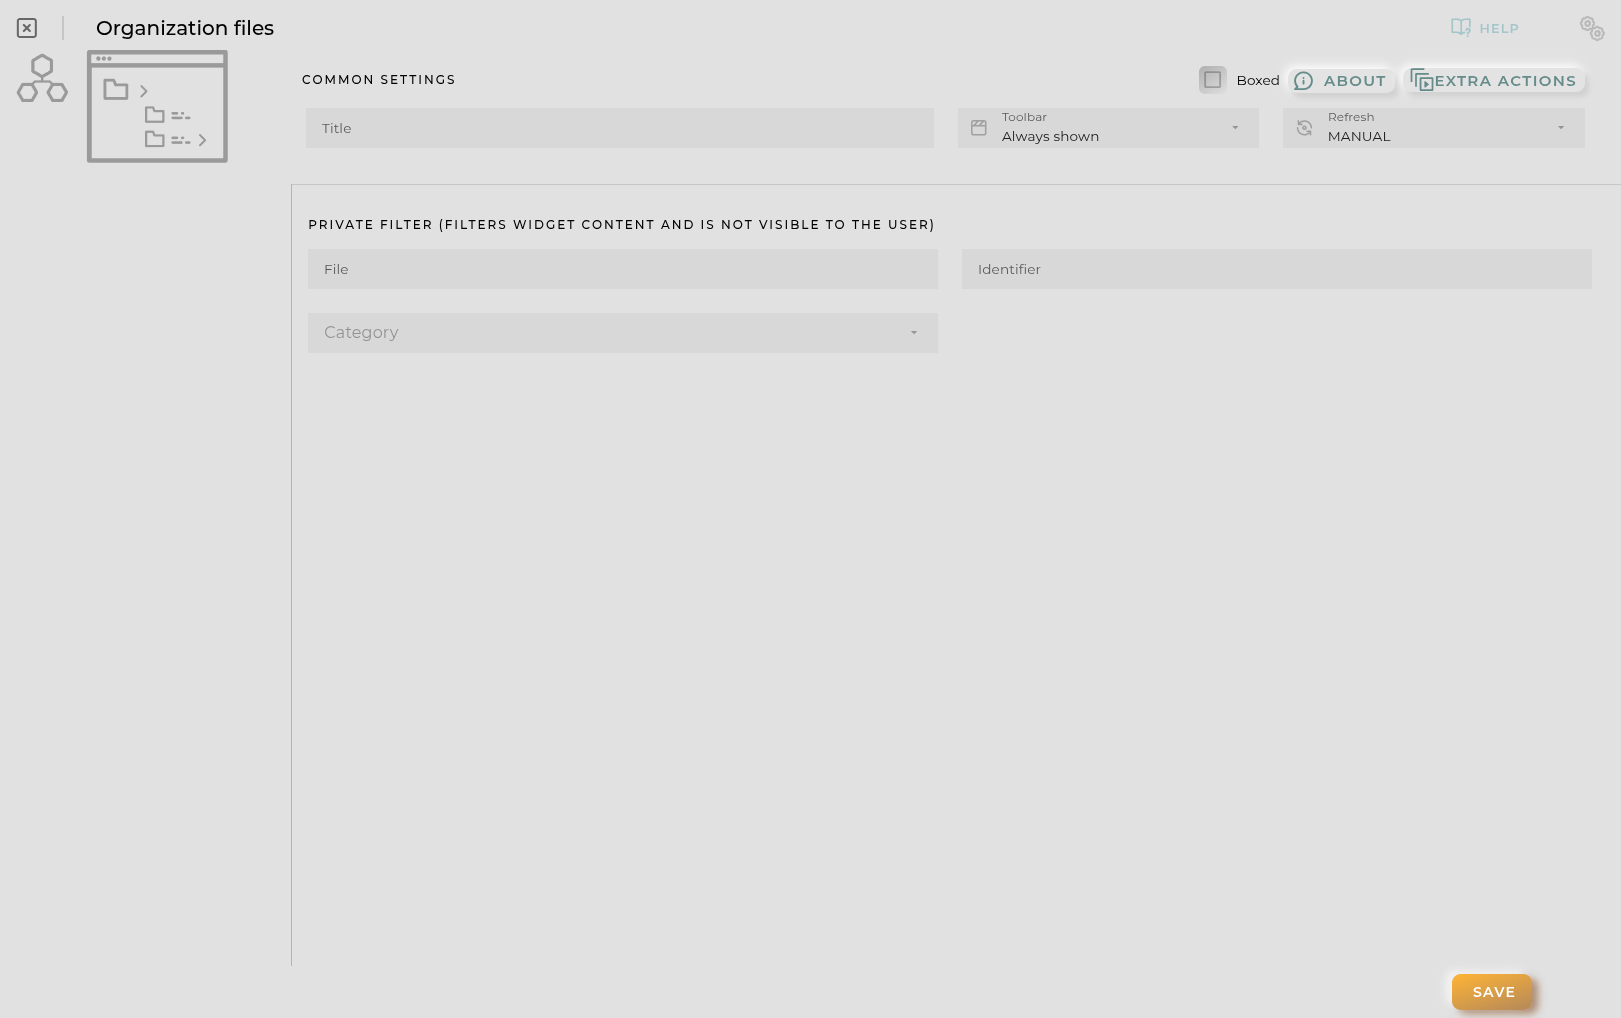
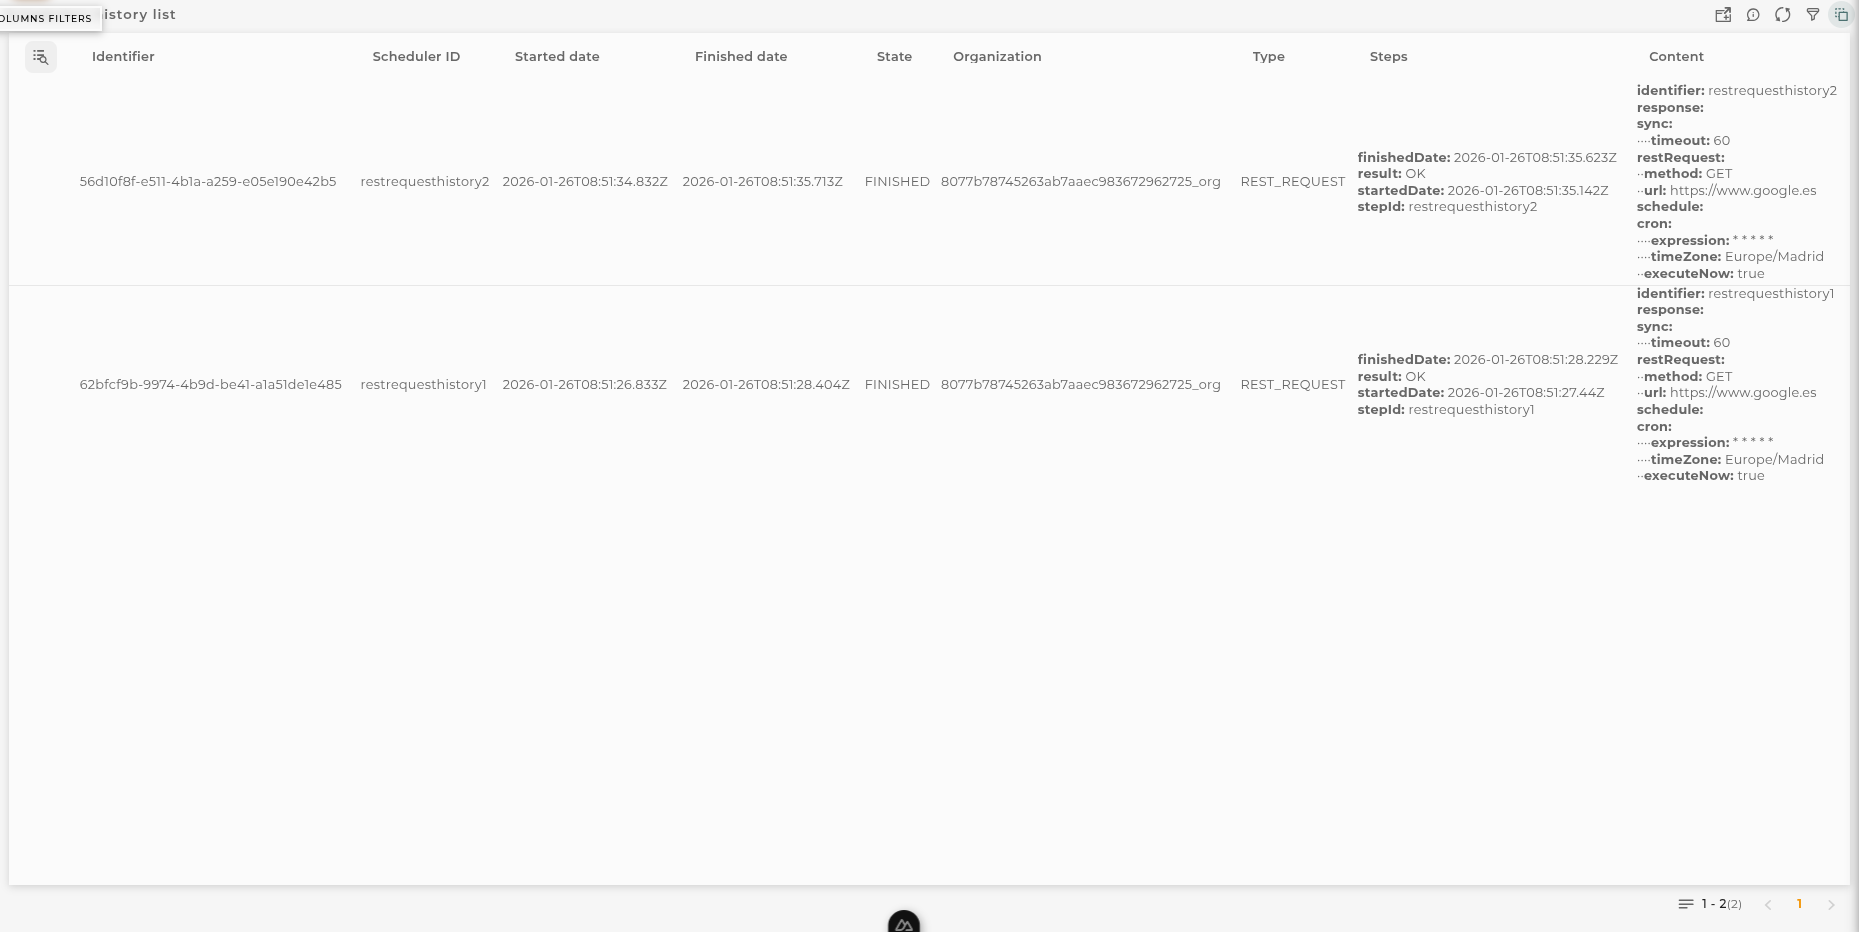
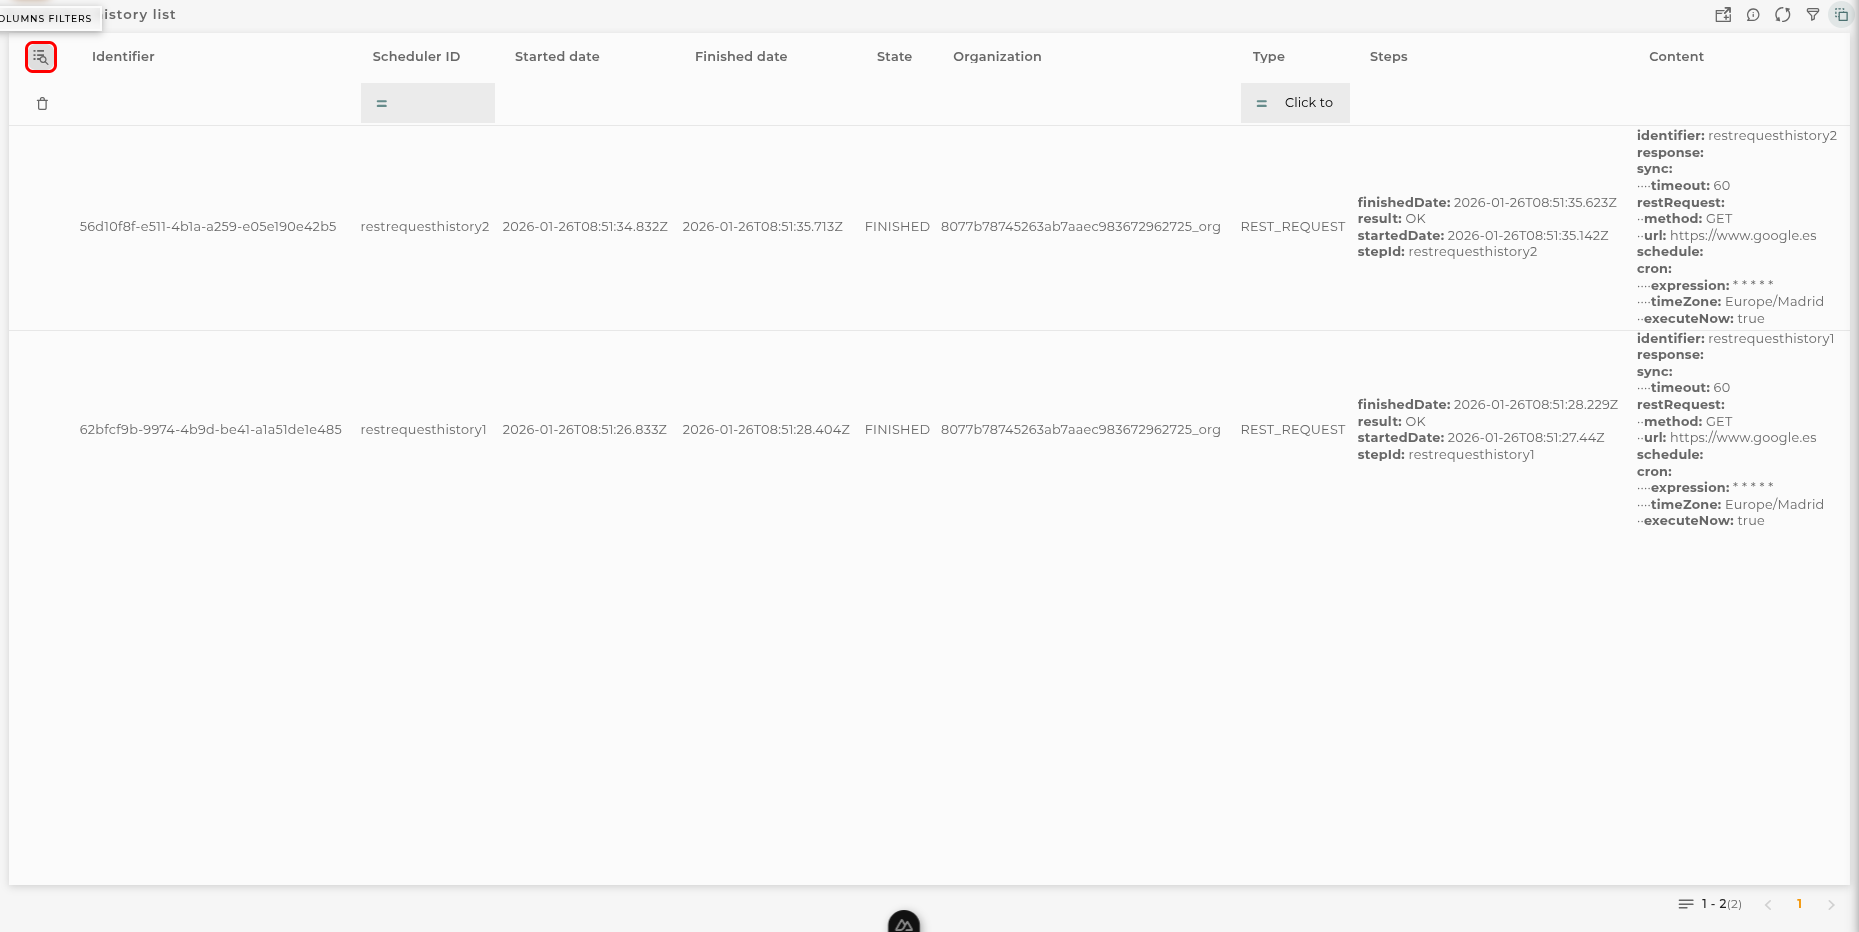
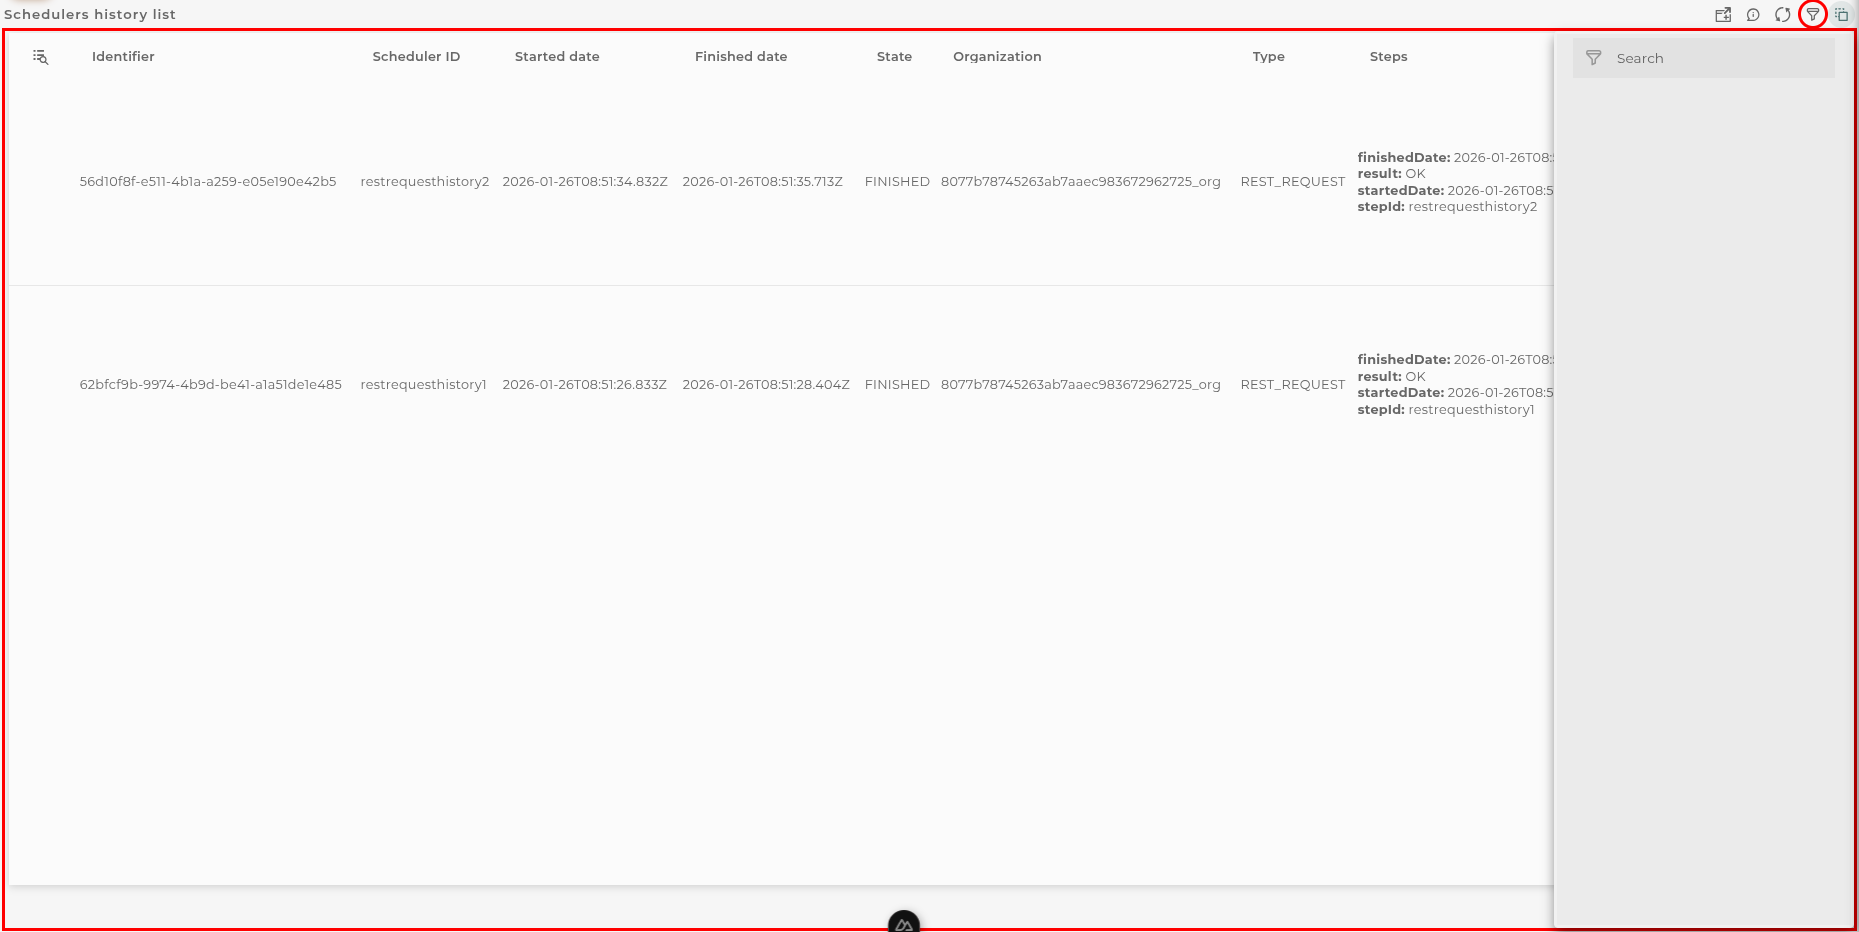
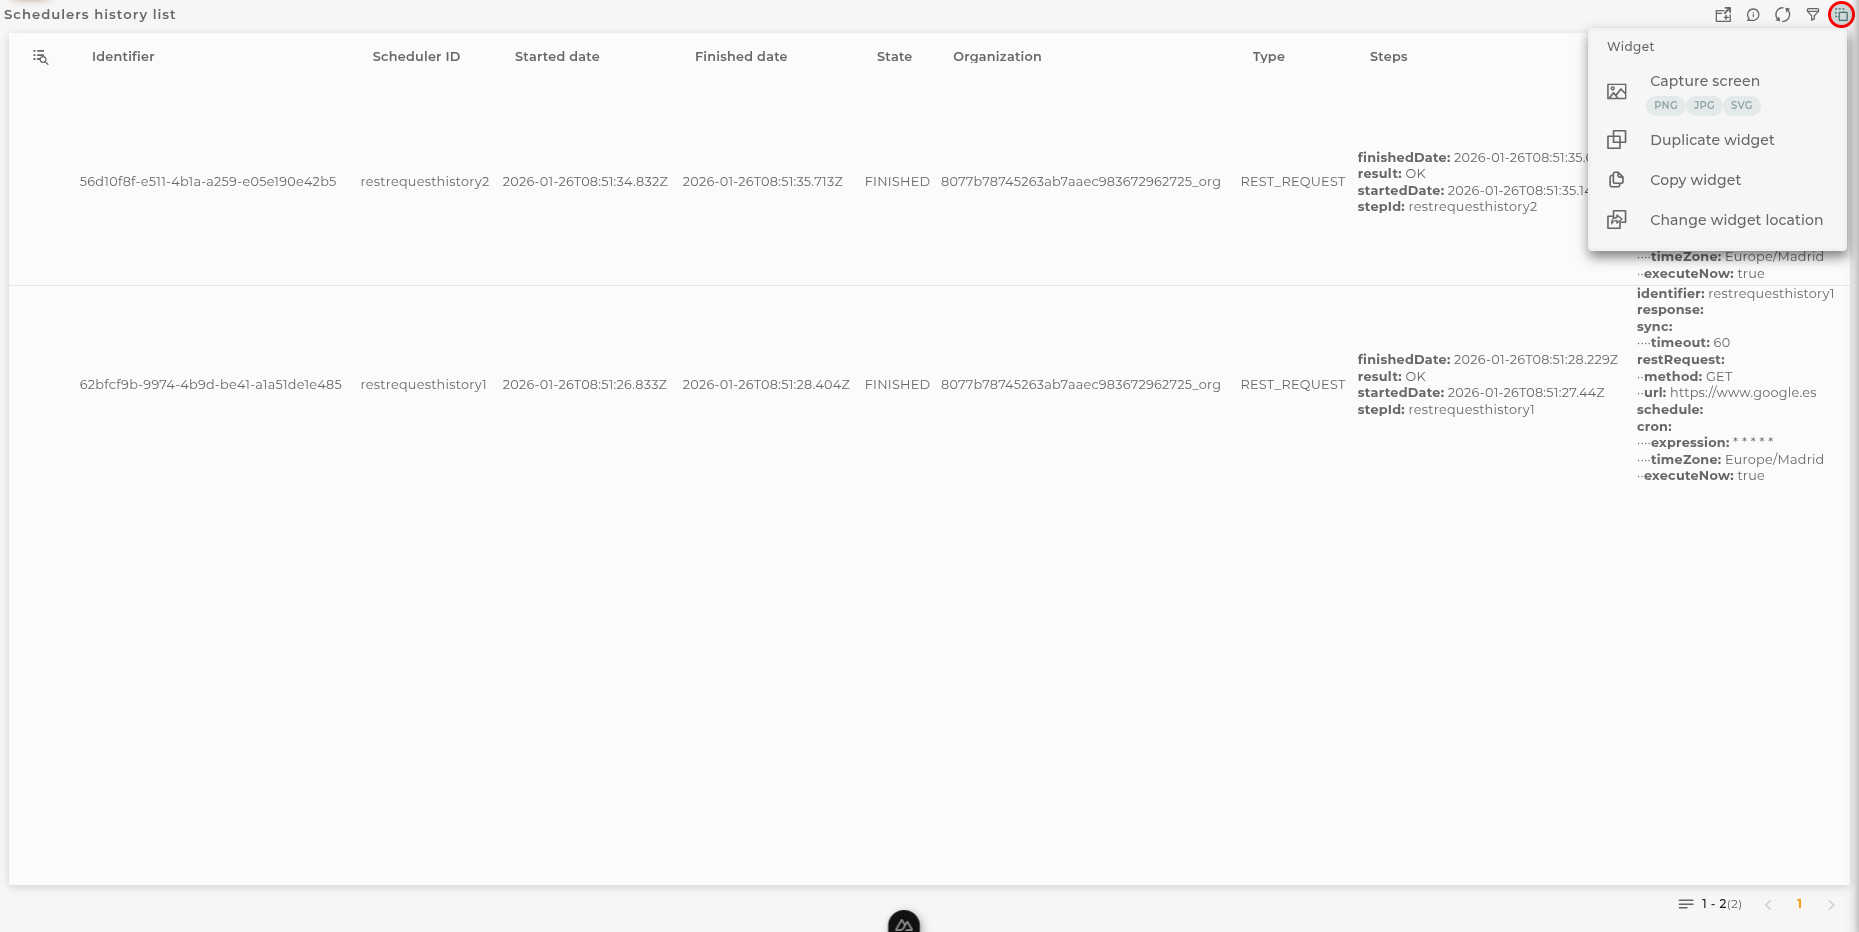
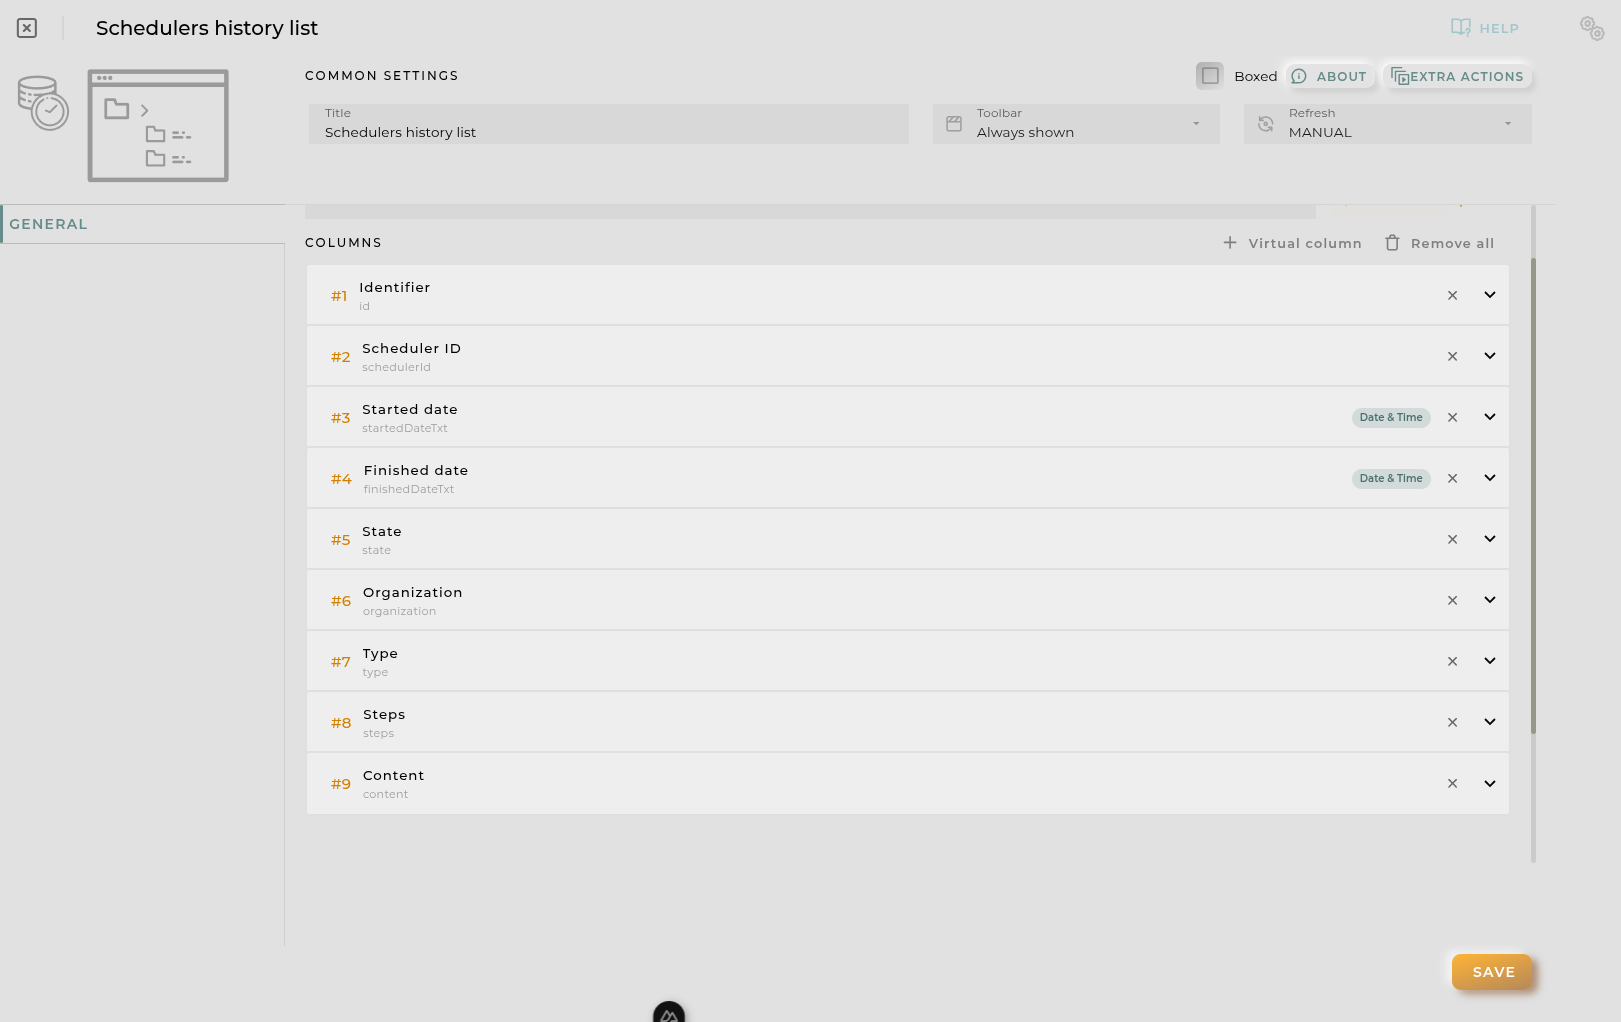
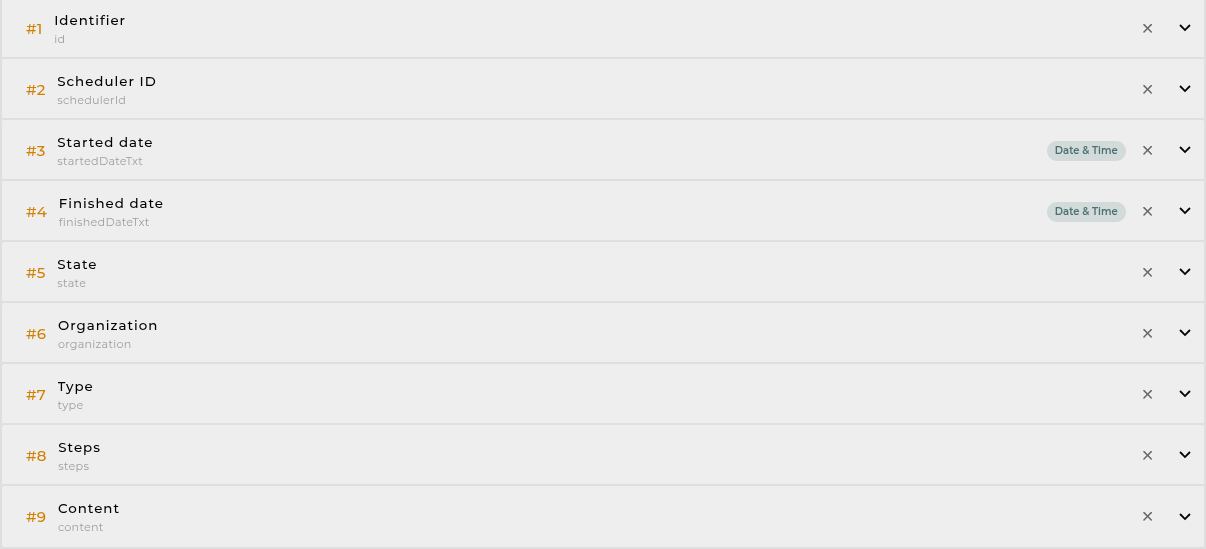
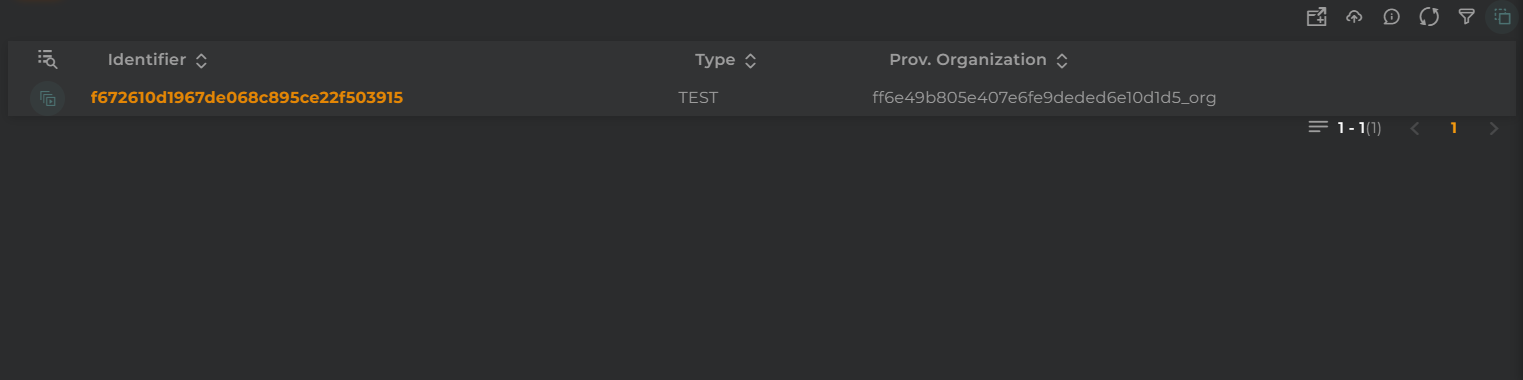
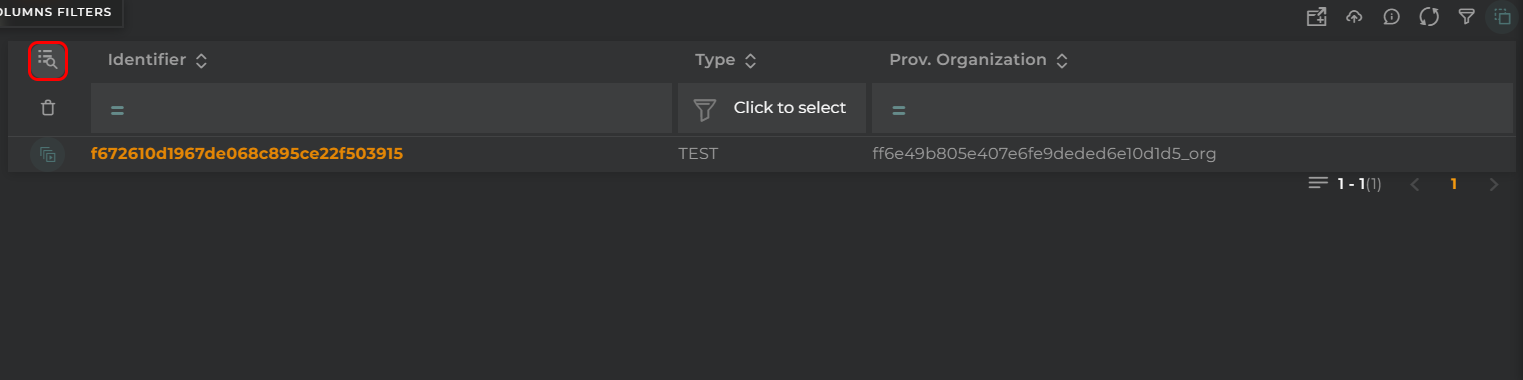
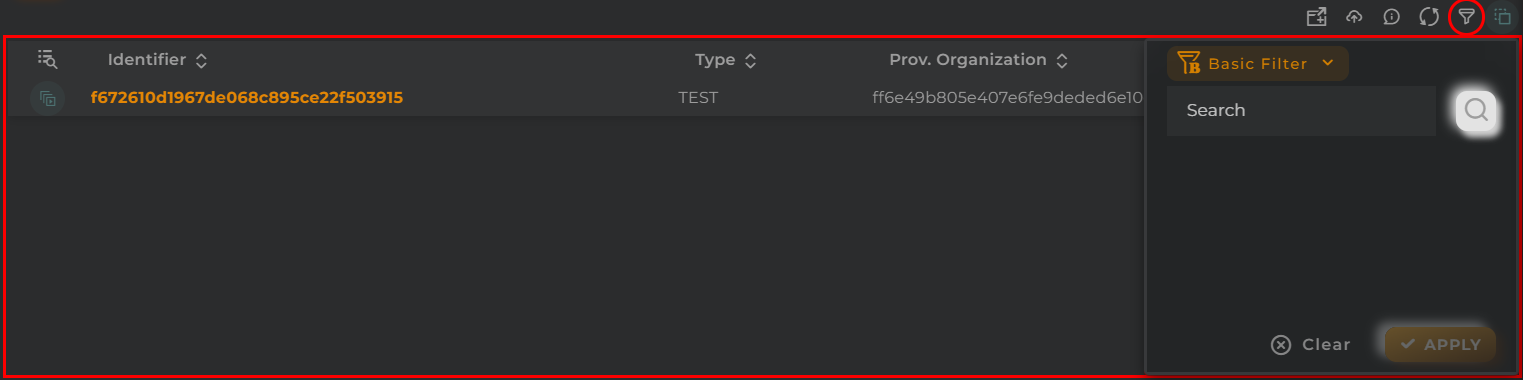
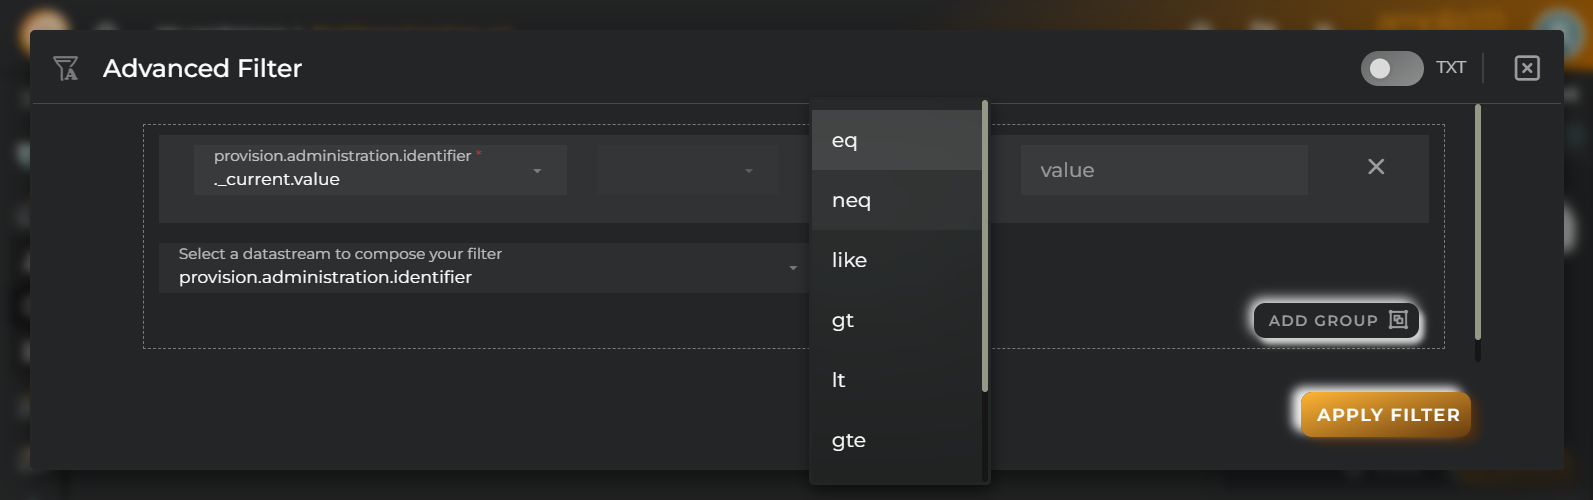
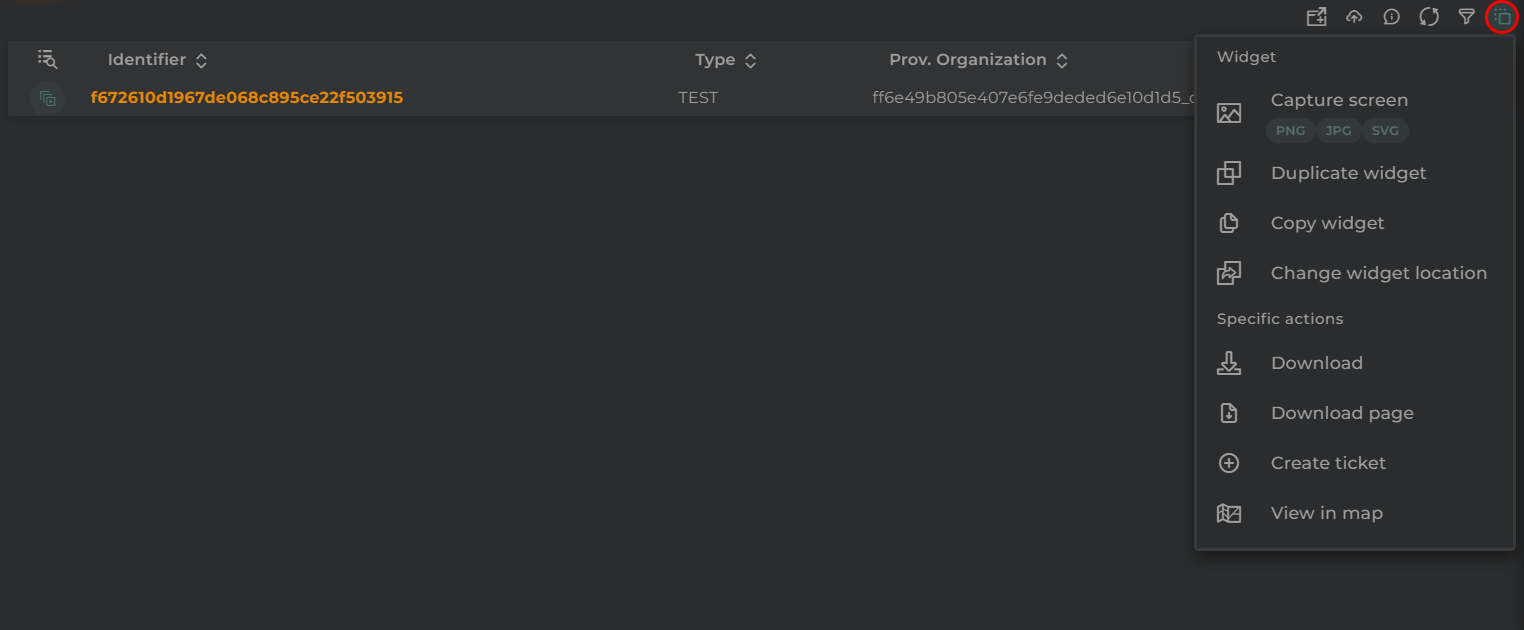
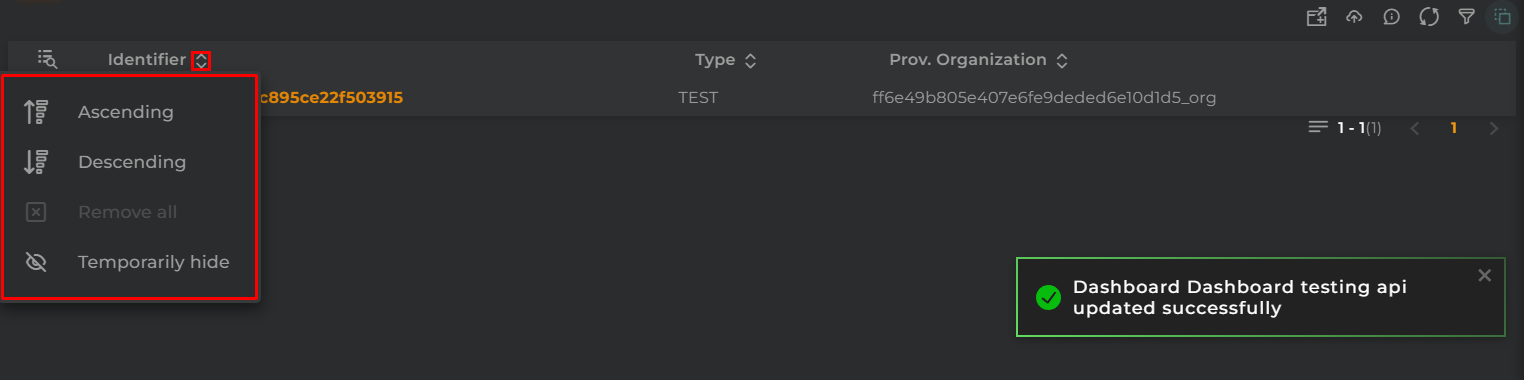
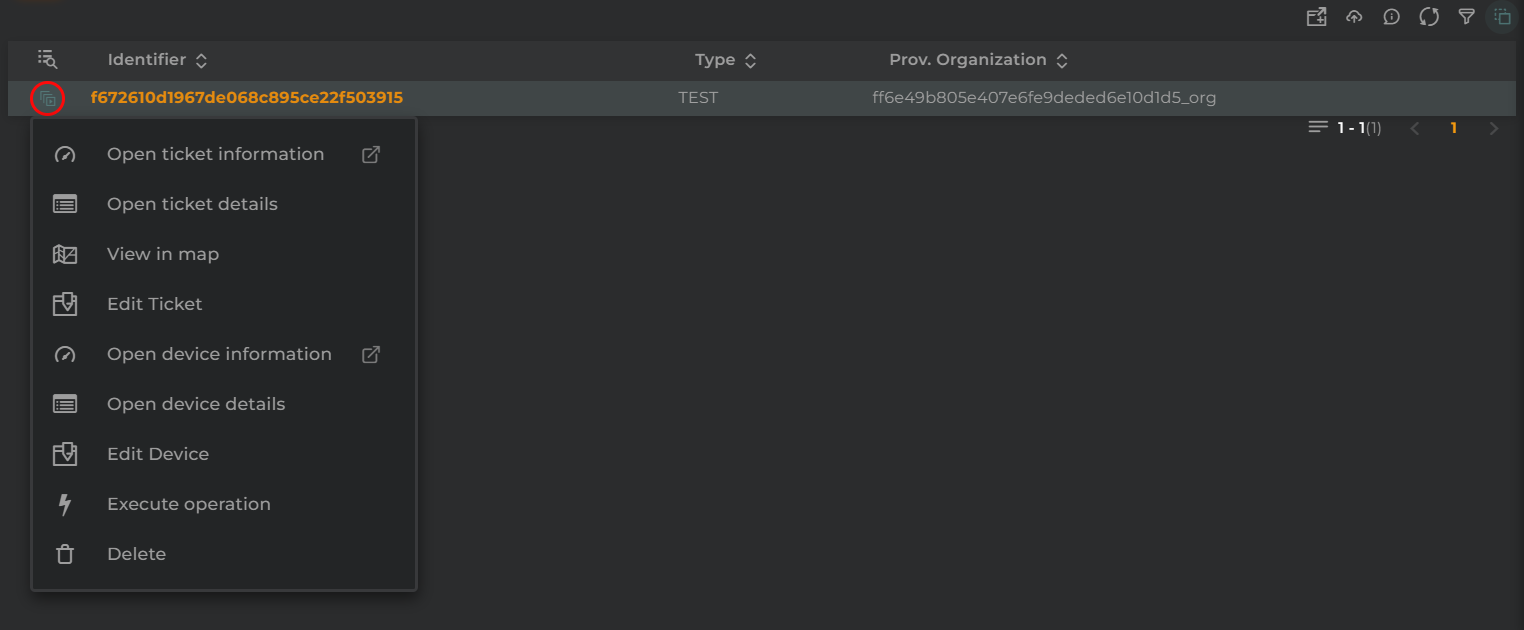
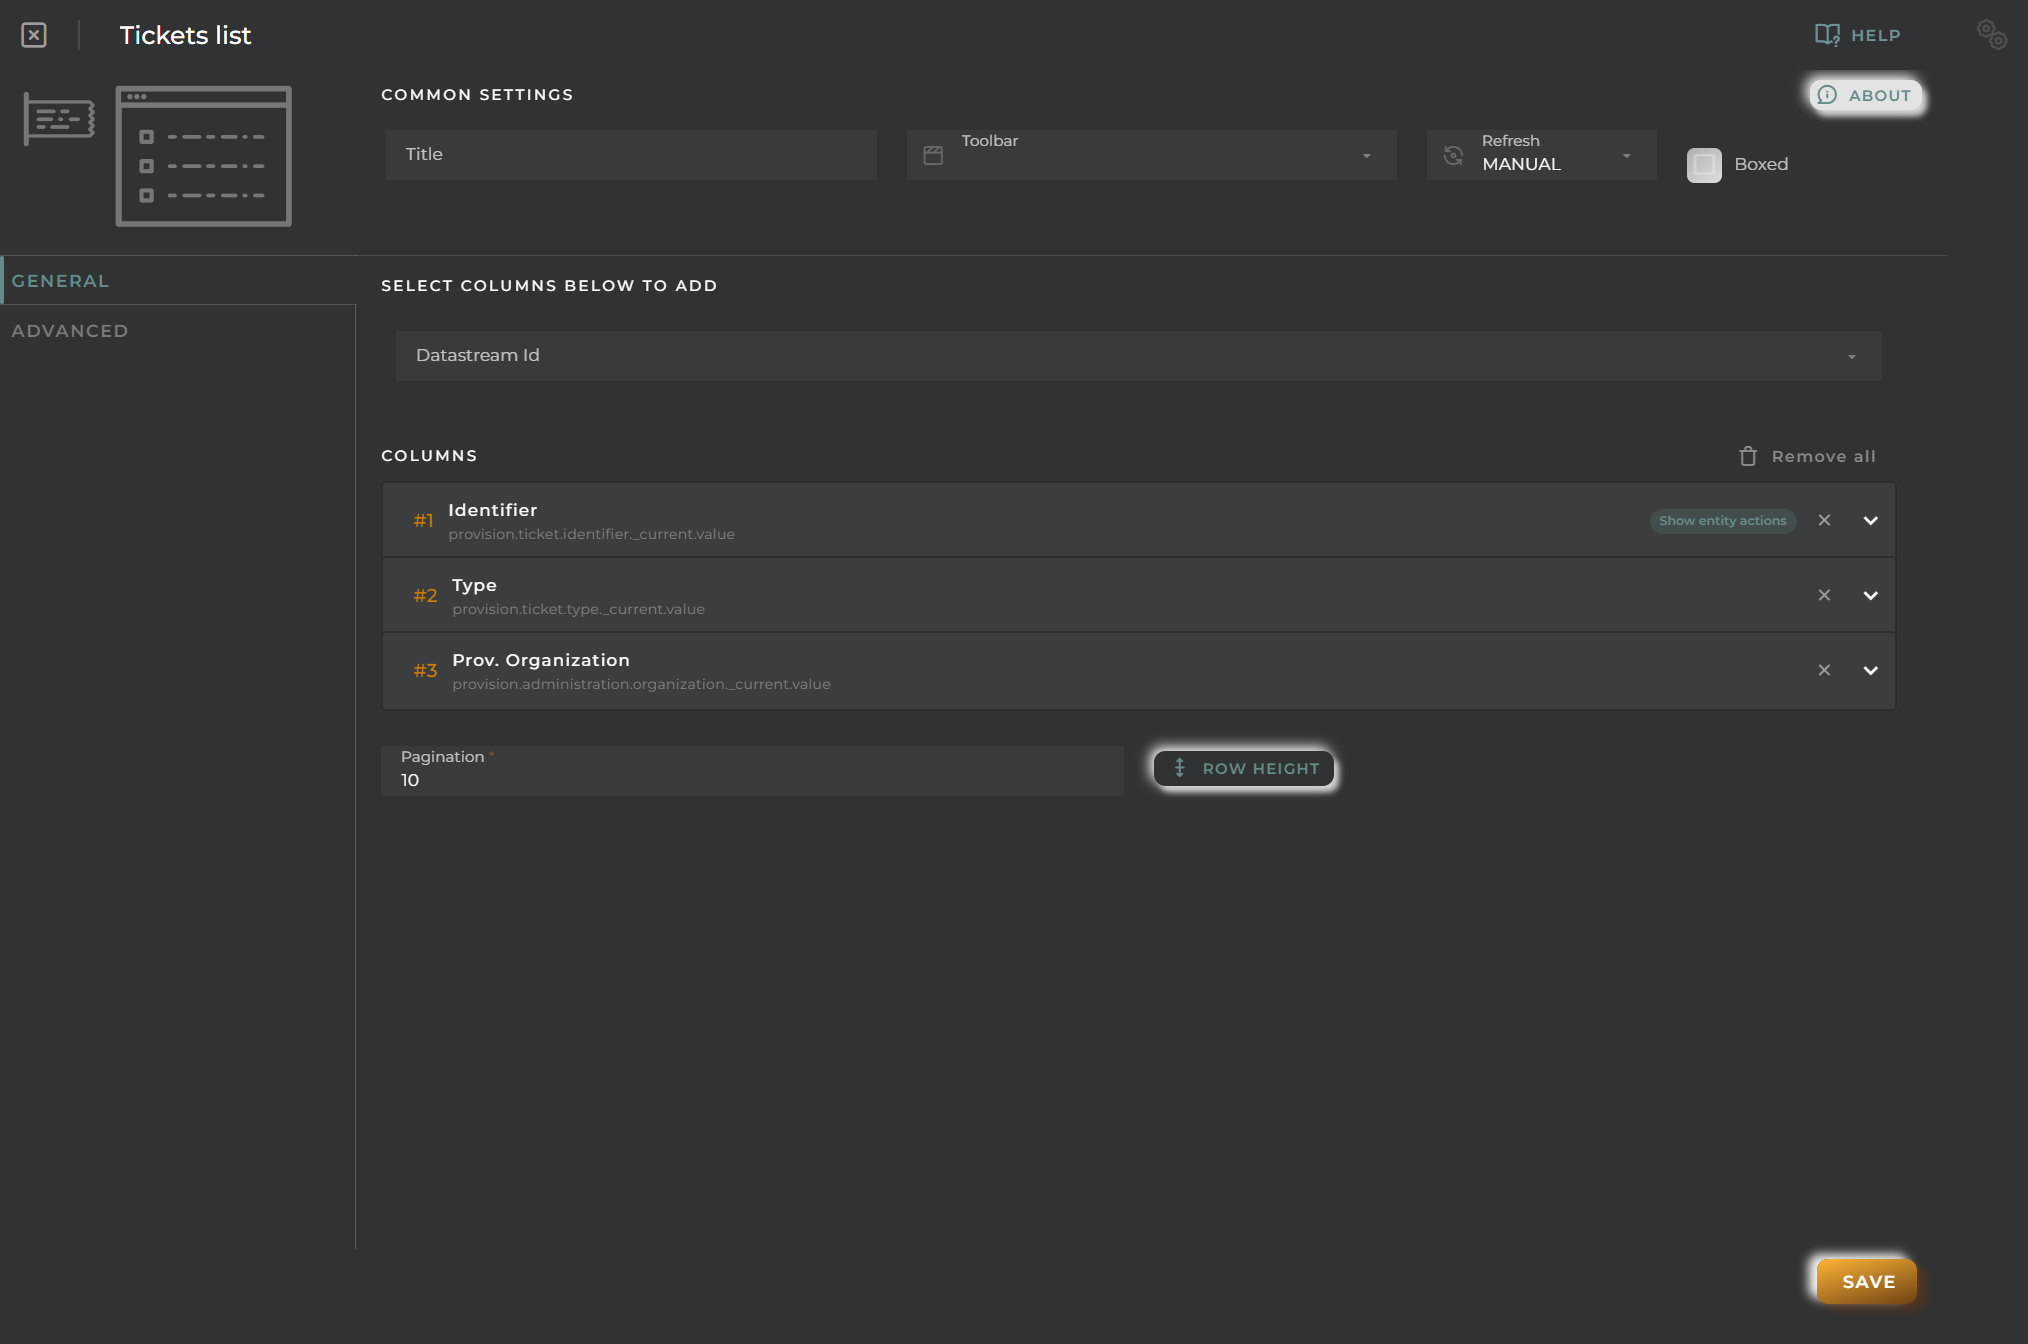
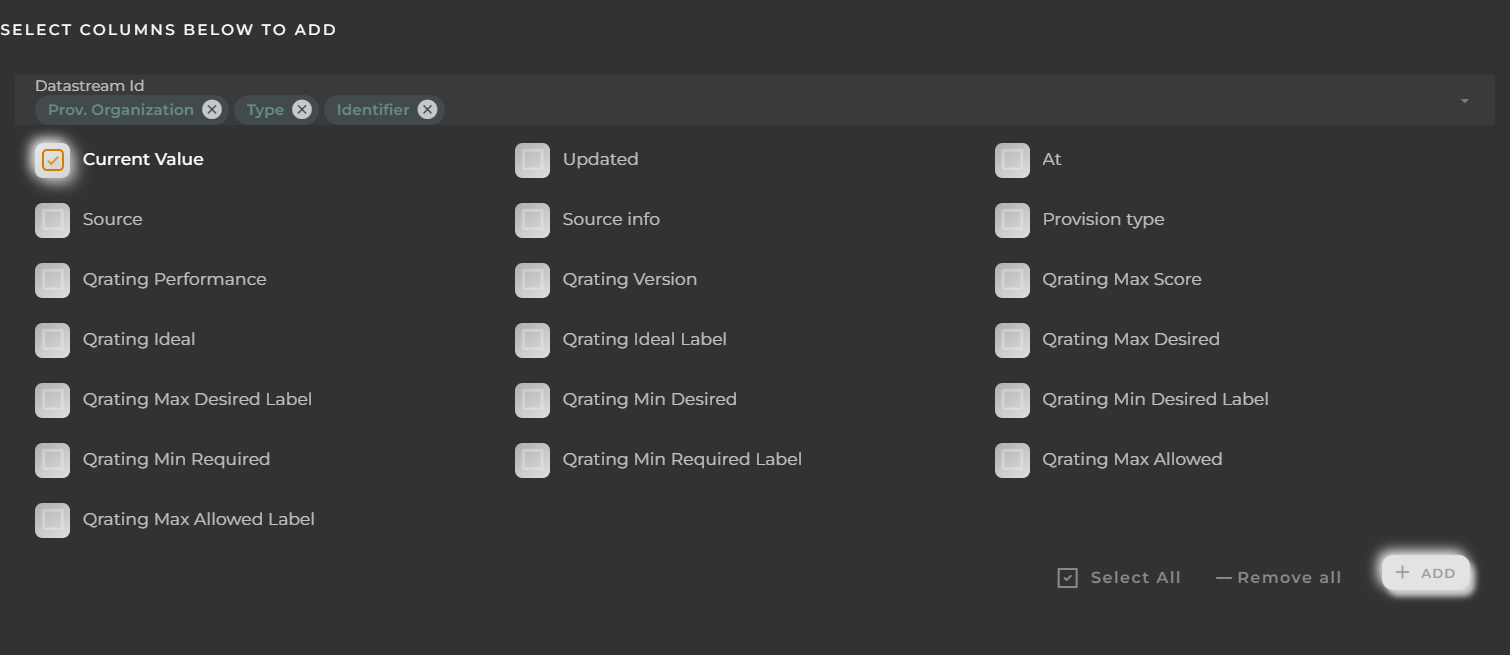

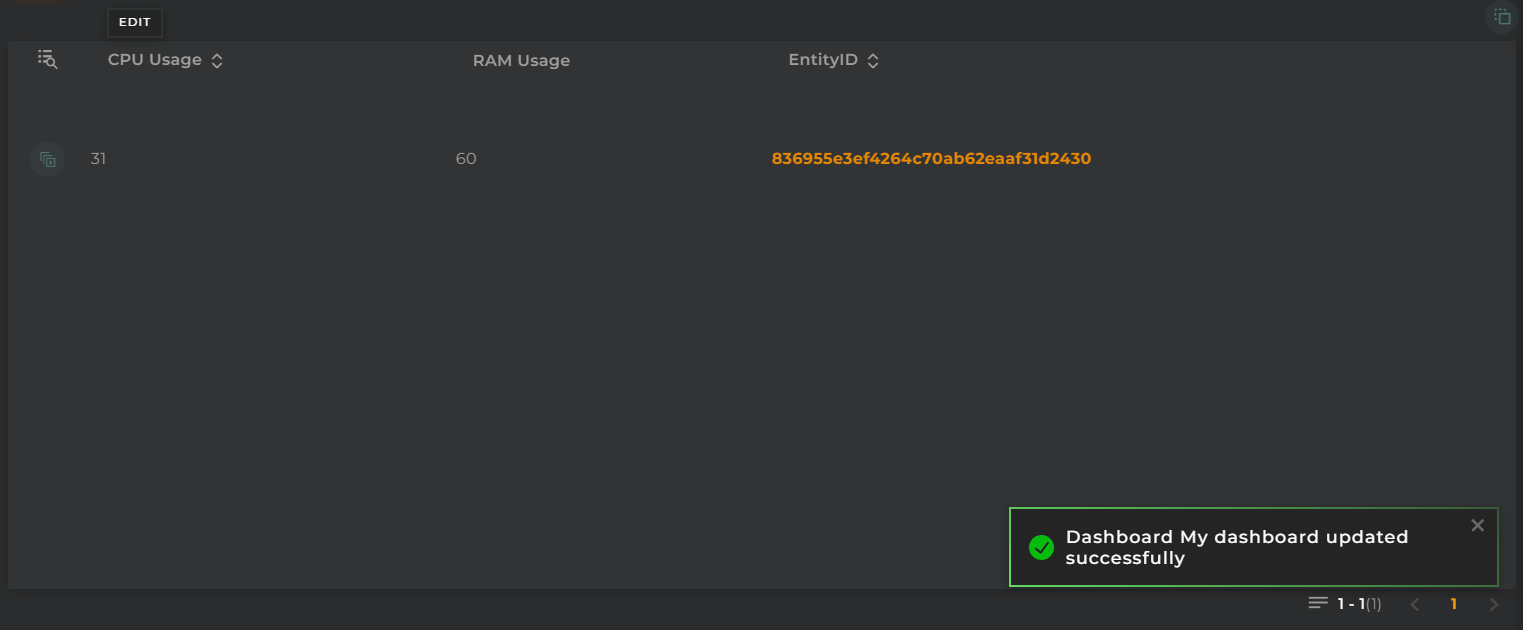
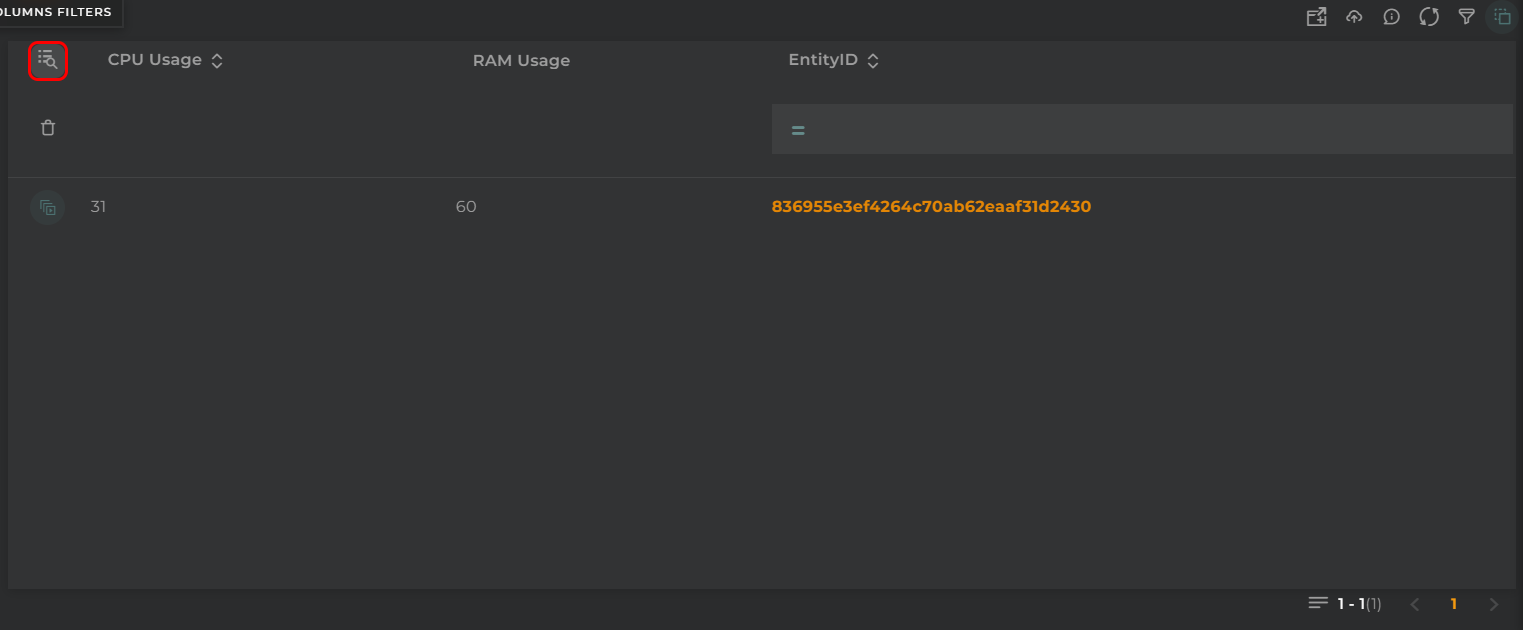
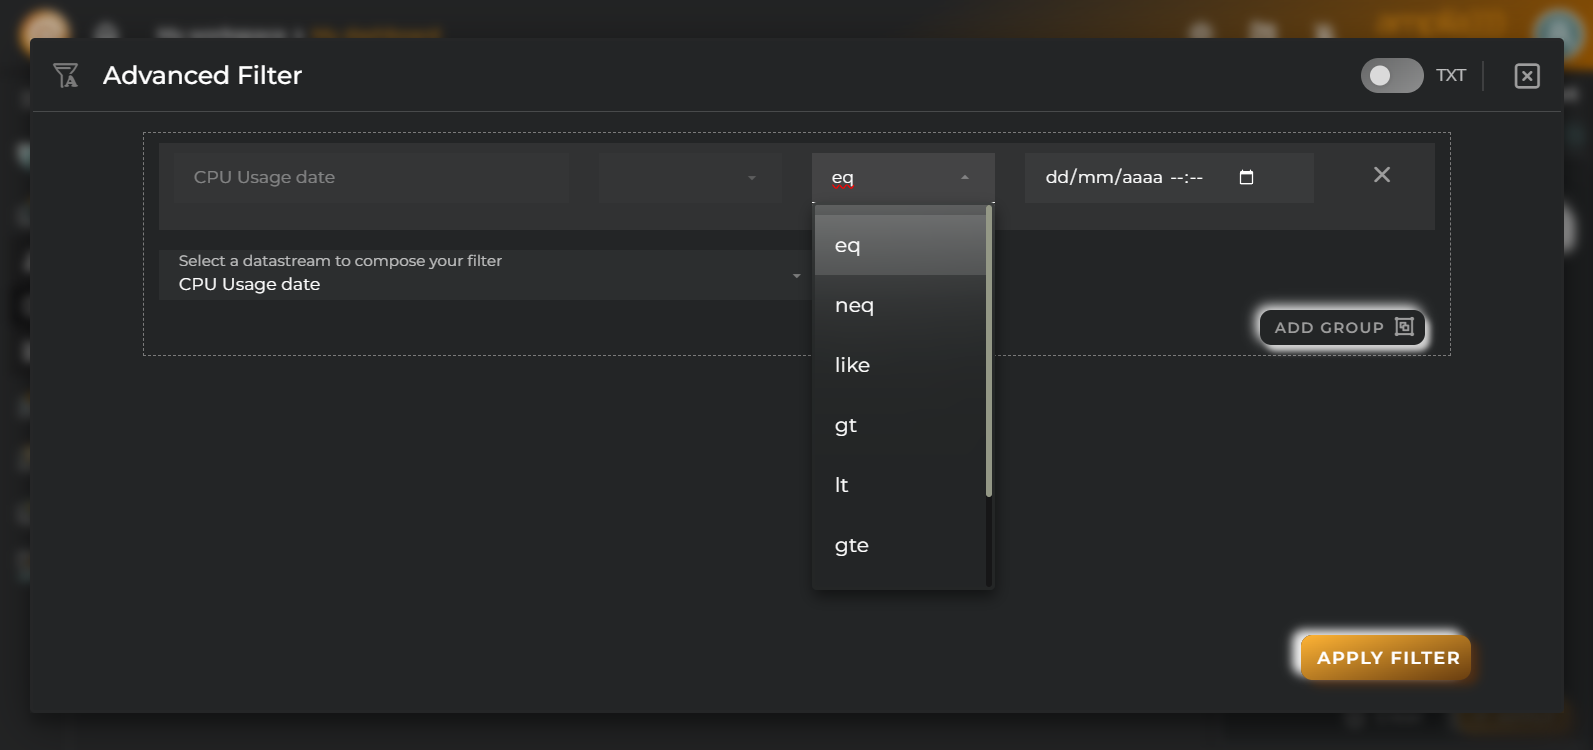
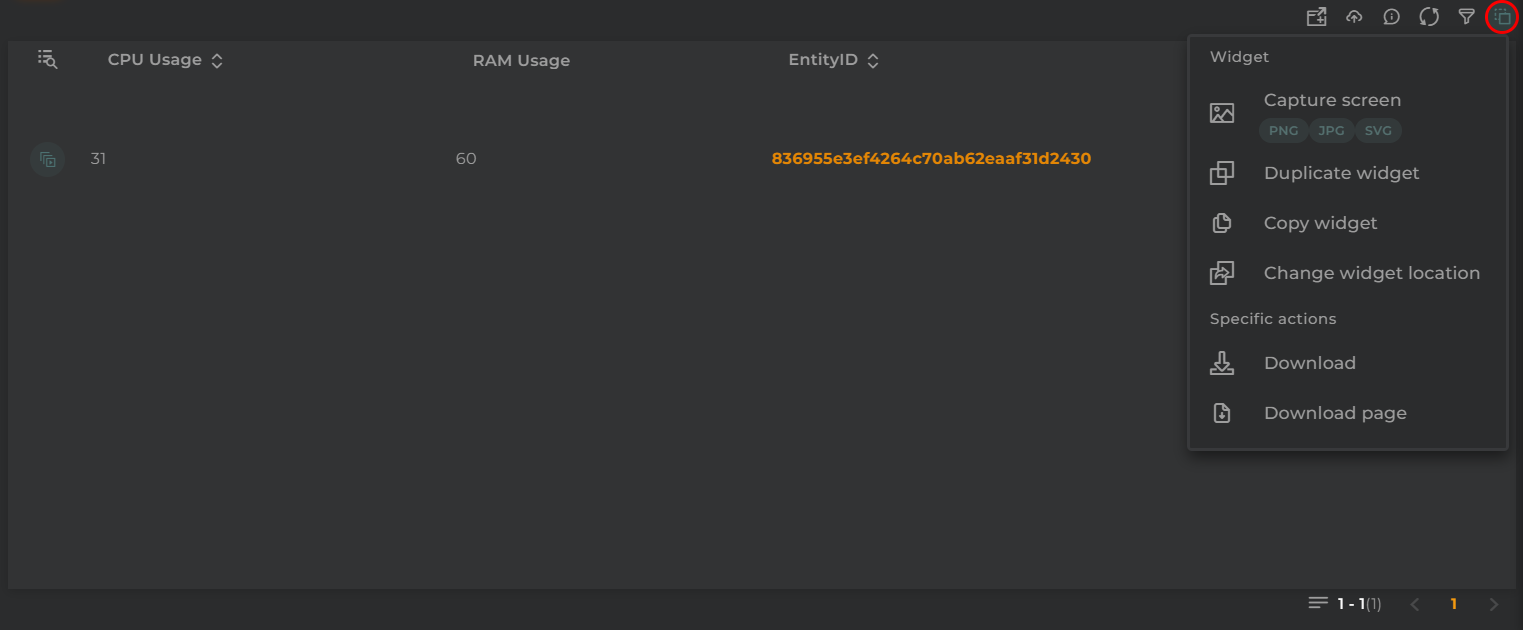
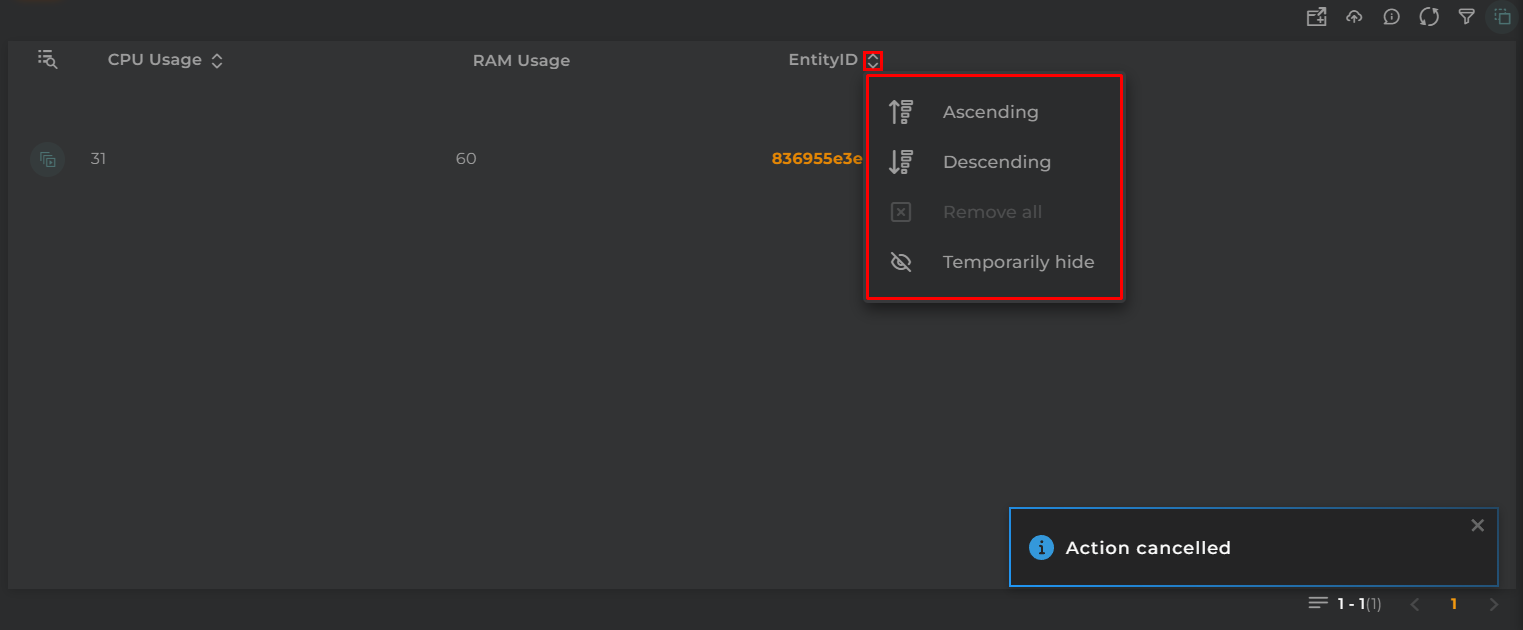
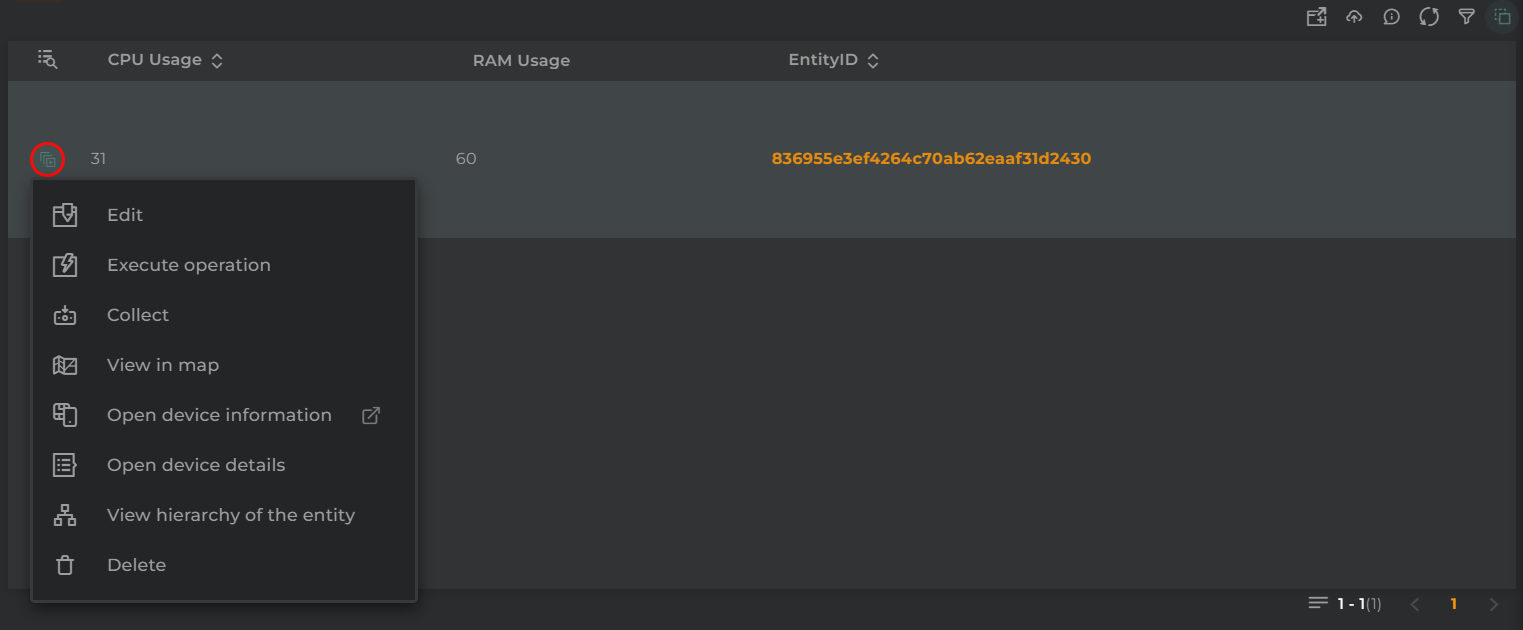
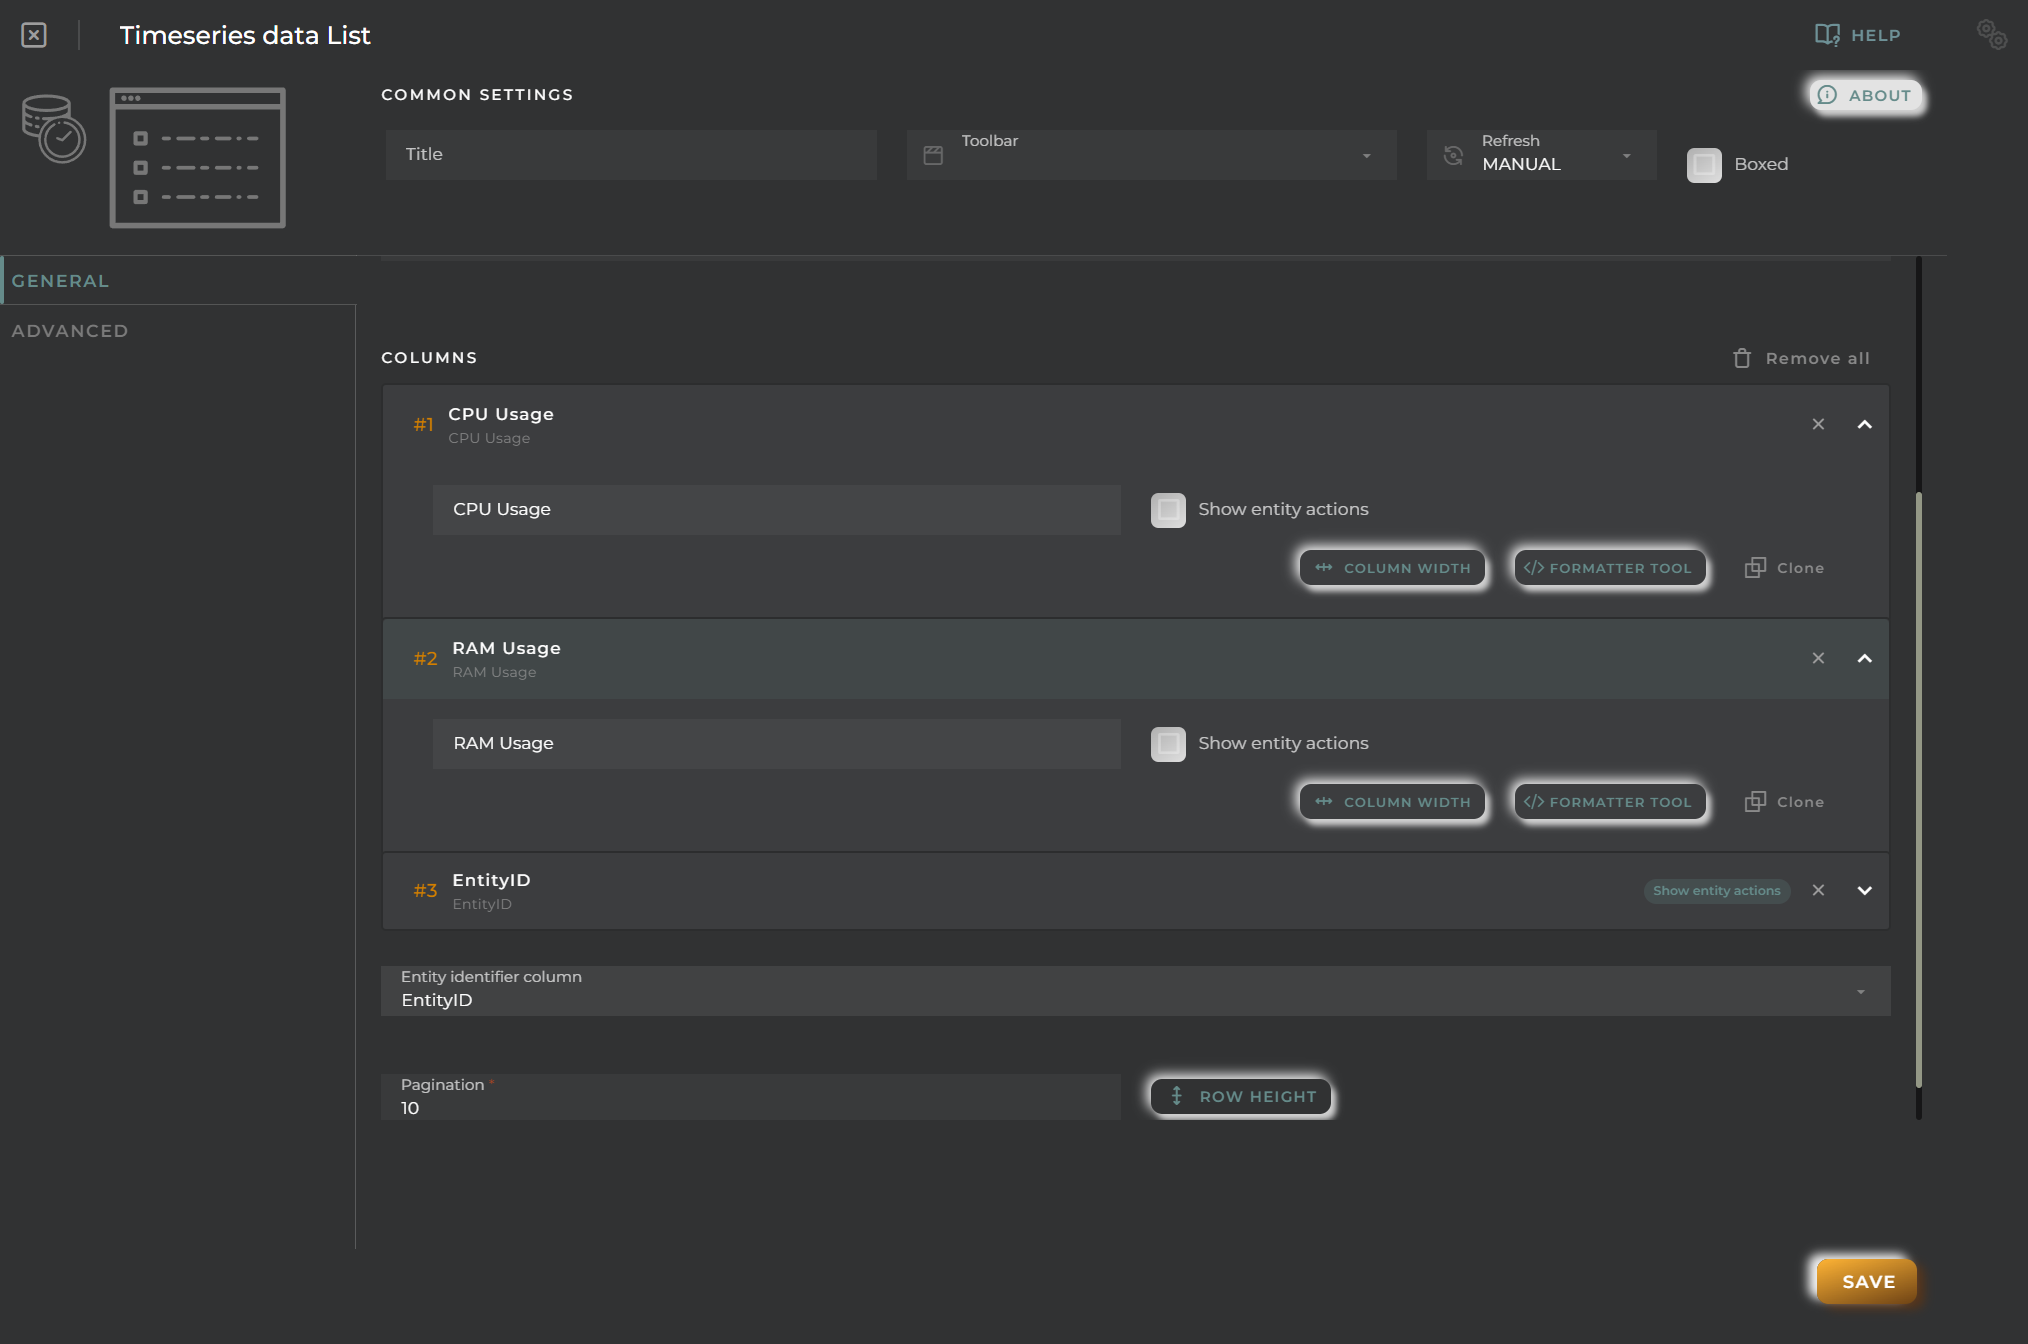


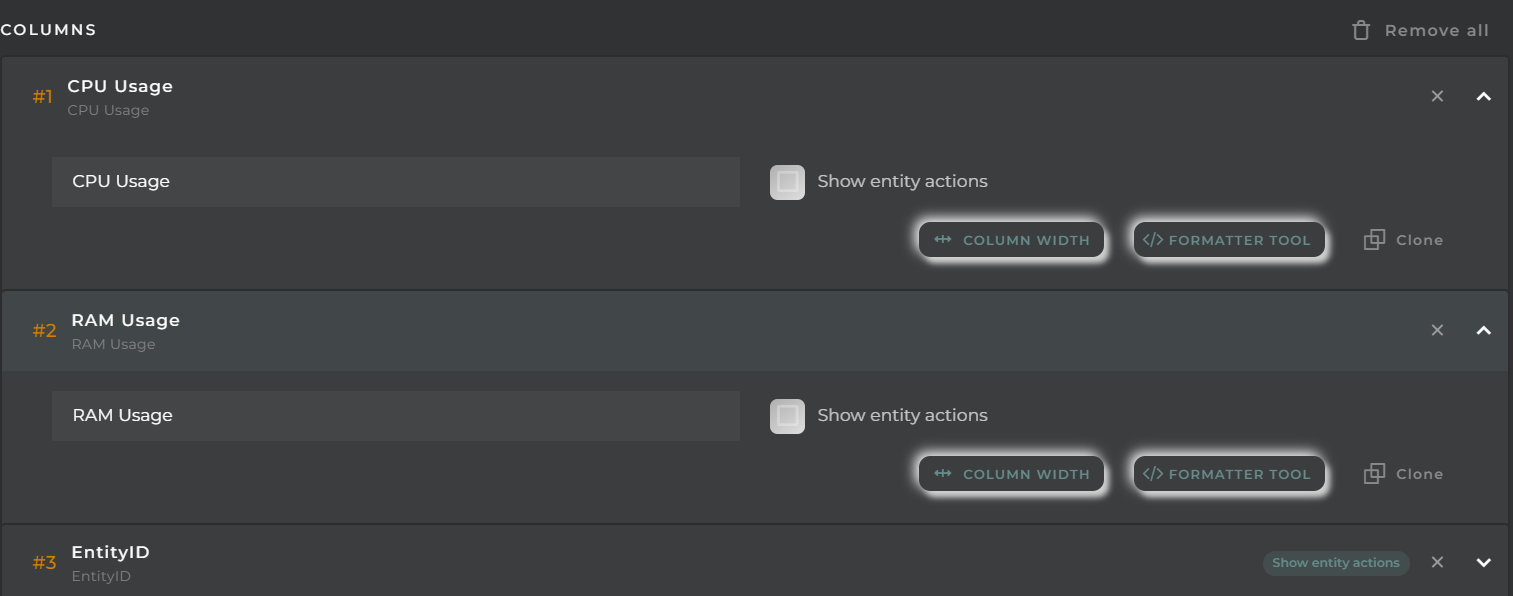


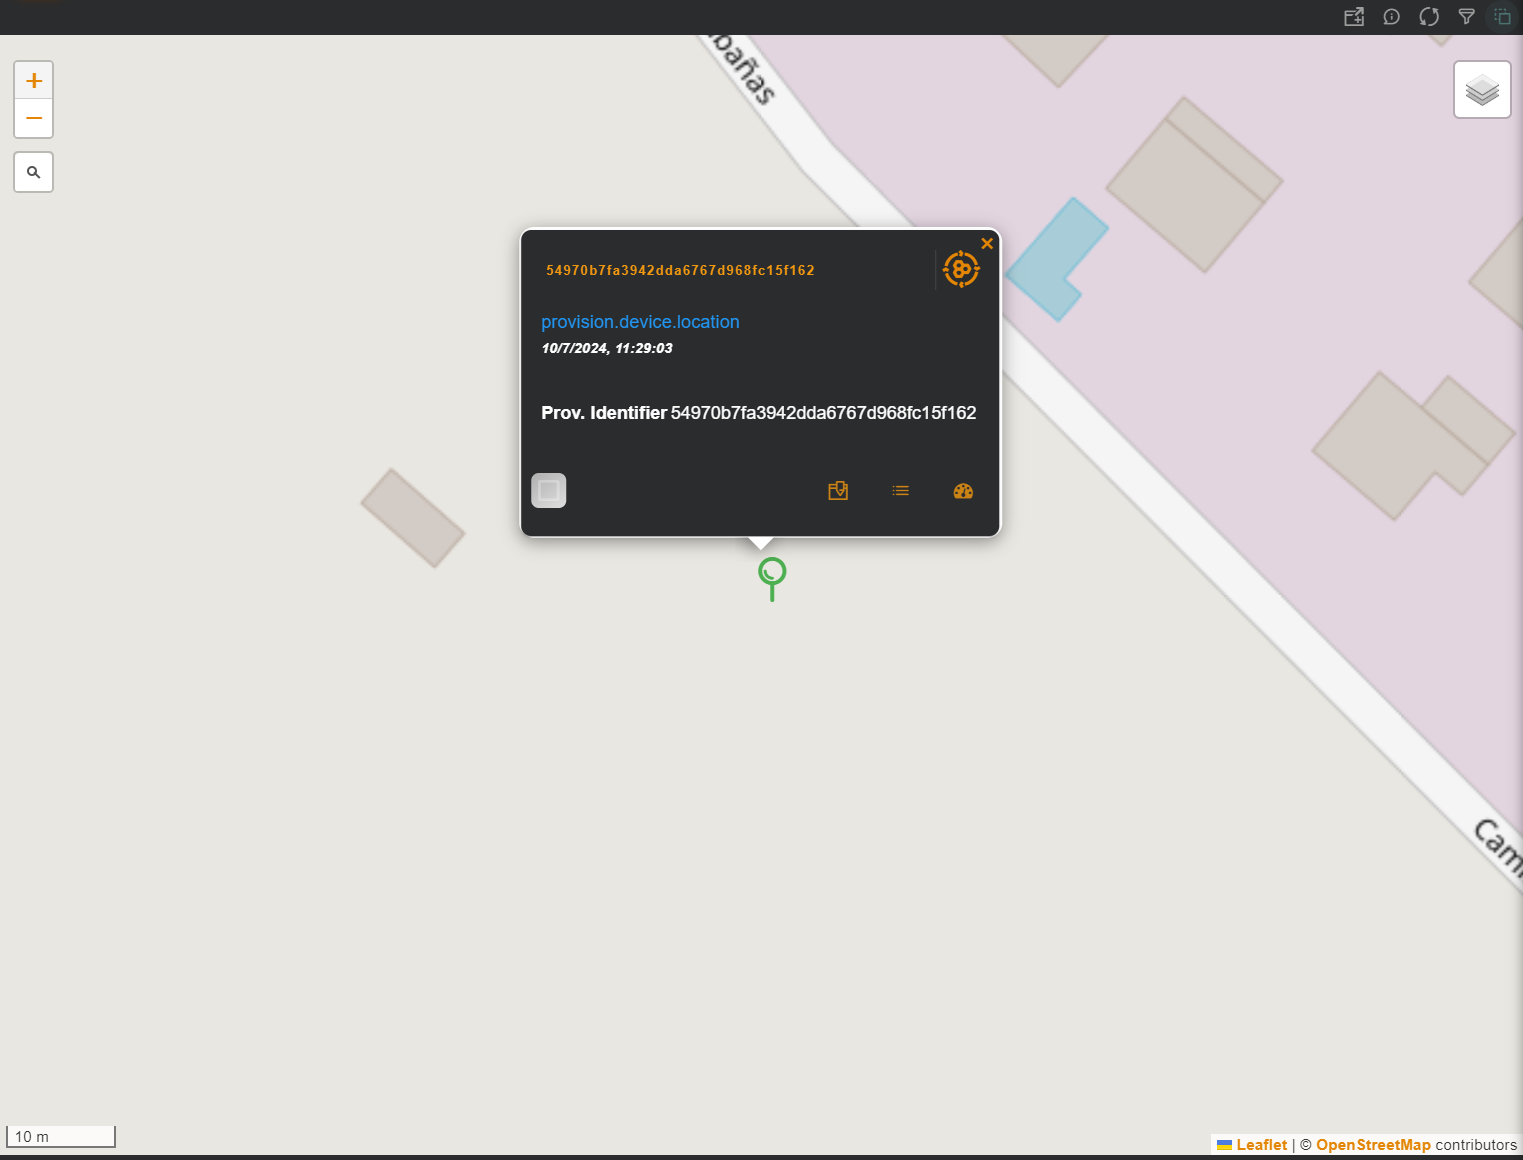
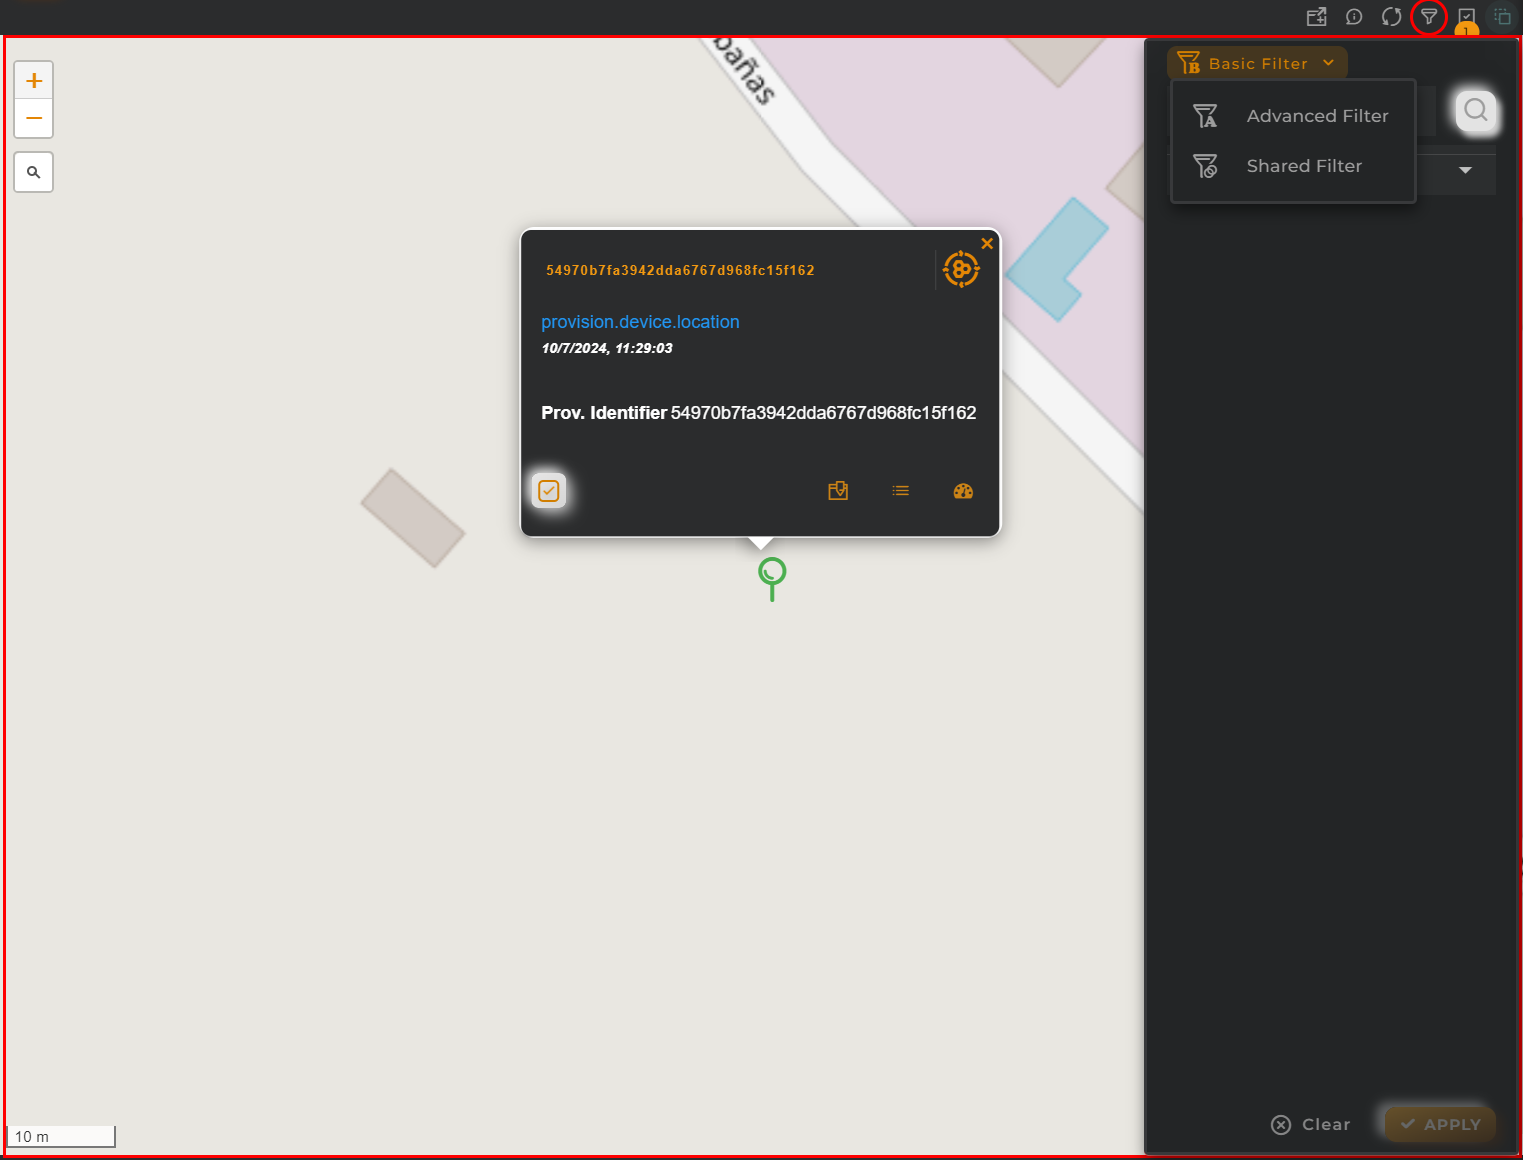
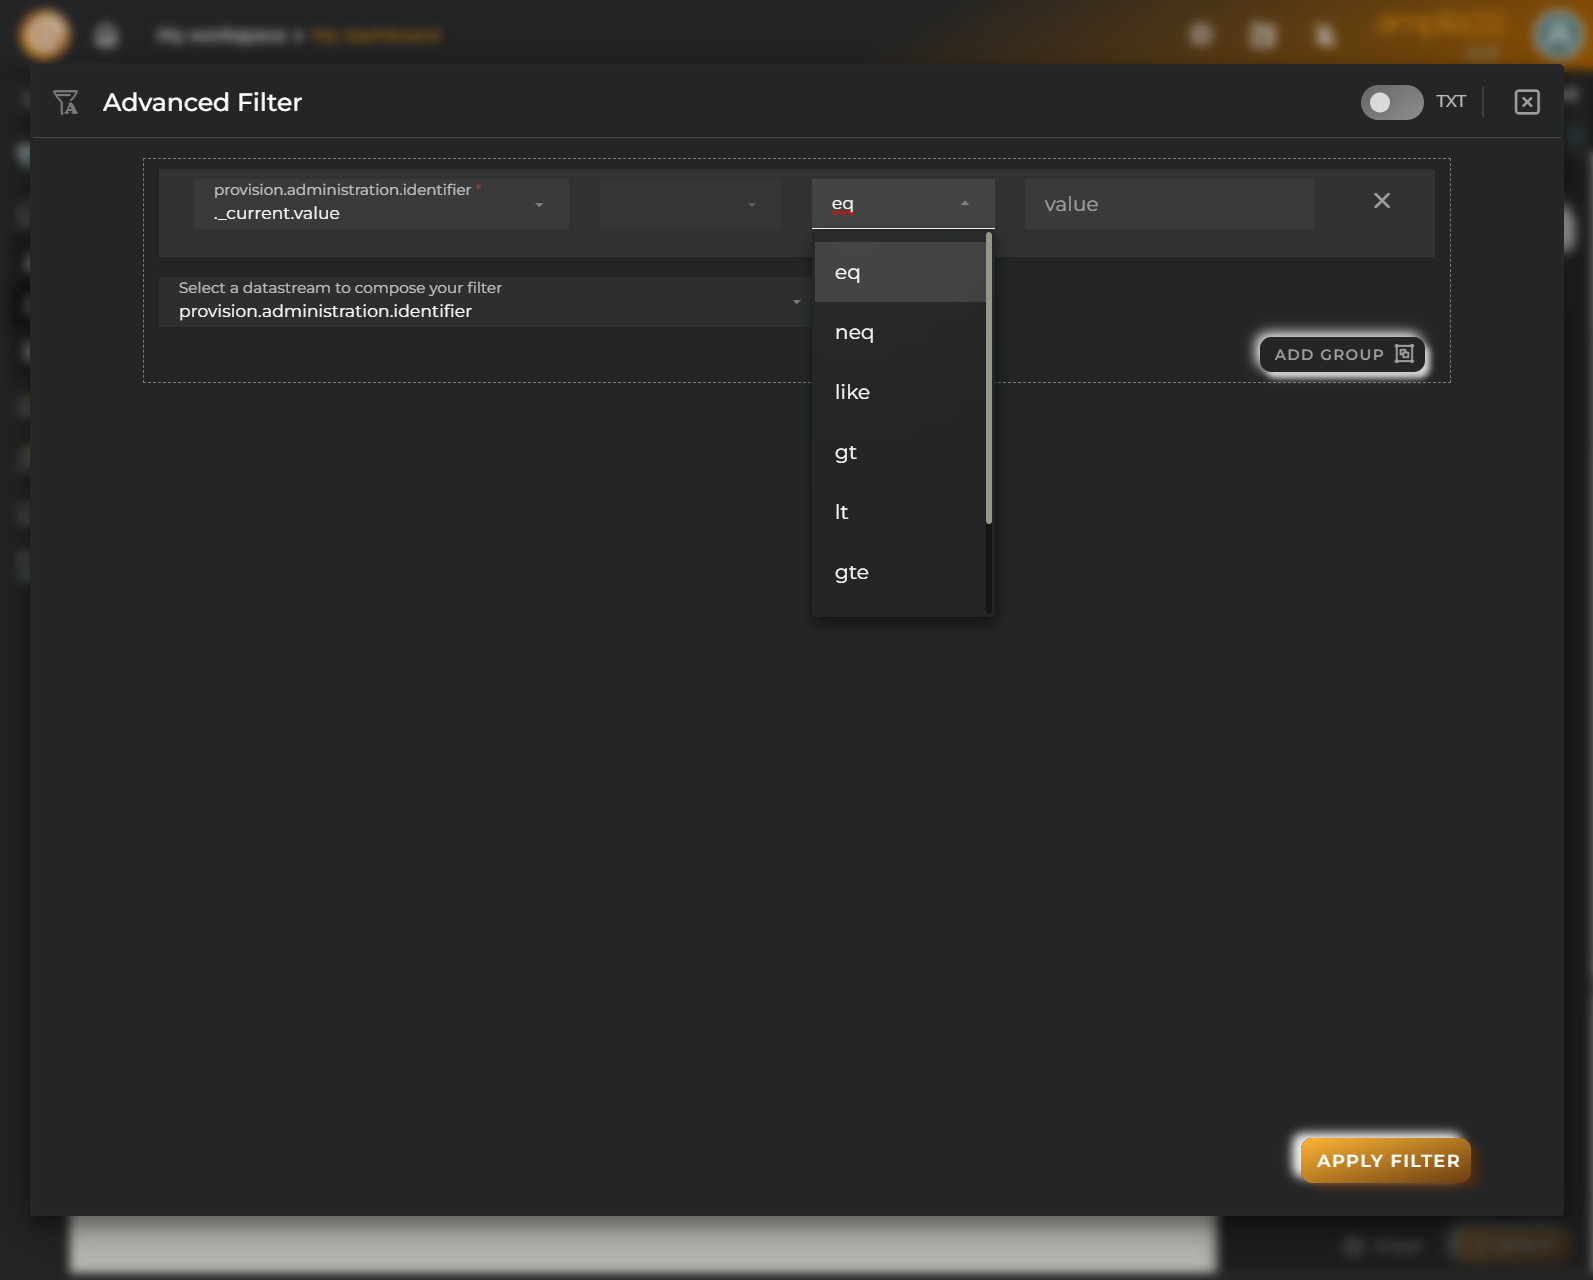
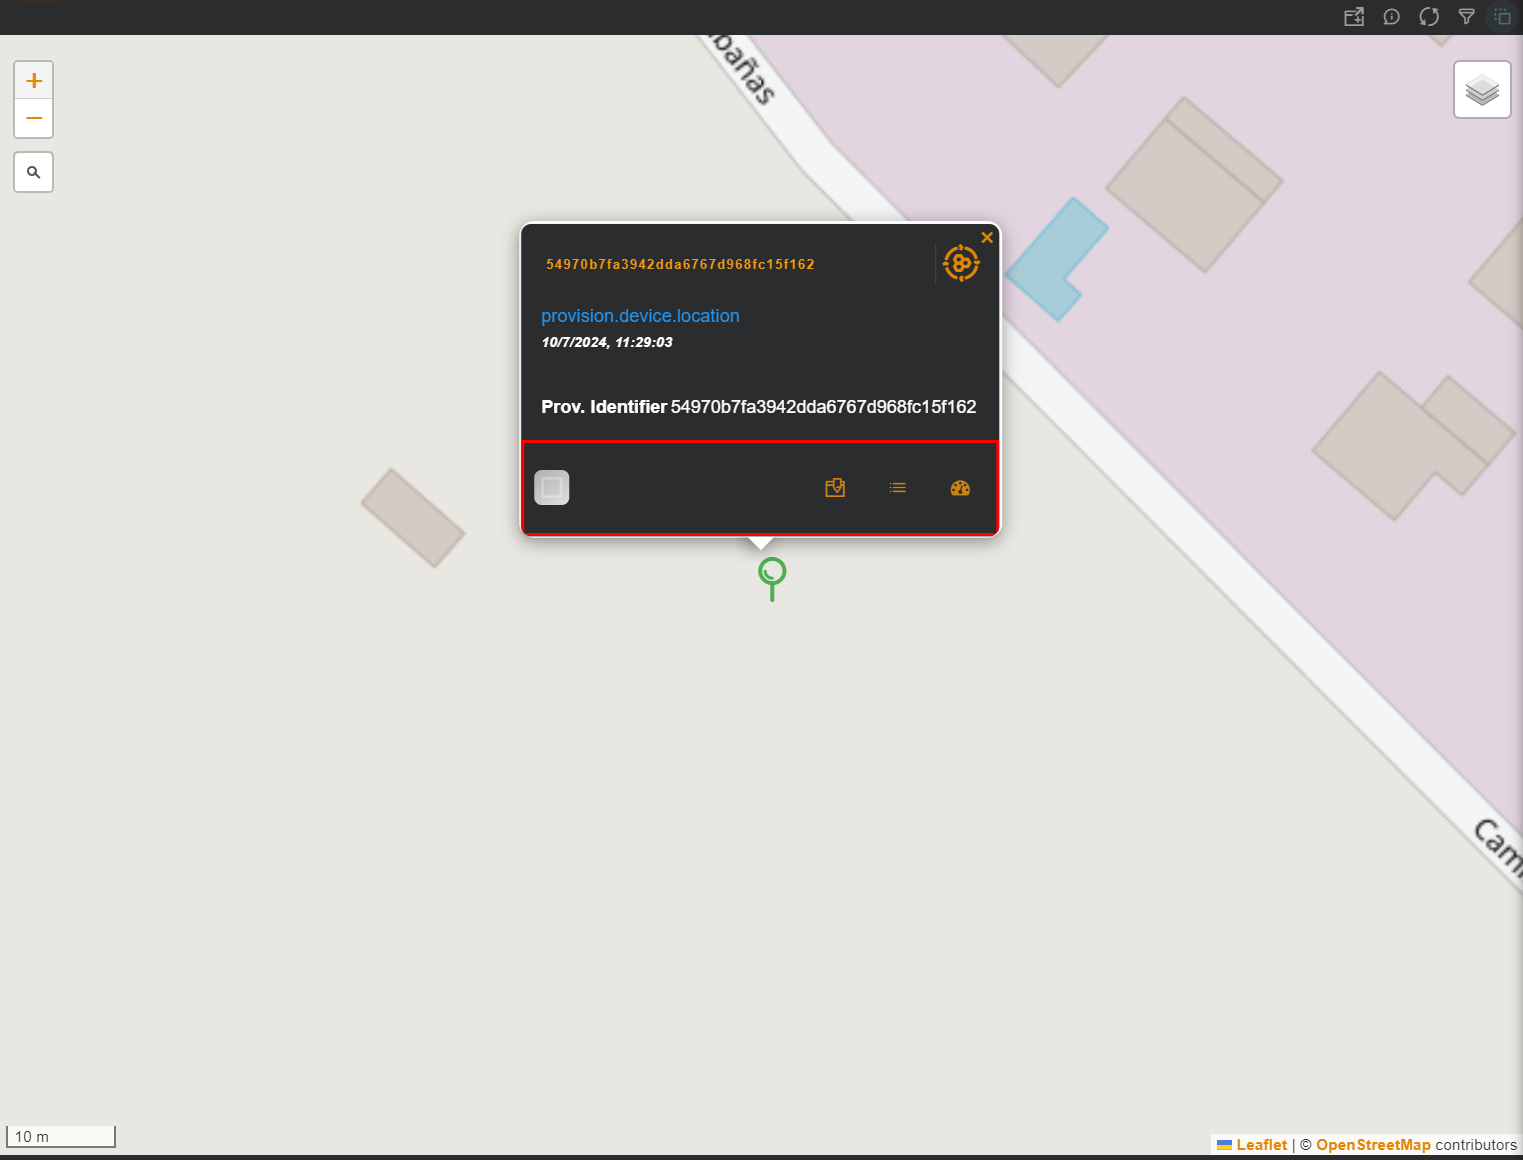
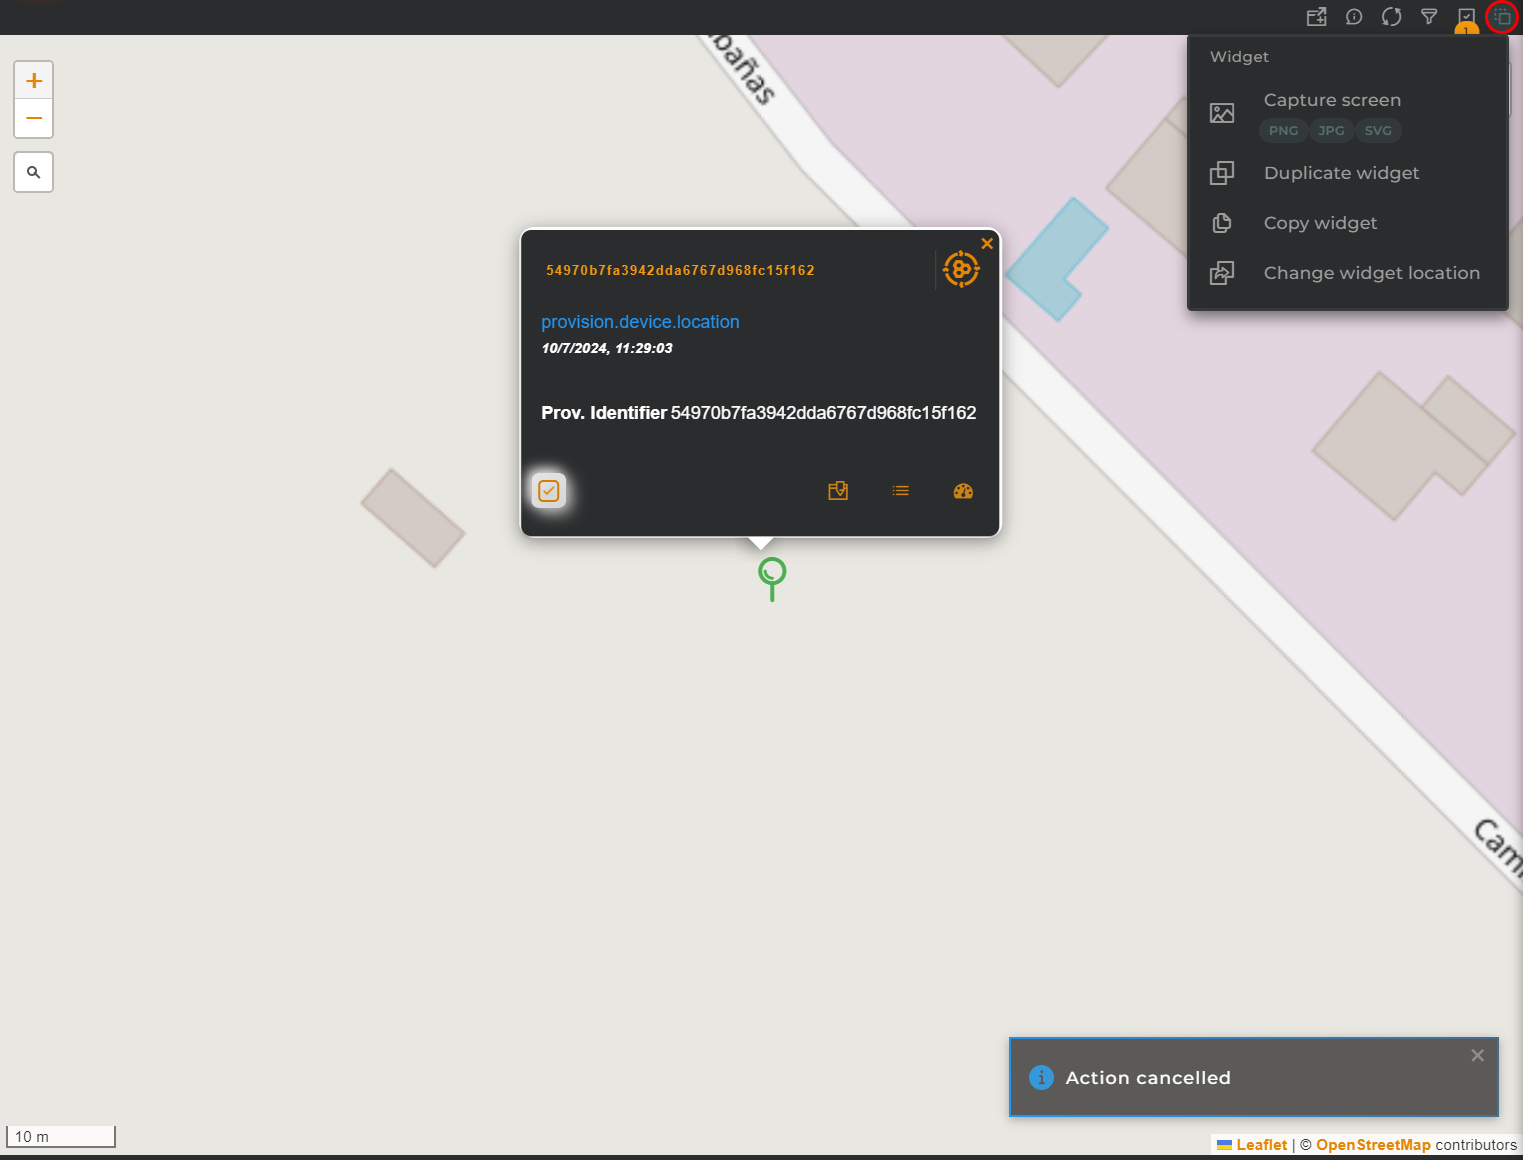
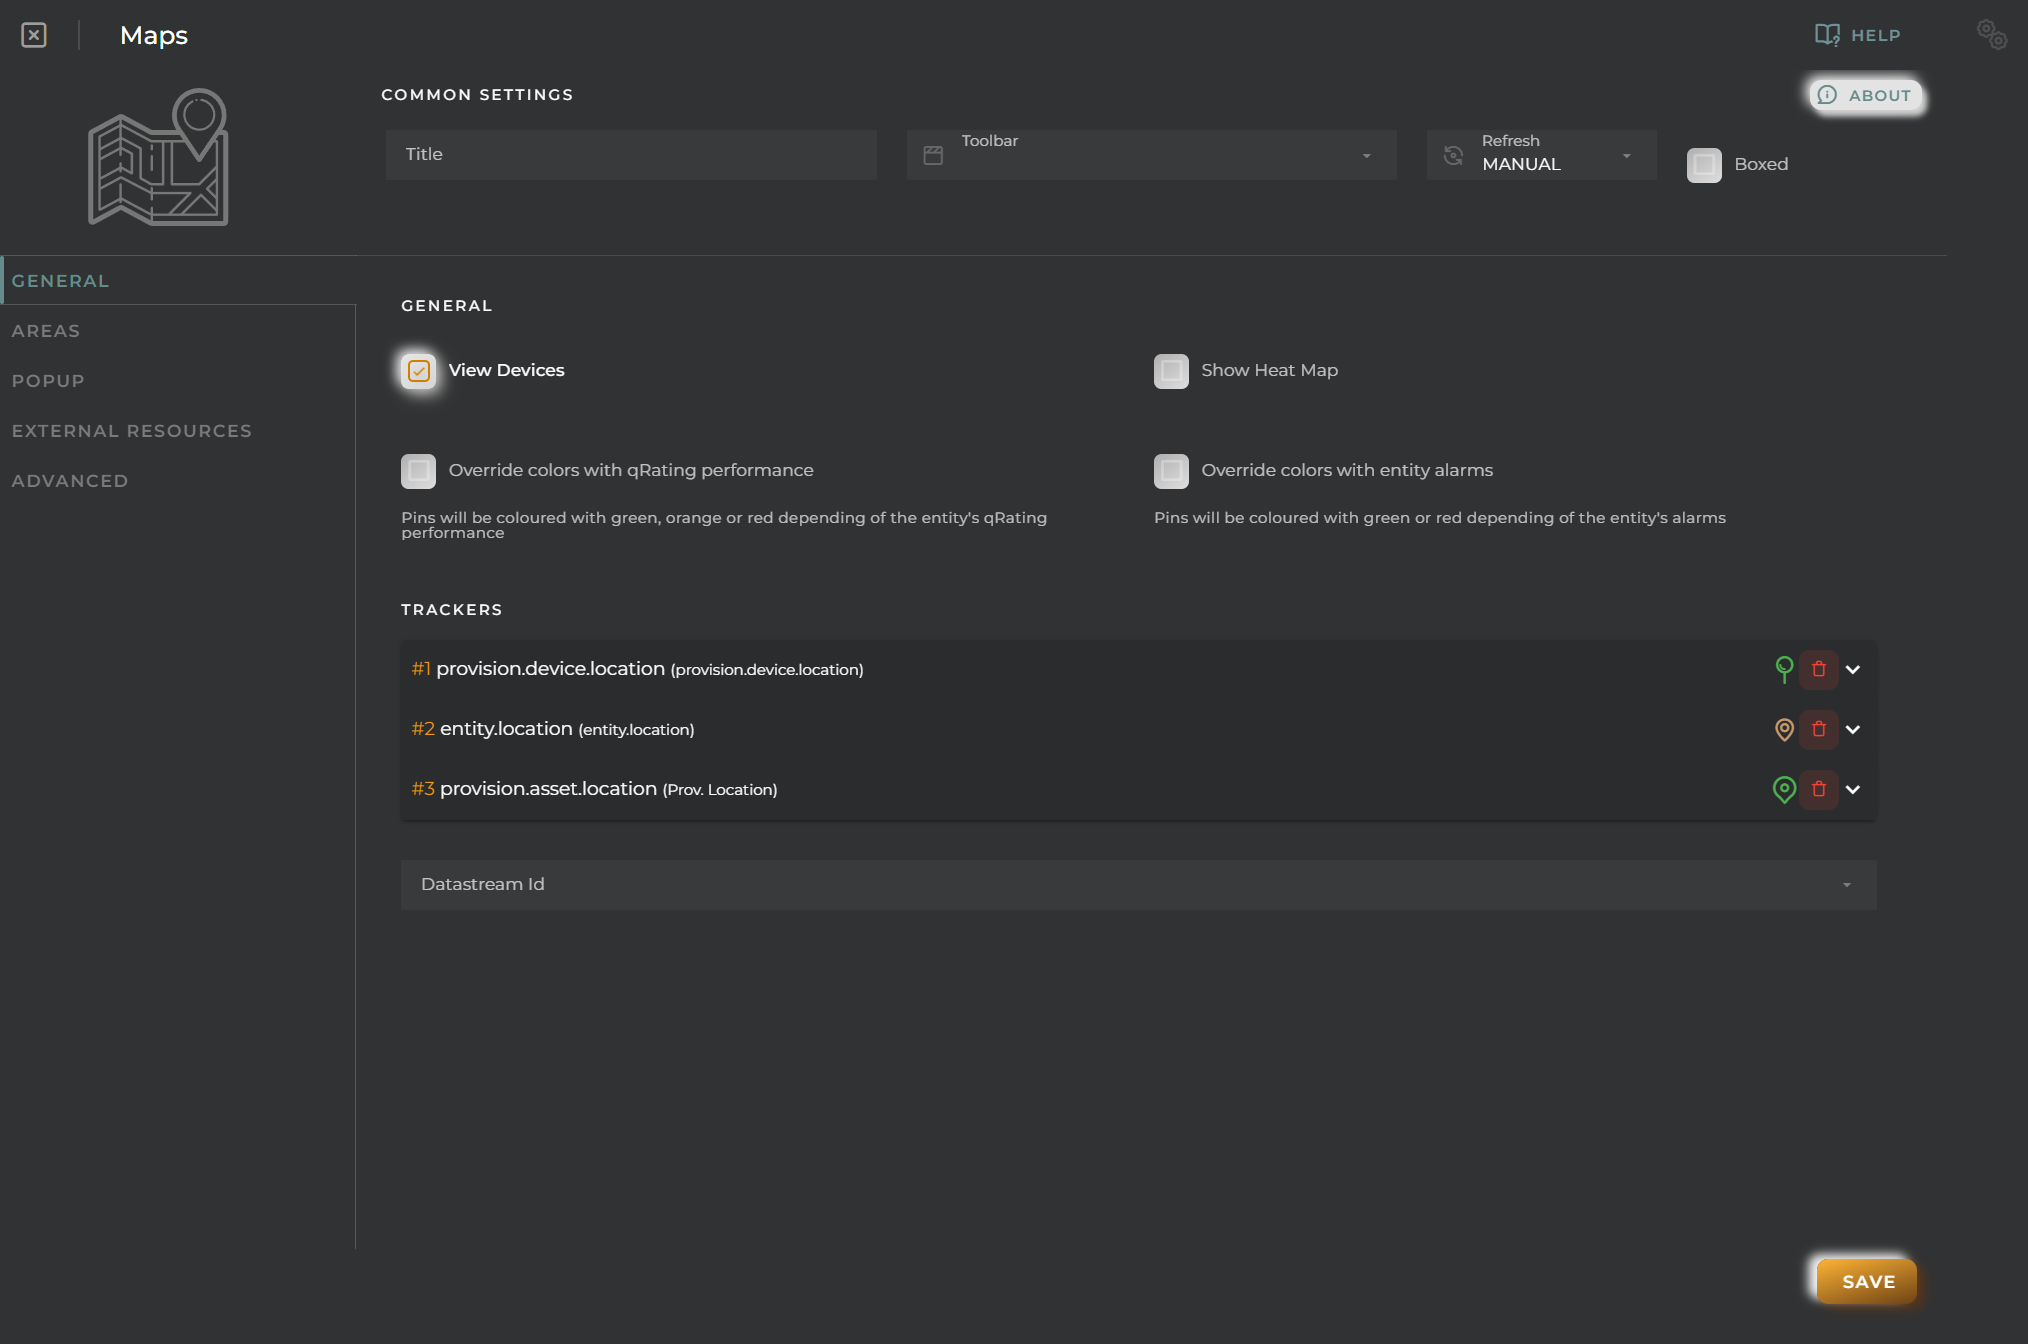
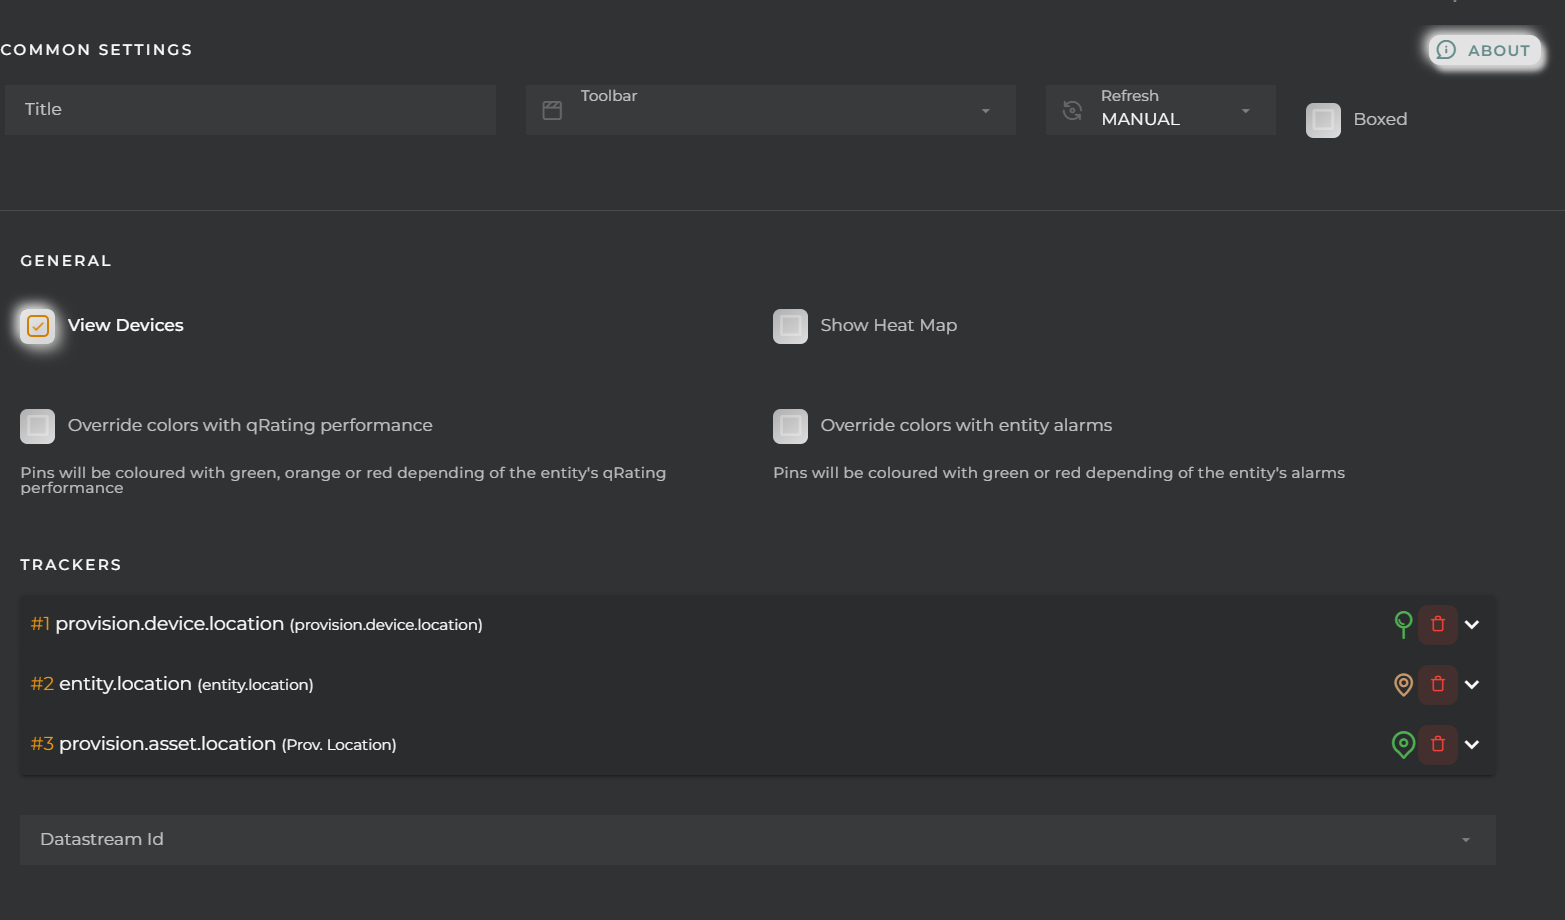
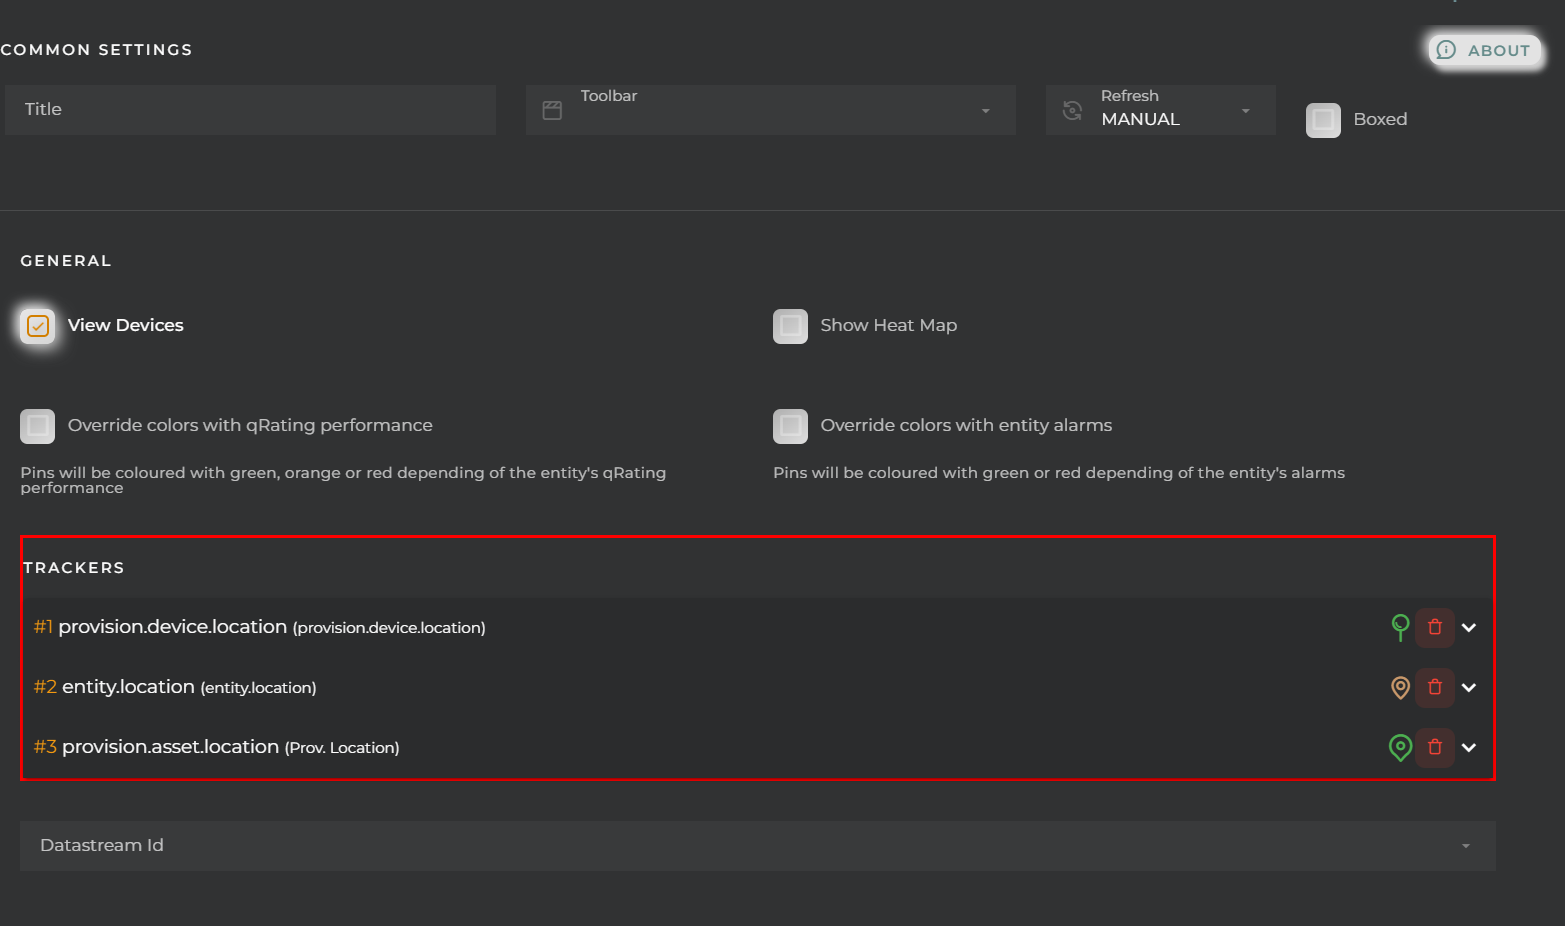 - alias: modification of the popup title for the pin - icon: pin icon - color: pin color - formatter: pin formatter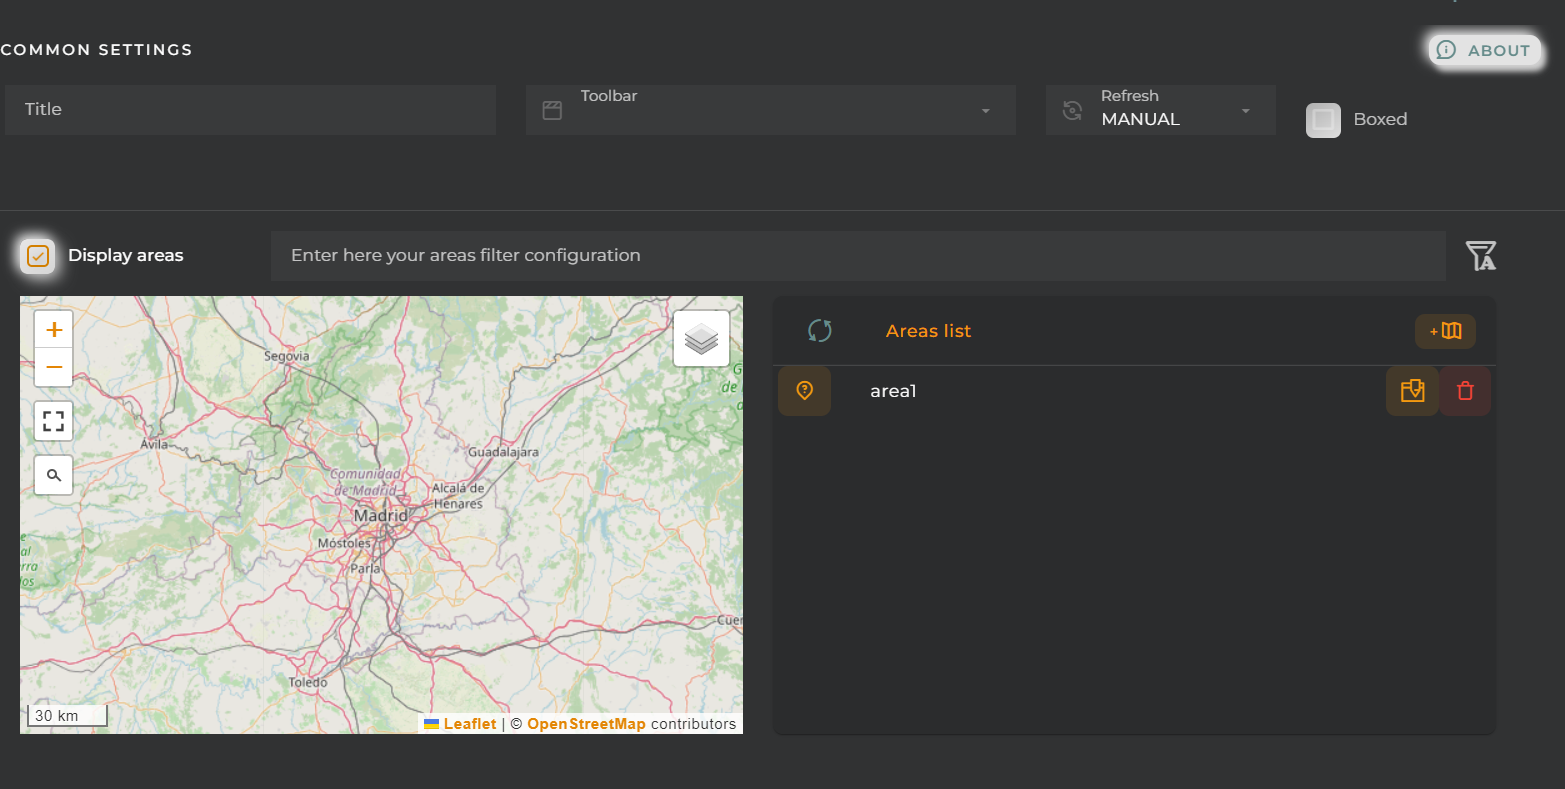
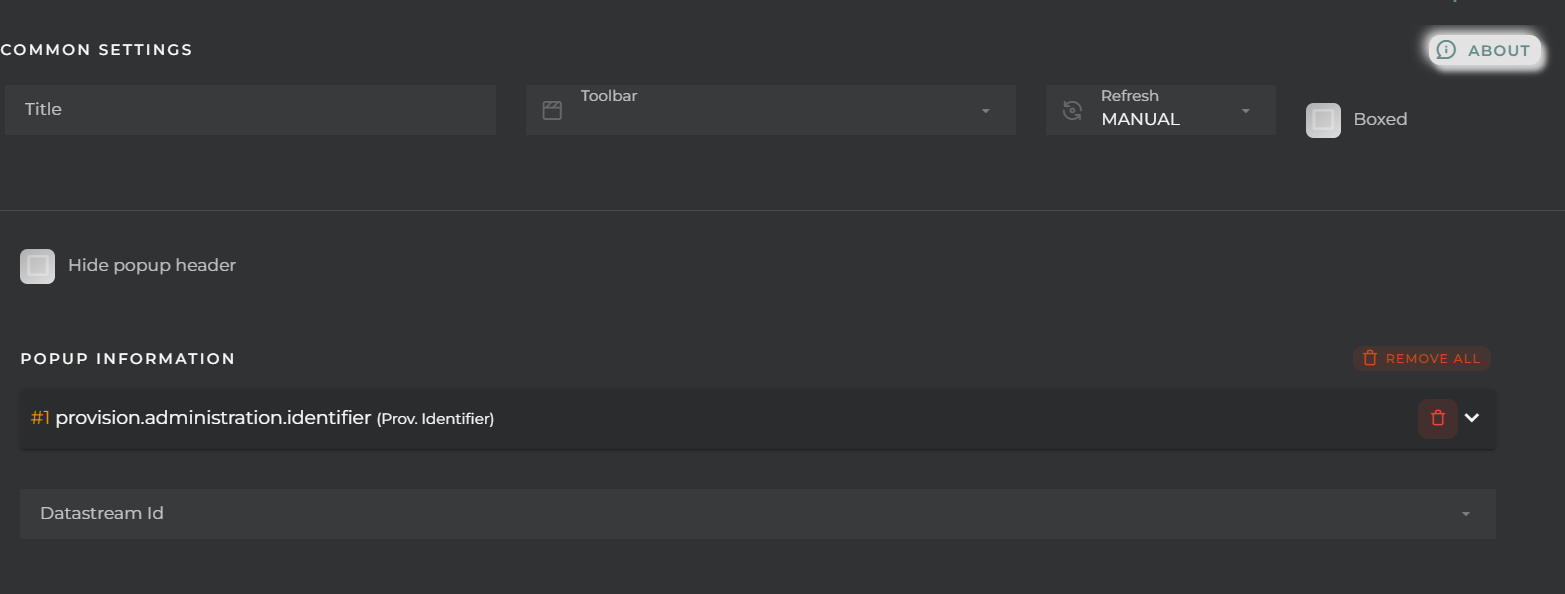
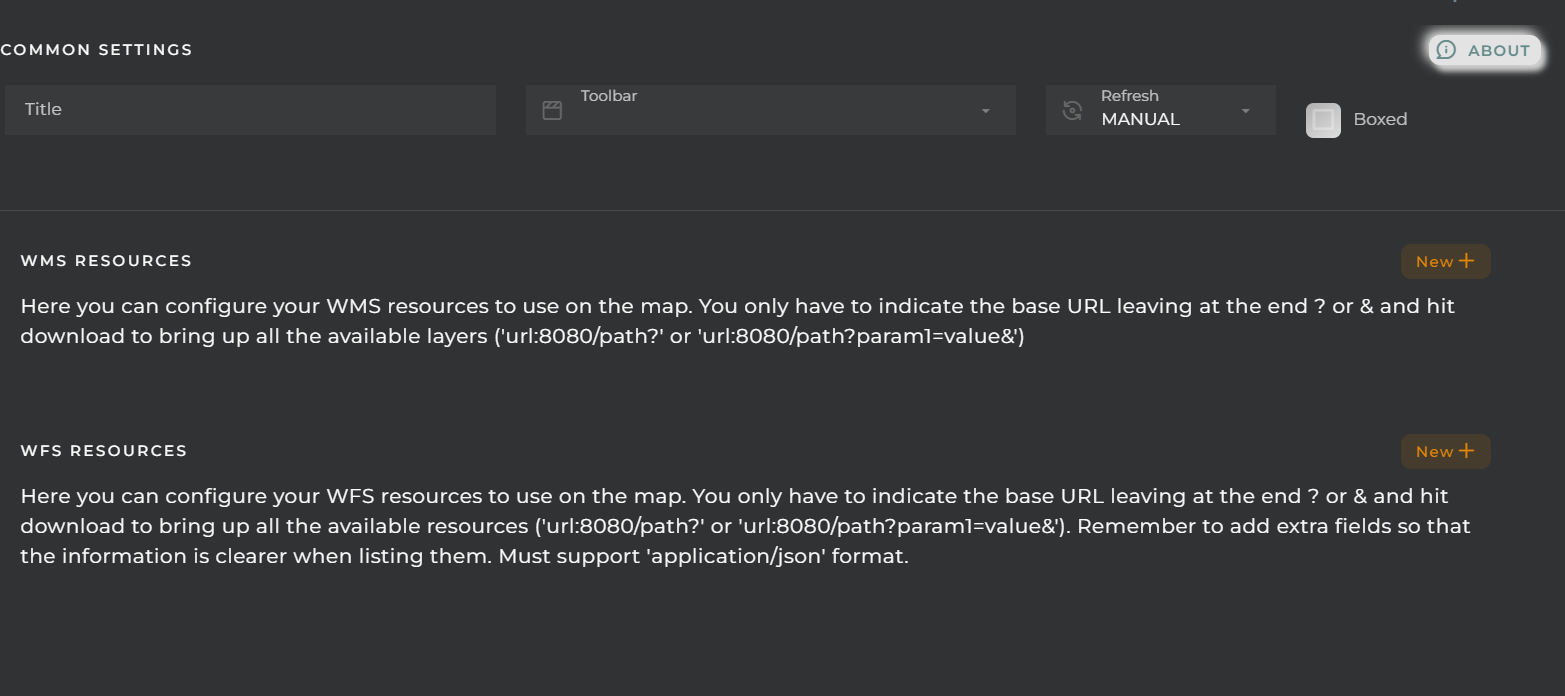
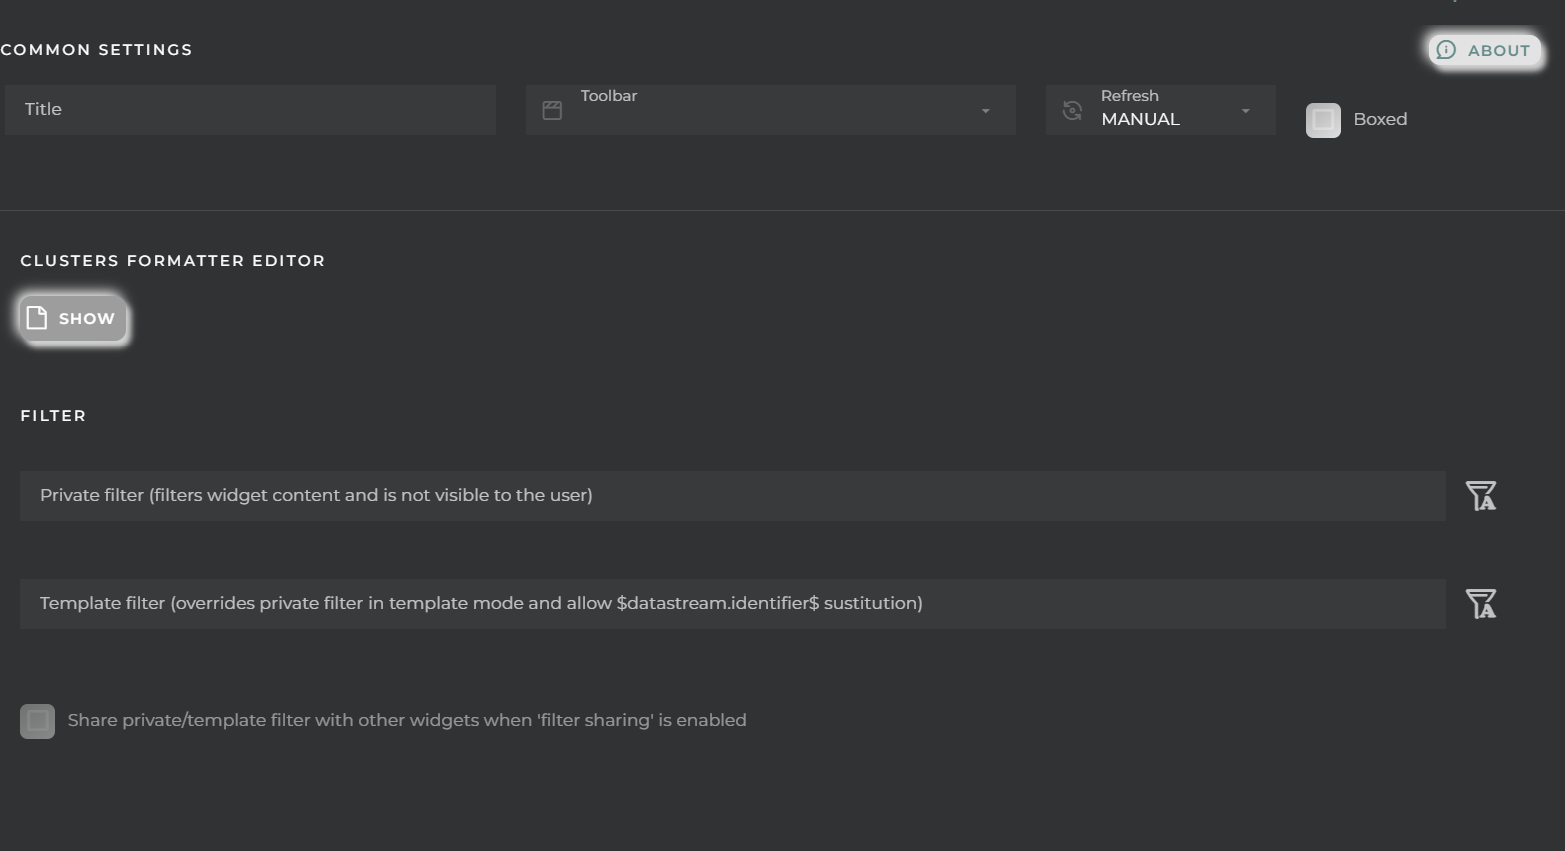


 - alias: modification of the title of the pin’s popup - color: color of the tracker - route simulation: route simulation